
Abstract
This article investigated the dimensionality, measurement invariance, and cross-cultural variations of social desirability. A total of 3,471 university students from 20 countries completed an adapted version of the Marlowe–Crowne scale. A two-dimensional structure was revealed in the pooled sample, distinguishing enhancement (endorsement of positive self-description) and denial (rejection of negative self-description). The factor structure was supported in most countries; medium-sized item bias was found in two denial items. In a multilevel analysis, we found that (a) there was more cross-cultural variation in denial than enhancement; (b) females tended to score higher on enhancement whereas males tended to score higher on denial; (c) the Human Development Index, an indicator of country socioeconomic development, was the best (negative) predictor of denial; and (d) both enhancement and denial seemed to be associated with country-level values and personality pertinent to “fitting in.” We conclude that social desirability has a positive and a negative impression management dimension that are meaningfully associated with country-level characteristics, and we argue that social desirability is better interpreted as culturally regulated response amplification.
Socially desirable responding (SDR) refers to the tendency of respondents to reply in a manner that will be viewed favorably by others (Paulhus, 1991). SDR can challenge the validity of psychological measures. Respondents high on SDR tend to respond according to how they think people in their immediate environment would like them to react, whereas the interpretation of psychological measures is based on responses that are not contaminated by SDR. In this line of thinking, SDR is a nuisance factor that should be minimized, through a careful research design or statistical corrections (e.g., Nederhof, 1985). In another interpretation, SDR is more about substance than style (Schwartz, Verkasalo, Antonovsky, & Sagiv, 1997); it is then considered part and parcel of the psychological makeup of individuals that reflects culturally preferred ways of communication associated with various other cultural characteristics (van Hemert, van de Vijver, Poortinga, & Georgas, 2002). Here, SDR reflects genuine individual and cultural differences, representing effective and truthful self-presentation. The accurate measurement of this construct is a prerequisite for resolving the nuisance versus substance interpretation of SDR (Leite & Beretvas, 2005). However, the steadily accumulating empirical evidence about probably the most widely used SDR instrument, the Marlowe–Crowne scale (Crowne & Marlowe, 1960), has not produced clear conclusions as to its dimensionality and cross-cultural equivalence (e.g., Li & Reb, 2009; Verardi et al., 2010). Not surprisingly, the debate of the nature of SDR is continuing and a clear psychological meaning of SDR has not been adequately established. In our view, cross-cultural evidence could help to examine the stability of its dimensionality and provide important information about the nuisance versus substance discussion. With a shortened and adapted version of the Marlowe–Crowne scale, the present study examines the factor structure of SDR across 20 countries and the associations of SDR with country-level characteristics.
Dimensionality of the Marlowe–Crowne Scale
Studies of SDR do not reveal the same number of factors, and different instruments yield very different factor structures (Paulhus, 2002). The Marlowe–Crowne scale, consisting of 33 descriptions of highly desirable but rare and highly undesirable but common behaviors, measures respondents’ tendency to present themselves in a positive light (Crowne & Marlowe, 1960). Initially conceptualized as unidimensional (Crowne & Marlowe, 1964), this scale has been suggested to be multidimensional, although there is no convergence on the number of factors (Barger, 2002; Loo & Loewen, 2004). For instance, Verardi et al. (2010) administered a shortened version of this scale in eight African countries and Switzerland, where they distinguished achievement and international relationship; neither scale reached scalar invariance.
Millham (1974) and Ramanaiah, Schill, and Leung (1977) found a two-dimensional structure of the Marlowe–Crowne scale: enhancement (i.e., the tendency to attribute socially desirable characteristics to oneself) and denial (i.e., the tendency to deny undesirable characteristics). Such a distinction is in line with the two basic self-presentation motives: looking good and avoiding looking bad (Schütz, 1998). The two dimensions were found to have differential validity in predicting scales in the Minnesota Multiphasic Personality Inventory. According to Paulhus (1991) and Ventimiglia and MacDonald (2012), the Marlowe–Crowne scale taps mainly impression management. Using the Balanced Inventory of Desirable Responding, an alternative two-dimensional structure of SDR was proposed by Paulhus (1984). He differentiated impression management (i.e., deliberate self-presentation to an audience) and self-deception (i.e., favorably biased but honestly held self-descriptions). The validity and utility of these two dimensions are not always supported in cross-cultural contexts (e.g., Helmes & Holden, 2003; Li & Bagger, 2006). Moreover, Paulhus and Reid (1991) reported that the distinction between enhancement and denial was more salient than that between impression management and self-deception.
Individual- and Country-Level Variations of SDR
At the individual level, education and socioeconomic status have been found to be negatively related to SDR (e.g., Uziel, 2010). Both males and females have the tendency to attribute socially desirable characteristics to themselves (Press & Townsley, 1998), with females often reporting higher SDR than males (Barger, 2002). There were no gender differences found in subdimensions of SDR such as enhancement and denial (Ramanaiah et al., 1977). Given the inconclusive findings regarding gender, we do not specify a directional hypothesis about gender differences but explore these across cultural contexts.
Response styles in general have been found to be related to cultural values and personality traits (e.g., He, Bartram, Inceoglu, & van de Vijver, 2014; Smith, 2004). Lalwani, Shavitt, and Johnson (2006) reported that impression management, the main dimension tapped by the Marlowe–Crowne scale, was higher among collectivists than individualists. Schwartz et al. (1997) found a similar positive association between SDR and value types emphasizing social harmony in Finland and Israel. Trimble (1997) reported a positive association of SDR with intrinsic religiosity. Musek (2007) argued that SDR was positively related to the general factor of personality, a combination of the Big Five traits. At the country level, SDR was reported to be negatively associated with country affluence and individualism (Johnson & van de Vijver, 2003). Van Hemert et al. (2002) studied the Lie Scale from the Eysenck Personality Questionnaire (which is traditionally associated with SDR) in a cross-cultural meta-analysis, in which they confirmed the associations of the Lie Scale with affluence and individualism, and they reported a positive association with embeddedness measured with the Schwartz Value Survey. They also found a positive correlation with emotional stability and a negative one with extroversion at the country level. If SDR indeed reflects valid individual and cultural differences, we expect that the aggregated values, beliefs, and personality traits shared by individuals in each country are associated with SDR at the country level.
The Present Study
It has been argued that it is difficult, if not impossible, to find scalar invariance of SDR across cultures (e.g., Smith, 2009), given that what is considered desirable varies from culture to culture. Comparing students from Singapore and the United States, Li and Reb (2009) found weak support for the cross-cultural invariance of SDR in a multigroup confirmatory factor analysis; a similar conclusion was reached in a nine-country study (Verardi et al., 2010). With large-scale cross-cultural data, it is common to find nonequivalence, and the underlying reasons are often unclear (Byrne & van de Vijver, 2010). It could be due to misspecification of the constructs in a few countries, accumulated small (even inconsequential) differences in parameters, or a combination of both. Some researchers argue that measurement invariance constraints in multigroup confirmatory factor analysis (i.e., invariance of loadings and intercepts) may be overly restrictive and that we need to allow for psychologically inconsequential variation in these parameters, as done in Bayesian Structural Equation Modeling (Muthen & Asparouhov, 2012). We wanted to avoid these fit problems and did not want to use Bayesian Structural Equation Modeling given the lack of experience with its usage in empirical projects. Therefore, we resorted to an exploratory factor analysis approach (Costello & Osborne, 2005; Helmes & Holden, 2003) to study the factor structure of SDR with an adapted scale. The equivalence of the structure in different cultures was checked by means of calculations of Tucker’s phi which is the congruence index of two sets of factor solutions (van de Vijver & Leung, 1997), followed by a differential item functioning (DIF) analysis to tease out items not suitable for cross-cultural comparisons.
We reasoned that one cause for the poor replicability of the factor structure of the Marlowe–Crowne scale is ambiguity in some items and potential inapplicability of some items in different cultures or with different populations. For instance, the original item “I never make a long trip without checking the safety of my car” does not apply to most people in less developed countries or to university students who do not own a car. Moreover, the wording in some items is redundant and outdated (e.g., “I don’t find it particularly difficult to get along with loud mouthed, obnoxious people”), which poses challenges in precise translation to other languages. Given that some original items had limited discriminatory ability, various shortened versions of this scale have been proposed and validated (e.g., Reynolds, 1982; Strahan & Gerbasi, 1972). Similar to these previous studies, we used shortened and adapted items in the present study. Moreover, we aimed at maximizing cross-cultural comparability by adapting items.
Finally, to better understand the underlying mechanism of SDR, we studied the individual- and country-level correlates of SDR measured with this adapted scale in a multilevel design, taking into consideration data dependency at both levels. Specifically, we explored gender differences of SDR in the cross-cultural contexts and replicated and extended the study of the effects of country affluence, values, beliefs and personality traits on individual SDR.
Method
Participants
Participants were 3,471 university students with an age range of 17 to 35 in 20 countries. The mean age of these participants was 21.59 years (SD = 3.38). Thirty-one percent of the respondents were males. The sample size per country ranged from 95 to 389. The demographics are presented in Table 1.
Demographics of the Participants.
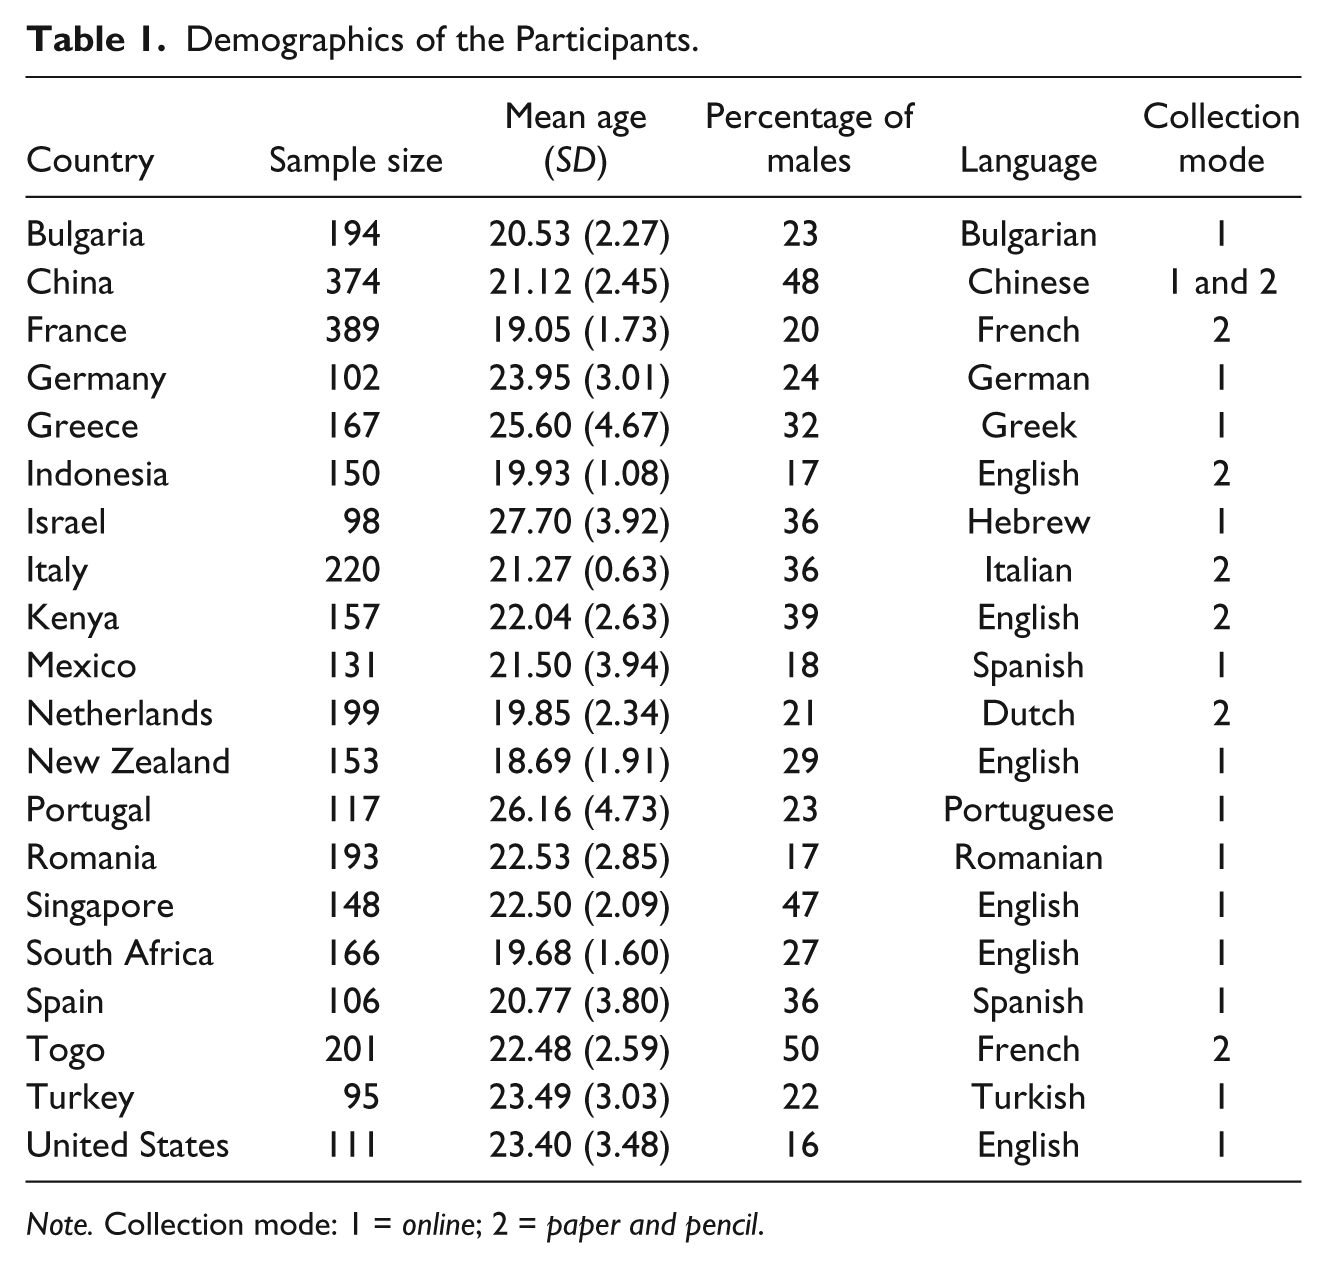
Note. Collection mode: 1 = online; 2 = paper and pencil.
Measures
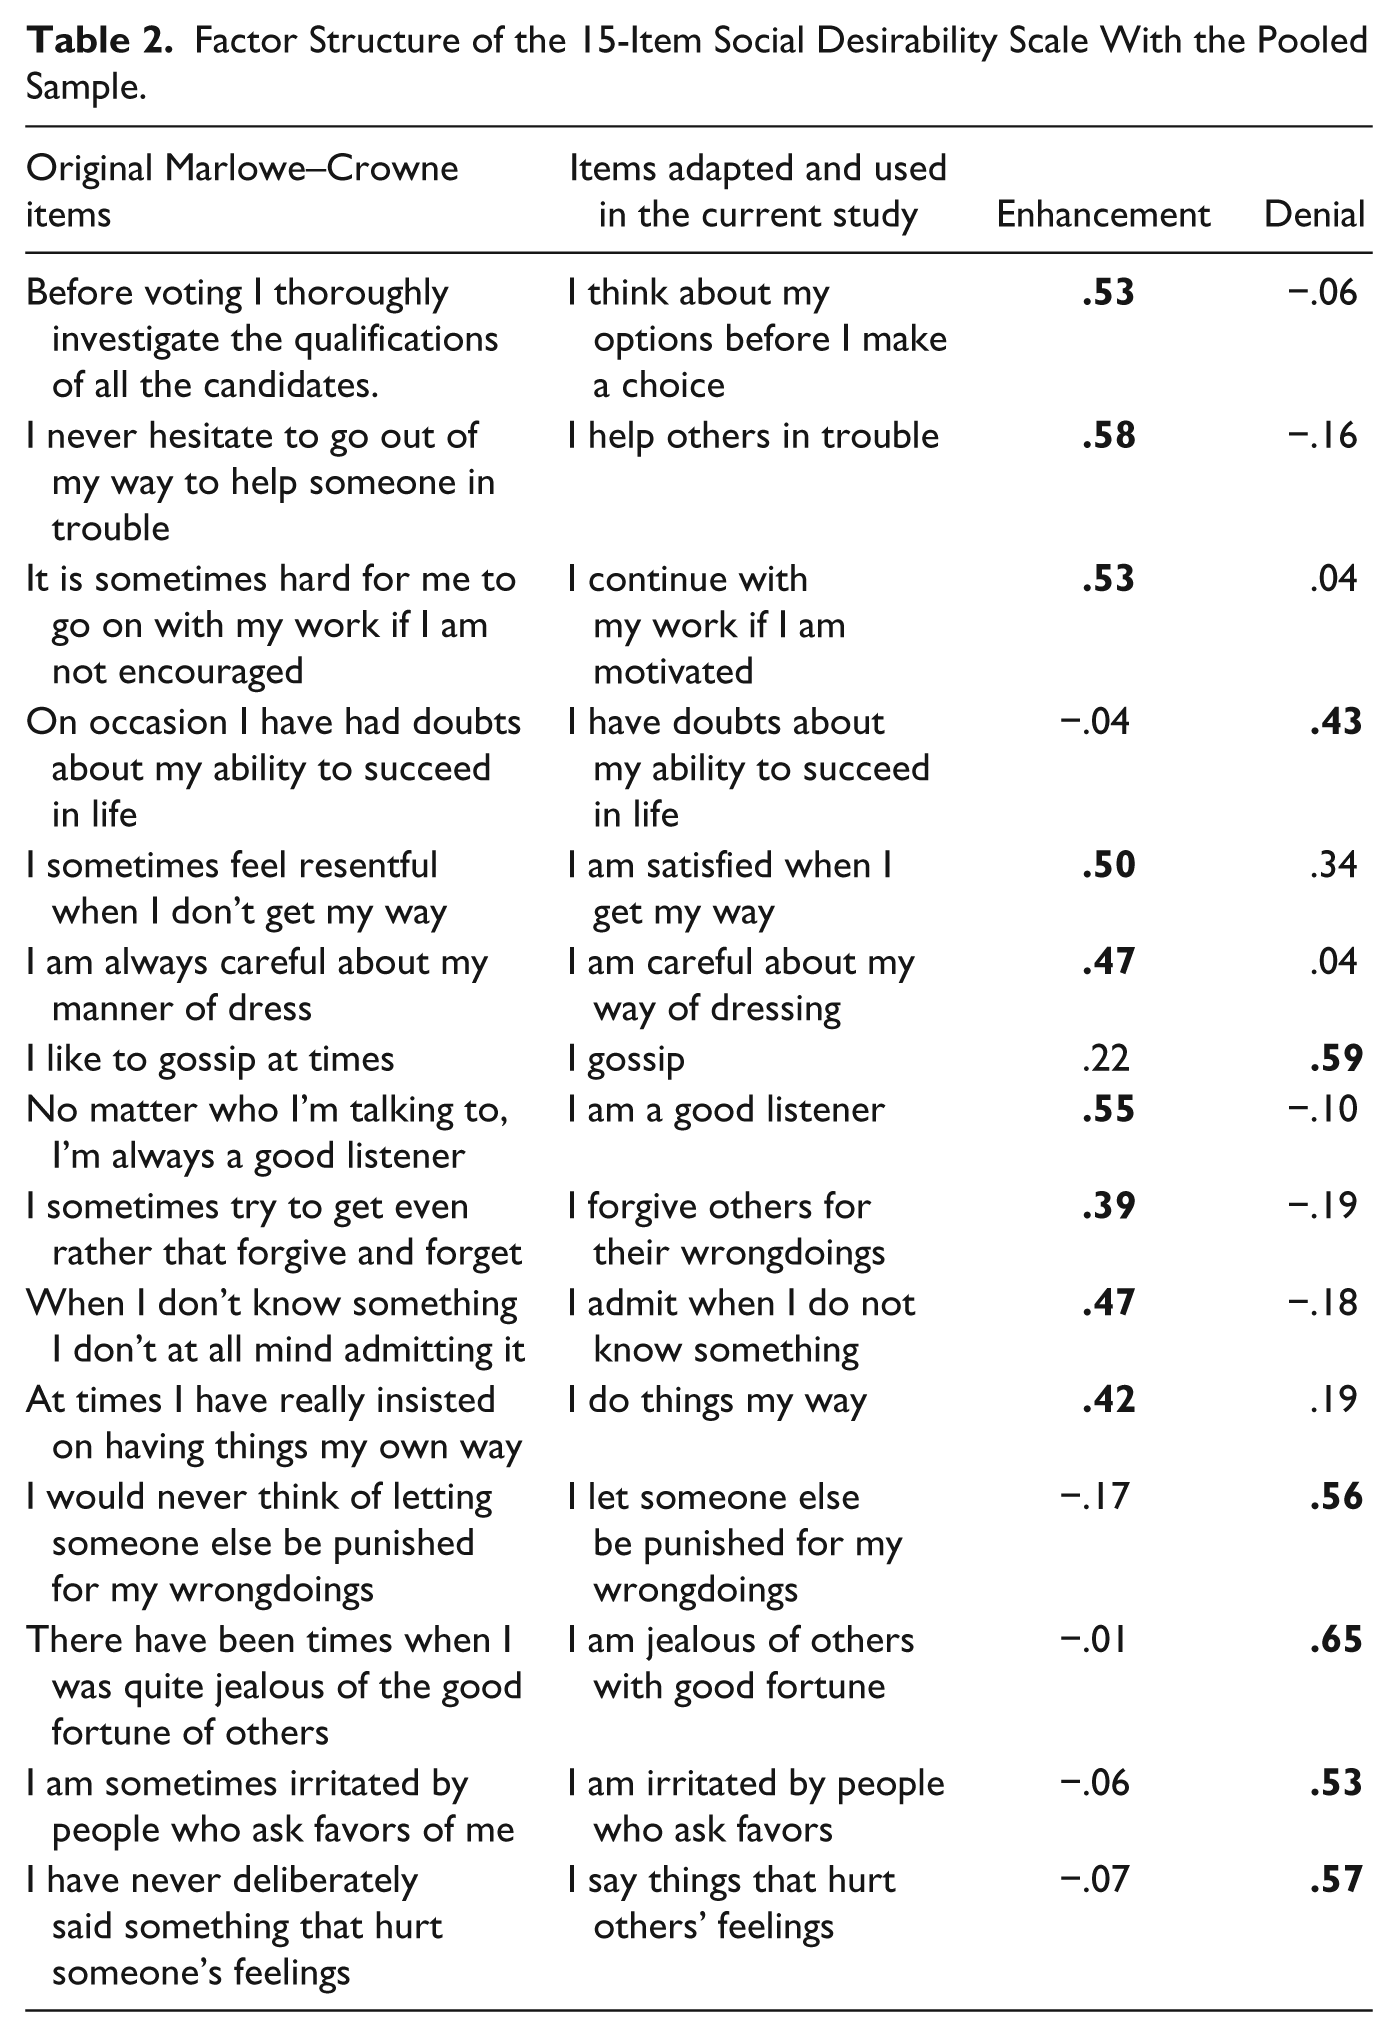
The social desirability scale used in the present study was a shortened and simplified version of the Marlowe–Crowne scale. We selected items from the original scale with two criteria: Items should not have ambiguous meaning and items should be appropriate in different cultural contexts. In addition, we simplified the original items to improve the cross-cultural comparability with translated versions. For instance, the original item “there has been times when I was quite jealous of the good fortune of others” was rephrased as “I am jealous of others with good fortune.” There were 15 items in total, of which 9 items were worded as desirable attributes or behaviors (e.g., “I help others in trouble”), and 6 items were worded as undesirable attributes or behaviors (e.g., “I gossip”). All items were formulated affirmatively to avoid artifacts from using negation (item keying). The wording comparison of the original items and the adapted items is presented in Table 2.
Factor Structure of the 15-Item Social Desirability Scale With the Pooled Sample.
To obtain sufficient psychometric details and allow more nuances in responses to this shortened scale, a 5-point Likert-type response format ranging from 1 = strongly disagree to 5 = strongly agree was used. The original dichotomized (i.e., true vs. false) and the Likert-type scale responses to the Marlowe–Crowne scale have been shown to be comparable (Domínguez Espinosa, Salas Menotti, & Reyes-Lagunes, 2008), and support was found that a shortened version with the Likert- type scale format did not result in substantial loss of information (Thunholm, 2001). Participants also provided demographic information such as their age and gender.
Country affluence was measured by the Human Development Index (HDI). The HDI is a composite measure of the average achievements in a country in three basic dimensions of human development: a long and healthy life, access to knowledge, and a high standard of living; it has a score range from 0 to 1, with a higher value indicating a higher level of development (United Nations, 2012). Data for all 20 countries were available (denoted as N = 20).
Scores of country values, beliefs, and personality were extracted from various large-scale international studies. Scores of Hofstede’s four cultural value dimensions (N = 17), measured from working adults, were taken from Hofstede (2009). Scores of Schwartz’s seven culture-level value dimensions (N = 17), measured from teachers and students, were taken from Schwartz (2009). The five belief dimensions in Social Axioms (N = 15) with students samples from Leung and Bond (2004) were also included. Scores of Agreeableness, Conscientiousness, Emotion Stability, Extroversion, and Openness (N = 13) were taken from the Big Five Inventory (Schmitt, Allik, McCrae, & Benet-Martínez, 2007). The respondents were mainly university students and in a few countries community-based samples.
Procedures
Administration procedures varied across countries. For countries where English is not the native language, the scale was translated, checked, and administered in the native language. In China, Mexico, and Singapore, the scale was administered on its own; in France, Togo, and the Unites States, the scale was administered as part of a bigger study on education and career development; in all the other countries, the scale was administered as part of a bigger study on youth identity and well-being. In France, Indonesia, Italy, Kenya, the Netherlands, Togo, and the United States, data were collected with paper and pencil, whereas in the other countries an online survey was administered. In China, both data collection modes were used: 274 respondents filled out the survey online and 100 with paper and pencil. The participation of all the students was voluntary.
Results
We describe the findings in three parts. First, we report the cross-cultural equivalence of the social desirability scale between the two data collection modes (within the Chinese sample). Second, we describe the cross-cultural equivalence and the item bias across countries. Finally, we report the multilevel analysis of SDR addressing the effects of gender and country characteristics.
Mode Effects
To account for possible administration bias caused by different data collection modes (Dwight & Feigelson, 2000), we first compared the factor structure and item means of the scale between the online survey and the paper-and-pencil sample within China. Principal component analysis with direct Oblimin rotation in either sample supported a two-factor solution: with all the positively worded items loading on the first factor (i.e., enhancement) and all the negatively worded items on the second factor (i.e., denial). Structural equivalence was evaluated with Tucker’s phi (above .90 as acceptable and above .95 as excellent; van de Vijver & Leung, 1997). The values of Tucker’s phi for the two factors were 1.00 and 1.00 across modes, pointing to excellent structure invariance. Independent sample t tests on the 15 items between the collection modes showed no significant mean differences at p < .01. We then computed a DIF analysis using a multiple regression approach. Each enhancement item was predicted with the total score on the enhancement factor, administration mode, and the interaction of the scale score and the administration mode, and each denial item was predicted with the total score on the denial factor, administration mode, and their interaction. The effect of the administration mode indicated uniform bias and that of the interactions indicated non-uniform bias, both of which were evaluated by Cohen’s f2 when adding each predictor in multiple regressions (Cohen, 1988). Items with f2 values larger than .15 (lower bound of medium effect size) were flagged as having non-negligible DIF. In the current analysis, no items were found to display a medium or large effect size; the values of Cohen’s f2 ranged from 0 to .01. To summarize, the results indicated that the social desirability data collected in these two modes measure the same constructs and can be compared directly.
Structural Equivalence Across Countries
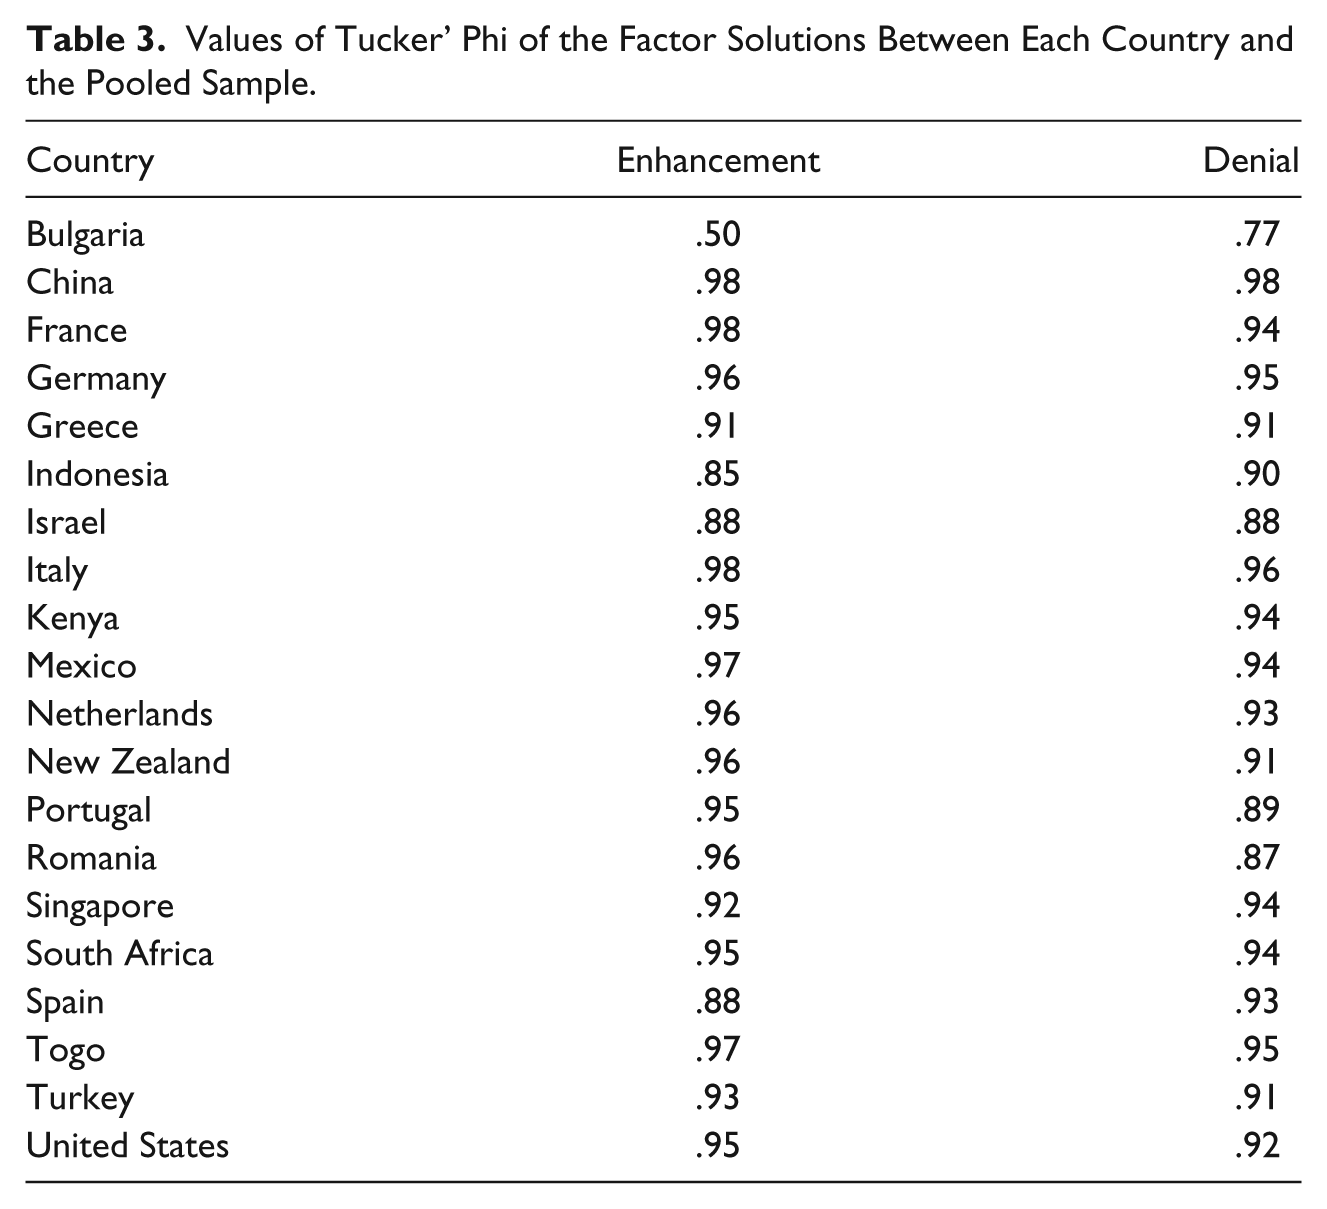
Rather than computing all pairwise comparisons between countries, we chose for an approach in which we compared the factor structure of each country with the pooled sample (i.e., combining all participants and correcting for mean score differences on items by computing a weighted covariance matrix). Principal component analysis of the 15 items with direct Oblimin rotation was performed with the pooled sample (Table 2) and in each country. Two factors were extracted based on the scree plot, explaining 17% and 13% of the variance in the pooled sample, respectively. The first five eigenvalues in the pooled solution were 2.56, 1.90, 1.25, 0.99, and 0.95, respectively. All the positively worded items loaded on the enhancement factor and all the negatively worded items loaded on the denial factor. The explained variance of enhancement ranged from 15% to 21% and of denial from 11% to 15% in different countries. Similar to previous studies on the shortened Marlowe–Crowne scale (Verardi et al., 2010), the amount of variance explained in these factors was not high, possibly because response styles including SDR are broad, general tendencies, which can be difficult to capture wholly in questionnaire items. Structural equivalence was checked though comparing each country’s factor solution with the pooled solution using Tucker’s phi (Table 3). On average, the values of Tucker’s phi for the two factors were .92 and .92. All the other countries showed acceptable structural invariance except Bulgaria, which might be due to the fact that we sampled students from the National Sports Academy who were not on an academic track as students majoring in social sciences in other countries. It was likely that the low convergence of the factor structure in Bulgaria resulted from the lack of familiarity in such survey tasks. We excluded Bulgaria in the following analyses.
Values of Tucker’ Phi of the Factor Solutions Between Each Country and the Pooled Sample.
DIF Analysis
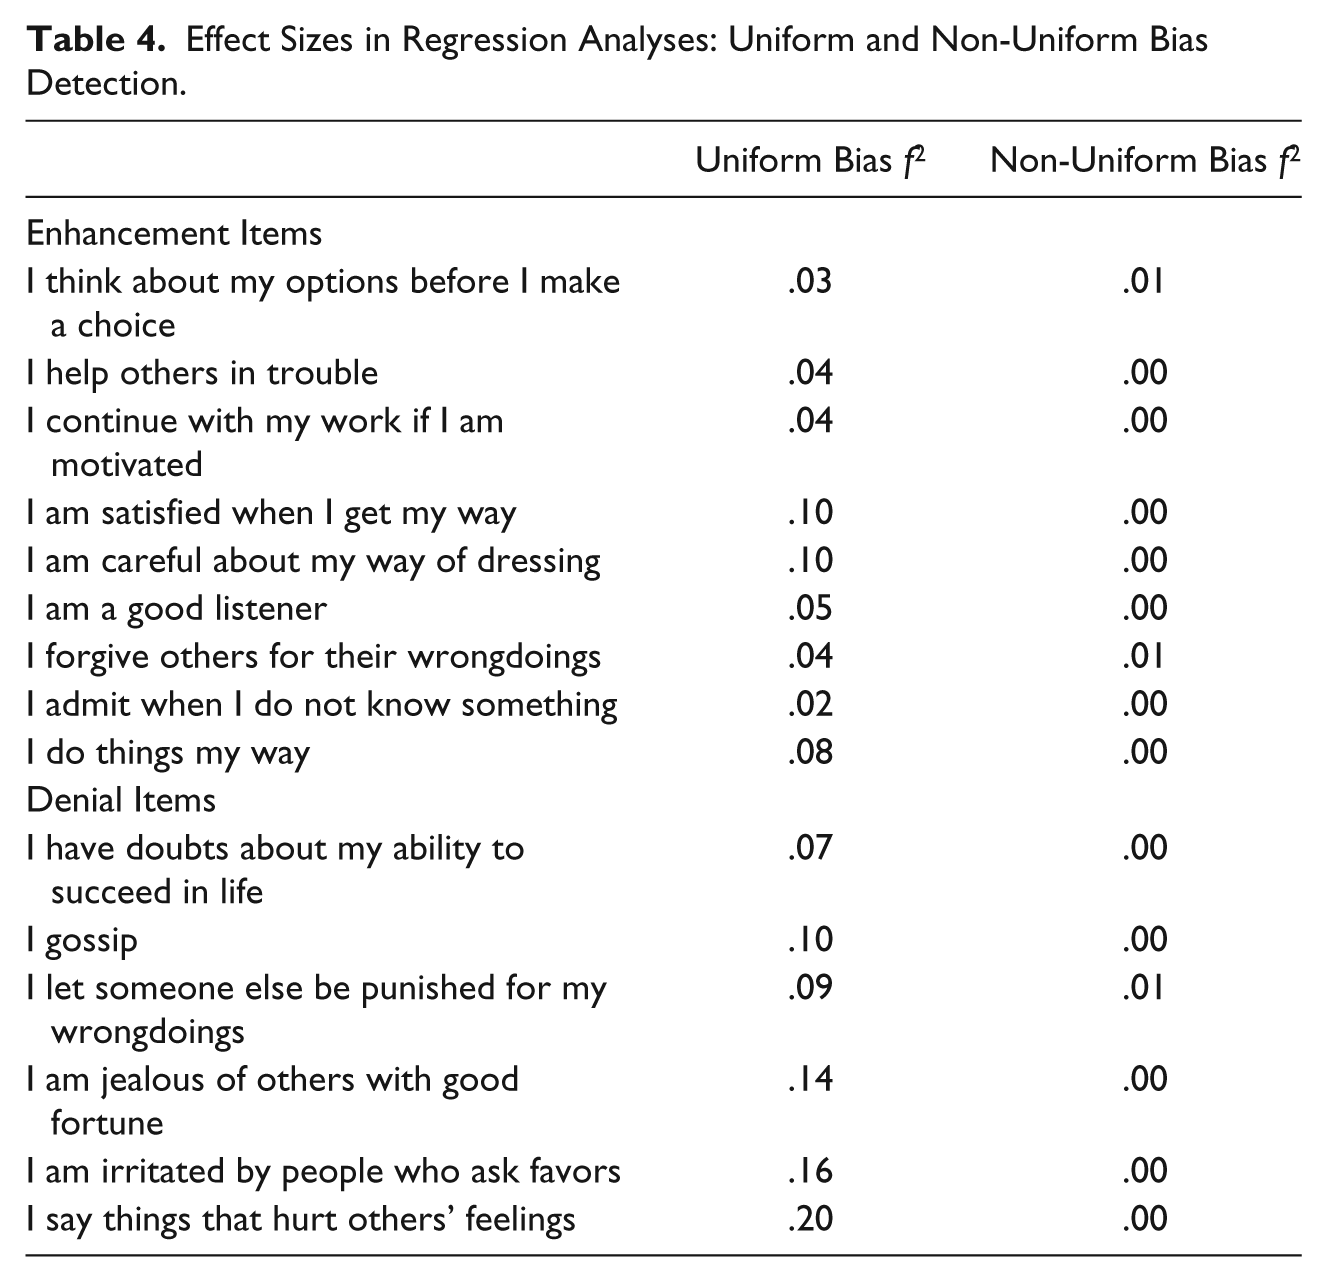
Item bias across countries was examined using multiple regression analyses. We took South Africa as the reference group because the adapted scale was first tested and validated in English in South Africa (van de Vijver & Meiring, 2011). Specifically, each of the nine enhancement items was regressed on three blocks of variables: the deviance scale score of the enhancement factor, 18 country dummy variables, and 18 interactions between the country dummy variables and the deviance score of the enhancement factor. The same procedure was applied to the six denial items, which were predicted by the deviance score of the denial factor, the 18 country dummy variables, and the interactions between the two. To correct for the large number of predictors in the blocks, values of adjusted R2 were used to calculate Cohen’s f2. Two denial items were found to have uniform bias with medium effect sizes (Table 4). On the item “I am irritated by people who ask favors,” China, France, Germany, Indonesia, Israel, Italy, Mexico, New Zealand, Singapore, Togo, Turkey, and the United States showed higher intercepts. On the item “I say things that hurt others’ feelings,” China, France, Portugal, Romania, and Togo showed higher intercepts whereas Greece had a lower intercept. These DIF effects could be due to different connotations of the words “irritated” and “hurt” in the various languages. These two items were excluded from the following analyses.
Effect Sizes in Regression Analyses: Uniform and Non-Uniform Bias Detection.
The values of Cronbach’s alpha of the final enhancement (nine items) and denial scale (four items) were .62 and .54, respectively. The low reliability values were not unexpected; Beretvas, Meyers, and Leite (2002) in a reliability generalization study of the Marlowe–Crowne Social Desirability Scale reported that the estimated reliability of this scale was .53. Scale scores of the two subscales were calculated for each individual and aggregated to country level. The scores of the denial items were reverse coded, thus a higher score on this subscale representing a higher tendency to deny negative self-descriptions. The two subscales were weakly correlated at the individual level, r(3274) = .09, p < .01; their correlation at country level was nonsignificant, r(17) = −.10, p = .69, which could be due to the limited number of observations. The country scores of enhancement and denial are presented in Table 5.
Country Scores of Enhancement and Denial Across 19 Countries.

Multilevel Analysis
Before applying the multilevel analysis, we correlated the country-level scores of enhancement and denial with affluence, values, beliefs, and personality traits. Due to the small sample sizes at the country level and skewed distributions of some variables, we resorted to bootstrapping and the significance level of the correlations was determined in 1,000 bootstrap samples (Table 6). Enhancement at country level was positively related to embeddedness and religiosity, and denial was negatively associated with HDI and positively associated with uncertainty avoidance, harmony, agreeableness, conscientiousness, and openness.
Country-Level Correlations of Enhancement and Denial With Affluence, Values, Beliefs, and Personality.

Significance level established with 95% CI based on 1,000 bootstrap samples.
We tested the effects of gender and country characteristics on enhancement and denial in a multilevel design with HLM Version 6 (Raudenbush & Bryk, 2002). The intraclass correlation coefficient was 9% for enhancement and 17% for denial, suggesting sufficient variations at country level to conduct multilevel analyses (van de Vijver & Poortinga, 2002). In accordance with Enders and Tofighi (2007), we centered the country-level predictors (converted to the standardized z scores) on the grand mean. We entered one predictor per analysis. All multilevel analyses employed a random intercept and a fixed slope (Table 7).
Coefficients From Multilevel Analyses.
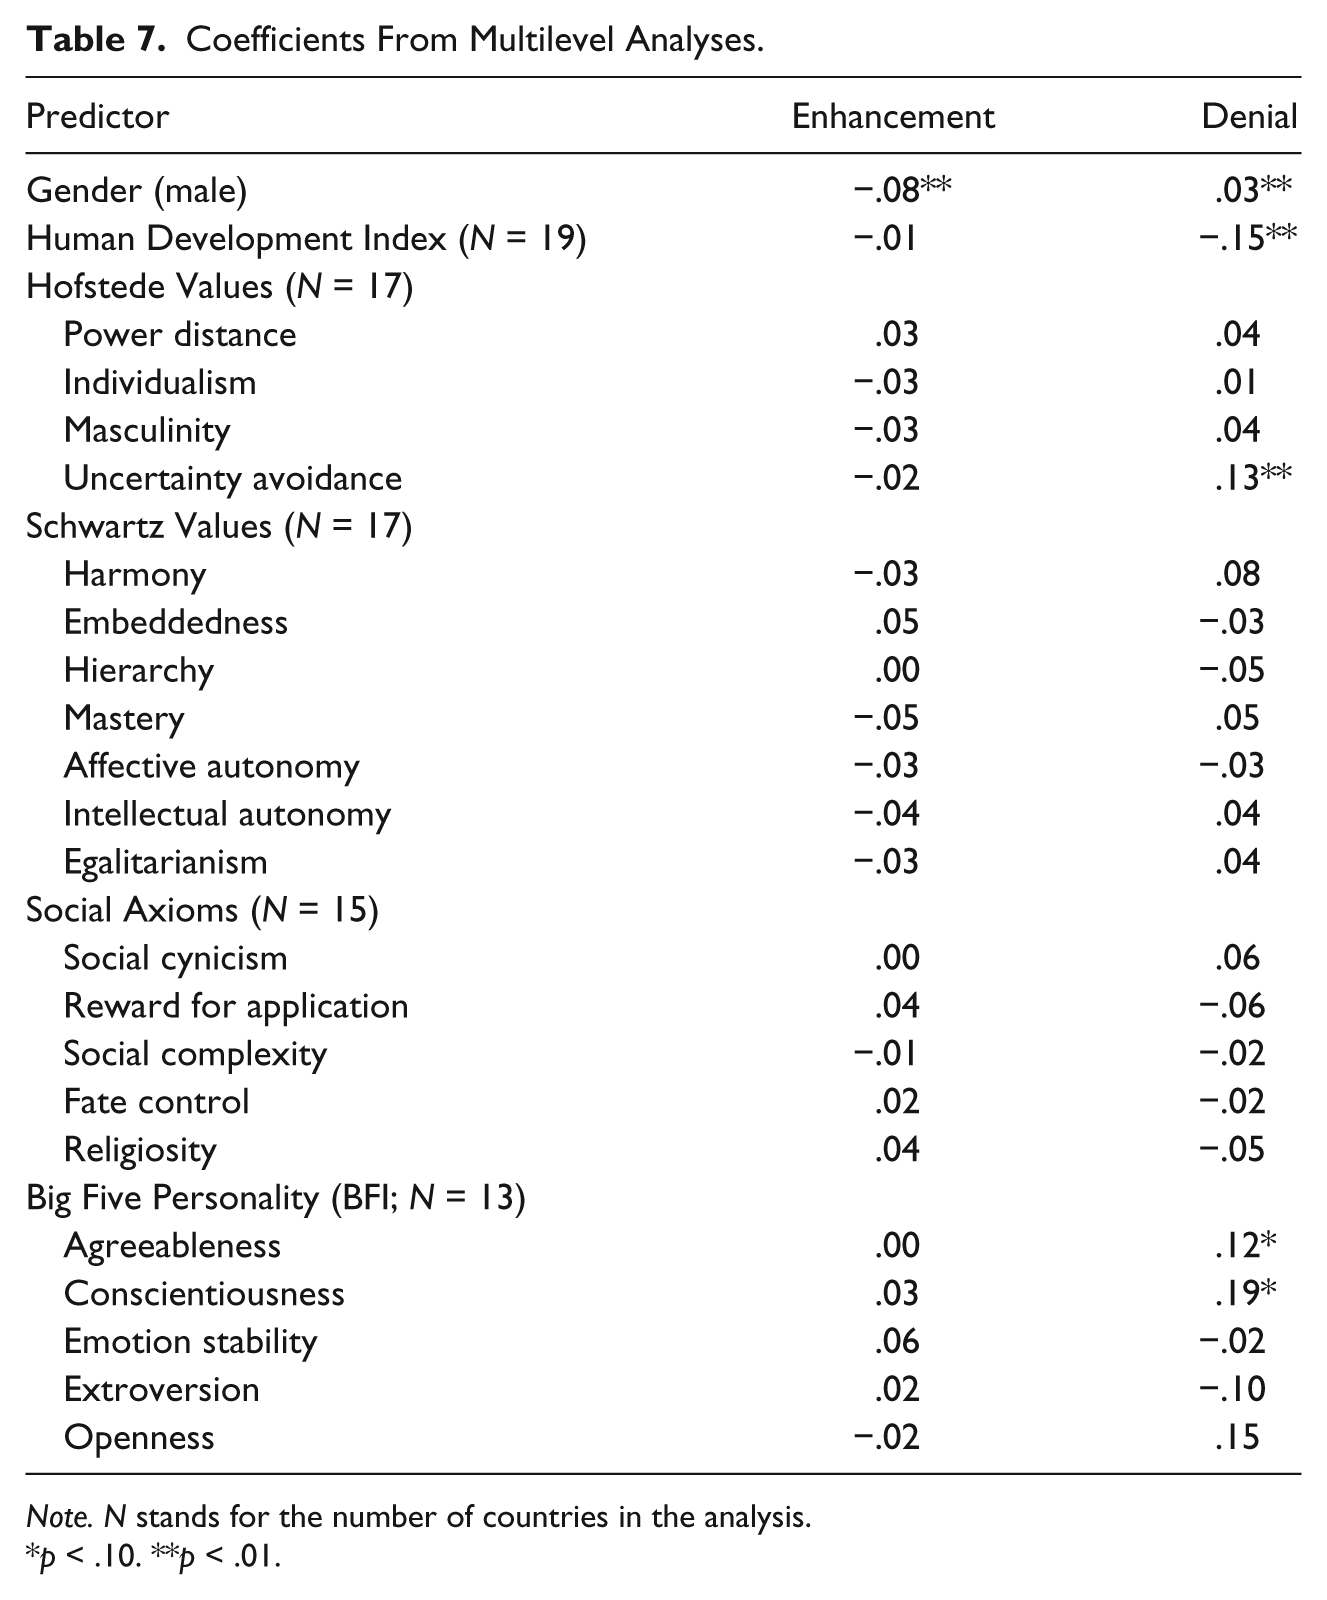
Note. N stands for the number of countries in the analysis.
p < .10. **p < .01.
We first checked the effects of differences in data collection modes (online vs. paper and pencil) on enhancement and denial and found no significant differences. Compared with females, males scored lower on enhancement and higher on denial, indicating that there were differential effects of gender on the subdimensions of SDR. HDI was negatively associated with denial; its association with enhancement was nonsignificant yet in the expected (negative) direction.
Caution is needed in the interpretation of the country-level results, because the number of countries available for analyses with cultural values and personality traits were smaller (e.g., in most cases these data were not available for Kenya and Togo), which limited the cross-cultural variations that we could study. Albeit nonsignificant, power distance, hierarchy, and emotion stability showed positive associations, and individualism and autonomy showed negative associations with enhancement, which well replicated the findings from van Hemert et al. (2002). Denial was predicted by agreeableness and conscientiousness. The combined evidence from the country-level correlations suggests that both enhancement and denial were related to cultural values and personality traits pertaining to “fitting in” and the two dimensions might be related to different aspects of “fitting in.”
Discussion
We studied the factor structure, structural equivalence, and cross-country variations of a shortened and simplified Marlowe–Crowne Social Desirability Scale among university students in 20 countries. Our findings supported a two-dimensional structure of SDR, distinguishing the endorsement of positive self-description (enhancement) and the avoidance of negative self-description (denial). The structure was largely invariant across countries. There were gender differences in the two dimensions: Enhancement was stronger among females and denial among males. A similar finding was reported by Sutton and Farrall (2005). It seems that there is a general difference in impression management in which females make more efforts to create a positive impression. There were more cross-country variations in denial than enhancement, and HDI was the most significant predictor for denial, which is in line with previous studies (Johnson & van de Vijver, 2003).
There has been much debate on the factor structure of SDR. Our study confirmed that SDR is a multidimensional construct. The distinction of enhancement and denial that we found in multiple countries is unlikely to be an artifact of item wordings, because all the items are formulated as affirmation of either positive or negative traits, emotions, and behaviors (Paulhus & Reid, 1991). The two aspects of SDR seem to be triggered by similar cultural mechanisms (i.e., fitting in). Given the small value of intraclass coefficients and the few significant predictors for enhancement, it seems that attributing positive traits to oneself is rather universal and is not much under cross-culturally differential control; however, denial has more cross-cultural variations, as people in countries low in affluence and high in agreeableness and conscientiousness seem to have a higher tendency to deny negative self-descriptions. These country-level correlates were similar to those found in a general response style (with SDR and extreme response style as positive indicators and acquiescent and midpoint response styles as negative indicators; He & van de Vijver, 2013; He, van de Vijver, Domínguez Espinosa, & Mui, 2014), suggesting that SDR, as part of a general response style factor, can be interpreted as a means of response amplification motivated by “fitting in.”
Our study has a few limitations. We used data of SDR from various bigger projects with different administration modes; thus, we did not have data on other constructs available in all countries that could be used to study the convergent and divergent validity of SDR at the individual level. The university student sample may not be equally representative in each culture. In particular, access to higher education in less developed countries (e.g., Togo) is largely restricted to elites who do not necessarily reflect the values of the general population. In Bulgaria, students from the non-academic track were sampled, which caused some incomparability with other countries. Future efforts should ensure the comparability of samples across cultures and replicate the study with different conditions that may motivate or demotivate respondents to present themselves in a positive light (e.g., employment selection process). Yet we confirmed an equivalent structure of SDR within 19 countries and meaningful country-level correlates. Our study has important implications for cross-cultural research. First, we found that SDR measured by the adapted Marlowe–Crowne scale has a positive and a negative component that are weakly related to one another but that do not show the same gender differences. Second, we find some systematic cross-cultural differences in enhancement and denial, which provides a piece to the puzzle as to whether SDR is a nuisance or substance. We argue that SDR has at least some substantive meaning (McCrae & Costa, 1983) as the two dimensions, especially the denial dimension, are influenced by country affluence, cultural values, and personality traits pertinent to “fitting in.” In such a case, removing the effects of SDR can erroneously eliminate valid variations between individuals and cultures.
Footnotes
Authors’ Notes
An earlier version of the article was discussed in the 2013 Writing Week of the Early Researcher Union of the European Association of Developmental Psychology.
Declaration of Conflicting Interests
The author(s) declared no potential conflicts of interest with respect to the research, authorship, and/or publication of this article.
Funding
The author(s) disclosed receipt of the following financial support for the research, authorship, and/or publication of this article: We acknowledge the support from the European Association of Developmental Psychology.