



Abstract
Our research suggests that the relation between GDP per capita and sociopolitical destabilization is not characterized by a straightforward negative correlation; it rather has an inverted U-shape. The highest risks are typical for the countries with intermediate values of GDP per capita, not the highest or lowest values. Thus, until a certain value of GDP per capita is reached, economic growth predicts an increase in the risks of sociopolitical destabilization. This positive correlation is particularly strong (r = .94, R2 = .88) and significant for the intensity of antigovernment demonstrations. This correlation can be observed in a very wide interval (up to 20,000 of international 2014 dollars at purchasing power parities [PPPs]). We suggest that it is partially accounted for by the following regularities: (a) GDP growth in authoritarian regimes strengthens the pro-democracy movements, and, consequently, intensifies antigovernment demonstrations; (b) in the GDP per capita interval from the minimum to $20,000, the growth of GDP per capita correlates quite strongly with a declining proportion of authoritarian regimes and a growing proportion of intermediate and democratic regimes; and, finally, (c) GDP growth in the given diapason increases the level of education of the population, which, in turn, leads to a higher intensity of antigovernment demonstrations.
Keywords
Introduction
There are a number of studies analyzing the impact of GDP per capita upon the level of sociopolitical instability. Most articles are based on a seemingly plausible assumption that the higher the level of a region’s economic development, the lower the risks of a civil conflict and the weaker the support for revolutionary ideas among the population. Thus, MacCulloch (2004) investigates the impact of the level of economic development upon the dissemination of revolutionary ideas in a society using the microdata obtained from the surveys of revolutionary youth. MacCulloch concludes that GDP per capita growth by 1,600 US dollars (in 2001 prices) reduces the risk of the dissemination of revolutionary ideas by 2.4%, while the proportion of people who would like to make a revolution is reduced by 41% (MacCulloch, 2004). MacCulloch and Pezzini (2010) use the microdata of the surveys of revolutionary preferences of 130,000 people from 61 countries during 1980-1997. Their article concludes that two indicators—namely, increasing level of political freedom and economic growth—reduce the revolutionary support. On the contrary, a decrease in the authors’ index of freedom by 1 point increases the support for revolutions by 4%. To annihilate this increase, an increase in GDP growth rates by 14% is required (MacCulloch & Pezzini, 2010). Similar conclusions are made by Parvin (1973) on the basis of cross-section data on 26 countries; Parvin states that both the level of income per capita and its growth exert negative influence on the level of political violence.
Miguel, Satyanath, and Sergenti (2004) suggest that assessing the impact of economic conditions on the risk of the emergence of a civil conflict is hindered due to the endogeneity of variables. The authors use the change in the level of precipitation as an instrumental variable for economic growth in 41 African countries in 1981 to 1999. Their research also shows a strong negative relation between the economic growth and the risk of a civil conflict (Miguel et al., 2004). Weede (1981) states that high average income is closely associated with less violence and lower death toll resulting from such violence. Alexander (2016) finds a rather close negative association between average wages and political instability. Similar results are produced by Nefedov (2015) with respect to general measures of population well-being. Chapman and Reinhardt (2013) also suggest that dependency on raw materials, low economic growth, and poverty can increase the risk of civil conflicts.
Research by Knutsen (2014) views the impact of economic growth and the level of income on the attempts at revolutions and successful uprisings in a broad prospect from 1919 to 2003 for 150 countries. This research reveals that moderate short-term growth enhances the probability of both attempts at revolutions and successful revolutions. There is also some evidence that higher levels of income are capable of mitigating the revolutionary attempts, though this point remains disputable.
The relationship between sociopolitical destabilization and various external economic factors, such as international loans, credits, and so on, has also received much attention in research. Thus, it has been revealed that international capital increases the state’s capacity to react to the actions of the internal opposition, as benevolent conditions of crediting expand its capacity to limit and suppress the oppositional forces. Empirical data for 141 countries for the period 1981-2007 are used to confirm that the states with greater access to international credit indeed have lower probability of the emergence of civil conflict (DiGiuseppe, Barry, & Frank, 2012).
However, some research implies that, in certain conditions, economic development can rather increase sociopolitical instability (see, for example, Huntington, 1968; Olson, 1963). Thus, in his analysis of the global revolutionary wave of the first half of 2014, Goldstone (2014) pays attention to the fact that the highest values of sociopolitical destabilization are observed in countries which are not characterized by either the highest or the lowest values of GDP per capita, namely, Thailand, Ukraine, Bosnia, and Venezuela. Goldstone (2014) suggests that this is not a mere coincidence:
All four are “middle-income” countries, among neither the world’s richest nor poorest societies. According to the International Monetary Fund, they range from 73rd in per capita GDP (PPP adjusted)—Venezuela’s global ranking—to 106th (Ukraine), with Thailand at 92nd and Bosnia 99th. In other words, of the 187 countries in the world ranked by the IMF, they are almost exactly in the middle. They have just arrived at the point where the vast majority of the population is literate, expects a government to provide a sound economy, jobs, and decent public services. However, they are not yet economically comfortable and secure. That security, and a better future for themselves and their children, depends very heavily on whether government leaders will work to provide greater opportunities and progress for the nation as a whole, or only to enrich and protect themselves and their cronies. They are at a point where limiting corruption and increasing accountability are crucial to whether their country will continue to catch up to the living standards of richer countries, or fall back to the standards of poorer ones.
The implication that until a certain limit the correlation between GDP per capita and sociopolitical destabilization should not be negative, but rather positive, stems from the classic theory of modernization. Let us recollect that, as early as 1959, Lipset put forward a hypothesis that in the course of economic development, citizens are increasingly less ready to tolerate repressive regimes, while in the course of per capita income growth, the probability of a transition from authoritarian to democratic regimes goes up. Lipset’s (1959) empirical tests supported this hypothesis. Later on, this hypothesis was tested and supported by a whole range of other researchers (Boix, 2011; Brunk, Caldeira, & Lewis-Beck, 1987; Burkhart & Lewis-Beck, 1994; Cutright, 1963; Dahl, 1971; Epstein, Bates, Goldstone, Kristensen, & O’Halloran, 2006; Londregan & Poole, 1996; Moore, 1966; Rueschemeyer, Stephens, & Stephens, 1992).
Lipset’s hypothesis itself suggests that not a linear but an inverted U-shaped relationship should be observed between GDP per capita and at least some types of sociopolitical destabilization. Indeed, authoritarian regimes present a large proportion of countries with low GDP per capita. Consequently, the growth of destabilization of authoritarian regimes paralleling the growth of GDP per capita must generate a positive correlation between GDP per capita and sociopolitical destabilization levels in a certain interval. Meanwhile (as we shall see below), for higher values of GDP per capita, we observe a negative correlation with sociopolitical instability. This gives us grounds to expect that at least some forms of sociopolitical destabilization should be particularly frequently attested in the countries with intermediate values of GDP per capita (i.e., middle-income countries).
Let us note that our test of this hypothesis on the data for 2013 and 2014 generally supported it. During these years, a state’s belonging to the medium quintile in GDP per capita proved to be a statistically significant predictor of sociopolitical destabilization of the “central collapse” pattern (Korotayev, Issaev, & Vasiliev, 2015; Korotayev, Issaev, & Zinkina, 2015).
In this article, we test this hypothesis on a wider selection of material.
Materials and Methods
To test the hypothesis of GDP being a statistically significant factor of sociopolitical destabilization (for a certain interval), we choose GDP per capita purchasing power parity (PPP) 1 from 1960 to 2015 as our independent variable and the system of indicators of sociopolitical destabilization from the Cross-National Time-Series (CNTS) database (see the appendix) as our dependent variables. All together, our analysis is based on 6,089 country-year observations.
Description and Methodology of Calculation of Independent Factors
Yearly values of GDP per capita (PPP, constant 2011 international dollars) are used according to the World Bank database (World Bank, 2017: NY.GDP.PCAP.PP.KD). Note that sign “$” throughout denotes constant 2011 international dollars at PPPs. To reconstruct data series for the period between 1960 and 1990, we use the GDP per capita growth indicator (World Bank, 2017: NY.GDP.PCAP.KD.ZG). On the whole, data from 1960 to 2014 are used to test the hypotheses.
We aggregate countries into groups according to the categories of their income basing on the value of GDP per capita (PPP). Here, we optimize the methodology used by the World Bank (2016):
Low-income category—less than $1,045 per capita;
Lower-middle-income category—from $1,046 to $4,125 per capita;
Medium-middle-income category—from $4,126 to $12,735 per capita;
Upper-middle-income category—from $12,736 to $20,000 per capita;
High-income category—more than $20,000 per capita.
In addition, we use a simpler tripartite division into three tertiles:
Low-income countries—from the minimum to $3,250 per capita;
Middle-income countries—from $3,250 to $11,600;
High-income countries—more than $11,600.
Our definition of another independent variable—the type of political regime—is based on the work by Goldstone and his colleagues (2010). They use Polity’s scale for the openness of executive recruitment (EXREC) as a measure of contestation and Polity’s scale of the competitiveness of political participation (PARCOMP) to capture variation in the degree and forms of inclusiveness. This measure is free from the shortcomings of linear regime type measures and uses two dimensions that have been long considered as the most important characteristics of the modern forms of government (Dahl, 1971). The classification includes five categories ranging from full autocracies to full democracies. The three intermediate categories include first of all (a) partial autocracies and (b) partial democracies, defined as follows: Partial autocracies hold competitive elections for national office but repress or tightly control participation or allow substantial political participation but fail to subject the office of chief executive to truly competitive elections; partial democracies are systems in which the chief executive is chosen through competitive elections and political competition is not effectively repressed, but either elections are not fully free and fair or political participation is not fully open and well institutionalized. Goldstone et al. further distinguish the third intermediate category, (c) partial democracies with factionalism, as coded on the PARCOMP variable. 2 All the data that we have used for the calculations below are available as Part 1 of the supporting online materials to this article at https://www.academia.edu/33635115/Supporting_online_materials_for_GDP_Per_Capita_and_Protest_Activity_A_Quantitative_Re-Analysis._Part_1._Dataset. Note that the autocorrelation tests that we have performed have not detected any significant serial autocorrelation problems in our dataset (see Part 2 of the supporting online materials to this article at https://www.academia.edu/33635317/Supporting_online_materials_for_GDP_Per_Capita_and_Protest_Activity_._Part_2._Autocorrelation_analysis).
Methodology of Tests
The classical correlation analysis is used as the primary method of testing. Along with this, the ordinal logit model 3 is used to identify independent factors that have the greatest impact. We also apply γ-coefficient tests.
We use aggregated values of the relevant indicators per year for all countries of a certain type, such as a mean intensity of antigovernment demonstrations for all countries of a given type per year. We quite frequently employ per decile analysis (when country-year observations are consolidated into income deciles), as this allows to see certain patterns more clearly than when country-years are used as units of analysis.
Tests
A direct test generally supports the hypothesis on the presence of an inverted U-shaped curve between the GDP per capita and the level of sociopolitical destabilization. The mean values of sociopolitical destabilization index for three tertiles of GDP per capita look as follows (see Figure 1).
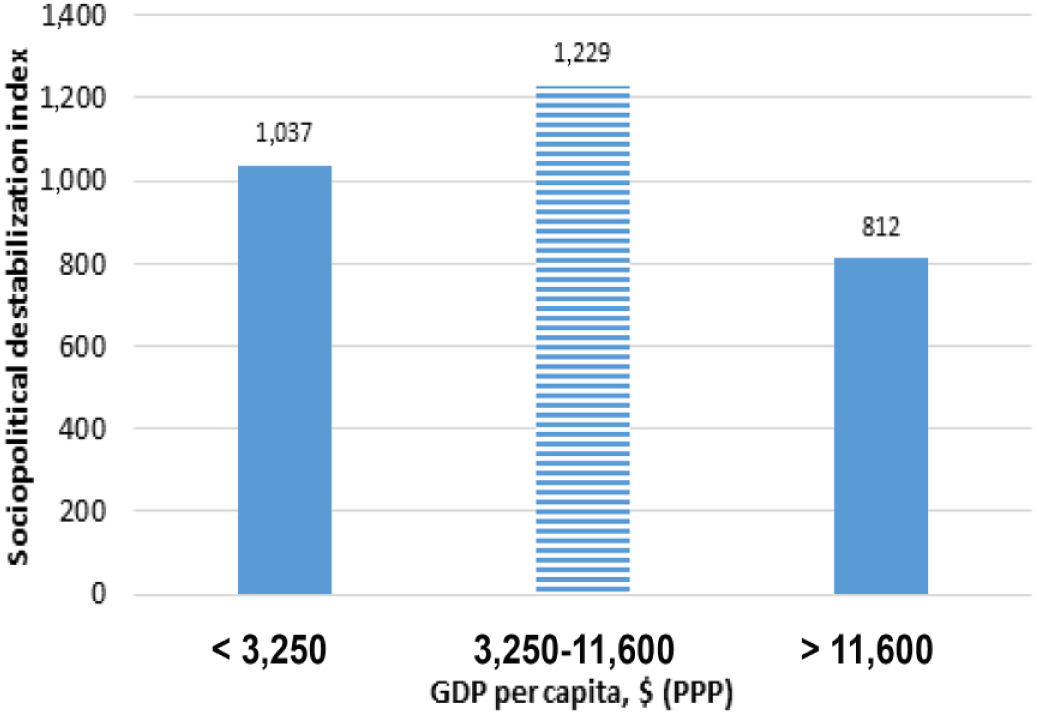
Mean values of sociopolitical destabilization index for three tertiles of GDP per capita (international 2011 dollars at PPP, 1960-2014).
The inverted U-shaped relationship looks rather asymmetrical here. Indeed, the negative correlation between GDP per capita and sociopolitical destabilization index is much more pronounced for the second and third tertiles (t = 2.62, p = .01, one-tailed) than for the first and second tertiles (t = −1.78, p = .04, one-tailed). Similar results are obtained through ANOVA.
Meanwhile, the general positive correlation between GDP per capita and the general destabilization index is very weak for the low- and middle-income societies (with GDP per capita less than $20,000)—see Figure 2.
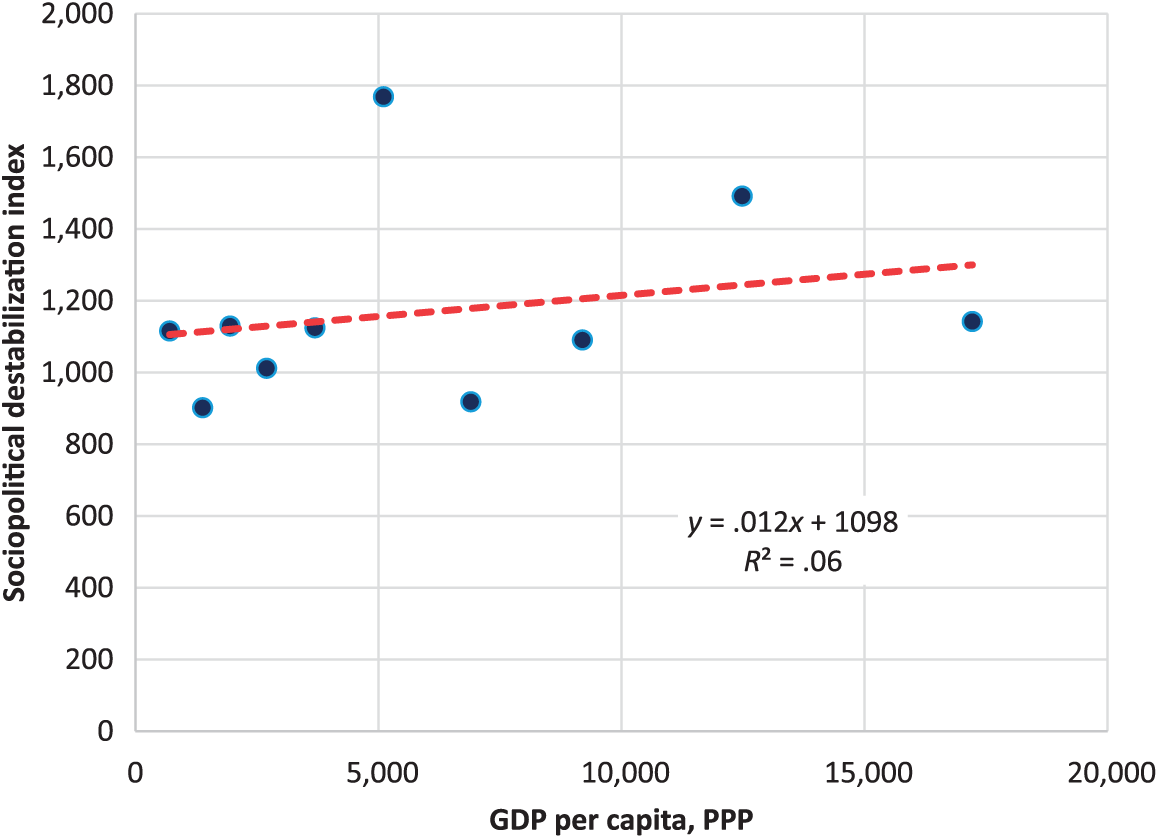
Correlation between GDP per capita and sociopolitical destabilization index for the corresponding year for countries with income not exceeding $18,000 to $19,000 (PPP), 1960-2014 (scatterplot with fitted regression line).
However, there is a reason to expect in the left part of the per capita GDP spectrum (among the low- and middle-income countries) a strong positive correlation not with the general level of sociopolitical destabilization, but with some of its components. Indeed, as some tests show (Korotayev, Issaev, & Vasiliev, 2015; Korotayev, Issaev, & Zinkina, 2015), the countries’ belonging to the middle (third) quartile of GDP per capita turn out to be a statistically significant predictor not of destabilization in general but of destabilization according to the “central collapse” model.
Let us recollect that in 1968, Samuel Huntington proposed two main types of revolutionary destabilization—“peripheral advance” (more typical for low-income countries) and “central collapse” (more typical for middle-income societies) (Goldstone, 2001, p. 143; 2014b, p. 27; Huntington, 1968), whereas the most typical kind of destabilizing activity for the “central collapse” scenario is constituted by antigovernment demonstrations. Accordingly, there is reason to expect that the most pronounced positive correlation for low- and middle-income countries should be observed between the levels of GDP per capita and the intensity of antigovernment demonstrations.
The empirical tests confirm our theoretical expectations. They reveal a large zone of GDP per capita values (up to 20,000 dollars), where we observe a strong (r = .92, R2 = .85) statistically significant (p < .01) correlation between GDP per capita and intensity of antigovernment demonstrations (see Figure 3).
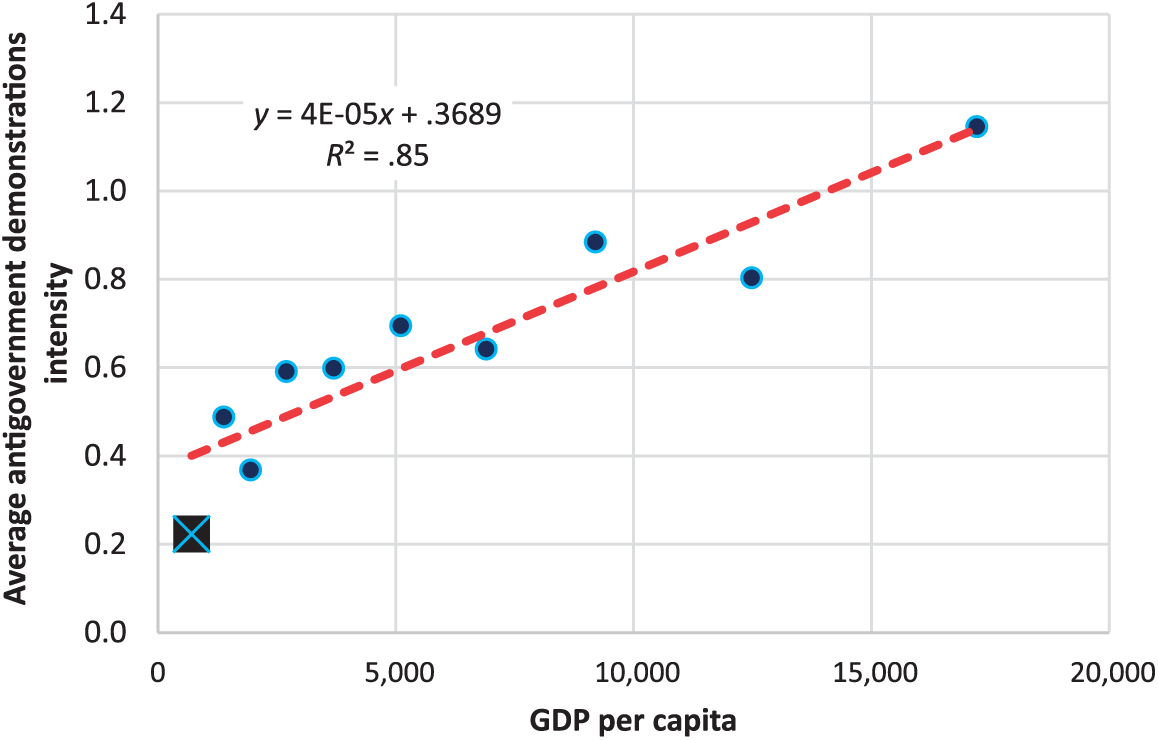
Correlation between GDP per capita for countries with an income up to US$20,000 at PPP and intensity of antigovernment demonstrations for the corresponding year, 1960-2014 (scatterplot with fitted linear regression line).
Meanwhile, in the interval of our interest (up to $20,000), the correlation between the intensity of antigovernment demonstrations and the logarithm of GDP per capita is particularly high (r = .94, R2 = .88; see Figure 4).

Correlation between GDP per capita for countries with per capita income up to US$20,000 by PPP and intensity of antigovernment demonstrations for the corresponding year, 1960-2014 (scatterplot with fitted logarithmic regression line).
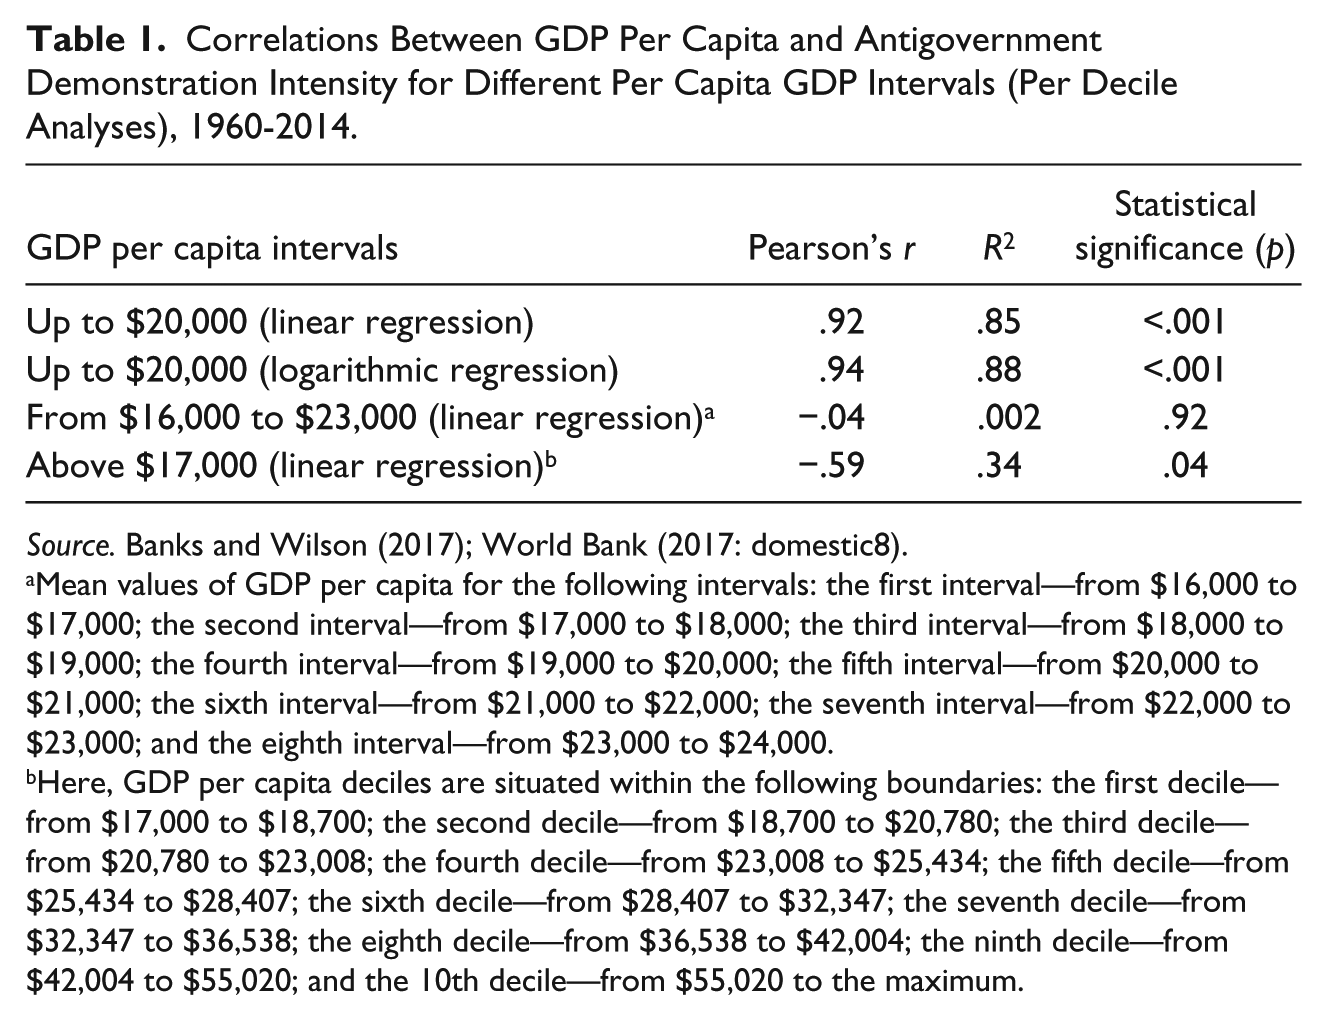
In the middle zone (ranging from $16,000 to $24,000 per capita), no significant correlation between GDP per capita and the intensity of antigovernment protesters is present (see Table 1).
Correlations Between GDP Per Capita and Antigovernment Demonstration Intensity for Different Per Capita GDP Intervals (Per Decile Analyses), 1960-2014.
Source. Banks and Wilson (2017); World Bank (2017: domestic8).
Mean values of GDP per capita for the following intervals: the first interval—from $16,000 to $17,000; the second interval—from $17,000 to $18,000; the third interval—from $18,000 to $19,000; the fourth interval—from $19,000 to $20,000; the fifth interval—from $20,000 to $21,000; the sixth interval—from $21,000 to $22,000; the seventh interval—from $22,000 to $23,000; and the eighth interval—from $23,000 to $24,000.
Here, GDP per capita deciles are situated within the following boundaries: the first decile—from $17,000 to $18,700; the second decile—from $18,700 to $20,780; the third decile—from $20,780 to $23,008; the fourth decile—from $23,008 to $25,434; the fifth decile—from $25,434 to $28,407; the sixth decile—from $28,407 to $32,347; the seventh decile—from $32,347 to $36,538; the eighth decile—from $36,538 to $42,004; the ninth decile—from $42,004 to $55,020; and the 10th decile—from $55,020 to the maximum.
Finally, over the whole range of values above 17,000 dollars, there is a not particularly strong but statistically significant negative correlation (see Table 1), which, apparently, supports the popular notion that “good life does not make people go to the streets,” or “if people took to the streets—their life should be bad.”
Returning to Figures 3 and 4, we can make a rather counterintuitive conclusion for a wide range of GDP per capita values (which includes countries, where the vast majority of humanity lives)—The higher the level of economic development and well-being, measured with GDP per capita at PPP, the higher the intensity of antigovernment demonstrations.
Discussion
GDP Per Capita, Intensity of Antigovernment Demonstrations, and Political Regime Type
The most obvious explanation for the positive correlation between GDP per capita and the intensity of antigovernment demonstrations is presented in the introductory part of this article: GDP growth in authoritarian regimes leads to the strengthening of the movement for democracy and thus to the intensification of antigovernment demonstrations.
In our database (as well as in reality), authoritarian states constitute a very high percentage of the total number of states with low values of per capita income growth effect. Therefore, the internal pressure for democratization on par with economic growth could substantially explain the strong correlation between GDP per capita and antigovernment demonstrations intensity for low- and middle-income countries.
Additional analysis of the database seems to support the validity of this hypothesis. Indeed, for authoritarian states in the range of GDP per capita up to $20,000, we clearly observe a positive correlation between GDP per capita and antigovernment demonstrations intensity (see Figure 5).
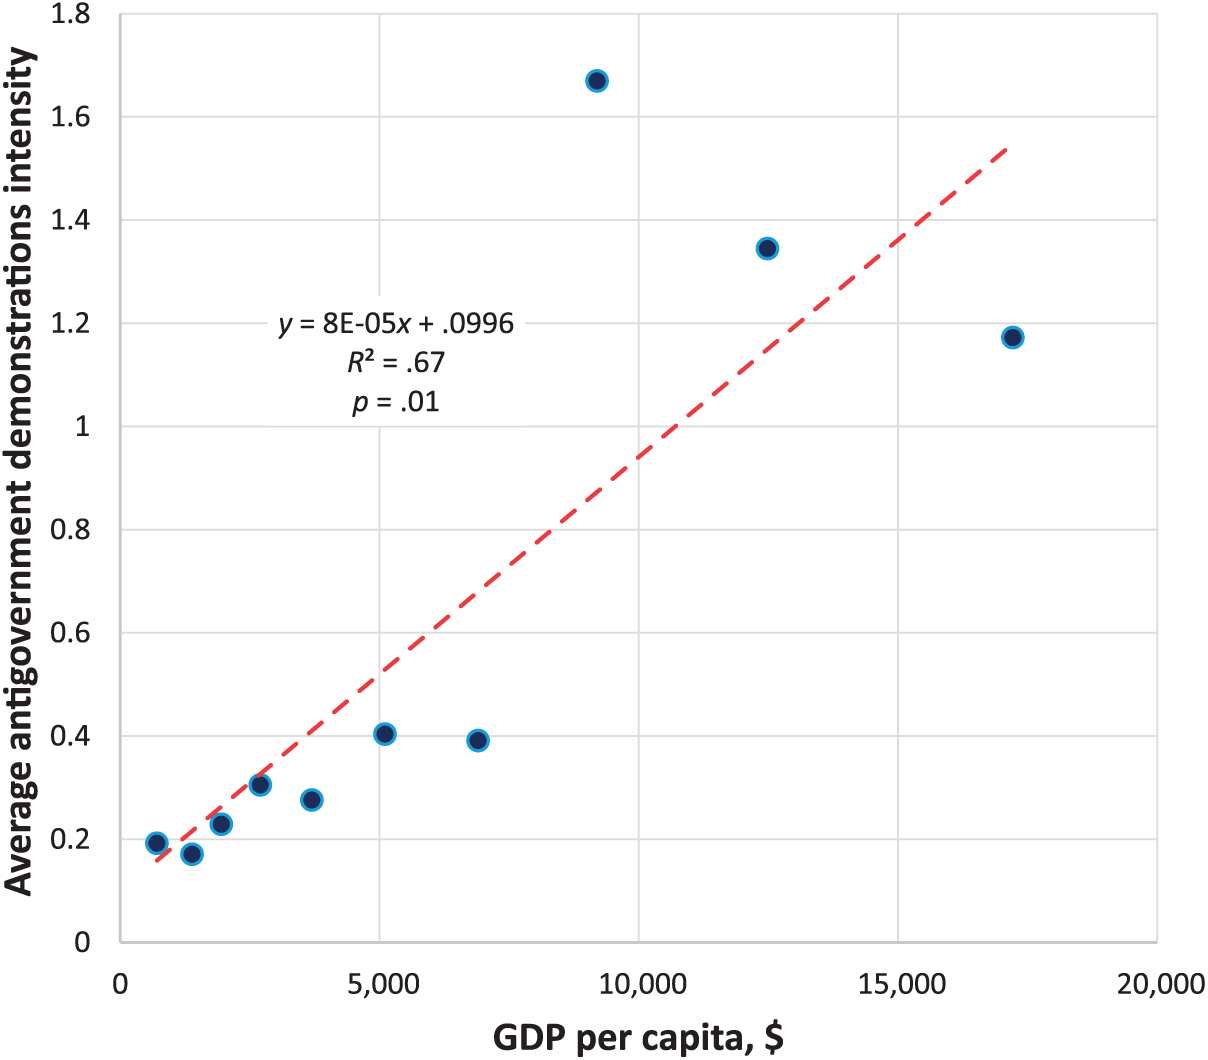
Correlation between GDP per capita for countries with an income up to 20,000 US$ at PPP in countries with authoritarian type of regime and antigovernment demonstrations intensity for the corresponding year, 1960-2014 (scatterplot with a fitted regression line).
On the contrary, our database shows a very pronounced declining trend in the number of authoritarian regimes with GDP per capita growth (see Figure 6).

Share of autocracies per income groups (up to $20,000), 1960-2014.
It is easy to notice that all this is consistent with the hypothesis that the pressure for democratization of authoritarian regimes grows with growing GDP per capita, and the increase of this pressure is noticeably reflected in the increase in antigovernment demonstration intensity.
However, a more careful analysis of Figure 6 suggests that the above-mentioned hypothesis may explain the correlation only partially. Indeed, as can be seen in Figure 6, among the countries with “high middle income” (≈$13,000-20,000), consistently authoritarian regimes account for only 6%. However, this is exactly the range where we observe the highest intensity of antigovernment demonstrations (see Figure 3). It is evident that the correlation of our interest cannot be explained entirely with the hypothesis described above. Nevertheless, there is another factor influencing the positive correlations between GDP per capita and the intensity of antigovernment demonstrations. We are talking about the following fact. Immediate transitions from autocracy to consolidated democracy are extremely rare. As a rule, initially the movement toward democracy (especially in economically underdeveloped countries) leads not to consolidated democracy but to inconsistent authoritarian or partially democratic regimes—that is, intermediate regime. Accordingly, there is rather strong positive correlation between GDP per capita and the share of intermediate regimes for countries with low per capita GDP values. It corresponds with reality and is especially noticeable for the range up to $6,000 (see Figure 7).

Correlation between GDP per capita for countries with income up to 6,000 dollars and the proportion of intermediate regimes, 1960-2014 (scatterplot with fitted regression line).
However, as has long been demonstrated, intermediate political regimes are the ones most prone to sociopolitical destabilization.
In 1974, T. R. Gurr drew attention to the fact that the so-called “semi-democracies” are the type of regime most prone to destabilization.
This observation was further developed in the research works based on the use of mathematical tools, and databases containing information about many countries of the world. Thus, Hegre, Ellingsen, Gates, and Gleditsch (2001) state that the U-shaped curve defines the relationship between democracy and civil war. Regimes that score in the middle range of the democracy–autocracy index have a significantly higher probability of civil war than either democracies or autocracies. The authors indicate that regime change clearly and strongly increases the probability of civil war in the short run. However, intermediate regimes are most prone to civil war, even when they had time to stabilize from a regime change.
The theory about the inverse U-shaped relationship between the regime type and the risks of political destabilization was the result of those works. In accordance with this theory, consistent democracies and autocracies are more stable, while the most unstable regimes are intermediate ones (Gates, Hegre, Jones, & Strand, 2000; Goldstone et al., 2010; Goldstone et al., 2000; Grinin, Issaev, & Korotayev, 2015; Grinin & Korotayev, 2010, 2012a, 2012b, 2013, 2014a, 2014b; Korotayev, Issaev, Malkov, & Shishkina, 2013, 2014; Korotayev, Issaev, & Vasiliev, 2015; Korotayev, Issaev, & Zinkina, 2015; Malkov, Korotayev, Issaev, & Kuzminova, 2013; Mansfield & Snyder, 1995; Marshall & Cole, 2008; Slinko, Bilyuga, Zinkina, & Korotayev, 2017; Ulfelder & Lustik, 2007; Vreeland, 2008).
This fact seemingly suggests that the positive correlation between GDP per capita and the intensity of antigovernment demonstrations among low- and middle-income countries is due to the fact that the growth in GDP per capita is accompanied by an increase in the share of intermediate regimes.
Of course, this fact to a large extent explains the U-shaped relationship between GDP per capita and the general level of sociopolitical destabilization identified above. However, with regard to the correlation between GDP per capita and antigovernment demonstrations intensity, this hypothesis, as we will see below, requires significant elaboration (see Figure 8).
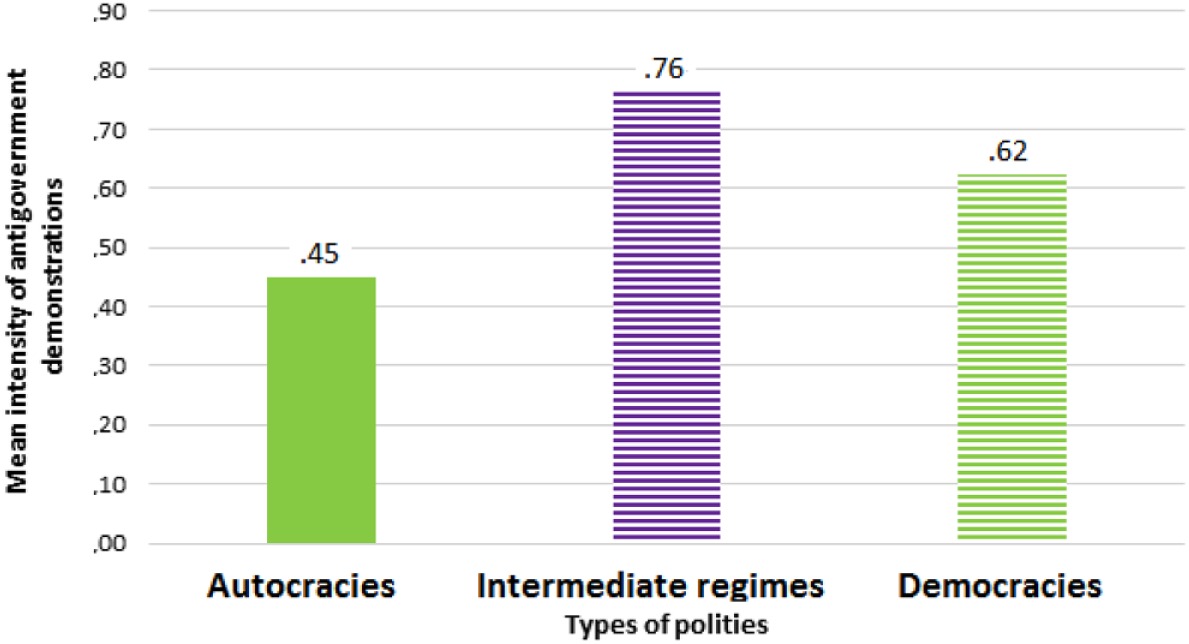
Average intensity value of antigovernment demonstrations by categories of polity types for countries with an income up to 20,000 US$ at PPP during the period 1960-2014.
As we see, our ANOVA demonstrates that a significant difference is only observed between autocracies, on one hand, and democracies and intermediate regimes, on the other. Both in democratic and intermediate regimes, the average intensity of antigovernment demonstrations is significantly higher than in authoritarian regimes. On the contrary, significant differences between democratic and intermediate regimes are not observed for this indicator. Thus, it is more correct to view authoritarian regimes as predictors of the absence of antigovernment demonstrations. Indeed, Table 2 shows that for the countries in the range of our interest, an authoritarian regime is a significant predictor of the absence of antigovernment demonstrations.
Correlation Between Political Regime Type (Dichotomized) and Intensity of Antigovernment Demonstrations for Countries With an Income Up To 20,000 International Dollars at PPP.
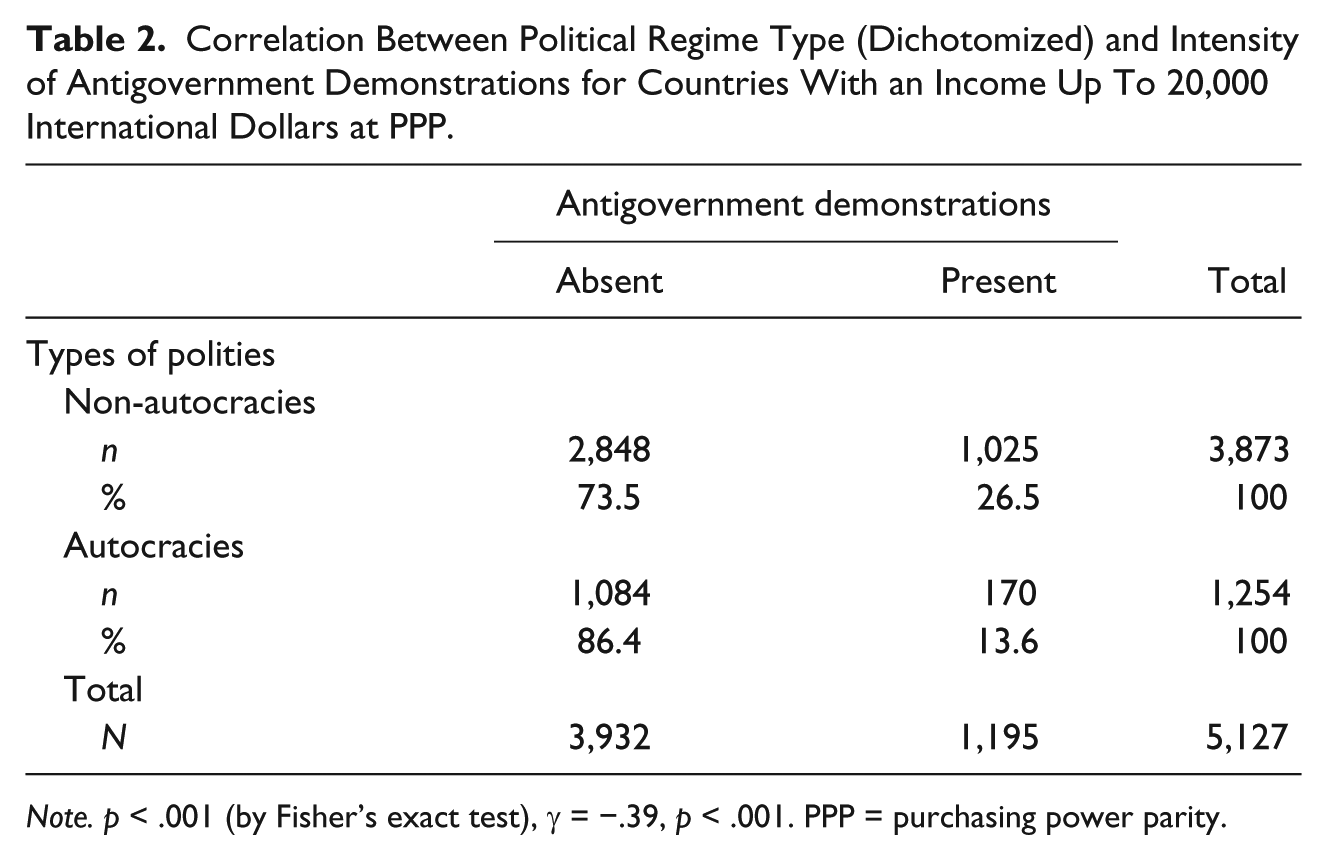
Note. p < .001 (by Fisher’s exact test), γ = −.39, p < .001. PPP = purchasing power parity.
As we can see, the probability of large antigovernment demonstrations in authoritarian regimes is 2 times less than in nonauthoritarian regimes. This, of course, is not surprising, as authoritarian regimes, by definition, suppress antigovernment demonstrations. For example, under the authoritarian regime of Brezhnev–Chernenko–Andropov, there were almost no antigovernment demonstrations in the Soviet Union. But as soon as Gorbachev’s administration accomplished the transition from an authoritarian regime to an intermediate one, the number of antigovernment demonstrations increased dramatically (Banks & Wilson, 2017). Obviously, even an inconsistently authoritarian regime, almost by definition, would not suppress antigovernment demonstrations as effectively as an unequivocally authoritarian one. Now remember that for countries within the range of our analysis, the GDP per capita growth is highly correlated with the decrease in the proportion of authoritarian regimes (see Figure 6).
Thus, a positive correlation between GDP per capita and intensity of antigovernment demonstrations in the range up to $20,000 can additionally be accounted for by the following:
GDP per capita growth in this range is strongly correlated with the decreasing share of authoritarian regimes and increasing share of nonauthoritarian regimes (democratic and intermediate).
The presence of nonauthoritarian regimes in this range is positively correlated with higher intensity of antigovernment demonstrations.
Importantly, this mechanism in no way denies the fact that in the range of $13,000 to $20,000, the proportion of consistently authoritarian regimes is extremely low. On the contrary, this fact only enhances the effect of the mechanism under consideration.
However, a more careful analysis shows that this mechanism (even in combination with mechanism of increasing intensity of antigovernment demonstrations against the background of growing instability of autocracies with the growth of GDP per capita) can only partly explain the presence of correlation in question.
The fact is that within the interval of GDP per capita in question, the positive correlation between per capita GDP and intensity of antigovernment demonstrations can be traced not only in autocracies but also in the intermediate regimes and consolidated democracies (see Table 3).
Correlations Between GDP Per Capita and Antigovernment Demonstration Intensity for Different Regime Types for Interval Up To $20,000 (Per Decile Analyses), 1960-2014.
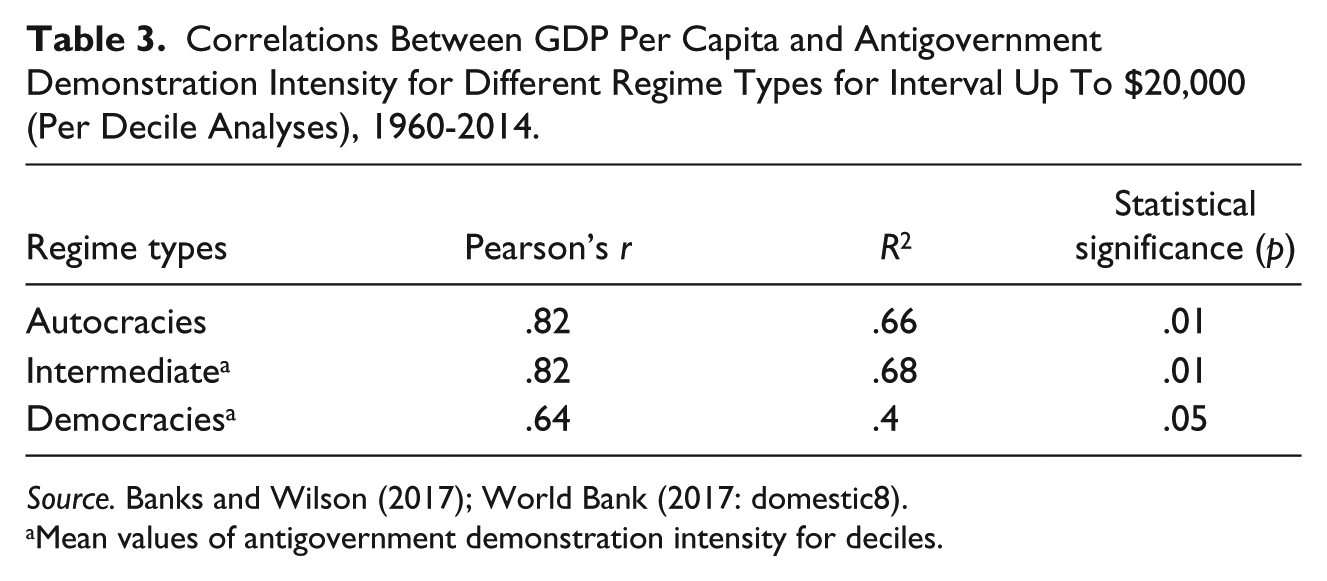
Source. Banks and Wilson (2017); World Bank (2017: domestic8).
Mean values of antigovernment demonstration intensity for deciles.
However, the statistically significant correlation between GDP per capita and intensity of antigovernment demonstrations in consolidated democracies, of course, cannot be explained by any reduction in the share of authoritarian regimes with per capita GDP growth, nor by the increased instability of authoritarian regimes with increasing GDP per capita. And, therefore, the general positive correlation between GDP per capita and intensity of antigovernment demonstrations in the range up to $20,000 cannot be only accounted for by the reduction in the proportion of authoritarian regimes and an increase in their instability with increasing GDP per capita. It is a rather obvious fact, but it is better to demonstrate this formally as well.
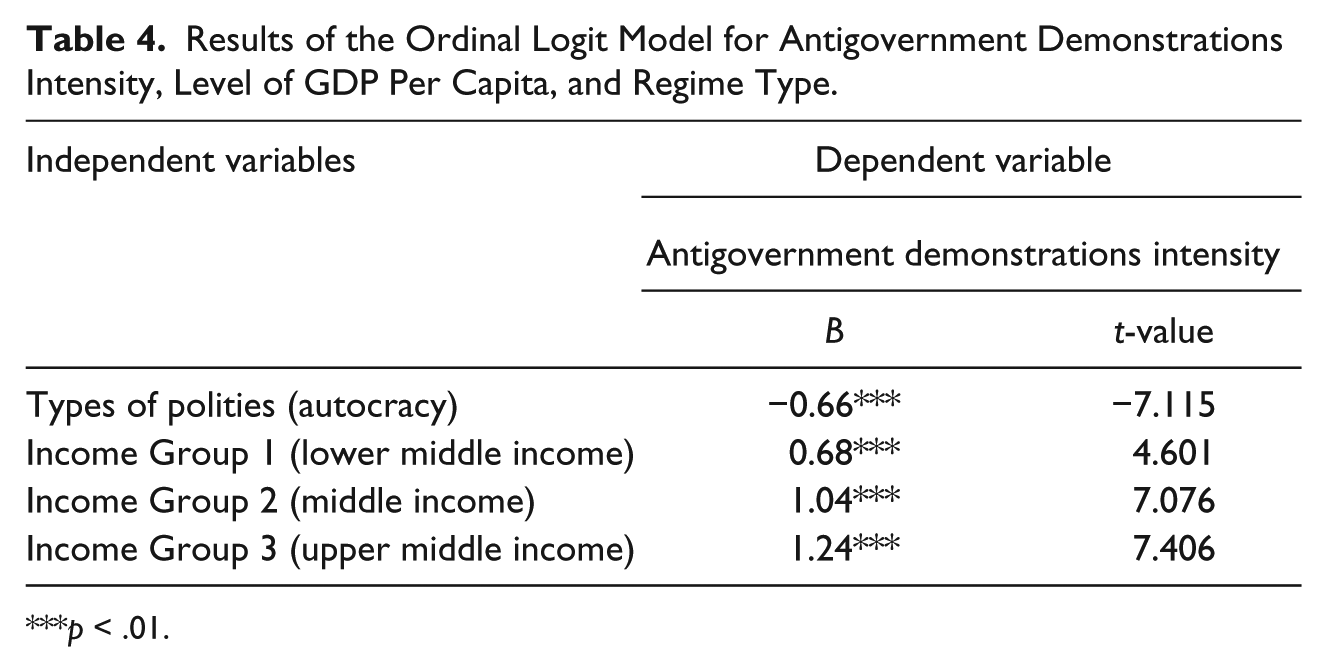
To do so, we can use the ordinal logit model, where the dependent variable is the intensity of antigovernment demonstrations (split into five categories: 1 = total absence of demonstrations, 2 = one demonstration, 3 = from two to three demonstrations, 4 = from four to nine demonstrations, and 5 = 10 or more demonstrations), 4 and the independent variables include the level of GDP per capita (divided into four categories: 1 = up to $1,160, 2 = from $1,160 to $4,280, 3 = from $4,280 to $14,400, and 4 = from $14,400 to $20,000) and dichotomized type of regime (authoritarian vs. nonauthoritarian) (see Table 4).
Results of the Ordinal Logit Model for Antigovernment Demonstrations Intensity, Level of GDP Per Capita, and Regime Type.
p < .01.
As we can see, for the range up to $20,000 (not including high-income countries), the GDP per capita factor remains highly significant after being combined with the authoritarianism of regime as another independent variable within one model.
Both factors are significant, but the factor of GDP per capita is even stronger than the factor of regime type.
So, a positive correlation between GDP per capita and intensity of antigovernment demonstrations in the range of $20,000 can be only partly explained by the declining share of authoritarian regimes and the increase of their instability with the growth of per capita GDP in this range.
However, these mechanisms still do partly explain the positive correlation between GDP per capita and intensity of antigovernment demonstrations in the range of $20,000. GDP growth is a factor for transition from authoritarian to nonauthoritarian regimes, while this transition is a factor for the growing intensity of antigovernment demonstrations. On the contrary, GDP growth in authoritarian regimes leads to the strengthening of the movement for democracy and thus to the intensification of antigovernment demonstrations.
As a result, by virtue of these combinations of factors, it would be possible to expect a positive correlation between per capita GDP and intensity of antigovernment demonstrations, but (as we can see above) not such a strong one as it is observed in reality. Therefore, it is necessary to continue search for the mechanisms influencing the correlation in question.
Education Factor
Education is another probable mechanism for generating a positive correlation between GDP per capita and intensity of antigovernment demonstrations. Indeed, economic development is closely correlated with the development of education system. It appears to be a dynamic relationship. The development of the education system stimulates economic growth (especially in underdeveloped countries), while growth of GDP per capita, in its turn, stimulates the development of education, as it leads to a significant growth of resources that can be allocated for the development of this system and hence to increase the level of education of the population (see, for example, Barro, 1991; Barro & Sala-i-Martin, 1995; Benos & Zotou, 2014; Korotayev, 2009; Korotayev & Khaltourina, 2010; Korotayev, Malkov, & Khaltourina, 2006, 2007; Sadovnichij, Akaev, Korotayev, & Malkov, 2016; Sala-i-Martin, 1997).
This correlation is clearly visible in our sample. In this work, the level of education of any country is measured by an indicator used by UN Development Program for Human Development Index, namely, mean years of schooling (Jahan, 2015). According to the definition of the UN Development Program, this indicator represents “the average number of years of education received by people aged 25 and older, converted from the educational level of the population based on the official duration of each level of education” (Jahan, 2015, p. 211). In our sample, there is a strong correlation between GDP per capita and this indicator (see Figure 9).
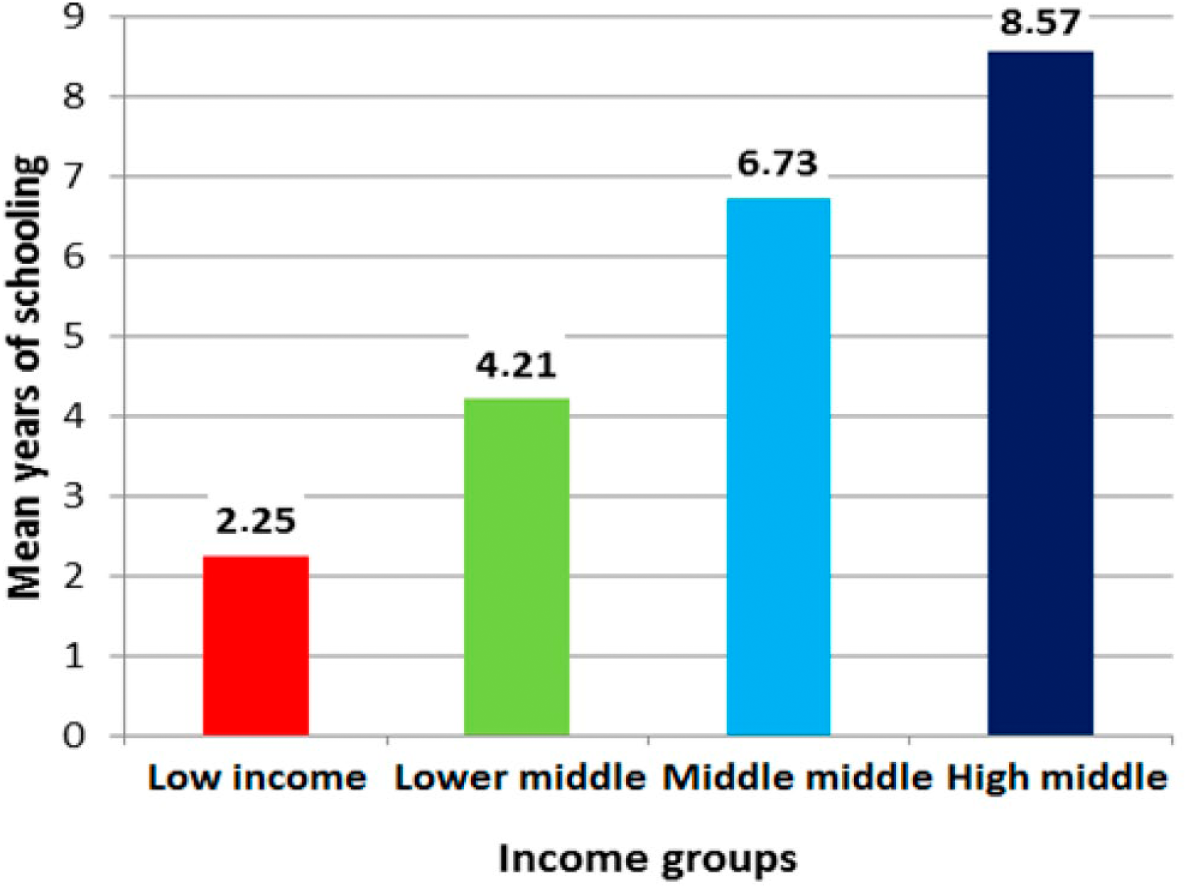
Mean years of schooling by income groups for countries with per capita income up to 20,000 US$ at PPP during the period 1980-2014.
On the other hand, some studies suggest that the level of education of the population can quite closely and positively correlate with the intensity of antigovernment demonstrations (Hall, Rodeghier, & Useem, 1986; Huntington, 1968; Jenkins & Wallace, 1996; Olson, 1963).
Our empirical test supports this hypothesis and reveals a rather strong (r = .55, R2 = .31) positive statistically significant (p = .05) correlation between the level of education and intensity of antigovernment demonstrations (see Figure 10).
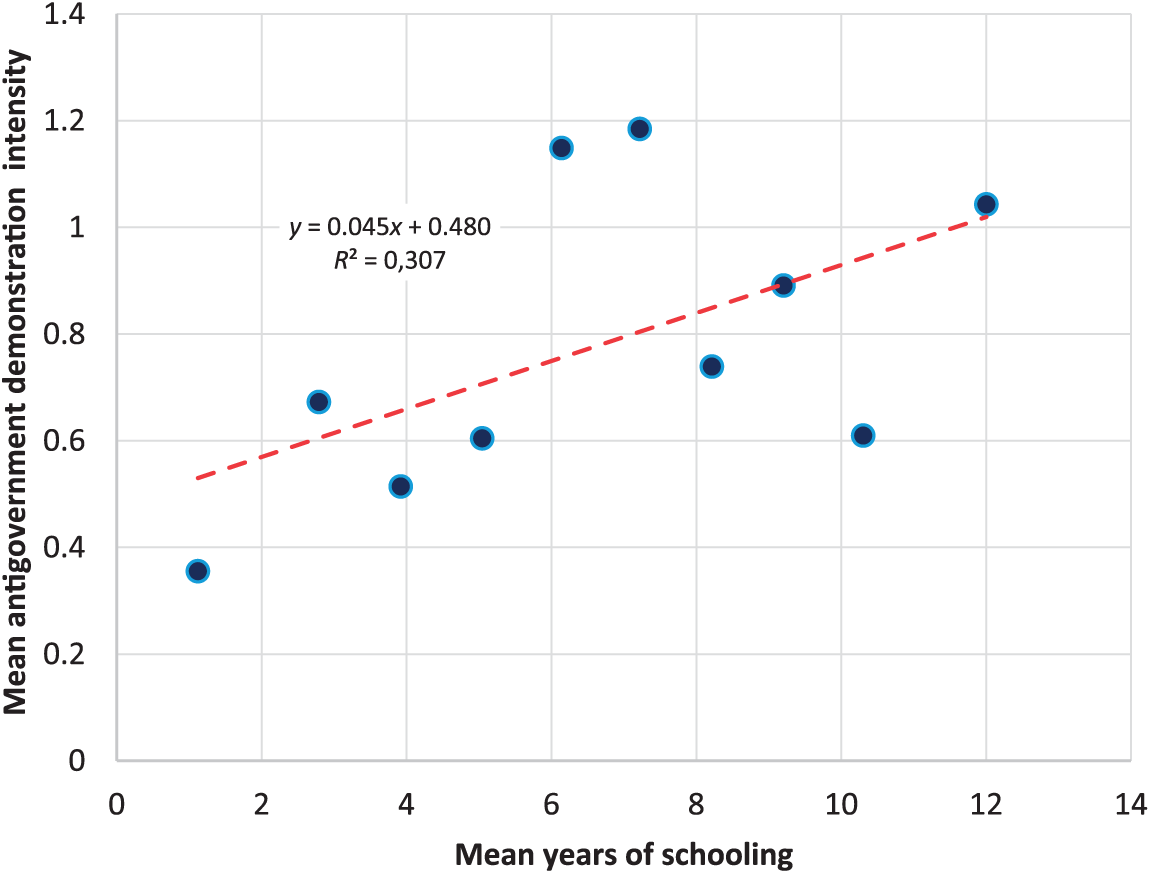
Correlation between mean years of schooling and intensity of antigovernment demonstrations for countries with an income up to 20,000 international dollars at PPP, 1980-2014 (scatterplot with a fitted regression line).
The presence of this correlation should not be surprising, because it is the fact that peaceful antigovernment demonstrations is a form of protest characteristic of educated rather than uneducated citizens (noticed already by Hall and his colleagues, 1986).
However, as we see in Figure 10, with the increase in the mean years of schooling, the intensity of antigovernment demonstrations grows not monotonically but rather by an abrupt leap with the transition from the interval ≤5 years to the next interval, which gives us a reason to dichotomize the variable in question.
The t-test employing such a dichotomization yields the following results (see Figure 11).
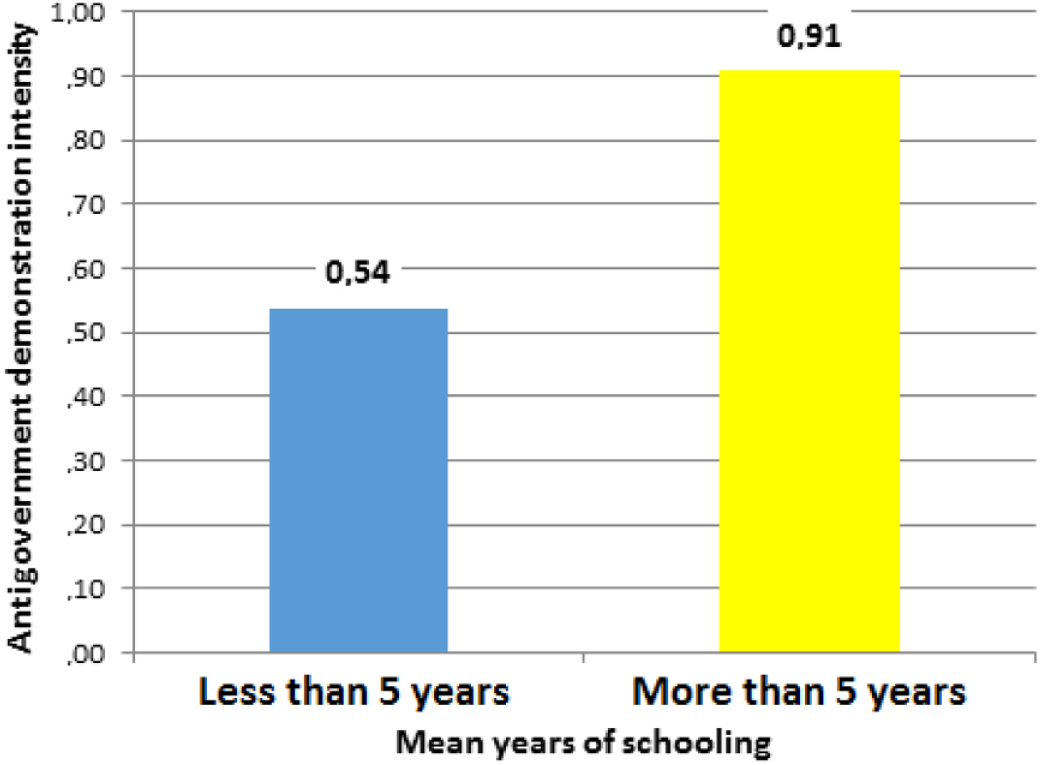
Average intensity of antigovernment demonstrations by categories of mean years of schooling for countries with per capita income up to 20,000 US$ at PPP, 1980-2014.
As we can see, the correlation is statistically significant. It should be noted that the high level of education of the population is a particularly good indicator of antigovernment demonstrations waves—10 and more antigovernment demonstrations in one country in one year (see Table 5).
Correlation Between Mean Years of Schooling and Intensity of Antigovernment Demonstrations for Countries With Per Capita Income Up To 20,000 International Dollars at PPP.

Note. p < .001 (by Fisher’s exact test), γ = .6, p < .001. PPP = purchasing power parity.
Indeed, in countries with the mean years of schooling more than 5 years, the likelihood of a powerful wave of antigovernment demonstrations is more than 3 times higher than in countries where the mean years of schooling are less than 5 years.
Thus, we arrive at the following quite plausible hypothesis: Positive correlation between per capita GDP and intensity of antigovernment demonstrations in the interval up to $20,000 is due to the fact that GDP growth leads to the growth of education of the population, and the growth of educated population, in turn, leads to an increase in the intensity of antigovernment demonstrations.
However, there are grounds to assume that this mechanism cannot fully explain the presence of the correlation we are interested in. Indeed, in the mean years of schooling interval more than 5 years, positive correlation between the mean years of schooling and intensity of antigovernment demonstrations is missing; however, this interval is characterized by rather strong and statistically significant (p = .03) positive correlation between GDP per capita and intensity of antigovernment demonstrations (see Figure 12).
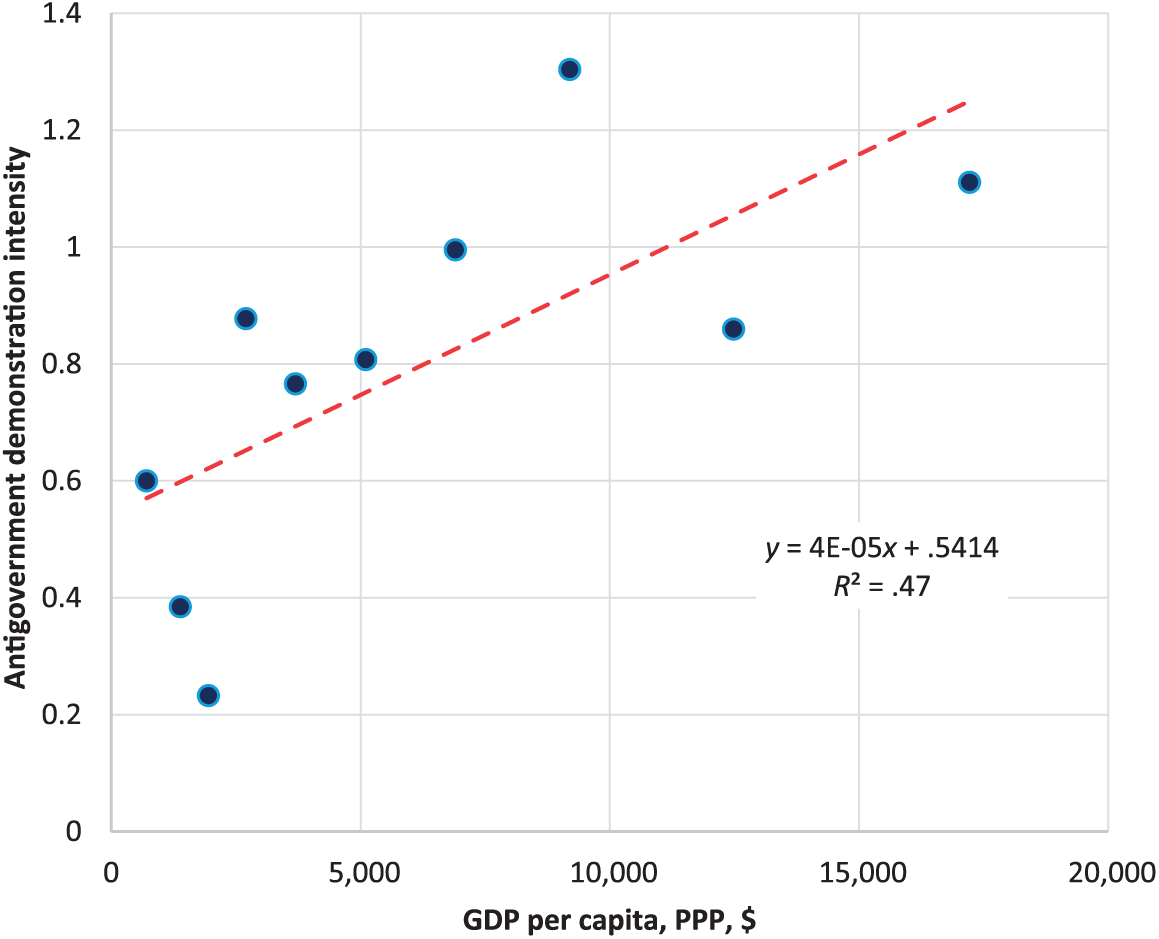
Correlation between GDP per capita and intensity of antigovernment demonstrations, for countries with an income up to 20,000 US$ at PPP and mean years of schooling more than 5 years, 1960-2014 (scatterplot with a fitted regression line).
Of course, this fact suggests that a positive correlation between GDP per capita and intensity of antigovernment demonstrations cannot be attributed only to the education factor. However, we can show this in a more formal way by the ordinal logit model, where the dependent variable is the intensity of antigovernment demonstrations (split into five categories: 1 = total absence of antigovernment demonstrations; 2 = one antigovernment demonstration recorded in the given year in the given country; 3 = from two to three demonstrations; 4 = from four to nine demonstrations; and 5 = more than nine demonstrations), and the independent variables include the level of per capita GDP (divided into four categories: 1 [low income] = up to $1,160; 2 [lower middle income] = from $1,160 to $4,280; 3 [medium-middle income] = from $4,280 to $14,400; and 4 [upper middle income] = from $ 14,400 to $20,000) and dichotomized mean years of schooling (≤5 years vs. >5) (see Table 6).
Results of the Ordinal Logit Model for the Intensity of Antigovernment Demonstrations, the Level of GDP Per Capita, and Mean Years of Schooling.
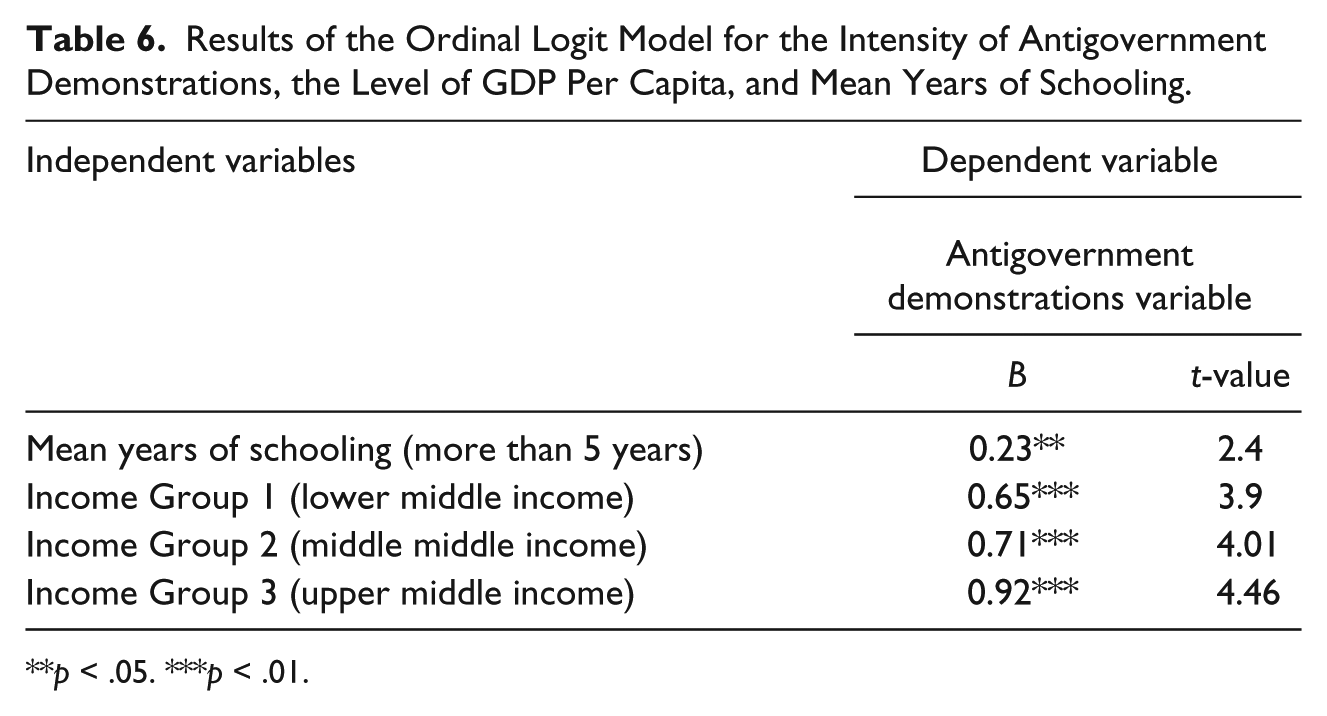
p < .05. ***p < .01.
As we can see, for the range up to $20,000, the influence of GDP per capita does not get neutralized by combining in one model GDP and mean years of schooling as another independent variable. Both factors are significant, but even after the introduction of the control, the impact of GDP per capita is much more powerful than the influence of education.
So, the positive correlation between GDP per capita and intensity of antigovernment demonstrations in the range of $20,000 can only partly be explained by the fact that per capita GDP growth in this range is accompanied by an increase in the mean years of schooling.
However, this mechanism still does partly explain the positive correlation between GDP per capita and intensity of antigovernment demonstrations in the range below $20,000. GDP per capita growth leads to the increase in the mean years of schooling, whereas the increase in the mean years of schooling does contribute to the growth of intensity of antigovernment demonstrations.
Already as a result of this chain of factors, we could expect a positive correlation between per capita GDP and intensity of antigovernment demonstrations, but not such a strong one that is observed in reality.
The Combined Effect of Political Regime and Education Factors
We should check now whether we can fully explain the positive correlation between GDP per capita and intensity of antigovernment demonstrations by the simultaneous action of factors of the political regime and education.
For this purpose, we use the ordinal logit model, where the dependent variable is the intensity of antigovernment demonstrations (split into five categories: 1 = total absence of antigovernment demonstrations; 2 = one antigovernment demonstration recorded in the given year in the given country; 3 = from two to three demonstrations; 4 = from four to nine demonstrations; and 5 = more than nine demonstrations), and the independent variables include the level of per capita GDP (divided into four categories: 1 [low income] = up to $1,160; 2 [lower middle income] = from $1,160 to $4,280; 3 [medium-middle income] = from $4,280 to $14,400; 4 [upper middle income] = from $14,400 to $20,000), dichotomized mean years of schooling (≤5 years vs. >5), and dichotomized regime type (authoritarian vs. nonauthoritarian) (see Table 7).
Results of the Ordinal Logit Model for the Intensity of Antigovernment Demonstrations as a Dependent Variable and the Following Independent Variables: GDP Per Capita, Mean Years of Schooling, and Regime Type (B Coefficients and t-Values).
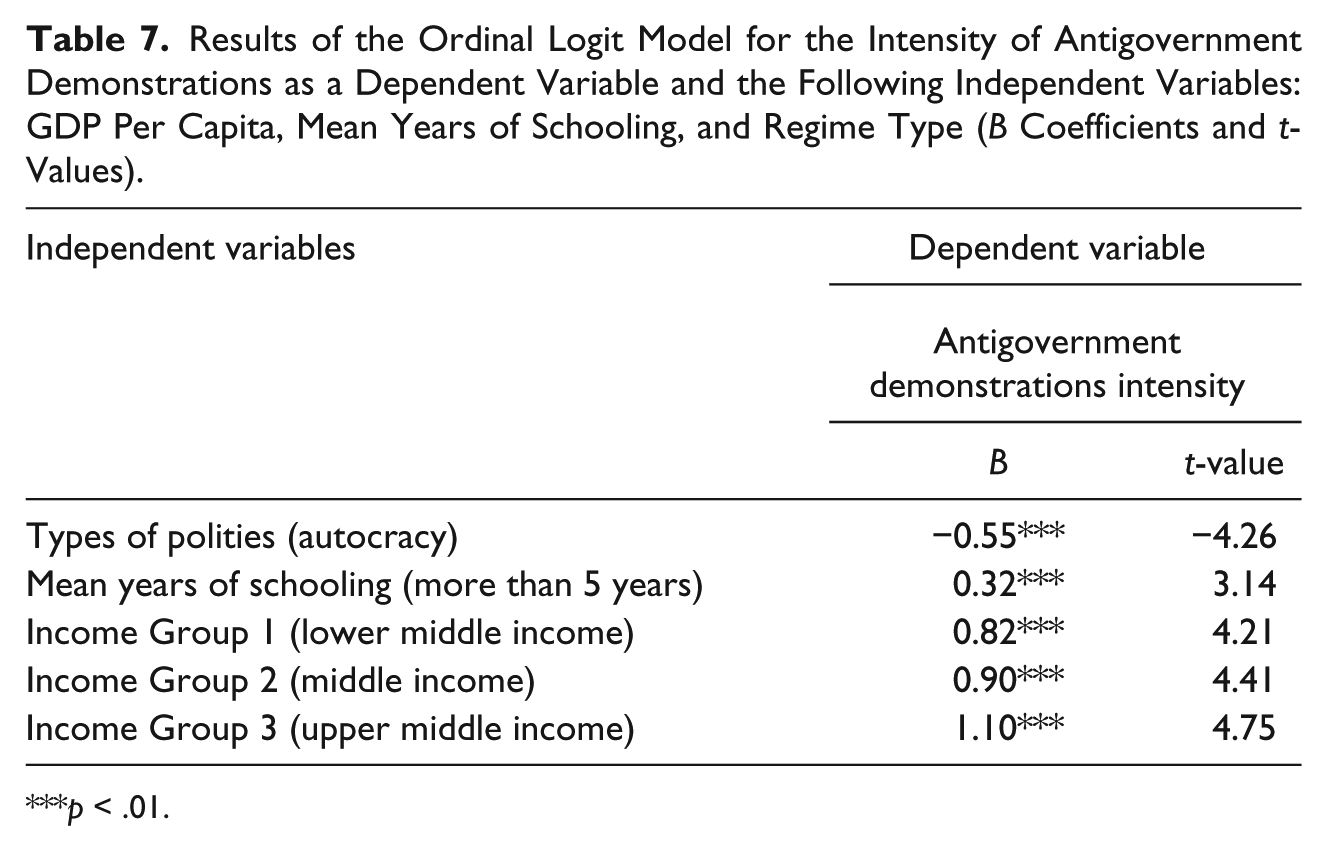
p < .01.
As we can see, for the range up to $20,000, the influence of GDP per capita does not get neutralized by the introduction into the model of regime type and years of schooling.
All three factors are significant, but the factor of GDP per capita is even much stronger than the factor of type of regime and the factor of education (see Table 8).
Results of the Ordinal Logit Model for the Intensity of Antigovernment Demonstrations as a Dependent Variable and the Following Independent Variables: GDP Per Capita, Mean Years of Schooling, and Regime Type (ORs and SEs).
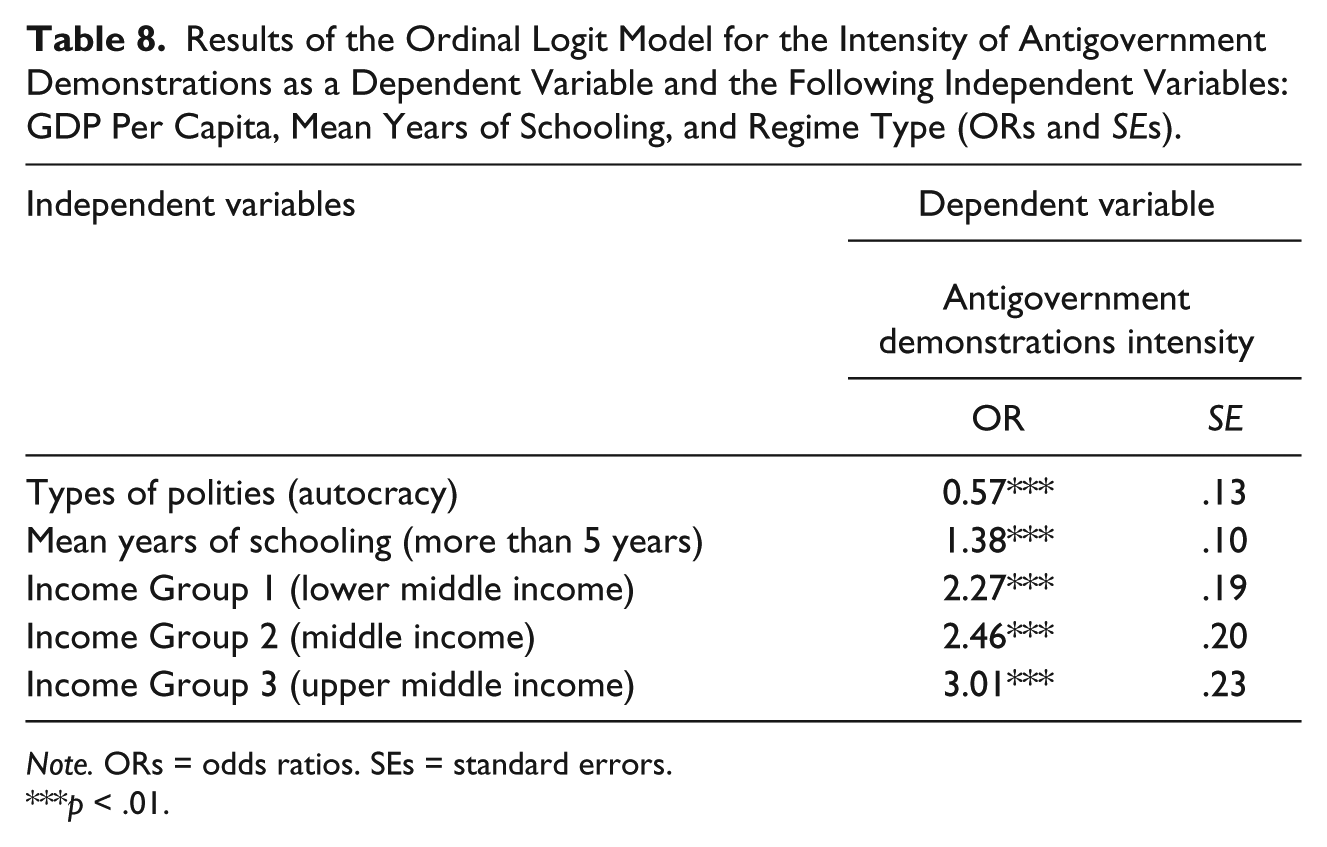
Note. ORs = odds ratios. SEs = standard errors.
p < .01.
As we see, the probability of antigovernment demonstrations in autocratic polities is 43% less likely than in non-autocratic ones. This suggests that the transition from autocratic to partly or fully democratic rule tends to be accompanied by an almost twofold (by 73%) increase in the probability of antigovernment demonstrations.
The influence of the increase in the mean years of schooling is not as powerful but still quite significant—The movement of a country from the low education category (less than 5 years of schooling) to the high education one (>5 years) is accompanied by an increase in the probability of antigovernment demonstrations by 38%.
However, even after being controlled for the regime type and education factors, the impact of the GDP per capita on the antigovernment demonstration intensity remains significant. What is more, it remains much more powerful than each of the controlling factors. Already the transition from the low-income category to lower-middle-income category increases the probability of antigovernment demonstrations by 127%, whereas the transition from the low-income category to upper-middle-income category leads to the increase in the probability of protests by 201% (and all these after being controlled for the political regime and education factors).
So, a positive correlation between GDP per capita and intensity of antigovernment demonstrations in the range of $20,000 can only partly be explained by the point that the growth of per capita GDP in this range is accompanied by increases in the mean years of schooling and the declining share of authoritarian regimes. However, to some extent, the impact of these factors explains the existence of the positive correlation between GDP per capita and intensity of antigovernment demonstrations.
Conclusion
Our research demonstrates that the correlation between GDP per capita and sociopolitical destabilization is not negative but U-shaped. The highest risks of destabilization are found in the countries with neither lowest nor highest, but average values of GDP per capita. Thus, up to certain values of GDP per capita, economic growth predicts an increased risk of sociopolitical destabilization, and only at high values of per capita GDP does further growth predict the decrease in this risk. Higher values of GDP per capita are characterized by a negative correlation between GDP per capita and risk of sociopolitical destabilization, but for low levels the relationship is positive. This positive correlation is especially apparent with respect to such an indicator of sociopolitical destabilization as the intensity of antigovernment demonstrations. Here, a strong (r = .94, R2 = .88), statistically significant positive correlation between GDP per capita and intensity of antigovernment demonstrations is observed in a very wide range (up to 20,000 dollars of 2011 at PPPs). We suggest that this correlation is partly due to the following circumstances:
GDP growth in authoritarian regimes leads to the strengthening of the movement for democracy and thus to intensified antigovernment demonstrations. And, as in our database (as well as in reality), authoritarian states constitute a very high percentage of the total number of states with low values of per capita income, and the effect of increasing internal pressure on authoritarian regimes in the direction of democratization with the economic growth to some extent (but not fully) explains the strong correlation between GDP per capita and intensity of antigovernment demonstrations for low- and middle-income countries.
In the interval of per capita GDP up to $20,000, the increase of this indicator is quite strongly correlated with the decrease in the proportion of authoritarian regimes and the increase in the share of nonauthoritarian regimes (democratic and intermediate). The presence of nonauthoritarian regimes in this range significantly positively correlates with higher intensity of antigovernment demonstrations. This is another mechanism which causes the presence of a strong positive correlation between GDP per capita and intensity of antigovernment demonstrations to occur in this range.
Positive correlation between per capita GDP and intensity of antigovernment demonstrations in the interval up to $20,000 is partly due to the fact that GDP growth leads to the growth of the level of population education that, in its turn, leads to an increase in the intensity of antigovernment demonstrations.
However, our additional analysis demonstrates that all three mechanisms taken together do not fully explain the identified correlation, which means that there should be additional mechanisms and factors (such as resource wealth, income inequality, repression, population size, and ethnolinguistic diversity) that we plan to study in our future articles.
One final remark: We suggest that the positive correlation between, on one hand, per capita GDP, and, on the other hand, the sociopolitical destabilization in general, and the intensity of antigovernment demonstrations in particular, that we observe in the range of up to 20,000 dollars may be one of the factors responsible for the existence of so-called “middle-income trap.” The middle-income trap is usually defined as “the phenomenon of hitherto rapidly growing economies stagnating at middle-income levels and failing to graduate into the ranks of high-income” (Aiyar, Duval, Puy, Wu, & Zhang, 2013, p. 3; see also, e.g., Grinin, Korotayev, & Tsirel, 2014; Kharas & Kohli, 2011; Kohli & Mukherjee, 2011; The World Bank and the Development Research Center of the State Council of the People’s Republic of China, 2012). Indeed, as we see, just when an economy approaches the escape from this trap, the destabilization intensity tends to reach very high values, which could trigger particularly strong upheavals that could throw this or that country back for many years.
Footnotes
Appendix
Declaration of Conflicting Interests
The author(s) declared no potential conflicts of interest with respect to the research, authorship, and/or publication of this article.
Funding
The author(s) disclosed receipt of the following financial support for the research, authorship, and/or publication of this article: This article is an output of a research project implemented as part of the Basic Research Program at the National Research University Higher School of Economics (HSE) in 2017 with support by Russian Science Foundation (Project No. 14-11-00634).