
Abstract
Studies of fear of crime in Europe associate country-level income inequality with fear of crime. However, by considering only income inequality these studies do not account for the effects of poverty. This article provides a more comprehensive perspective through multiple country-level indicators of income inequality and poverty and thereby provides important insights into fear of crime. The research data consist of the European Social Survey, Round 7 (2014), and country-level indicators provided by Eurostat. The results show that the Gini coefficient, S80/S20 ratio, and material deprivation are positively associated with fear of crime. The association is statistically significant but is moderate at best. However, the association between the relative median at-risk-of-poverty risk gap and fear of crime is not statistically significant. Education and income only appear to be mediators between material deprivation and fear of crime. Trust appears to be a mediator between the country-level indicators and fear of crime.
Keywords
Introduction
Fear of crime can briefly be defined as the fear of becoming a victim of a crime (Grabosky, 1995, p. 1). In Europe, cross-national comparisons have revealed large aggregate-level differences in fear of crime (e.g., Vieno, Roccato, & Russo, 2013; Visser, Scholte, & Scheepers, 2013). The countries with the highest rates of fear of crime are Britain and the Eastern European and Baltic countries. In these countries, approximately 30% of the total population reports fear of crime. The lowest rates of fear are reported in the Nordic countries and a few Central European countries (Austria, the Netherlands, and Switzerland), where approximately 10% to 20% of the population reports fear of crime. Most Central European and Southern European countries rank in the middle. In these countries, approximately 20% of the population reports fear. While it might be assumed that fear of crime is a result of actual levels of crime, as we discuss later, the relationship between the two is not that clear.
This study examines fear of crime in Europe by exploring the explanatory effects of country-level income inequality and poverty on fear of crime. In previous studies, inequality has been associated with many negative and undesirable issues, such as the uneven chances of upward social mobility and wider gaps in education levels (e.g., Sen, 1992; Therborn, 2013; Wilkinson & Pickett, 2009). At the country level, prior findings suggest that inequality is associated with health and social problems, distrust, unhappiness, and dissatisfaction with life (e.g., Gunnarsdottir, Hensing, Povlsen, & Petzold, 2015; Olivera, 2015; Rözer & Volker, 2016; Schröder, 2016; Vauclair et al., 2015).
Many previous studies on inequality and fear of crime in Europe focus on the individual or regional levels (e.g., Kemppainen, Lönnqvist, & Tuominen, 2014; Moore & Shephard, 2006; Nilsson & Estrada, 2003). These studies associate wider inequality with stronger fear of crime. At the individual level, the poor tend to have a higher fear of crime rate than the rich do, perhaps because economic and material losses hit the poor harder (Pantazis & Gordon, 1994, pp. 47-55). The rich are also more capable of protecting themselves from victimization by buying expensive safety and surveillance equipment and associating less with individuals who might commit a crime against them (Grabosky, 1995, p. 2). The divide between rich and poor also continues at the regional level. More affluent areas tend to have a lower fear of crime rate than poorer areas do (Kemppainen et al., 2014, pp. 6-20).
Only a handful of studies of fear of crime (Vauclair & Bratanova, 2017; Vieno et al., 2013; Wilkinson & Pickett, 2009) consider country-level inequality. Furthermore, the existing literature concentrates on the association between the Gini coefficients and fear of crime, completely excluding other country-level indicators of inequality and poverty. According to Amartya Sen (1992, p. 28), examining income inequality alone does not reveal anything about the physical and social characteristics that shape people’s lives. Thus, it does not reveal whether it is indeed income inequality or the economic position or living standards of the poor that affect the dependent variable under consideration.
With the above discussion in mind, this study contributes to the research on the mechanisms behind the association between fear of crime and income inequality with multiple indicators. The two research questions in this study can be summarized as follows:
As a methodological contribution, the article provides a more holistic perspective by considering multiple country-level indicators, which focus particularly on the bottom of the income distribution. From a theoretical point of view, the study contributes to the fear of crime research by focusing simultaneously on both income inequality and poverty as explanatory factors of fear of crime. In addition, the analyses contribute to research on the societal consequences of growing inequality in Europe (e.g., Therborn, 2013; Wilkinson & Pickett, 2009) by providing more specific explanations for the question of the association between inequality and societal harms, in this case fear of crime. From a policy-making perspective, it is highly relevant to know whether we should decrease income inequality in general or whether we should focus our policy measures specifically on the poor and on the bottom of the income distribution to diminish the fear of crime in society. This calls for the comprehensive research design applied in this study.
Effects of Fear of Crime
As an emotion, fear of crime can be traced to human evolution, during which individuals who learned to fear dangerous things and situations had better chances of survival (Svendsen, 2008, pp. 21-23). In this context, modern-day fear of crime can also serve as a precautionary measure that prevents people from getting into harm’s way (Melde, Berg, & Esbensen, 2016, pp. 501-504). However, fear of crime is useful only when it does not grow out of proportion.
In general, fear can be divided into four categories (Akhtar, 2013, pp. 3-4). The first is apprehension, which refers to a calm reaction to a threatening situation. The second category is dread, which combines fearful emotions and a strong will to avoid the threat in question. The third category is panic, which refers to very strong fear that can lead to hyperactivity and physical problems. The fourth category of fear is terror, which refers to extreme fear, feelings of doom, and a possible inability of physical movement and action.
In particular, fear of crime is associated with harmful physiological changes, psychological reactions, and behavioral changes. The physiological changes include breathing difficulties, dryness in the mouth and skin, or heart problems (Warr, 2000). In terms of psychological reactions, fear of crime can cause feelings of anger, outrage, frustration, violation, and helplessness (e.g., Amerio & Roccato, 2005; Warr, 2000). These feelings can also lead to anxiety, distrust of others, alienation, and dissatisfaction with life (e.g., Amerio & Roccato, 2005; Miceli, Roccato, & Rosato, 2004). In addition, fear of crime is associated with mental health issues (e.g., Foster, Hooper, Knuiman, & Giles-Corti, 2016; Miceli et al., 2004).
In terms of behavioral changes, fear of crime can lead to avoidance of people, situations, and areas or places (e.g., Barrett, Jennings, & Lynch, 2012; May, Rader, & Goodrum, 2010). It can also prompt people to take protective measures, such as carrying weapons, learning self-defense, and improving the safety of their home by, for example, installing burglar alarms and surveillance cameras (e.g., Lee & DeHart, 2007; May et al., 2010).
Fear of crime is defined as an individual-level reaction. However, many of the individual-level effects of fear of crime are also present at the community and societal levels. At one or both of these levels, fear of crime is associated with greater anxiety, lower levels of well-being, dissatisfaction with life, avoidance and protective measures, lower quality of life, and mental health issues (e.g., Amerio & Roccato, 2005; Dupere & Perkins, 2007; Visser et al., 2013).
Income Inequality, Poverty, and Fear of Crime
In the literature, there are two main suggested mechanisms to explain the association between country-level inequality and fear of crime. The first we call the crime rates and trust explanation (e.g., Wilkinson & Pickett, 2009) and the second the social cohesion and individual capabilities explanation (e.g., Vieno et al., 2013).
According to the crime rates and trust explanation, wider country-level income inequality is associated with a higher crime rate, which in turn decreases trust in other people, officials, and institutions. The decreasing trust caused by higher crime rates increases fear of crime (Wilkinson & Pickett, 2009, pp. 49-156). However, the proposed role of crime rates should be considered with caution. The crime rates in question are based on prison convictions, which, according to critics (Saunders, 2010; Simic, 2012), are not an accurate measurement of crime rates. In addition, some studies (e.g., Badiora, Popoola, & Fadoyin, 2014; Fox, Nobles, & Piquero, 2009) suggest that fear of crime does not correlate with the likelihood of becoming a victim.
Alternatively, the social cohesion and capabilities explanation sees the social separation between people and groups and the capabilities of an individual to achieve certain goals as intermediate factors between country-level income inequality and fear of crime (Vieno et al., 2013, pp. 526-529).
Both of the abovementioned explanations rely on the concept of social distance, which refers to social separation, that is, the perceived or desired remoteness between people or social groups (Lammers, Galinsky, Gordijn, & Otten, 2012; Parrillo & Donoghue, 2005). A wider social distance, that is, wider social separation between people and groups, is associated with higher rates of country-level income inequality (e.g., Lancee & Van de Werfhorst, 2012; Paskov & Dewilde, 2012). Trust, as proposed in the crime rates and trust explanation, can be seen as part of social distance, which is also associated with trust (e.g., Abanes, Scheepers, & Sterkens, 2014; Binzel & Fehr, 2013). Therefore, wider social distance is associated with a lower rate of trust, which in turn is associated with a higher rate of fear of crime (Vieno et al., 2013; Visser et al., 2013).
For the social cohesion and capabilities explanation, social cohesion is also understood through social distance, which is associated with fear of crime (Vieno et al., 2013, pp. 526-529). Greater social distance is also associated with decreasing social mobility, which refers to the movement within or between social strata (Sorokin, 1998, p. 3). A lower rate of upward social mobility, that is, a decreased chance of moving from one social group up to the next, is associated with wider country-level income inequality through decreased capabilities (Andrews & Leigh, 2009; Wilkinson & Pickett, 2009). In this case, capabilities are particularly understood through the socioeconomic factors that influence a person’s chances of protecting him or her from crime and are thus associated with fear of crime (e.g., Kemppainen et al., 2014; Vieno et al., 2013). Hence, to summarize, widening social distance and decreasing capabilities are believed to increase fear of crime.
Despite the two differing explanations of the mechanism, previous studies do find associations between country-level income inequality and fear of crime (e.g., Vauclair & Bratanova, 2017; Vieno et al., 2013; Wilkinson & Pickett, 2009). Indicators of country-level income inequality (such as a Gini coefficient) measure the distribution of income in general. However, to examine the mechanisms of fear of crime from the perspective of social distance and capabilities, we should also focus on the bottom of the income distribution. Therefore, in addition to income inequality, this article examines the explanatory power of the median at-risk-of-poverty risk gap and the level of material deprivation in society. Material deprivation is a measurement of living conditions (Israel, 2016, p. 622), and the at-risk-of-poverty gap refers to the differences between the median income of people below the relative income poverty threshold and the income threshold (see, e.g., Van Steen & Pellenbarg, 2014, p. 237).
It can be assumed that a larger gap between rich and poor is associated with fear of crime. Some previous results (Larsson, 2009; Pantazis, 2000; Pantazis & Gordon, 1994) also associate poverty with a stronger fear of crime. In addition, poverty has been associated with decreasing trust, health, and well-being (e.g., Cheung & Lucas, 2016; Gunnarsdottir et al., 2015; Osborne, Sibley, & Sengupta, 2015). Hence, it can be assumed that poverty is also associated with fear of crime because of its widely acknowledged negative impact. Therefore, the following hypothesis is presented:
To further examine the associations between each country-level indicator and fear of crime, the study examines whether the association between the Gini coefficient and fear of crime weakens when other country-level indicators of income inequality and poverty are introduced. This is done to test to what extent the possible association between the Gini coefficient and fear of crime can be explained with the other country-level measures. The Gini coefficient is a very common measure of inequality. In prior research (e.g., Vauclair & Bratanova, 2017; Vieno et al., 2013; Wilkinson & Pickett, 2009), the Gini coefficient is strongly associated with fear of crime. However, the Gini coefficient is a measure that indicates the degree of income redistribution that is needed to achieve income equality (Jenkins & Van Kerm, 2009, p. 50). Therefore, the Gini coefficient does not reveal the distance between incomes of the rich and the poor. This distance can be observed, for example, by examining the relative distance in incomes between the richest 20% and the poorest 20% of the population (Drezner, Drezner, & Hulliger, 2014, pp. 166-167). In addition, the Gini coefficient does not reveal the actual extent of poverty. Hence, the following hypothesis is presented:
Individual-Level Independent Factors
The current study also considers the multiple individual-level independent factors that prior research associates with fear of crime. Age, gender, income, education, trust, the effects of media, and previous experiences of crime all seem to play a role as independent variables or mediators. It is commonly thought that the old are more fearful of crime than the young (Grabosky, 1995, p. 9). However, some studies argue that it is questionable to compare young and old because they usually fear different types of crime (e.g., Tulloch, 2000; Vieno et al., 2013).
In addition, women are more fearful of crime than men (e.g., Badiora et al., 2014; Jorgensen, Ellis, & Ruddell, 2013; Vieno et al., 2013). However, these results have also been criticized because men have a tendency to downplay their fears, which distorts the results (Walklate, 2007, p. 93). Moreover, men and women fear different types of crime (Grabosky, 1995, p. 8).
Prior findings also associate low income with a stronger fear of crime (e.g., Kemppainen et al., 2014; Vieno et al., 2013). These results suggest that the poor are more fearful of crime than the rich. In addition, people with a lower level of education are more fearful of victimization than are people with a higher level of education (e.g., Kemppainen et al., 2014; Vieno et al., 2013). Demographic and socioeconomic factors regulate a person’s capacity to protect him or herself from crime. To some degree, they also affect a person’s chances of getting into situations in which he or she might become a victim.
Previous findings also suggest that distrust is associated with stronger fear of crime (e.g., Vieno et al., 2013; Visser et al., 2013). The media creates a stronger fear of crime, especially through the prevalence of television and newspaper news coverage but also through violent and crime-related TV series (e.g., Korander, 2000; Smolej, 2011). An individual’s previous experiences of crime, as a victim or through someone else’s experience, also increase fear of crime (e.g., Amerio & Roccato, 2005; Miceli et al., 2004). However, according to some results, fear of crime can vary depending on the type of crime in question. For example, victims of assault can have a considerably lower rate of fear of crime than can victims of robberies (Grabosky, 1995, p. 10). Other results (Moore & Shephard, 2006) indicate that previous victimization of burglary, theft, or assault does not significantly affect fear of crime. The results here are mixed and should be considered with caution. Considering all of these conditions, the hypothesis concerning individual-level factors is as follows:
Method
Data and Measures
The data on the dependent variable and individual-level independent variables come from Round 7 of the European Social Survey (ESS) from 2014 (N = 37,623). The data consist of 20 European countries (Table 1). 1 This study uses the dweight variable proposed by the ESS. 2 The weight accounts for the differences in size of the country samples.
Descriptive Statistics.
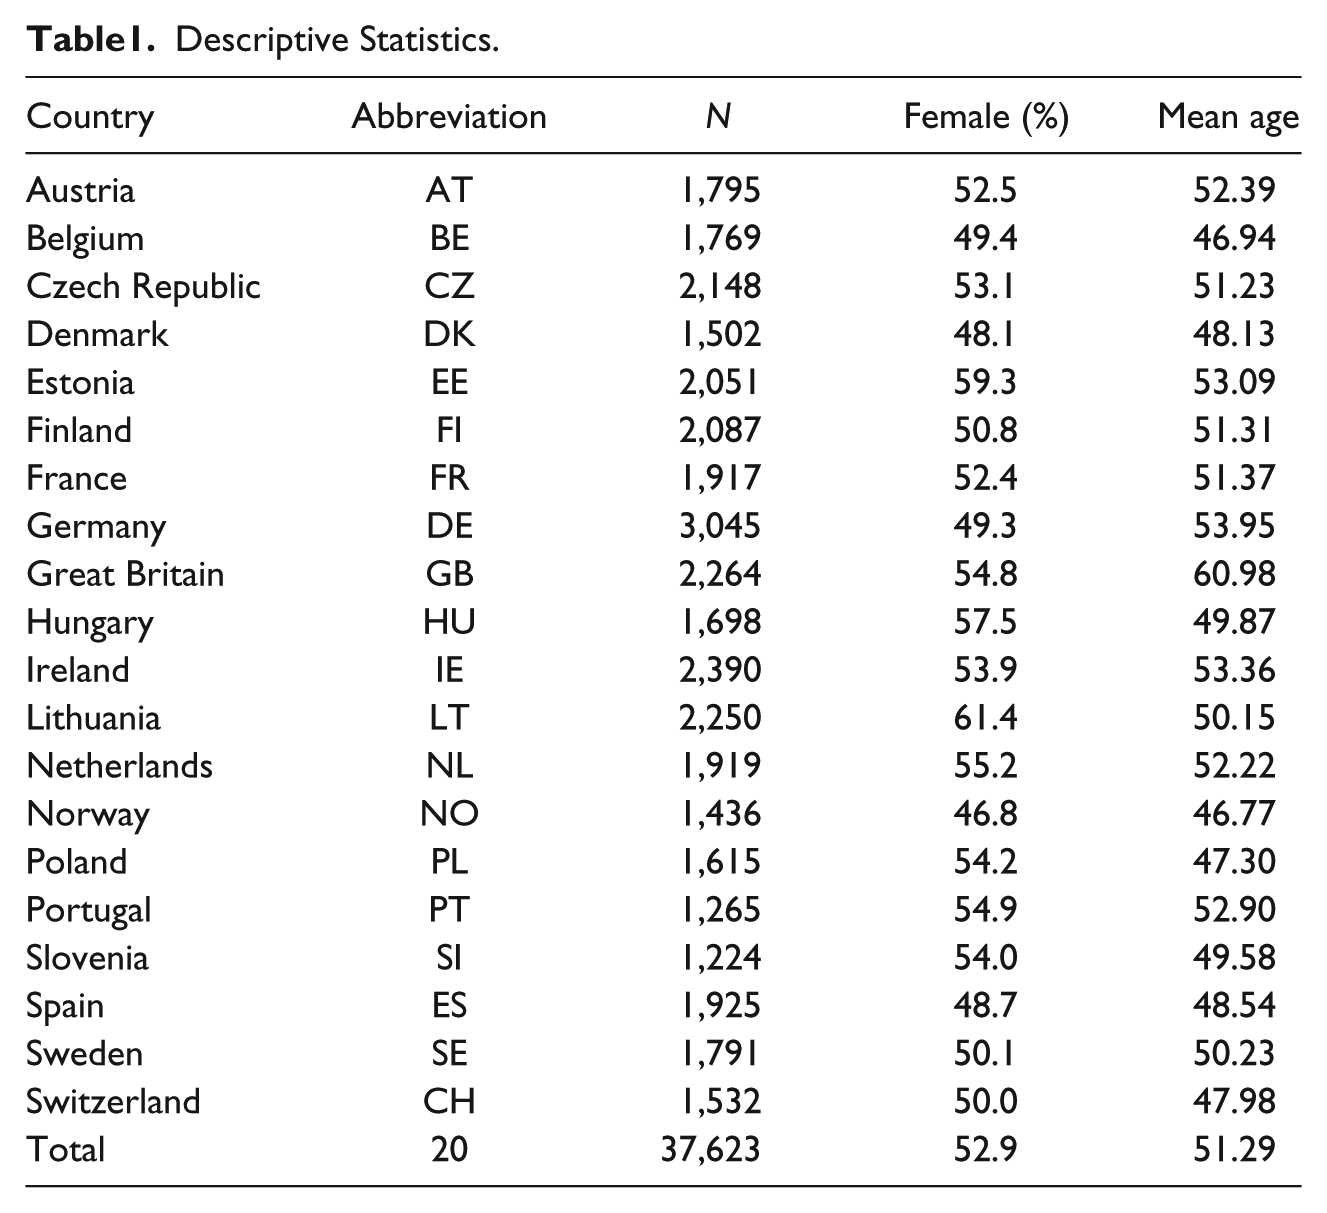
With regard to the dependent variable, fear of crime is measured by asking the respondents how safe do you feel walking alone in this area after dark? 3 The response choices are very safe, safe, unsafe, and very unsafe. This is a very common measurement of fear of crime (e.g., Vauclair & Bratanova, 2017; Vieno et al., 2013; Visser et al., 2013). For the purpose of this study, very safe and safe are combined as safe (= 0). In addition, unsafe and very unsafe are combined as unsafe (= 1). The dependent variable was dichotomized because of the significantly lower amount of cases in the categories depicting stronger fear.
The individual-level independent variables are age, gender, income satisfaction, education, trust, media, and previous crime experiences. 4 The effect of media is represented by TV watching. Previous crime experiences include both the respondent’s and his or her household members’ experiences of assaults or burglaries.
The data on the country-level indicators of income inequality and poverty are provided by Eurostat and defined briefly below. While income inequality is measured with Gini coefficients and S80/S20 ratios, poverty is studied with the relative median at-risk-of-poverty risk gap and material deprivation. 5 With all of these indicators, the mean value of the 2013 and 2014 values is used, and the variables are categorized to obtain more informative results. 6
The Gini coefficient measures how a country’s income inequality is situated between equality and inequality, with 0 being complete equality and 1 (or 100%) complete inequality (Jenkins & Van Kerm, 2009, p. 50). The S80/S20 ratio, also known as the Income quintile share ratio, measures the distance between the incomes of the richest 20% and the poorest 20%. The higher the value is, the wider the distance is (Drezner et al., 2014, pp. 166-167).
The economic distance of the poor is measured by the relative median at-risk-of-poverty risk gap. This refers to the distance between the poverty threshold and the median income of households under the poverty threshold. The distance is measured in percentages, with higher percentages represent a wider distance between the two (Eurostat, 2016b).
Finally, material deprivation refers to economic distress that leads to an inability to pay bills, go on holidays, purchase basic food staples and durable goods, and cover the high cost of heating (Israel, 2016, p. 622). The indicator of material deprivation in this study measures the percentage of severely materially deprived people. The higher the percentage is, the larger the proportion of material deprivation is (Eurostat, 2016a).
Data Analysis
Preliminary analysis is performed through a descriptive analysis. To analyze the effects of the country- and individual-level factors, the main research method used is mixed effects logistic regression, with the country variable as a defining factor. The mixed effects model accounts for the hierarchical structure of the data and enables the inclusion of country- and individual-level factors in the same model (Demidenko, 2008; Ellonen, 2006). A possible mediating effect is tested by standardizing the individual-level independent variables. 7 It has been suggested that the regular estimates and odds ratios of logistic regression are not comparable between models in multilevel analysis (see, e.g., Mood, 2010). Consequently, this study estimates average marginal effects to assess the probability of the possible associations. 8 In general, a multilevel model, such as mixed effects logistic regression, produces more accurate standard errors, confidence intervals, and significance levels for estimates than does a single-level model (e.g., Ellonen, 2006; Gelman, 2006; Snijders & Roel, 1999). Therefore, using a multilevel analysis in this study gives us more accurate results than would using a single-level analysis.
Many studies of fear of crime (e.g., Jorgensen et al., 2013; Kemppainen et al., 2014; Vauclair & Bratanova, 2017; Vieno et al., 2013) use multilevel models. However, the use of the country variable as a defining factor is uncommon in previous research. Therefore, this study differs from many previous studies by including the country variable in the analysis as a defining factor. Thus, the differences between countries are considered more accurately in the model.
Analysis
In this section, we report the results of descriptive (bivariate) analyses and from the mixed effects analyses.
Descriptive Analysis
The descriptive analysis in Figure 1 shows an association between income inequality, poverty, and fear of crime. It appears that generally, countries with higher rates of inequality and poverty also have a higher level of fear of crime. Therefore, there appears to be a positive association between country-level indicators and fear of crime. The trend lines in Figure 1 illustrate this, although the strength of the association varies. The results also show some variations between countries. For example, Estonia, Lithuania, Portugal, and Spain all have a similar Gini coefficient (approximately 35%), but also significant differences in fear of crime. For example, while approximately 38% of the respondents in Lithuania report fear of crime, only 17% of the Spanish respondents report fear of crime. Hence, the role of country-level income inequality is not entirely clear when the analysis is limited to only the Gini coefficient.
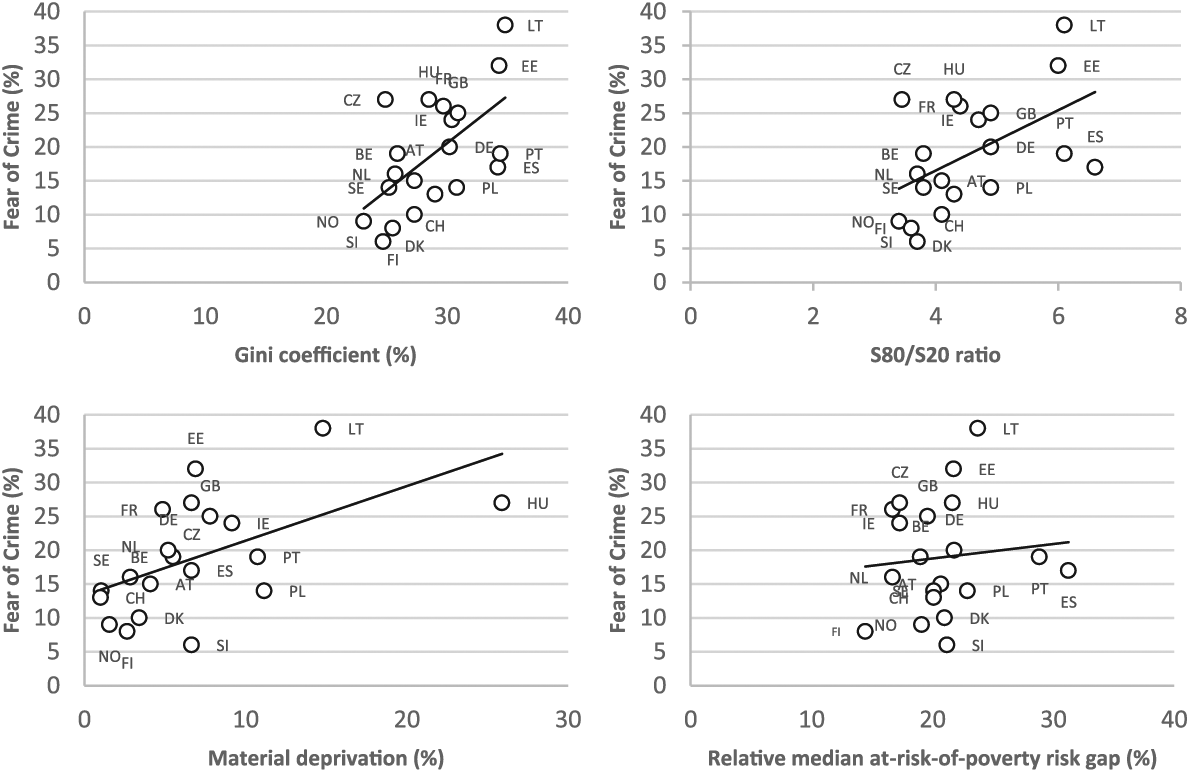
Twenty European countries by income inequality, poverty, and fear of crime.
The results of other indicators of income inequality and poverty in Figure 1 indicate that the association between fear of crime and income inequality or poverty depends, to some extent, on a given indicator. The rate of dispersion between countries is lower for the Gini coefficients than it is the other indicators. Based on the dispersion between countries, the association between Gini coefficients and fear of crime can be seen as being medium-strong. This also indicates that income inequality, when measured using Gini coefficients, is more strongly associated with fear of crime than it is with poverty. However, the rate of dispersion between countries as seen through the S80/S20 ratios and material deprivation is not that much higher. Therefore, based on Figure 1, the association among the S80/S20 ratios, material deprivation, and fear of crime is moderate. However, in the case of material deprivation, two countries (Hungary and Lithuania) are anomalies. Without these countries, the association between material deprivation and fear of crime would be even stronger.
The relative median at-risk-of-poverty risk gap differs visibly from the other indicators. The rate of dispersion between countries is quite high and linearity is difficult to detect, although the trend line indicates a weak positive association. Despite this finding, the descriptive analysis supports the assumption that, when measured through country-level indicators, income inequality and poverty are positively associated with fear of crime (H1a). However, it does not support the assumption that the association is strong (H1b). It also does not answer the question regarding the association between the country-level and individual-level independent factors which will be addressed in the next section.
Mixed Effects Analyses
Table 2 shows the average marginal effects of the different indicators of country-level income inequality and poverty (different rows), with fear of crime as the dependent variable. Model 1 in Table 2 shows that the higher Gini coefficients, the higher S80/S20 ratios, and stronger material deprivation are associated with stronger fear of crime. Thus, these indicators are positively associated with fear of crime. This supports hypothesis H1a.
Average Marginal Effects of the Mixed Effects Logistic Regression Models of Income Inequality, Poverty, Fear of Crime, and Individual-Level Independent Factors.
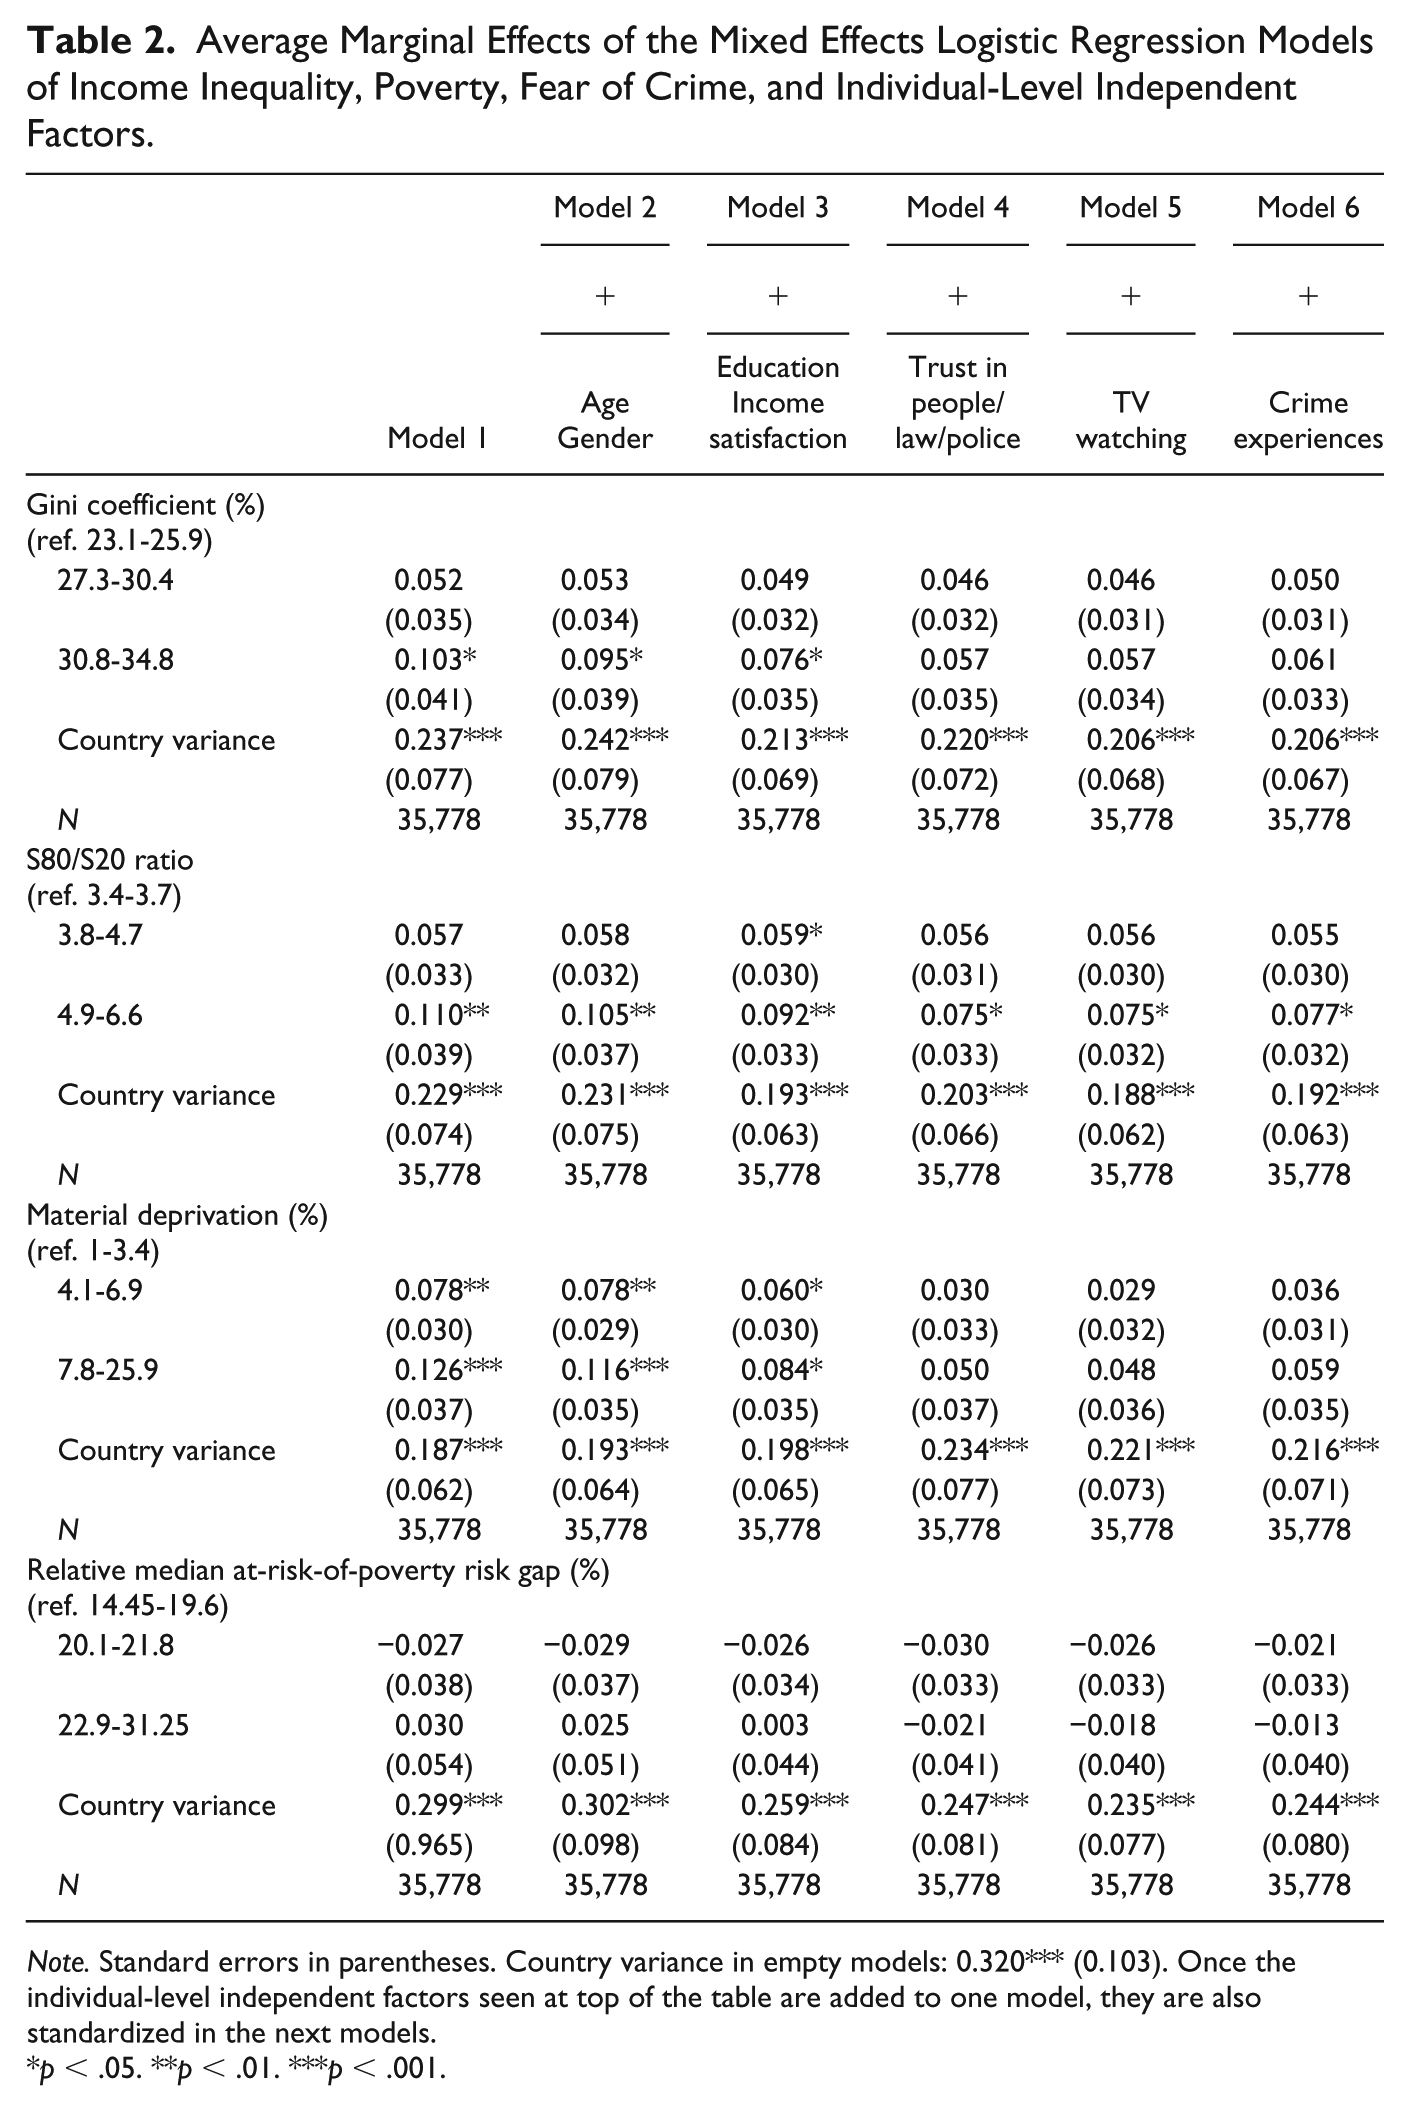
Note. Standard errors in parentheses. Country variance in empty models: 0.320*** (0.103). Once the individual-level independent factors seen at top of the table are added to one model, they are also standardized in the next models.
p < .05. **p < .01. ***p < .001.
Model 1 also shows that the difference in fear of crime between countries with low- and medium-level Gini coefficients or S80/S20 ratios is not statistically significant. The difference between countries with low and high Gini coefficients or S80/S20 ratios is moderate and statistically significant. With regard to material deprivation, the difference between low- and medium-level countries is weak but statistically significant. The difference between countries with low and high material deprivation is moderate and statistically very significant. However, these findings do not support the assumption of a strong association between the country-level indicators and fear of crime (H1b).
As shown in the descriptive analysis above, the relative median at-risk-of-poverty risk gap’s association with fear of crime differs significantly from the other indicators. The wider inequality or stronger poverty, higher rate of fear of crime phenomenon, which was observed with the other indicators, does not apply to the risk gap. In addition, the differences between a low and medium-level at-risk-of-poverty risk gap and a low and high at-risk-of-poverty risk gap are not statistically significant. All of this means that neither hypothesis H1a nor H1b obtains support.
Models 2 to 6 of Table 2 test the assumed role of the individual-level factors (H3). Model 3 shows that the statistical significance of the association between material deprivation and fear of crime weakens when education and income satisfaction are standardized. Therefore, education and income satisfaction appear to be mediating factors. Model 4 shows that the statistical significance of the association between all of the country-level indicators and fear of crime weakens when trust is standardized. Therefore, trust also appears to be a mediating factor. All in all, H3 only obtains partial support.
Table 3 shows the association between the Gini coefficients and fear of crime (Model 1) with the S80/S20 ratios and material deprivation standardized (Models 2 and 3). The at-risk-of-poverty risk gap is not included in this analysis, as the analysis above indicates that the at-risk-of-poverty risk gap is not significantly associated with fear of crime. The analysis shown in Model 2 indicates that the Gini coefficients and the S80/S20 ratios cancel each other out. Thus, both of these measures are somewhat equally relevant with regard to fear of crime. Model 3 shows that standardizing material deprivation weakens the effect of the Gini coefficients. This indicates that in addition to income inequality in general, a highly relevant aspect of the fear of crime is the living standard of the poor in a given society. The results offered by the analysis in Table 3 support the assumption in H2.
Average Marginal Effects of the Mixed Effects Logistic Regression Model Depicting Indicators of Income Inequality and Poverty in Relation to the Gini Coefficient and Fear of Crime.

Standard errors in parentheses. Country variance in empty models: 0.320*** (0.103).
p < .05. **p < .01. ***p < .001.
Summary and Discussion
In response to the deficiencies of income inequality research mentioned by Amartya Sen (1992), the purpose of this study was to examine the association among income inequality, poverty, and fear of crime in Europe. The results showed a positive association between fear of crime and the country-level indicators of inequality and poverty. These results support the findings of previous studies. The previous findings of a higher rate of country-level income inequality being associated with a stronger fear of crime obtain support from the results. However, the differences between those countries with low- and medium-level income inequality were weak and often not statistically significant. The differences between those countries of low- and high-income inequality were statistically significant but moderate at best.
The association between income inequality and fear of crime found here is weaker than that found in previous country-level studies of Europe (e.g., Nilsson & Estrada, 2003; Wilkinson & Pickett, 2009) that reported a stronger association. This may be due to research methods. This study uses a multilevel modeling, in contrast to previous studies, which concentrated on simple logistic regressions (e.g., Nilsson & Estrada, 2003) or, in some cases (e.g., Wilkinson & Pickett, 2009), descriptive analysis. It can be argued that a multilevel model is more thorough in its analysis than are the other methods mentioned. Therefore, the differences in the results are not wholly unexpected. Furthermore, some studies (e.g., Nilsson & Estrada, 2003) concentrated on the regional level, which is a different setting than the country-level setting examined in this study. This may also explain the differences in the results.
Aside from its methodological contribution, the novelty of the study is that it examined the mechanisms behind the association between fear of crime and income inequality with multiple indicators, which focus specifically on the bottom of the income distribution. Of the four country-level indicators considered in this study, the Gini coefficients, S80/S20 ratios, and rates of material deprivation provided rather similar results regarding their association with fear of crime. They were all positively associated with fear of crime. However, the connection between these indicators and fear of crime was moderate at best, with the strongest connection being between material deprivation and fear of crime. Nevertheless, the results clearly show that income inequality and poverty play a part in the formation of fear of crime. The findings therefore contribute to the literature, which suggests that inequality is corrosive to society by affecting people’s everyday lives in multiple ways, such as by increasing fear of others (see, e.g., Therborn, 2013; Wilkinson & Pickett, 2009). In addition, the results highlight the importance of material deprivation. Consequently, from a policy-making point of view, to diminish the fear of crime in society, we should decrease inequalities by policy measures that would increase the living standard of the poor.
However, the relative median at-risk-of-poverty risk gap differed from the other indicators. First, the association between the at-risk-of-poverty risk gap and fear of crime was very weak and statistically insignificant. Second, the association was not positive, as was the case with the other indicators. Ultimately, the results indicated that the relative median at-risk-of-poverty risk gap is not a significant factor in the formation of fear of crime. Thus, the finding is, at least in the context of economic distance at the bottom of income distribution, contrary to the thesis that social distance would explain the fear of crime.
This study also examined how different individual-level independent factors affect the association between country-level indicators and fear of crime. The results suggest that some individual-level factors play apart. In particular, trust had a significant effect. Education and income satisfaction also affect the association between material deprivation and fear of crime. These results are in line with previous studies that identified these individual-level factors as being important predictors of fear of crime.
The crime rates and trust explanation and the social cohesion and capabilities explanation offered by previous studies for the association between inequality and fear of crime also obtain some support from the results. Trust is an important factor in both of these explanations and in the results of this study. In this case, trust can be seen as a manifestation of social distance, which in turn appears to be an important mechanism behind fear of crime. Education and income satisfaction, which affect the association between material deprivation and fear of crime, can be seen through the capabilities explanation. The insignificant effects of demographic and socioeconomic factors, the effect of media, and previous experiences of crime were unexpected as previous studies have identified them as playing a role in the formation of fear of crime. It may be that the country-level indicators hide their effect.
To summarize, this study did achieve its goal of adding to the literature on the association among income inequality, poverty, and fear of crime in Europe. In addition to inequality research, it contributed to the research on fear of crime by considering multiple country-level dependent factors. From a methodological point of view, the debate surrounding the measurement of the fear of crime has been raging between fear researchers for some time, and no consensus has been reached. This study used the more abstract Feeling of safety of walking alone in a local area after dark variable, which has been used in many previous studies.
Ideally, the best measurement would probably be a variable that distinguishes fear related to different types of crime. However, this is rarely possible to achieve because of the complexity of the phenomenon in question and the limitations of the available data. The data used in this study certainly do not offer this kind of insight. Therefore, it can be argued that the variable used in this study is the best one available. After all, it does include, through its abstract nature, fear related to several types of crime. In this capacity, it is a much more useful measurement of fear of crime than a variable that focuses on one specific type of crime.
In addition, the study showed that the Gini coefficient is a useful indicator. The coefficient offers an indicator that is helpful in comparing inequality in areas and countries. However, as demonstrated in the analyses, countries with similar Gini coefficients can have different rates of fear. In this context, the inclusion of poverty in the analysis provides a way to more reliably compare rich and poor countries. It also accounts for the fact that fear of crime, in addition to inequality, can be influenced by different types of physical and social characteristics depending on the country in question. This type of broader examination should be considered in future studies to obtain more comprehensive results and more specific policy recommendations.
Finally, such an examination should also be considered in future studies focusing on the individual and regional levels. Most previous studies of these levels, as is the case with country-level studies, do not examine inequality and poverty in this kind of broader way. Therefore, this would be an important addition to existing research, as would an examination of trends regarding inequality, poverty, and fear of crime. For example, the figures of income inequality from 2006 to 2017 provided by Eurostat (2018) reveal that the rate of inequality in Europe does not stay at the same level but rather is constantly in motion, that is, rising or falling. Therefore, the association among changing inequality, poverty, and fear of crime should be more closely considered to obtain more comprehensive information about fear of crime. This type of research is also rare among previous studies, which makes it even more justifiable.
Footnotes
Appendix
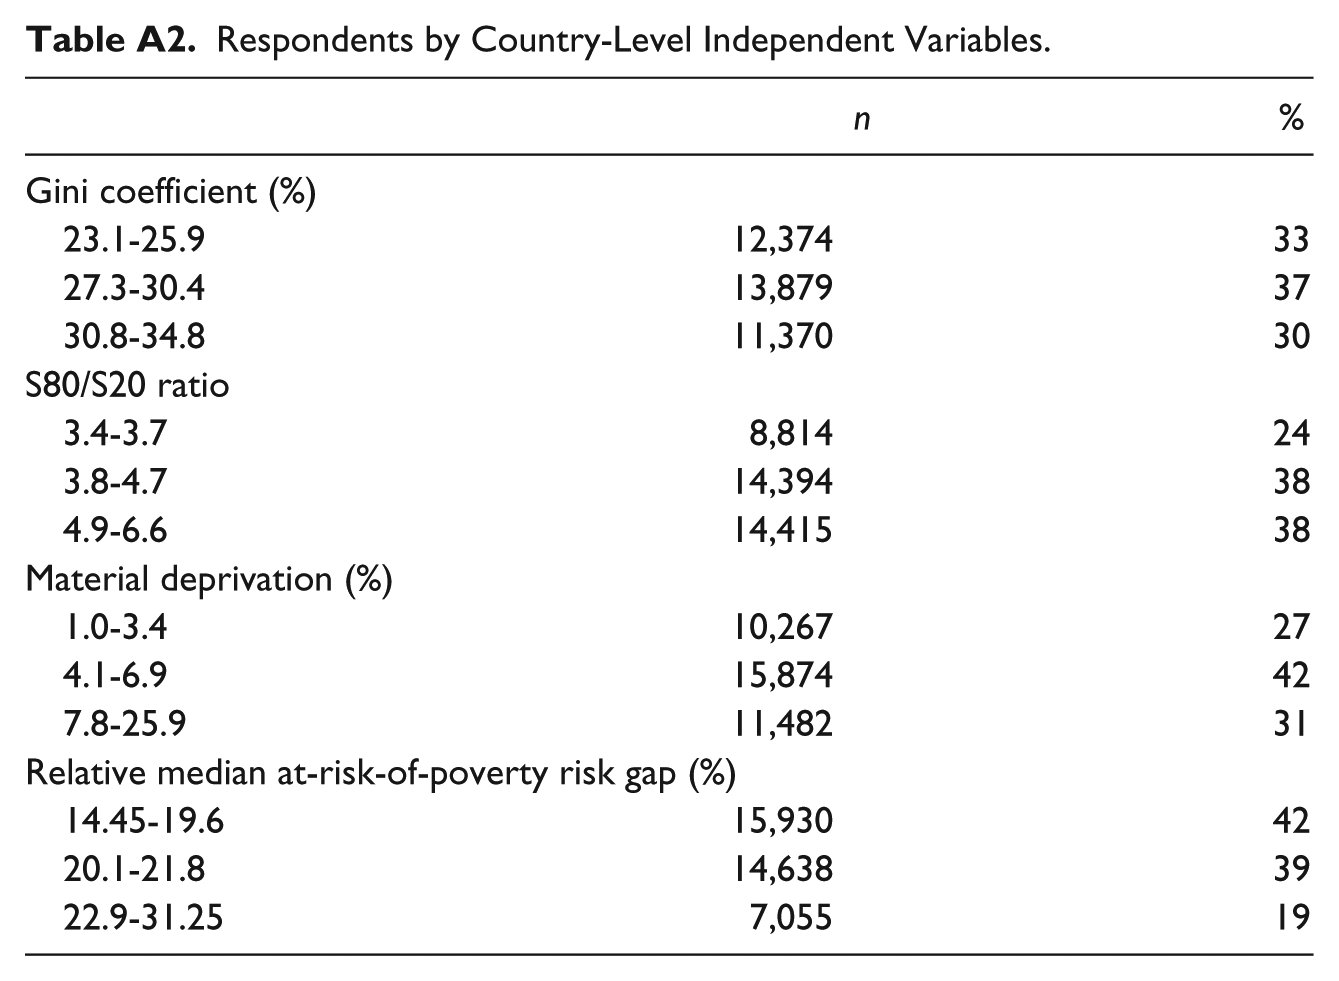
Respondents by Country-Level Independent Variables.
| n | % | |
|---|---|---|
| Gini coefficient (%) | ||
| 23.1-25.9 | 12,374 | 33 |
| 27.3-30.4 | 13,879 | 37 |
| 30.8-34.8 | 11,370 | 30 |
| S80/S20 ratio | ||
| 3.4-3.7 | 8,814 | 24 |
| 3.8-4.7 | 14,394 | 38 |
| 4.9-6.6 | 14,415 | 38 |
| Material deprivation (%) | ||
| 1.0-3.4 | 10,267 | 27 |
| 4.1-6.9 | 15,874 | 42 |
| 7.8-25.9 | 11,482 | 31 |
| Relative median at-risk-of-poverty risk gap (%) | ||
| 14.45-19.6 | 15,930 | 42 |
| 20.1-21.8 | 14,638 | 39 |
| 22.9-31.25 | 7,055 | 19 |
Declaration of Conflicting Interests
The author(s) declared no potential conflicts of interest with respect to the research, authorship, and/or publication of this article.
Funding
The author(s) disclosed receipt of the following financial support for the research, authorship, and/or publication of this article: This research is supported by the Strategic Research Council of the Academy of Finland (decision numbers: 293103 and 314250).