
Abstract
Individualism and collectivism are some of the most widely applied concepts in cultural and cross-cultural research. They are commonly applied by scholars who use arithmetic means or sum indexes of items on a scale to examine the potential similarities and differences in samples from various countries. For many reasons, cross-cultural research implicates numerous methodological and statistical pitfalls. The aim of this article is to summarize some of those pitfalls, particularly the problem of measurement non-invariance, which stems from the different understandings of questionnaire items or even different character of constructs between countries. This potential bias is reduced by latent mean comparisons performed with Multigroup Confirmatory Factor Analysis and the Measurement Invariance procedure within a Structural Equation Modeling framework. These procedures have been neglected by many researchers in the field of cross-cultural psychology, however. In this article, we compare ‘traditional’ (comparison of arithmetic means) and ‘invariant’ (latent mean comparison) approaches and provide necessary R source codes for replications of measurement invariance and latent mean comparisons within other scales. Both approaches are demonstrated with real data gathered on an Independent and Interdependent Self-Scale from 1386 participants across six countries (Slovenia, Croatia, Bosnia and Herzegovina, Serbia, Macedonia and Albania). Our results revealed considerable differences between the ‘invariant’ and ‘traditional’ approaches, especially in post-hoc analyses. Since ‘invariant’ results can be considered less biased, this finding suggests that the currently prevalent method of comparing the arithmetic means of cross-cultural scales of individualism and collectivism can potentially cause biased results.
Keywords
Introduction
Cultural context has a crucial and inherent effect on human psychological processes shaping their perception, cognition, emotion and behaviour. Many influential cases of research have repeatedly demonstrated the effect of culture, often leading to questioning (culturally) universalistic psychological theories (for review, see Nisbett, 2003; Berry et al., 2011; Keith, 2013; Matsumoto & Hwang, 2019; Cohen & Kitayama, 2019; Shiraev & Levy, 2020). From this perspective, it is evident that credible and valid psychological science should take into consideration the influence of culture on essential psychological processes and other phenomena which stem from them. Research which ignores or overlooks the effects of cultural environments can therefore be less than rigorous, can be biased, can offer limited scope for interpretation and can suffer in its lack of interpretive power. Consequently, some scholars even claim that the methodological and statistical principles (including the formulation of theories and hypotheses) used in the cross-cultural field must be incorporated and integrated into the underlying research aspects of mainstream psychological science (e.g. Cheung, 2012; Cohen, 2009; Hardin et al., 2014; Brady et al., 2018; Henrich et al., 2010a; Kashima, 2015; Matsumoto, 2001; Sternberg, 2014; Wang, 2016).
This claim may be perceived by other scholars as bold but appears to be justified in respect to the history of psychological science, which was, in some parts of its history, riddled with stereotypes and racial and ethnic biases (i.e. ‘scientific racism’, see Thomas & Sillen, 1972; Leong et al., 2012; Richards, 2012), with a tendency towards being ethnocentric and extremely universalistic (for review, see Jahoda & Krewer, 1997; Triandis, 2007; Keith, 2013; Klineberg, 1980; Lonner, 2013). Consequently, psychology, in general, was criticized for its ignorance of the socio-cultural background of psychological processes and for its lack of culturally and ethnically diverse research samples. Since the bulk of psychological theories has been defined by North American authors and verified on respective samples in the past (e.g. Adair et al., 2002; Bauserman, 1997; De Barona, 1993; Iwamasa & Smith, 1996; Loo et al., 1988; May, 1997; Graham, 1992; Guthrie, 1976; Ponterotto, 1988; Sue, 1999), and quite recently (e.g. Adair & Huynh, 2012; Arnett, 2008; Cheon et al., 2020; Henrich et al., 2010; Nielsen et al., 2017; Rad et al., 2018), the generalizability and validity of proposed psychological constructs are, without further evidence, very limited beyond the ‘Western, Educated, Industrialized, Rich and Democratic’ (WEIRD; Henrich et al., 2010) societies, which constitute just a minority of the world’s population.
Even though some psychological research often ignores cultural influences (Brady et al., 2018; Kashima, 2015), a strictly universalist approach (‘culture doesn’t matter’) is nowadays relatively scarce (Wang, 2016). Since an accepted consensus now exists among scholars on the effect of culture on individuals, ‘culture’ is increasingly taken into account in psychological research. Nevertheless, it is necessary to point out that the mere involvement of ‘culture’ in research is insufficient. Cross-cultural research requires the employment of relatively sophisticated methodological and statistical procedures to reduce the various biases which are unique to such research and to establish comparability between countries (Berry et al., 2011). Without these procedures, cross-cultural studies suffer a lack of validity. The aim of the present article is therefore to introduce one of the most challenging issues in cross-cultural research, that is, measurement invariance testing, and demonstrate it through data gathered from several European countries with an individualism/collectivism scale. To be as illustrative as possible, we chose to present two approaches to analyzing data (one approach takes into account measurement invariance, the other does not) and compare their results.
Cross-Cultural Comparability
Cross-cultural research is struggling with various methodological and statistical pitfalls (for review, see Buil et al., 2012; Fischer & Poortinga, 2018; Matsumoto & Yoo, 2006; Van de Vijver, 1998; Van de Vijver & Leung, 2000; Van de Vijver & Tanzer, 2004). These pitfalls need to be addressed in order to achieve a desirable comparability of results obtained from different cultures. A sufficient level of comparability in measurement outcomes is ensured by various types (Van de Vijver & Leung, 2011), or, if they possess an internal hierarchical structure, by levels (Poortinga, 1989) of equivalence. Even though over 50 types of equivalence have been defined in the literature (Johnson, 1998), the most commonly used taxonomy distinguishes construct equivalence, method equivalence, item equivalence and invariance verified at the measurement level (Van de Vijver, 1998). These are discussed in more detail in the following sections.
Since the terminology of cross-cultural methodology might be sometimes misleading, in this text we decided to explicitly distinguish between ‘cross-cultural equivalence’ and ‘measurement invariance’ (see also Welzel et al., 2021). Even though these two terms overlap and are often used in an interchangeable manner, cross-cultural equivalence refers to a more general concept of methodological and theoretical equivalence which can be jeopardized by various ‘biases’ (bias means the lack of equivalence). Measurement invariance refers to the purely statistical and psychometric assessment of such cross-cultural equivalence (Matsumoto & Yoo, 2006; Putnick & Bornstein, 2016). Invariance, which can be assessed only during data analysis (a posteriori), naturally stems from equivalence, which should be assessed during each stage of the research (mostly a priori; for review, see Davidov et al., 2014; He & Van de Vijver, 2012; Hui & Triandis, 1985; Millsap & Meredith, 2007; Poortinga, 1989; Van de Vijver, 1998; Van de Vijver & Tanzer, 2004). Both terms are composed of similar hierarchically sorted levels: for cross-cultural equivalence they are construct equivalence, method equivalence and item equivalence; for measurement invariance, they are configural invariance, metric invariance and scalar invariance (Van de Vijver, 1998). These two phenomena combined should provide the necessary evidence for cross-cultural comparability of constructs and their measurement (Čeněk and Urbánek, 2019).
Construct Equivalence
The construct equivalence assumes that constructs exist and have the same meaning across various cultural groups (Hui & Triandis, 1985; Van de Vijver, 1998). This cannot be accomplished without an adequate and clear definition of culture and cultural groups as objects of analyses (Levine et al., 2007). Even though this requirement might appear relatively simple, it is routinely very problematic in the reality of cross-cultural research, because culture is often operationalized with respect to the birthplace of participants, in most cases defined as an individual country or region. Yet, other facets of cultural background exist (often understood as fuzzy sets), such as religion, social class, socio-economic status, ethnicity, nationality or identity, which should also be taken into account in any clarification of conceptual and operational definitions (Cohen, 2009).
Furthermore, since the experimental manipulation of ‘culture’ is, for obvious reasons, not possible in cross-cultural research, scientists must rely on quasi-experimental and correlational research designs with no ambition of making decisions about causality. In other words, the mere observed difference between participants from two cultures in a psychological process does not imply that the difference is caused by cultural influences (i.e. cultural attribution fallacy; Matsumoto & Yoo, 2006). The solution of this fallacy lies in the so-called unpacking studies, that is, complex research designs with an enormous number of potentially related variables collected, and with careful examination of all theoretically plausible relationships between them. Such methodology should be able to reduce the risk that the differences are caused by phenomena not related to culture (Matsumoto & Juang, 2012; Matsumoto & Yoo, 2006). This procedure also increases the demands on the equivalence of concepts because of the greater number of variables in these models and more complex relationships between them.
Another way to achieve a higher level of construct equivalence is to involve scholars from the cultures investigated and the inclusion of informants with expertise in local cultures and languages (Davidov et al., 2014; Van de Vijver, 1998). This can take the form of simultaneous development of instruments across cultures involved in the study and selection of the most appropriate items (see Leong et al., 2010; Werner & Campbell, 1970), or, by contrast, independent development of instruments and selection of all items generated by the research team (see Campbell, 1986).
Method Equivalence
Method equivalence assumes that the instruments used in research and sampling and administration procedures are similar across cultures and therefore comparable (He & Van de Vijver, 2012). Regarding sample equivalence, scientists should make well-informed sample and sampling decisions about the construct under scrutiny, because various cultural groups often differ in their level of education, socio-economic status, religion, etc., which can result in confounding effects. Such variables should be therefore controlled in the analysis (Van de Vijver, 1998). Furthermore, samples and sampling should be adapted to the research goals – generally speaking, homogenous samples are adequate in the examination of cross-cultural differences, while heterogeneous samples should be used for the examination of cross-cultural similarities (Boehnke et al., 2011).
Another type of equivalence is instrument equivalence, which addresses the fact that participants from different cultures do not always consistently react to the instrument and its characteristics (Van de Vijver, 1998). An instrument and its items/stimuli should not vary across cultures in the level of their appropriateness or familiarity. Some other impediments to instrument equivalence are inherent to self-report scales, in which the results might be systematically biased by differences in response styles (for review, see Van Vaerenbergh & Thomas, 2012). A large amount of evidence is available which suggests that the differences in responses of participants from various cultures can be systematically affected by extreme, midpoint, acquiescence and social desirability response styles (e.g. Batchelor & Miao, 2016; Baumgartner & Weijters, 2015; Harzing, 2006; Johnson & Van de Vijver, 2003; Smith, 2004). The effects of response biases can lead to erroneous interpretations of scores obtained for various cultural groups. It is therefore desirable to assess these effects and evaluate their potential confounding effect on results (Van de Vijver & Tanzer, 2004).
Many a posteriori methods have been defined to resolve response biases. For instance, acquiescence bias can be controlled in analyses through an ipsatization in reliability estimation (Fischer, 2004; Fischer & Milfont, 2010); extreme or midpoint bias can be investigated and controlled using the sum-score calculated only from extreme (mid-point) answers (Peterson et al., 2014); social desirability bias is usually assessed and controlled through a score obtained from an additional social desirability scale (Larson, 2018). Furthermore, acquiescence, extreme and midpoint biases are often modelled (and controlled) within a multi-group confirmatory factor analysis (MG-CFA) as a common method variance (e.g. Morren et al., 2011; Welkenhuysen-Gybels et al., 2003). Other authors suggest controlling them, for instance, within restricted latent class factor analysis (Morren et al., 2011) or item response theory (Zhang & Wang, 2020). From these four response styles, we can further derive a general response style, which can be modelled and controlled in a manner similar to controlling each response style (He & Van de Vijver, 2015). In addition, some a priori steps in the construction and administration of an instrument might result in a decrease in or prevention of a response bias (e.g. item randomization, Uskul & Oyserman, 2006; or inclusion of reversed items, Paulhus, 1991).
The final, crucial type of method equivalence, that is, administration equivalence, addresses the confounding effects which occur during administrative procedures. Examples of these effects are inconsistencies in social, physical or technical conditions, unexpected events, the effects of administrators, ambiguous instructions, communication problems, different modes of data collection, etc. (see Van de Vijver & Tanzer, 2004). Non-equivalence of administration may be significantly reduced with the aid of test–retest, training and intervention studies (Van de Vijver & Tanzer, 2004).
Item Equivalence
Item equivalence assumes that the measurement on the item level is equal across various countries (i.e. the item has the same psychological meaning across cultures; Van de Vijver, 1998). This is influenced mainly by the translations and adaptations of items, with the aim of obtaining ‘culture-free’ and ‘culture-fair’ items. Such items, however, must not only be translated accurately without any shift in meaning or connotation (Poortinga, 1989) but should also be appropriate to the specific culture and consider certain effects of culturally specific nuisance factors or connotations associated with item wording (Harkness et al., 2010; The Council of the International Test Commission, 2018). Furthermore, item wording should eliminate the potential reference-group effect, that is, the situation when participants from different cultures use different reference groups (often their own cultural group) while answering on self-report scales (see Heine et al., 2002).
The bias at the item level can be prevented by collecting pilot data and performing an item analysis (The Council of the International Test Commission, 2018), incorporating a larger number of translators from various cultural backgrounds (Byrne et al., 2009), using back-translation (Brislin 1970; Werner & Campbell, 1970) or multi-step committee-based translation methodologies such as ‘Review, Adjudicate, Pre-test and Document’ (TRAPD; Harkness et al., 2010), detecting item bias using judgmental methods (e.g. linguistic and psychological analysis) or differential item functioning (DIF; Van de Vijver and Tanzer, 2004), and identifying errors with the aid of cognitive interviewing (Fitzgerald et al., 2011).
Measurement Invariance
Measurement invariance refers to the degree to which the instruments used in research are equally reliable in two or more cultures (or other groups). Measurement invariance can only be assessed by psychometric means (Matsumoto & Yoo, 2006; Putnick & Bornstein, 2016) and naturally stems from the cross-cultural equivalence described above, simultaneously providing statistical evidence for the degree of equivalence. Measurement invariance and its types are described in great detail elsewhere (e.g. Boer et al., 2018; Brown, 2015; Byrne et al., 1989; Chen, 2007; Cheung & Rensvold, 2002; Davidov et al., 2014; Fischer & Karl, 2019; Hoyle, 2012; Kline, 2016; Meredith, 1993; Milfont & Fischer, 2010; Millsap, 2011; Putnick & Bornstein, 2016; Vandenberg & Lance, 2000) and therefore we only provide a brief summary herein.
As mentioned, measurement invariance assessment is most commonly performed through a multi-group confirmatory factor analysis (MG-CFA), which is a special case of structural equation modeling (SEM). The general assumption is that psychological traits are latent constructs measured indirectly by observed indicators (e.g. questionnaire items; see Byrne, 2010; Bollen, 1989; Brown, 2015; Hoyle, 2012; Kline, 2016). The SEM framework is a versatile tool for controlling any potential measurement error and therefore also a useful tool for cross-culturally equivalent research (e.g. Boer et al., 2018; Chen, 2008; Fischer & Karl, 2019; Milfont & Fischer, 2010). To illustrate the difference of analysis performed on a construct (latent) level and on an observed (manifest) level, imagine that scholars are interested in the real differences between people with respect to their intelligence. Scholars who compare the difference on a construct level would compare estimated (indirectly measured) levels of general intelligence (g factor), whereas scholars who compare the difference on an observed level would compare the directly measured observed scores obtained from tests of intelligence that are imperfect indicators of general intelligence.
The measurement invariance procedure is based on a sequential equation of parameters across groups in three phases: the establishment of configural, metric and scalar invariance. The fourth phase, the establishment of strict invariance, is usually not performed in cross-cultural research since it is not necessarily required for the purposes of group comparisons (Meredith, 1993). The increasingly restricted nested models are compared (i.e. metric invariance is contrasted with configural invariance; scalar invariance is contrasted with metric invariance), and if the model fit is not significantly worsened by adding new parameter restrictions, a more restricted model is preferred due to better interpretability of the results.
In the first phase, configural (otherwise known as structural or factorial) invariance is assessed. In this step, the baseline measurement model which allows all parameters to be freely estimated across groups is tested. A satisfactory configural model requires an equal latent factor structure across groups (i.e. the number of factors and the pattern of relationships between factors and items; Thurstone, 1947). The configural model is evaluated by overall fit. The following indicators and thresholds are recommended (good/acceptable fit): Tucker–Lewis Index (TLI) ≥ .95/.90, Comparative Fit Index (CFI) ≥ .95/.90, Root Mean Square Error of Approximation (RMSEA) ≤ .06/.08 and Standardized Root Mean Square Residual (SRMR) ≤ .08 (Hu & Bentler, 1999). Values outside these boundaries suggest that the baseline measurement model is noninvariant, that is, its factor structure differs in the cultural groups.
When configural invariance is satisfactorily established, the metric (otherwise known as weak or pattern) invariance can be evaluated. In a metric model, the factor loadings are constrained to be equal across groups (Horn & McArdle, 1992; Millsap, 2011; Thurstone, 1947). If the model is not significantly worsened, it is considered tenable. Even though such worsening was assessed with a chi-square test in the past, this approach is currently not recommended because this test is sensitive to the sample size (Saris et al., 2009). Hence, the assessment of a significantly worsened model is nowadays usually estimated by the inspection of change (delta) in the CFI, RMSEA and SRMR. The most used criteria are those proposed by Chen (2007): ΔCFI ≤ .01, ΔRMSEA ≤ .015 and ΔSRMR ≤ .030 (in the case of scalar level, ΔSRMR ≤ .015). Sufficient metric invariance means that each item loads the latent construct to a similar degree across groups, and therefore a comparison of factor variances and covariances is possible.
If the metric invariance is established, the scalar (otherwise known as strong) invariance can be assessed. The scalar model constrains item intercepts (or thresholds in the case of discrete variables) for metric invariant items to be equal across groups, which means that differences in the latent construct capture all the mean differences in the observed scores (Meredith, 1993; Steenkamp & Baumgartner, 1998). If the scalar invariance is supported, which is to say that the model is not significantly worse compared to the metric invariance model (the same criteria for delta of fit indices), it indicates that constraining the item intercepts across groups does not significantly affect the model fit.
Once the configural, metric and scalar measurement invariance is established, the mean values of latent factors can be meaningfully compared across groups (or across different time points). This is usually conducted by setting the latent mean in one group to 0 while allowing it to vary in the remainder of the groups. This procedure lets us interpret latent means in terms of standardized effect sizes (i.e. reference group method, see Steinmetz, 2011). The estimated mean parameters in the remainder of the groups therefore represent a difference in the latent means between groups (Putnick & Bornstein, 2016). The procedure of testing difference among groups is called latent mean comparisons (a.k.a. structured means modeling, SMM; Sörbom, 1974), and it represents an alternative to the t-test, ANOVA, ANCOVA, MANOVA, MANCOVA, etc. Its main benefit lies in the fact that means are comparing within SEM on a construct (latent) level instead of on an observed level. This means the results are free of measurement error, the procedure has a lower number of assumptions and it can deal with multicollinearity or homogeneity of variances. (For more details, see Aiken et al., 1994; Breitsohl, 2019; Cole et al., 1993; Hancock, 1997; 2001; Hancock, et al., 2000; Thompson & Green, 2013; Whittaker, 2013). The scalar level of invariance is thus crucial in any cross-cultural comparison, because only this degree of measurement invariance allows a comparison of groups at mean-level differences.
If noninvariance is detected in any phase of measurement invariance testing, the researcher should stop the analysis and determine the issues of noninvariance or accept that the constructs are noninvariant and discontinue the analysis of measurement invariance and also abandon the interpretation of group differences (Putnick & Bornstein, 2016). Another possible step may lie in an analysis of the practical effect size of such noninvariance (e.g. with dMACS effect size, see Nye et al., 2019; or with MIVI effect size, see Groskurth et al., 2021). Unfortunately, in the literature there is no generally accepted consensus on what to do next when measurement invariance fails (Millsap, 2011).
Regarding configural noninvariance, research might redefine the constructs of interest (e.g. allow correlated residuals, omit variables, change the number of factors, use hierarchical or bifactor structural models) and retest the model (Chen, 2008; Putnick & Bornstein, 2016), or use exploratory procedures to identify the origin of the misfit and DIF (Fischer & Karl, 2019). However, once these modifications and alterations of the baseline model have been conducted, the analysis can no longer be understood as confirmatory and should be considered and reported as an exploratory analysis (Bollen, 1989; Byrne, 2010). Furthermore, even the exploratory approach within the MG-CFA framework still needs to be well-grounded theoretically (i.e. theory-driven rather than purely data-driven, cf. Brown, 2015). Another possible solution of configural noninvariance might lie in detecting subsets of countries where measurement invariance holds and analyzing them separately (Davidov et al., 2014). Furthermore, noninvariance at the metric and scalar levels can be resolved by establishing a partial invariance computed from at least two invariant items (yet ideally from at least half of all subscale items) and consequently retesting the given level of measurement invariance. In this case, only invariant items are constrained in terms of factor loadings or intercept, while the rest of the items remain unconstrained, which allows valid comparisons across groups (Byrne et al., 1989; Steenkamp & Baumgartner, 1998). However, since this procedure is estimated based on modification indices, its disadvantage lies in the assumption that all other loadings (i.e. except those which were marked as noninvariant) are invariant. If this assumption is not true, the results of the modification indices will be inaccurate (Cheung & Rensvold, 2002).
Nevertheless, even partial scalar measurement invariance might be too restrictive and hard to achieve within a traditional MG-CFA, especially in cross-cultural studies which involve many cultural groups (e.g. Boer et al., 2018; Byrne and van de Vijver, 2017; Davidov et al., 2014; Rutkowski & Svetina, 2014). Furthermore, the MG-CFA is not very effective for verifying the invariance in groups with extreme differences (which, nevertheless, might be legitimate in cross-cultural research). Such models will almost always signalize noninvariance, which does not necessarily mean lack of comparability caused by different item understanding (Welzel et al., 2021). Despite this, the measurement invariance still needs to be address in a research. Therefore, in the case of noninvariance, research might consider using recently developed alternative methods that might be more flexible for assessing measurement invariance (Fischer et al., 2021). For example, multiple-indicators multiple-causes modeling (MIMIC; Kim et al., 2011), alignment-within-CFA (AwC, Marsh et al., 2018), item response theory for DIF identification (IRT; Kim and Yoon, 2011), Bayesian structural equation modeling (BSEM; Muthén and Asparouhov, 2012), exploratory structural equation modeling (ESEM; Asparouhov and Muthén, 2009), multi-group factor analysis alignment (Asparouhov and Muthén, 2014), clusterwise simultaneous component analysis (De Roover et al., 2014), multilevel confirmatory factor analysis (Davidov et al., 2016), mixture multigroup factor analysis (MMG-FA; De Roover et al., 2020), exploratory-based multigroup factor rotation (MGFR; De Roover and Vermut, 2019) or data-driven tool called SEM trees (Brandmaier et al., 2013) might serve in this regard.
In spite of many imperative calls for the application of invariance measurement in research, the practice is unfortunately still not as common as it should be, as shown in recent reviews. For example, only 4% of studies using social and personality psychological instruments yielded satisfactory measurement invariance for gender or age groups (Hussey & Hughes, 2020). Regarding cultural groups, only 17% of cross-cultural comparative quantitative studies verified measurement equivalence in the Journal of Cross-Cultural Psychology (see Boer et al., 2018) or the Journal of Personality and Social Psychology (Chen, 2008). Similarly, scalar measurement invariance has not been achieved in a single study on child and adolescent psychopathology (Stevanovic et al., 2017), nor in studies using already validated measurements of personality psychology (Dong & Dumas, 2020). The unsatisfactory situation of the lack of invariance testing is also observed in counselling research (Chen et al., 2020). The situation is similar in research on individualism and collectivism (Chen & West, 2008; Cozma, 2011; Lacko et al., 2021), which has been a long-term ‘flagship’ construct in cross-cultural research, and which is therefore applied in the present article as a demonstration of the essentiality of measurement invariance testing in cross-cultural research.
Individualism and Collectivism: An Overview
The concepts of individualism (sometimes referred to as independent self-construal) and collectivism (or interdependent self-construal) are some of the most investigated constructs in cross-cultural research and are widely used as predictors of many other psychological phenomena (for review, see Oyserman et al., 2002; Markus & Kitayama, 1991; Singelis et al., 1995). The prevalent theory postulates that while independent social orientation and emphases of self-direction, self-expression and autonomy are typical for individualistic cultures, collectivistic cultures embrace interdependent social orientation and place emphases on harmony, relatedness and connection with others. It is also assumed that Western cultures such as the USA or Great Britain are individualistic, while Eastern cultures, for example, China or Japan, are collectivistic (Markus & Kitayama, 1991).
Despite the fact that individualism and collectivism (I/C) are referred to in almost all psychology textbooks, and that every research psychologist is probably aware of this dimension, the validity of I/C research has often been criticized over the past two decades (e.g. Bresnahan et al., 2005; Brewer & Chen, 2007; Chen & West, 2008; Cozma, 2011; Heine et al., 2002; Lacko et al., 2021; Levine, Bresnahan, Park, Lapinsky, et al., 2003; 2003b; Matsumoto, 1999; Oyserman et al., 2002; Oyserman & Lee, 2008; Schimmack et al., 2005; Takano & Osaka, 1999, 2018; Voronov & Singer, 2002). Critics highlight that I/C research lacks concurrent and discriminant validity, clarity of conceptualization and, most importantly, that the scholars of I/C research do not use validated methods or adequate statistical procedures. As Lacko et al. (2021) pointed out, not a single validated instrument is currently available which would repeatedly satisfy the demanding criteria of scalar measurement invariance across various cultures and would simultaneously remain confirmatory.
As was already mentioned, measurement invariance is usually not verified in I/C research. For instance, even very recently published articles in prestigious journals indexed in the Web of Science tend to ignore metric measurement invariance when using I/C as a predictor or a correlate in cross-country studies (e.g. Burton et al., 2019; Galang et al., 2021; Krys et al., 2019), and tend to ignore scalar measurement invariance in mean comparisons across cultures (e.g. Anakwah et al., 2020; Benavides & Hur, 2020; Gomez & Taylor, 2018). Since such articles generally overlook the potential noninvariance issue, their results might be biased. Furthermore, results of t-tests or ANOVAs on observed scores might exaggerate group differences compared to latent mean comparisons, which are based on the scalar measurement invariance (Cole et al., 1993). Therefore, the observed differences in such articles might not correspond to the real level of I/C in the examined populations.
Current Study: An Illustrative Example of Comparison of ‘Traditional’ and ‘Invariant’ Approaches
The aim of the present article is not only to introduce measurement invariance testing and emphasize its necessity in cross-cultural psychology. The article also illustrates the difference between the results obtained from adequate statistical analysis and the results obtained from analysis which ignores the above-mentioned criteria of measurement invariance and potentially produces systematically biased findings. In other words, we are comparing two approaches to analysis of cross-cultural, self-report data. We labelled the first mentioned approach ‘invariant’ and the second approach ‘traditional’ (‘traditional’ because it currently represents the vast majority of research which uses self-report subjective scales in the I/C field; Chen & West, 2008; Lacko et al., 2021). In the ‘invariant’ approach, we established a partial scalar measurement invariance with MG-CFA and consequently compared cultures using latent means, whereas in the ‘traditional’ approach we simply calculated the observed arithmetic means of subscales and analyzed the differences using a one-way analysis of variance.
In order to achieve this aim, we used a real and unpublished cross-cultural dataset. The main reason for not publishing the original data was the inability to establish even configural measurement invariance across countries, which is unfortunately quite common in I/C research (for review, see Lacko et al., 2021). We applied various methods to address the issue of noninvariance. Our approach, however, has been evolving from a theory-driven to a purely data-driven assessment of measurement invariance without any theoretical background. (For a more detailed description of our previous analyses, which were theoretically grounded, see Supplementary Material). Hence, we would like to highlight that the following results of the ‘invariant’ approach are not confirmatory and must not be interpreted in this way. It is impossible to say whether the proposed model is valid from a theoretical perspective or not, and we therefore cannot say much about the real differences between the selected countries in their level of I/C. Since we do not have any other objective criterion (e.g. known validity) caused by the lack of valid instruments in the I/C fields, it is also impossible to say which of used approach produce more valid results in our specific case (i.e. whether the invariant results correspond to the reality more than traditional or not) despite the invariant approach is generally recommended. Hence, both procedures serve purely as a demonstration. We believe that demonstration of the measurement invariance on a real dataset might be more useful specially for readers unaware of such statistical procedure than simulation studies despite the fact, that such approach allow neither to know the true model nor to manipulate with the level of noninvariance.
Basic descriptive statistics of participants.
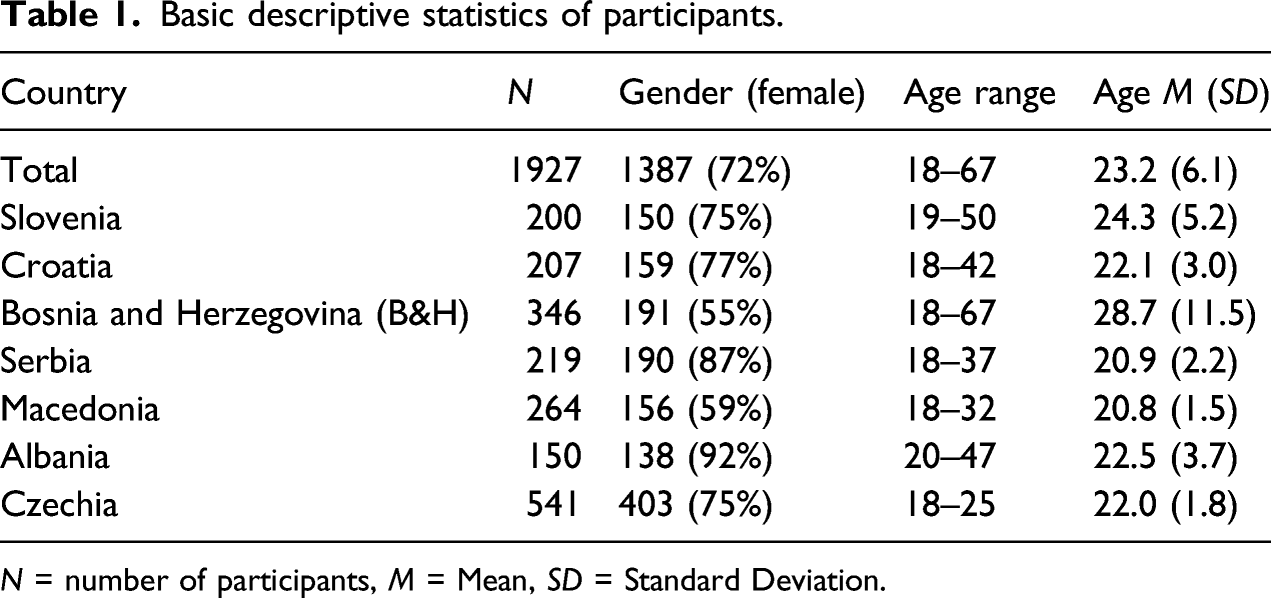
N = number of participants, M = Mean, SD = Standard Deviation.
It is important to examine these countries because the level of I/C in Balkan countries is rather unknown and studies from Czechia are reporting mixed results (cf. Bašnáková et al., 2016; Čeněk, 2015; Dumetz & Gáboríková, 2017; Kolman et al., 2003; Lacko et al., 2020. Furthermore, in Balkan countries, states and societies are multi-ethnic with a great religious, cultural and linguistic diversity. Orientations of peoples to preserve the cultural identities of their groups have also yielded frequent results of conflicts among the peoples. Therefore, one of the major challenges for the European Union is the perceptions about their individual or group orientation to the peoples of the Balkans.
The level of I/C across cultures was measured according to the Independent and Interdependent Self Scale (IISS; Lu and Gilmour, 2007). The scale consisted of two dimensions (an independent-self and an interdependent-self subscale) and forty-two (21 for independent and 21 for interdependent self-construal) 7-point Likert-type numerical items (1 = strongly disagree, 7 = strongly agree). The IISS items were derived from older individualism–collectivism scales such as the Self-Construal Scale (Singelis, 1994), the Individualism–Collectivism Scale (Triandis & Gelfand, 1998) and the concept of independent/interdependent self-construal (Markus & Kitayama, 1991). Two versions of the scale were used in previous research: a full version (e.g. Dixon, 2007; Lacko et al., 2020; Marquez & Ellwanger, 2014), and a shortened version (e.g. Siu & Lo, 2013). Although the IISS showed satisfactory reliability (independent subscale: α = .86; interdependent subscale: α = .89), the authors did not use a confirmatory factor analysis (CFA) for verification of its factor structure.
All statistical analyses were performed in R (v4.0.3; R Core Team, 2020), using the software packages lavaan (v0.6-7; Rosseel, 2012), semTools (v0.5-4; Jorgensen et al., 2018) and JASP (v0.12.2). The data and the R syntax for the ‘invariant’ approach are available online (see https://osf.io/g5z32/?view_only=ae12132150cd4e2cbdcd3ed47654b637 – anonymized link).
Results
In the following section, we compare the results obtained from the ‘invariant’ and ‘traditional’ approaches. We focused on the most often reported procedures in I/C research, namely: reliability estimation, descriptive statistics, cross-cultural differences and post-hoc tests. Please note that the first section of the following results, measurement invariance, was produced only in accordance with the ‘invariant’ approach. All subsequent results were then computed for both methods in a parallel manner.
Measurement Invariance
For model estimation, we used a robust, weighted, least square mean and variance estimator (WLSMV; for results of an alternative maximum likelihood estimation with robust standard errors [MLR] see Supplementary Material), which is suitable for ordinal and non-normally distributed data from Likert-type scales (Finney & DiStefano, 2006). Besides the WLSMV estimator, we applied delta parameterization, the Wu and Estabrook (2016) model identification methodology and a pairwise method to address missing data. This ordinal procedure has been demonstrated in detail by Svetina et al. (2019). Since our data were skewed and medium sample sizes per group were gathered, we observed some empty cells on one side of the ordered categorical (ordinal) scales. This situation represented a problem for polychoric correlations computations. Two possible solutions to this problem are suggested in the literature: a) add values to the empty cells (Savaleo, 2011), and b) collapse multiple categories into a single category (Rutkowski et al., 2019). To perform the subsequent analyses, we decided to select the first option and fill the empty cells with non-missing values. This procedure led to twelve newly created fictional respondents with one manually added value (the remainder of the values were missing).
To establish a configural invariance between countries, we had to apply two additional steps (see also Supplementary Material):
1) The Czech sample was removed from further analysis because of its entirely different pattern of covariances and factor loadings (e.g. opposite valency) to the other countries. Hence, only 1386 participants were incorporated into the MG-CFA (the same data were used with the ‘traditional’ approach, see below).
2) Three quarters of items were removed based on the purely exploratory data-driven inspection of the data (more or less ‘trial and error method’), and only items that allowed establishing a configural invariance across countries were kept. This resulted in a two-dimensional, 10-item scale (Individualism = item 2, item 3, item 4, item 5 and item 6; Collectivism = item 26, item 28, item 30, item 33 and item 37; for the item wording, see Lu & Gilmour, 2007) with two correlated residuals (item 33 with item 37, and item 2 with item 3). Since we wanted to compare both approaches in the way they are usually used in real practice, we compare the 10-item version in the invariant approach with the 42-item version in the traditional approach. For a direct comparison on the same 10-item version of the scale in both approaches, see Supplementary Material.
Measurement invariance results.

***p < .001; χ2 = Chi-square; df = degrees of freedom; RMSEA = Root mean square error of approximation; CI = Confidence intervals; CFI = Comparative fit index; TLI = Tucker–Lewis index; SRMR = Standardized root mean square residual; Δ = delta (change).
Third, the threshold 1 and metric invariance models were tested by constraining the items’ thresholds and items loadings, which resulted in acceptable changes of the model fit (ΔCFI = .005, ΔRMSEA = −.012 for threshold; ΔCFI = .008, ΔRMSEA = .003 for metric; see Table 2). The results suggest that the metric invariance of the proposed model holds well, and therefore it is possible to examine the relationships between variables, for example, through correlations or regressions (Milfont & Fischer, 2010).
Fourth, we verified scalar invariance. Nevertheless, constraint of the items’ intercepts resulted in an unacceptable change in model fit (ΔCFI = .068; ΔRMSEA = .034; see Table 2). Therefore, in the next step, we specified a partial scalar invariance model with six unconstrained items’ intercepts based on iteratively releasing of constraints according to the statistical significance and χ2 values obtained from the Lagrange multiplier tests (for all groups at once; items 2, 4, 6, 28, 30, 33). This left us with two fully invariant items per each I/C dimension (meaning two items with constrained intercepts, loadings and thresholds; Byrne et al., 1989; Steenkamp & Baumgartner, 1998). This led to acceptable partial scalar invariance fit indices (ΔCFI = .007, ΔRMSEA = .005; see Table 2). A comparison of the latent means between countries was therefore possible.
Reliability Estimation
Cronbach’s α and McDonald’s ω internal consistency estimation.
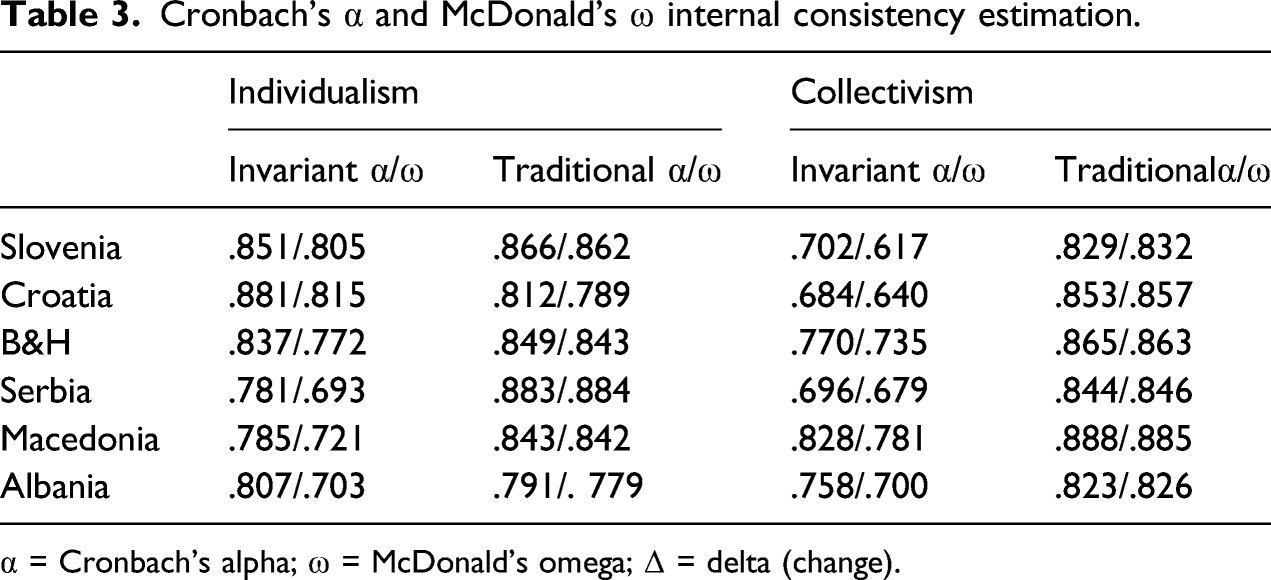
α = Cronbach’s alpha; ω = McDonald’s omega; Δ = delta (change).
Descriptive Statistics
Estimated latent means (SD/SE) and arithmetic means (SD/SE).
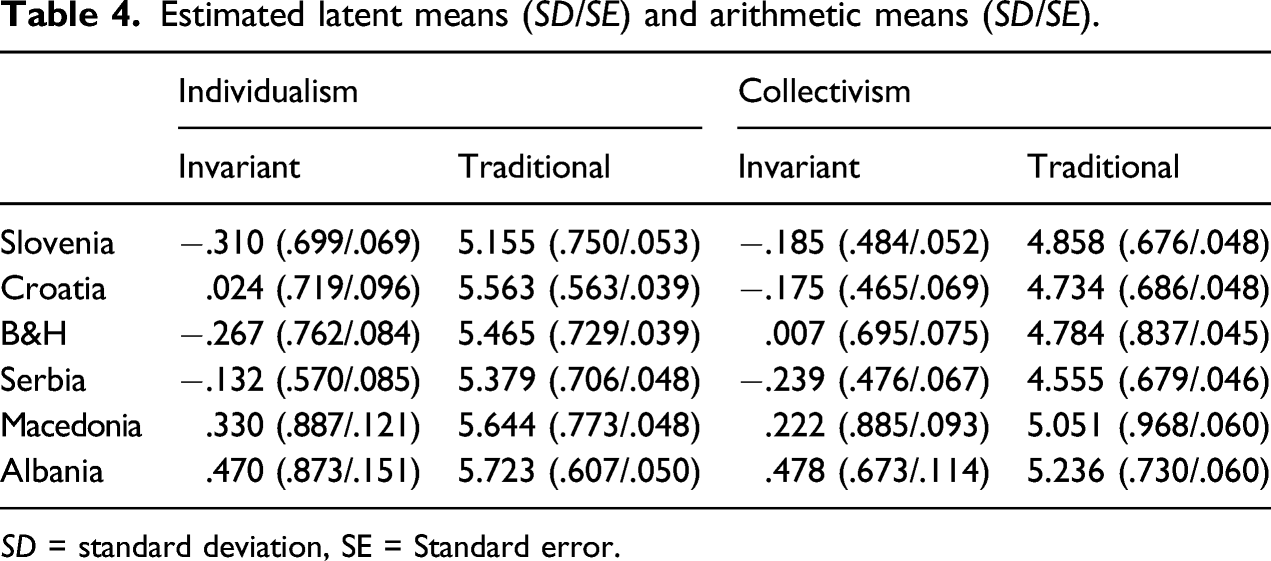
SD = standard deviation, SE = Standard error.
To provide a more convenient comparison of descriptive statistics, the data were clustered into two dual Y-axis line charts (see Figures 1 and 2). The latent and arithmetic means as well as their standard errors were transformed via min–max normalization into a particular range Comparison of latent and arithmetic means in individualism subscale. Comparison of latent and arithmetic means in collectivism subscale.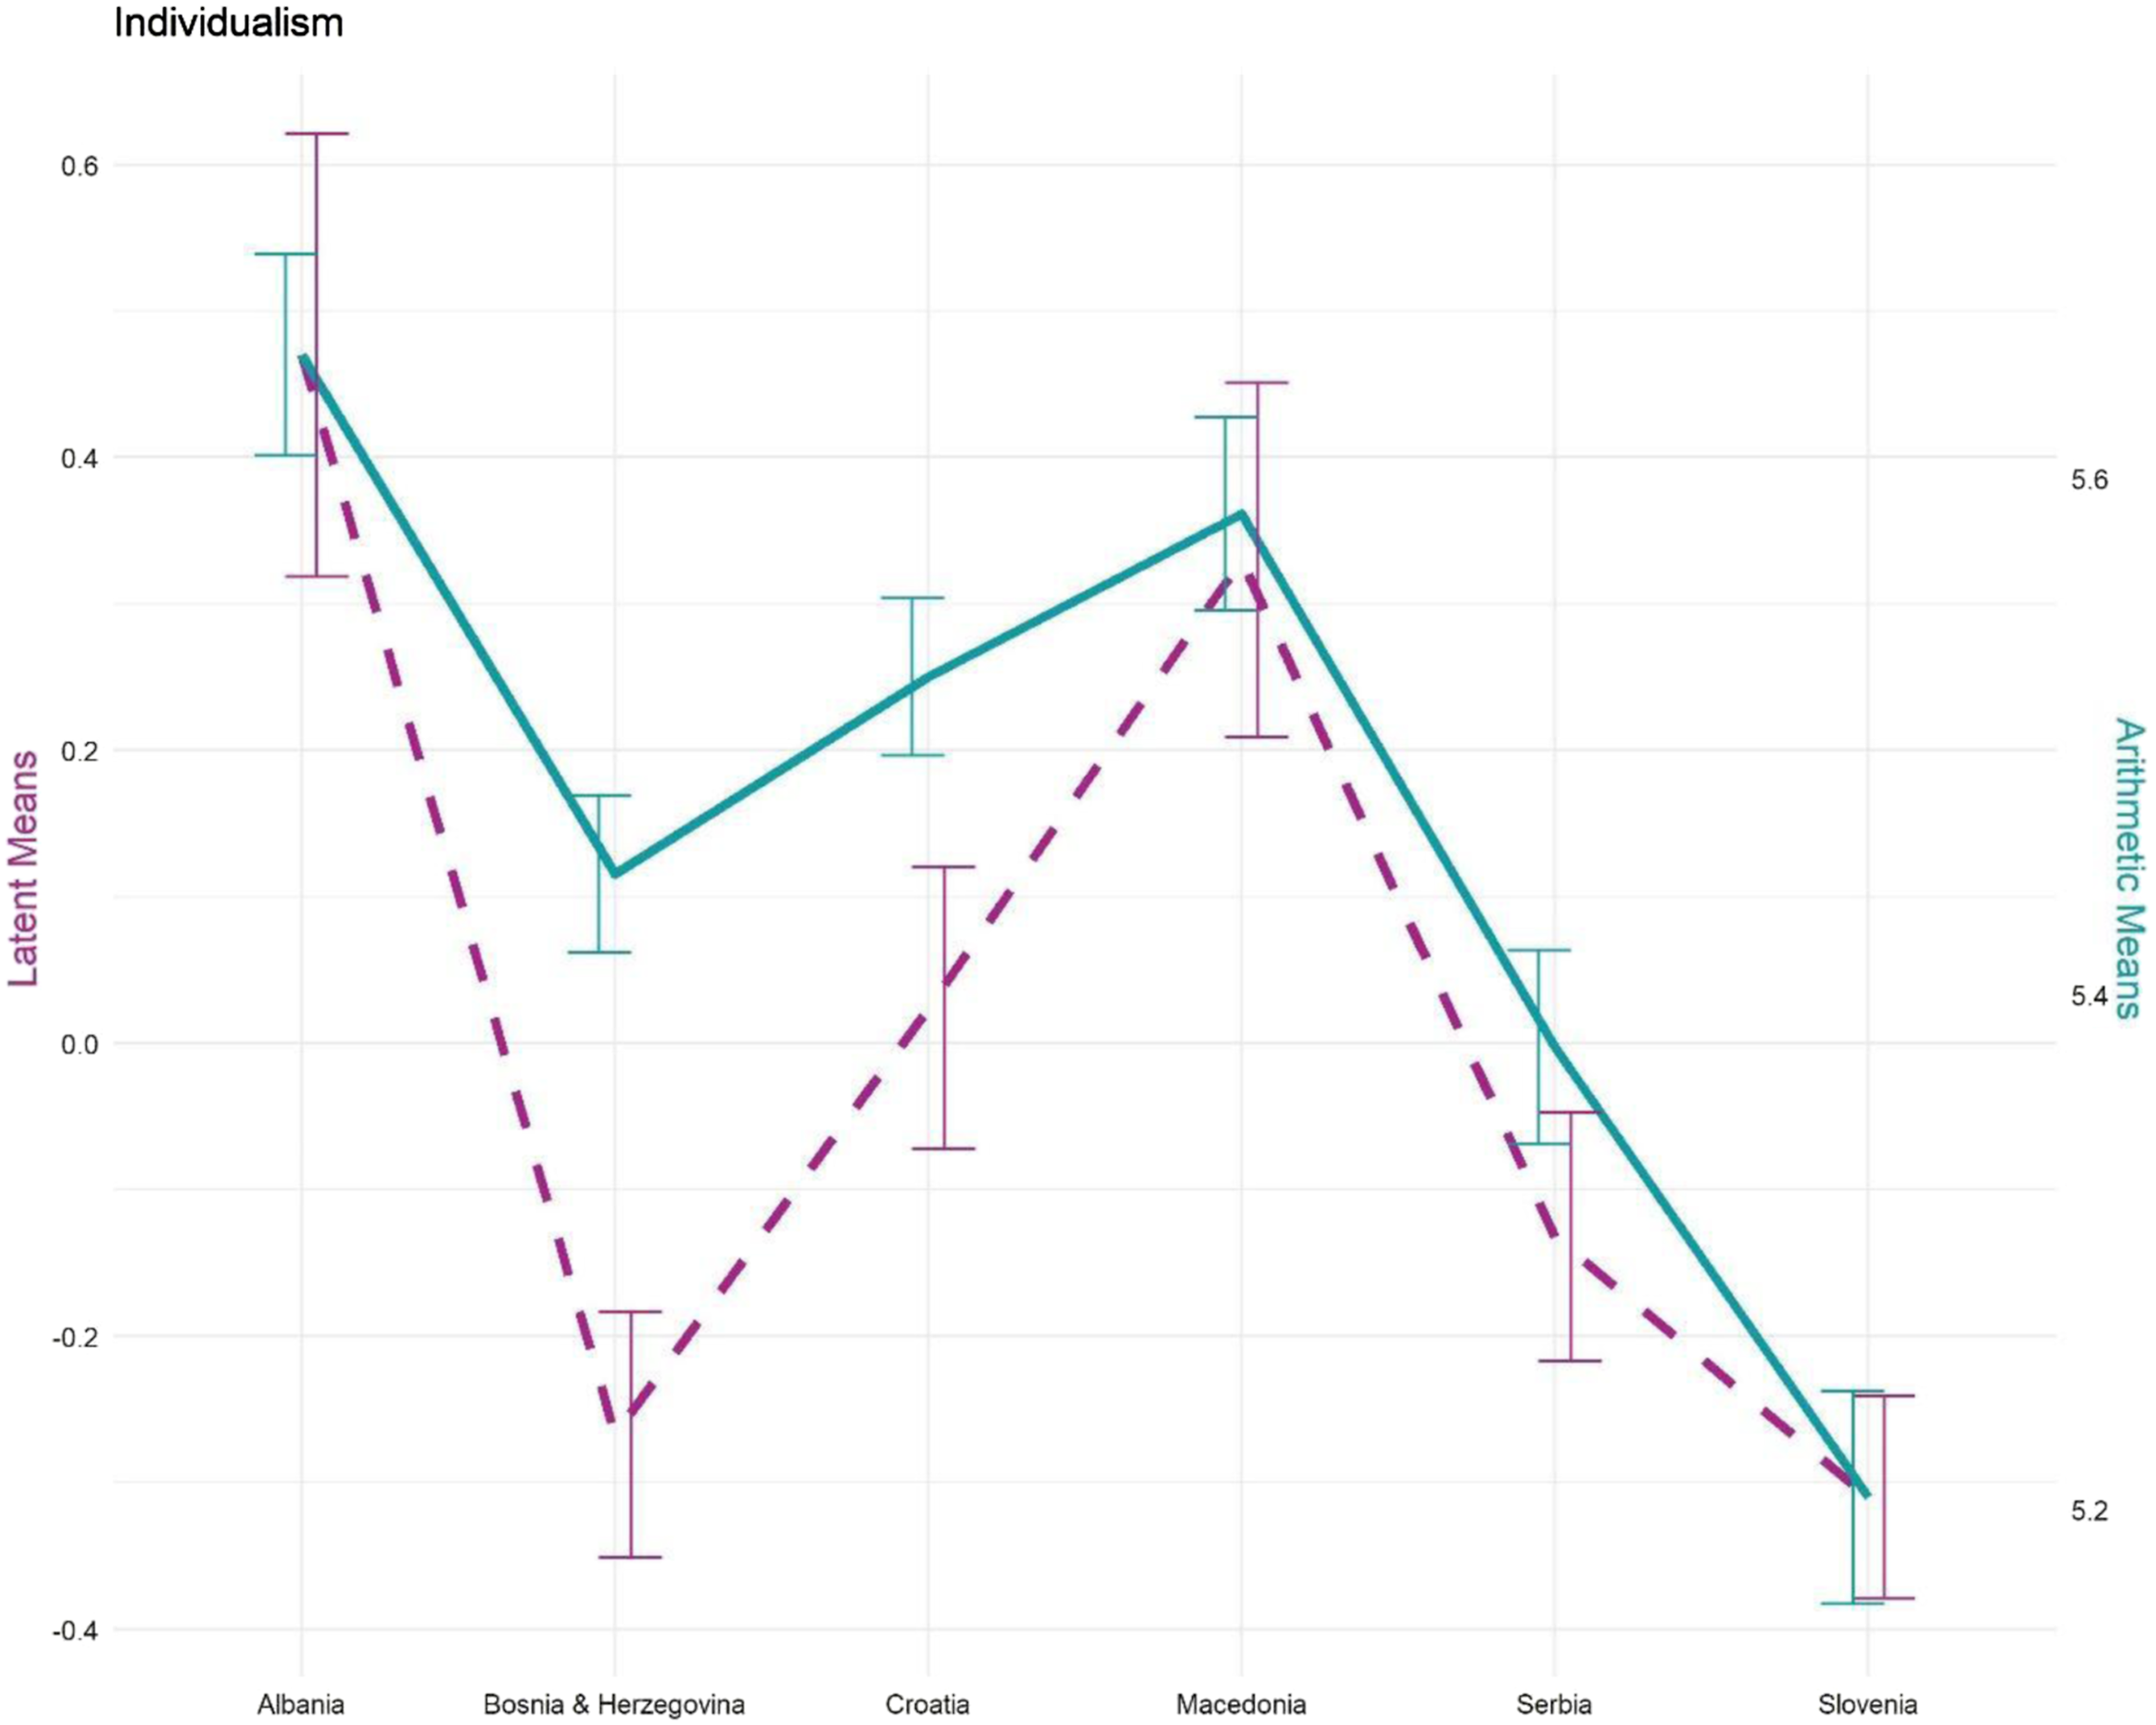

Between-Country Differences
In this section, we analyze the differences between the countries. For the ‘invariant’ approach, we applied the Chi-Squared difference test (Satorra, 2000) to the entire two-dimensional measurement model to identify the main effect between nested models (i.e. latent mean comparison) and found a statistically significant result: Δ X2 = 280.52, Δ df = 42, p < .001. This suggests that significant differences exist between the countries in both individualism and collectivism.
For the ‘traditional’ approach, we first applied Levene’s test for equality of variances. The test indicated that the assumption of homoscedasticity was violated for both individualism, F(5, 1380) = 4.219, p < .001, and collectivism, F(5, 1380) = 6.725, p < .001. Therefore, we applied Welch’s correction. Then, two one-way ANOVAs revealed significant differences between the countries in both individualism, F(5, 593.921) = 16.236, p < .001, ω2 = .053, and collectivism, F(5, 856.069) = 20.203, p < .001, ω2 = .058. In summary, omnibus analysis showed, in both approaches, statistically significant differences between countries in their level of individualism and collectivism.
Post-hoc Tests
In this section, the results for each approach in the post-hoc tests are reported. The ‘traditional’ approach used post-hoc pairwise t-tests, whereas the ‘invariant’ approaches used the latent mean comparisons. In order to reduce potential type I errors, we corrected all the following post-hoc pairwise comparisons using Holm–Bonferroni correction for multiple comparisons. Additionally, for each pairwise comparison, the Cohen’s d effect size was computed (for SEM: the standard deviation was computed as a square root of the variance; from these standard deviations, the pooled standard deviations were calculated, which were subsequently used for calculation of effect size; see Breitsohl, 2019).
Post-hoc analysis for individualism subscale.
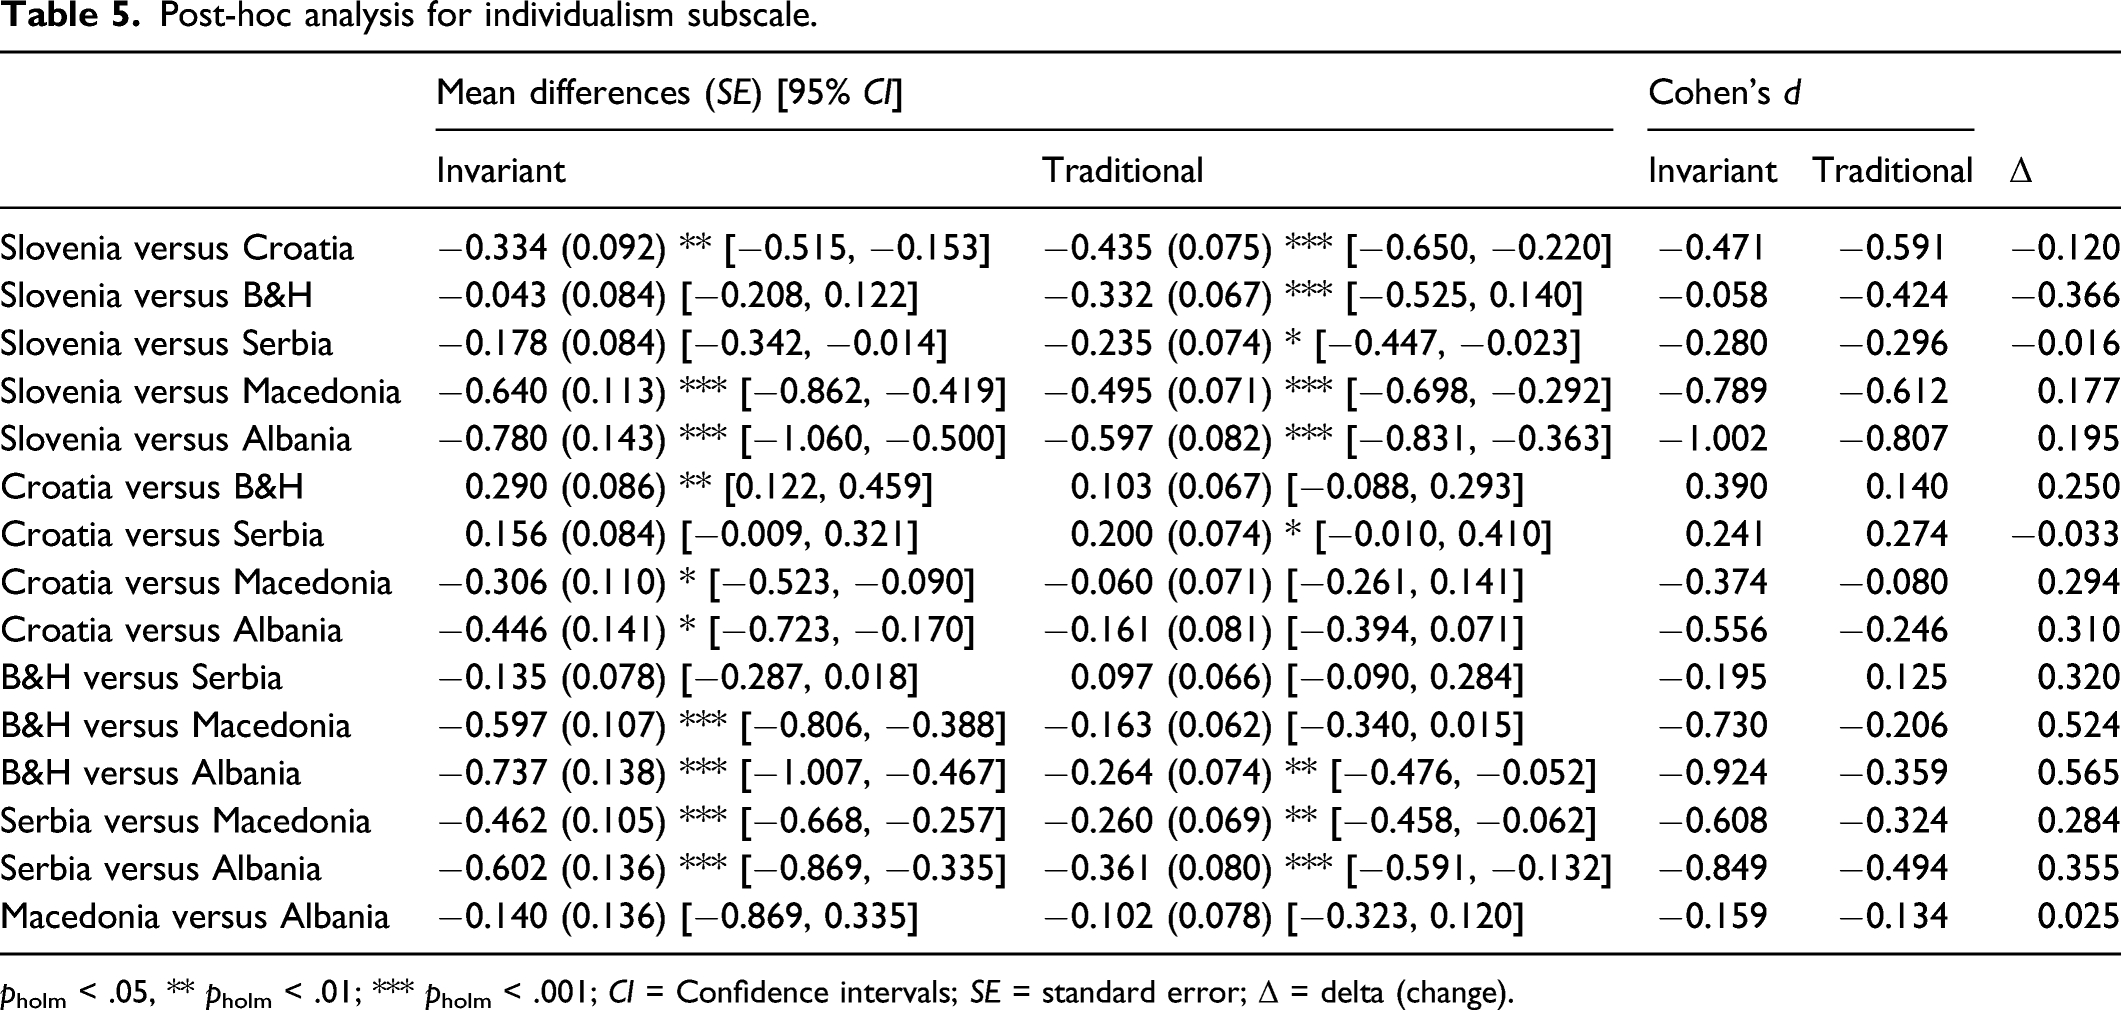
pholm < .05, ** pholm < .01; *** pholm < .001; CI = Confidence intervals; SE = standard error; Δ = delta (change).
Post-hoc analysis for collectivism subscale.
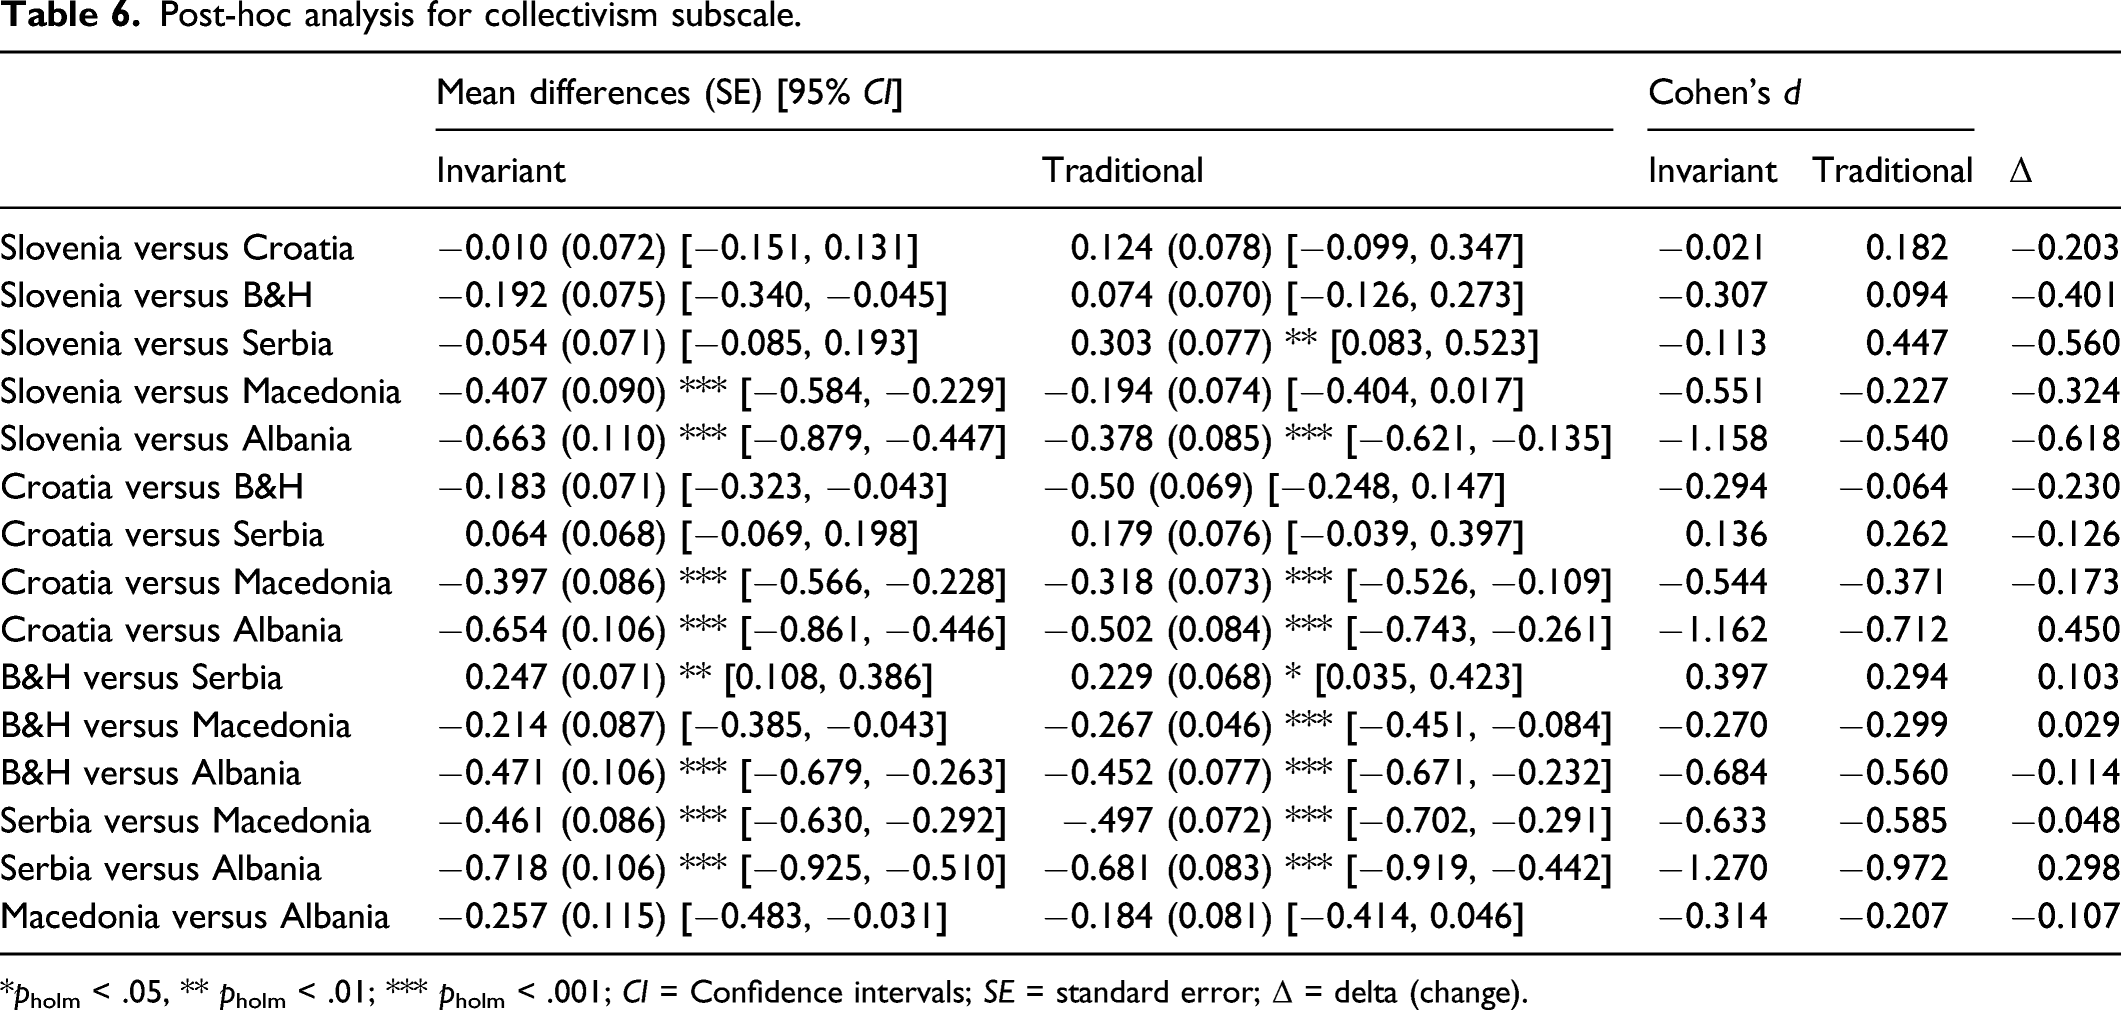
*pholm < .05, ** pholm < .01; *** pholm < .001; CI = Confidence intervals; SE = standard error; Δ = delta (change).
Discussion
In the paper, we described cross-cultural equivalence and measurement invariance, and we emphasized their importance in cross-cultural research. In particular, we illustrated two different approaches to the analysis of data obtained from individualism/collectivism self-report scales, that is, ‘invariant’ and ‘traditional’ approaches, and compared their results. The comparisons revealed that each approach yields different statistical results for post-hoc tests, meaning that some pairwise comparisons are statistically significant and have high effect sizes inconsistently across approaches.
To provide a more illustrative interpretation of the effect of noninvariant items on the group comparisons results, we discuss in more detail the biggest disunity of both approaches which can be observed in the individualism score of Bosnia and Herzegovina. According to Hofstede’s (Hofstede et al., 2010) individualism index, all Balkan countries are strongly collectivistic (Croatia [33], Slovenia [27] and Serbia [25] are slightly more individualistic than Macedonia [22], Bosna and Herzegovina [22] and Albania [20]). Bosna and Herzegovina was indeed identified as second less individualistic in the invariant approach (latent mean was −0.267) and the difference with the lowest individualistic country, Slovenia, was statistically insignificant and showed a very weak effect size (d = −0.058). Furthermore, it showed high effect sizes in comparisons with Macedonia (d = −0.730) and Albania (d = −0.924) that were significantly more individualistic.
These results were however entirely different when analyzed on the observed level within the traditional approach. In the traditional approach, Bosna and Herzegovina could be characterized as rather an individualistic country (arithmetic mean 5.465). The difference with Slovenia who remained the least individualistic was significant with a moderate effect size (d = −0.424). Even though it was still less significantly individualistic than Albania, the difference showed a much lower effect size (d = −0.359). However, the difference with Macedonia was not statistically significant (d = −0.206). These differences between the effect sizes of invariant and traditional approaches were higher than .50. The similarly high difference was observed also when arithmetic means were calculated from the same 10-item version of the scale (see Supplementary Material). Furthermore, the insignificant difference between Bosna and Herzegovina and Serbia showed opposite results in both approaches. In the invariant approach, Serbia was more individualistic (d = −0.195), whereas, in the traditional approach, Serbia was less individualistic (d = 0.097) than Bosna and Herzegovina.
These findings clearly demonstrate that the presence of differential item functioning (bias in the intercepts) can lead to different conclusions when comparing the same construct between countries. This finding convincingly shows that establishing scalar invariance is an important step in the analysis of this type of cross-cultural data before any actual comparison of mean scores because it improves the credibility of the results and their interpretation. Our results agree with other previous studies conducted in related research fields, which used both real and simulated data and which illustrated that ignoring measurement (non-)invariance might lead to biased results (Chen, 2008; Guenole & Brown, 2014; Hsiao & Lai, 2018; Jeong & Lee, 2019; Oberski, 2014; Schmitt et al., 2011; Steinmetz, 2013; Widaman & Reise, 1997).
Since the comparison of observed means by t-tests or ANOVAs assumes potentially wrong model of data, namely, invariant factor loadings and intercepts between groups when it is often not the case, results from these types of analyses may often not be valid. Comparison of construct level latent means in SEM framework offers more valid approach. Because the comparison of potentially biased observed means without assessment of measurement invariance is still the dominant approach in cross-cultural research, doubts about the validity of cross-cultural differences in diverse psychological phenomena should be raised. The consequences of ignoring measurement noninvariance in comparing results from self-report scales across cultures might be far reaching and may be contributing to the current situation of many replication failures and the inability to adapt the scales to countries beyond the most commonly investigated (WEIRD) countries.
We deliberately illustrated both approaches with a single I/C scale example because I/C as a construct represents one of the ‘flagships’ of cross-cultural research. Pioneers of I/C research have usually ignored measurement invariance testing in the construction and adaptation of I/C scales (which is understandable since the development of psychometric methods for verifying the scalar level of measurement invariance testing is relatively recent; Hoyle, 2012). However, the situation has not improved because researchers have subsequently either used these scales with untested/unknown measurement invariance (and possibly with an excellent Cronbach’s alpha) for comparisons based on observed means or sum-scores, or they were able to establish only the configural invariance through substantial changes of exploratory character and not the scalar level of measurement invariance (Chen & West, 2008; Lacko et al., 2021). Even though the goal of I/C research in the majority of cases lies in the cross-cultural comparisons, many of these comparisons of mean scores are, paradoxically, for the reasons mentioned above, most likely biased and actually incomparable from a psychometric point of view.
Apart from methodological implications, we must emphasize that our results do not provide evidence of validity for the I/C construct, or the IISS scale, for two main reasons. First, we had to omit the Czech participants entirely from the analysis to establish configural invariance, which is the lowest level of measurement invariance. This suggests that the IISS lacks construct equivalence across dissimilar groups of countries, because the I/C appears to manifest differently in Czechia (Central Europe) than in Balkan countries. Second, the final version of the questionnaire used in the ‘invariant’ approach does not represent a validated shortened IISS scale with satisfactory psychometric properties for Balkan countries for the reason that it was established purely through a data-driven exploratory approach regardless of any theoretical rationale. This approach led to removal of majority of IISS items which, however, jeopardizes the content validity and the shortened scale might not reflect the proposed theoretical construct. In addition, even though the invariant approach is statistically sound and often recommended, we cannot say that it provided more valid results than the traditional approach in our specific case due to the unknown validity of the instrument. Hence, we do not interpret the obtained results in terms of differences between countries, and this part of our demonstration should not be understood as a guide for future research. We believe that a confirmatory, theory-driven approach is necessary for the validation of this type of scale and its usefulness in cross-cultural research. Another limitation of demonstration lies in the lack of knowledge of the real (non-)invariance across countries and consequently also in the lack of control and manipulation with its levels, which is understandable, because we used a real dataset instead of simulated ones. The sample size of some groups was also rather small which forced us to fill the negligible amount of empty cells with non-missing values.
For the reason of different results obtained from both approaches, we agree with scholars on the call to abandon the ‘traditional’ approach in favour of emphasizing the importance of implementing measurement invariance testing in cross-cultural research in general (e.g. Boer et al., 2018; Chen, 2008; Jeong & Lee, 2019; Fischer & Karl, 2019; Milfont & Fischer, 2010) as well as in self-report I/C research (e.g. Chen & West, 2008; Cozma, 2011; Lacko et al., 2021; Levine, Bresnahan, Park, Lapinsky, et al., 2003; 2003b; Oyserman et al., 2002; Schimmack et al., 2005). Incorporating measurement invariance testing in I/C research therefore has a great potential to increase the validity and reliability of cross-cultural comparisons with self-report scales and to provide the necessary fundamentals for an examination of the real differences in the levels of psychological phenomena across cultures.
Supplemental Material
sj-pdf-1-ccr-10.1177_10693971211068971 – Supplemental Material for The Necessity of Testing Measurement Invariance in Cross-Cultural Research: Potential Bias in Cross-Cultural Comparisons With Individualism– Collectivism Self-Report Scales
Supplemental Material, sj-pdf-1-ccr-10.1177_10693971211068971 for The Necessity of Testing Measurement Invariance in Cross-Cultural Research: Potential Bias in Cross-Cultural Comparisons With Individualism– Collectivism Self-Report Scales by David Lacko, Jiří Čeněk, Jaroslav Točík, Andreja Avsec, Vladimir Đorđević, Ana Genc, Fatjona Haka, Jelena Šakotić-Kurbalija, Tamara Mohorić, Ibrahim Neziri and Siniša Subotić in Cross-Cultural Research
Footnotes
Acknowledgements
This work was supported by Czech Science Foundation (GA20-01214S: ‘Vzájemná percepce akulturačních preferencí u společenské většiny a přistěhovalců v meziskupinové perspektiv’). The publication fees were co-financed by Mendel University in Brno. We would like to thank Miha Hribernik for translation to Slovenian, and Ivana Didak for translation to Croatian.
Declaration of Conflicting Interests
The author(s) declared no potential conflicts of interest with respect to the research, authorship, and/or publication of this article.
Funding
The author(s) disclosed receipt of the following financial support for the research, authorship, and/or publication of this article: This work was supported by Grantová Agentura České Republiky (GA20-01214S).
Supplemental Material
Supplemental material for this article is available online.
Notes
References
Supplementary Material
Please find the following supplemental material available below.
For Open Access articles published under a Creative Commons License, all supplemental material carries the same license as the article it is associated with.
For non-Open Access articles published, all supplemental material carries a non-exclusive license, and permission requests for re-use of supplemental material or any part of supplemental material shall be sent directly to the copyright owner as specified in the copyright notice associated with the article.