
Abstract
The study extends the approach of the Stereotype Content Model to ethnic stereotype content beyond intergroup relations within societies by exploring the North-South hypothesis for competence and warmth. This paper claims that the “desperate” (resource-poor and unpredictable) of lower-latitude climate regions and “hopeful” (resource-sufficient and stable) ecology higher-latitude climate regions translate into typical aggregate attributes and are afterward generalized to the status of all their residents. Further, people use this information as a diagnostic for judgments about the economic value or burden of ethnic groups in their society. Based on the data about aggregated means of competence and warmth for 77 ethnic groups in 38 regions, the multivariate models show that ethnic groups from warmer climates and from lower wealth countries are given lower evaluation in both competence and warmth stereotypes. However, ethnic groups from more northerly countries are also given a lower evaluation in warmth. Ethnic stereotypes reflect both features of ethnic groups in countries of origin (e.g., the North-South polarization) and group characteristics carried by ethnic groups in new contexts (i.e., intergroup relations). Thus, reactions to ethnic groups seem to differ partly depending on countries of origin mixed in people’s minds with information about geography, climate, and national wealth in the social perception process. Stereotypes associated with ethnic groups across countries to some extent track the stereotypes associated with the ecologies in which these ethnic groups are assumed to predominantly live. This highlights the importance of the establishment or expansion of policies and programs regarding international inequality.
Keywords
Overall, people are hardly well informed about different ethnic groups. It is often difficult for them to formulate a specific opinion about some ethnic groups (e.g., Grigoryev et al., 2019). People also experience difficulty recognizing faces from another ethnic group (e.g., Ge et al., 2009; Lakshmi et al., 2021). However, place of origin or residence is often one of the first pieces of information that people get about others (Koch et al., 2017).
The association with countries of origin probably provides some initial information for making judgments. Many lay judgments can be considered as Bayesian, people learn the conditional probabilities of the behavior of different groups as they navigate their social worlds, storing diagnostic information about relative group differences even if imperfectly so (Jussim et al., 2018). That is the information about countries of origin can be as base-rates in this Bayesian inference.
Stereotypes stem from observations and take form by ordinary processes of social cognition (Eagly & Koenig, 2021). It assumes initial naive judgments about climates and wealth of different places (e.g., “it is cold in the North,” “Egypt is predominantly resource-poor desert with very hot weather,” “Russia is a cold country,” “African countries are poor, Scandinavian countries are rich,” etc.), that is some antecedent of the descriptive aspect of ethnic stereotypes (or base stereotypes about ethnic groups) in the social perception process. This mixed in people’s minds information about geography, climate, and national wealth can covariate with the North-South polarization in ethnic stereotypes, which is considered in this paper.
Stereotype has been one of the concepts most frequently used in theorizing and research about ethnic attitudes, prejudice, and intergroup perception and conflict (Brigham, 1971; Fiske, 2017; Neuberg et al., 2020). Currently, the dominant approach in studies considers ethnic stereotype content as a derivative of intergroup relations (i.e., groups’ relations with other groups) within societies. So as to catalog group images, the Stereotype Content Model (SCM) uses vertical and horizontal dimensions (competence and warmth), which receive their evaluations from group position in social structure (Fiske, 2017; Fiske et al., 2002; also see e.g., Cuddy et al., 2009; T. L. Lee & Fiske, 2006; Tsukamoto & Fiske, 2017). The SCM widely employs as a pancultural tool for forecasting group stereotypes from structural relations with other groups in society, and for comparing across societies (Cuddy et al., 2009; Durante et al., 2013).
A broader perspective on ethnic and national stereotype content sources (e.g., Grigoryev et al., 2019; Linssen & Hagendoorn, 1994; Poppe, 2001; Sevillano & Fiske, 2013; Wish et al., 1970) has received less attention. In particular, earlier works, based on evidence from descriptive anthropological studies (von Ehrenfels, 1957, 1961) and the reasoning of a philosopher Montesquieu (Pennebaker et al., 1996), formulated the hypothesis of a possible North-South polarization in stereotypes. This can be considered the forerunner of modern ecological approaches to stereotypes based on evolutionary psychology (e.g., Neuberg et al., 2020) and cultural psychology (e.g., Bonam et al., 2017). The North-South polarization in stereotypes can be applied to differences within countries and across countries (Allik & McCrae, 2004).
This paper extends the approach of the SCM to ethnic stereotype content beyond intergroup relations within societies by exploring the North-South hypothesis for competence and warmth. It primarily suggests a more complex view on the status of ethnic groups with a focus on specific information about their countries of origin (e.g., Northern climates regions vs. South climates regions) that people likely use as diagnostic for judgments about the economic value or burden of these groups for society in the social perception process. Within the ecocultural framework (see Berry, 2018) it means considering not only the contact path (contact → behavior), that is, intergroup relations as usual, but also the ecology path (ecology → behavior) of variations in behavioral expression by including the distal factors. Thus, the paper also becomes a timely response to the general call of geographical psychology (see Rentfrow & Jokela, 2016) and latitudinal psychology (see van de Vliert & van Lange, 2020) for more focus on the environment. In practical terms, it also can provide new insights for interventions aimed at harmonizing intercultural relations.
Stereotypes and the SCM
There is a distinction between cultural stereotypes, which are shared by members of a particular society, and personal stereotypes, which are beliefs of individuals about groups (Jussim et al., 2015; Krueger, 1996; Schaller et al., 2002; see also e.g., Bye, 2020; Findor et al., 2020; Kotzur et al., 2020; Lassetter et al., 2021). Personal stereotypes, usually less accurate and more positive, are likely to be more colored by personal experience, motivational states, and individual differences, whereas cultural stereotypes, being shared, cultural, public images, are likely to be more connected with real positions of groups in social structure and better convey normative contexts.
The functional view claims the additional division in base stereotypes and affordance stereotypes, which represent both what others are actually like (their abilities, features, and inclinations, i.e., some descriptive aspect) and what those characteristics might mean for the social perceiver (i.e., whether they imply threats or opportunities); affordance stereotypes have direct consequences in driving prejudice and discrimination, while “base stereotypes, themselves, serve only as building blocks for the creation of affordance stereotypes” (Neuberg et al., 2020, p. 277).
The SCM considers cultural stereotypes (i.e., widely held beliefs about groups: “how the groups are viewed by society”), measuring their descriptive aspect (Fiske et al., 2002). In other words, when social perceivers recognize a common belief about groups, even if they do not personally endorse it.
Competence and Warmth
The SCM focusing on outgroup perceptions bases itself on functional approaches to social cognition, which suggests that, in order to accomplish tasks and form bonds, people need to know the capacity and intentions of others (Fiske et al., 2002). Thus, the model proposes that group images differ on their apparent ability to bring into being their intent (competence) and seemingly benign or hostile character of this intent (warmth). Competence and warmth are not absolute synonyms of other vertical and horizontal dimensions of stereotype content (e.g., morality, sociability, communion, agency) but very closely relate to them. Evaluation by the Osgood semantic differential positively correlates with both competence and warmth. This dimension approximately at a 45-degree angle to the SCM space goes from the low-low quadrant to the high-high quadrant (i.e., it apparently goes from the social-bad, intellectual-bad quadrant to the social-good, intellectual-good quadrant; see Kervyn et al., 2013).
Societal ingroups (e.g., ethnic majorities and their allies), who are both high status and collaborative, seem both warm and competent, evoking pride. Outgroup images differ by three stereotypic clusters: (1) low status and collaborative groups (compliant subordinates), who are perceived incompetent but warm, evoke pity (ethnic groups rarely place in this cluster but more likely for indigenous minorities); (2) high status and competitive groups (successful competitors), who are perceived competent but cold (e.g., entrepreneurial ethnicities), evoke envy; and (3) low status and competitive groups, who are perceived low on both dimensions (e.g., migrants), evoke contempt. The varied images permit plural societies to differentiate at both ends of the socioeconomic status ranks (Fiske, 2017). Thus, the SCM is a helpful framework through which to understand a threats-benefits profile of specific ethnic groups (allies/HC-HW, “mild” outgroups/LC-HW, “moderate” outgroups/HC-LW, and “extreme” outgroups/LC-LW; Walsh & Tartakovsky, 2021), that allows unpacking such generic categories as “immigrants,” “ethnic minorities,” “foreigners,” etc. (Grigoryev et al., 2019, 2021).
Stereotypes and Ecology
Physical space regarding ethnic stereotypes, which includes the built environment (e.g., houses, neighborhoods, and city infrastructure), the natural environment (e.g., forests, fields, and rivers), and places (e.g., geographic regions, nations, and states), is largely overlooked, although ethnicity is embedded not only in human bodies and social identities, but is also etched into mental representations of physical structures (Bonam et al., 2017). Beyond this constructivist position, evolutionary approach to stereotypes based on Life History Theory also argues that ecologies sometimes “mark” their inhabitants, and social perceivers can infer a complex of traits and behavioral strategies from the ecologies others inhabit (see Neuberg & Sng, 2013).
North-South Hypothesis
The North-South hypothesis is that northern inhabitants of a country would be perceived as efficient/hardworking and cool/aloof, whereas southern inhabitants would be perceived as being inefficient/easy-going and warmer/emotional (Hopkins et al., 1997; Linssen & Hagendoorn, 1994; Poppe & Linssen, 1999; Sevillano & Fiske, 2013). Initially, von Ehrenfels (1957) associated this with migration process (enterprising people tend to migrate to more temperate areas of their country over time), but later with semantic content (a cartographic system shows North above and South below, and “above” [i.e., top] associates with masculine, while “below” [i.e., down] with feminine; von Ehrenfels, 1961). 1
Although van de Vliert and Murray (2018) found a positive association across 155 regions between cold demands and creativity and a negative association for heat demands, they theorize and find support for the idea that stressful demands of climatic cold and climatic heat (imposed necessities) interact with economic wealth resources (available opportunities) in shaping creative culture. In other words, their results are consistent with their “ecotheory of creativity” that suggests that higher thermal demands, primarily cold stress and secondarily heat stress, hinder creativity in poorer populations but promote creativity in richer populations. 2 In addition, the Generalized Immigrant Outcomes Model suggests that origin populations vary in some traits and life outcomes, which are then brought with ethnic groups when they migrate to new countries. These real differences give rise to descriptive stereotypes (i.e., subjective perceptions about group differences). Few individuals are able to memorize detailed reports about the groups, so they rely on proxies such as the geographical location of countries or their wealth levels (see Kirkegaard & de Kuijper, 2020; Kirkegaard & Fedorov, 2021).
Regarding the semantic explanation, it is interesting that the Big Two (agency and communion, which are very close to competence and warmth in aspects of vertical and horizontal dimensions) can also be called masculinity and femininity. The Big Two may be a product of human evolutionary history, which is representing traits that humans see as occurring together in gender roles as a consequence of sexual dimorphism. With this in mind, the Big Two is a reflection of the more basic, archaic division between men and women that people perceive in others (Martin & Slepian, 2021). Thus, the relation between competence (i.e., masculine) and warmth (i.e., feminine) in spatial terms (i.e., top and down) can be seen as the relation between North and South within peoples’ geographic thinking.
Although, beyond masculine and feminine, the terms “Northern” and “Southern” are used in many ways. Perhaps the most evident would be Northern to refer to the industrial economies and Southern to the agricultural-based economies; implicit in this definition is Northern countries as culturally and economically dominating, and Southern as economically and culturally colonized (Alloo & Harcourt, 1997). The concept of Global North and Global South has been used in economic geography to divide into developed countries and “Third-World” countries in the explanation of world poverty (Therien, 1999).
Evidence on the North-South Polarization
Von Ehrenfels’ suggestions of the polarization in stereotypes were supported by the research of residents of the North and South of Greece and Italy (Peabody, 1985; for Italy see also Jost et al., 2005; McCrae et al., 2007). Moreover, there were large within-country North-South stereotypes reported in 26 countries (especially in Old World countries, Northern inhabitants were viewed as less emotionally expressive than Southern inhabitants); self-ratings of expressiveness were associated with being from the South and to warmer mean temperatures (Pennebaker et al., 1996). Stereotypes of interpersonal warmth as a facet of extroversion, when respondents in 49 countries rated the typical member of their culture, were positively correlated with climatic warmth (McCrae et al., 2007).
Additionally, older children endorse similar stereotypes to those observed in adulthood. Children in two states of the US (Tennessee and Illinois) evaluated Northern-accented people as smarter and in charge, and Southern-accented people as nicer (Kinzler & DeJesus, 2013); both accents arise in enculturation. In the Western European context, ethnic groups of Northern European countries were perceived as more efficient and less emotional than ethnic groups of Southern European countries (Linssen & Hagendoorn, 1994).
Transposition of Structural Features on Ethnic Groups
The “transposition of structural features hypothesis” suggests that features of countries, which are characterized by social position and lifestyle of ethnic groups, are associated with (or translated into) typical aggregate attributes and are afterward generalized to all residents (Hagendoorn, 1991). This can be important in establishing ethnic hierarchies, which are used to justify the advantages of social inequality (Hagendoorn, 1995).
The “affordance-management approach” to ecology stereotypes suggests a similar idea that social perceivers are affordance managers who employ observable features of ecology in an attempt to format adaptive inferences about likely threats and opportunities ethnic groups may pose (Neuberg et al., 2020). This involves dividing into desperate (resource-poor and unpredictable) and hopeful (resource-sufficient and stable) ecologies (Neuberg & Sng, 2013). In turn, these desperate and hopeful ecologies are confounded with the general distribution of African Americans and European-Americans in the US, respectively (see also Bonam et al., 2016). As a result, the stereotypes associated with individuals track the stereotypes associated with the ecologies in which each broad ethnic group is assumed to live. That is, ethnic stereotypes may not reflect ethnic groups per se but rather beliefs about how people from different environments are likely to think and behave (Williams et al., 2015).
The same logic can be extended from this within-country to cross-country perspective that the typical ecology of countries of origin of ethnic groups is partly employed by social perceivers as diagnostic information for judgments about these groups. Specific countries are usually more related to specific mainstream ethnic groups, whereas others are perceived as more foreign (Cheryan & Monin, 2005; Devos & Banaji, 2005; Huynh et al., 2011; Mukherjee & Perez, 2021; Zou & Cheryan, 2017); for example, the geographic factor matters for the perpetual foreigner stereotype about Asian Americans, who are perceived as perpetual foreigners in the US (S. J. Lee et al., 2009). At the same time, countries of origin are often a marker of social status and religion (Savaş et al., 2021). In addition, stereotyping to a major extent is expressed through the belief in genetic determinism and biological essentialism that stem from processes of motivated social cognition (Keller, 2005). In turn, genetic essentialism, in terms of the widespread lay theory that ancestry can be estimated by geographic distributions, leads to people being more likely to view genes as underlying ethnic differences (Schmalor et al., 2021).
In relation to the North-South polarization, the South climate regions might indicate desperate ecology, whereas the Northern climates regions might indicate hopeful ecology, which both transfer to the typical view of status differences between the North and South residents, and then shape stereotypes about them. Grigoryev et al. (2019) suggested that status reflects some global evaluation for ethnic groups, that is, divides them into “good” and “bad” (or “valued” and “devalued” groups; see Montreuil & Bourhis, 2001). In terms of the SCM, this means that status largely determines the location of ethnic groups in the SCM space primarily from the low-low quadrant (i.e., LC-LW) to the high-high quadrant (i.e., HC-HW).
Present Study
This paper explores the North-South hypothesis for competence and warmth within the SCM framework considering three important points. Firstly, the estimated multivariate models included latitude and temperature as both possible main covariates of the North-South polarization in stereotypes. Secondly, the current study dealt with national wealth of countries as based on Gross Domestic Product per capita (GDPpc) values in contrast to some previous studies, which used measures of perceived economic power (e.g., Linssen & Hagendoorn, 1994; Phalet & Poppe, 1997; Poppe & Linssen, 1999; but see Chan et al., 2011; McCrae et al., 2007). And finally, linear mixed models are used to estimate fixed and random effects to explore how competence and warmth stereotypes vary across ethnic groups and samples.
Latitude and Temperature
Latitude and annual temperature are two of the main components to assess features of physical ecology (Figueredo et al., 2021). The North-South contrast has usually referred to the underlying distinction between cold and warm climates but North and South correspond to cold and warm only in the Northern Hemisphere and countries at higher latitudes tend to have more temperate climates (Allik & McCrae, 2004).
Moreover, it is reasonable to consider latitude as not only a simple descriptor in this study but also as an absolute pointer of cartographic North and South poles location in correspondence with von Ehrenfels’s semantic explanation of the North-South polarization. Latitude is also an indicator of unknown confounding factors with a North-South distribution (i.e., hidden latitude-related predictors; van de Vliert, 2020).
Thus, including latitude and temperature together is needed to simultaneously test both the natural and semantic explanations. However, the Earth’s rotation is associated with solar energy varying by latitude (and negligibly by longitude) that shapes features of the local climate (van de Vliert & van Lange, 2019). The presence of bell-shaped curves of ethnic stereotypes distribution should be tested because there was also a bell-shaped distribution around the equator for some intergroup differentiation variables, national wealth, and thermal demands (see van de Vliert, 2020; van de Vliert & van Lange, 2019).
National Wealth
Status differences between North and South are reversed in England, residents from the South are generally assumed to be higher in socioeconomic status. They indeed were perceived as significantly higher in status that evoked higher agentic (e.g., efficient, hardworking, intelligent) and lower communal (e.g., emotional, honest, friendly) evaluations. These findings were interpreted that stereotypic differentiation occurs along regional status lines, without regard to specific geographical or climate locations (Jost et al., 2005).
In earlier works about stereotype content, perceived economic development was associated with attributed efficiency (Hagendoorn, 1991; Linssen & Hagendoorn, 1994). As it was shown, the content of national stereotypes in terms of competence strongly corresponds with perceived economic power of the nation state (Phalet & Poppe, 1997; Poppe, 2001; Poppe & Linssen, 1999). Moreover, a change in perceived economic power of the nation states was not only related to changes in terms of competence, but also to changes in terms of morality (Poppe, 2001).
Also, national wealth and warmer climates were also associated with attributions of interpersonal warmth and passion, and business-like competence of people in their own country (McCrae et al., 2007). These results were obtained within the research about national-character stereotypes from the National Character Survey (NCS). Respondents of the NCS in each sample rated a typical member of their own culture in terms of perceived competence and warmth, which were assessed as two facets of conscientiousness and extroversion by the Revised NEO-Personality Inventory using bipolar scales: friendly, warm, affectionate versus cold, aloof, reserved and capable, efficient, competent versus inept, unprepared (Terracciano et al., 2005).
However, the covariation between latitude close to the equator or warm temperature and national wealth is negative because countries by temperate zones tend to be wealthier than countries by the tropics (McCrae et al., 2007; van de Vliert & Murray, 2018; van de Vliert & van Lange, 2019). Consequently, the possible confounding effect also may be here. Thus, this study can puzzle out all closely related focal variables (i.e., latitude, temperature, and GDPpc), which might be confounded, to be covariate with the North-South polarization in stereotypes.
Group and Sample Variation in Competence and Warmth
Warmth stereotypes are more relational, personal, and less consensual (Koch et al., 2020). Accordingly, this study anticipated that people will agree less on ethnic groups’ warmth compared to competence. To consider this possibility, this study takes into account the clusterization of ethnic groups and samples as a way of indirectly testing this assumption. In addition, this study considers ambivalent (mixed) stereotype content for ethnic groups, which has not previously been considered in relation to these three ecological variables; more specifically this paper explores it in terms of the difference in means between warmth and competence.
Method
Data
The data about means of competence and warmth for 77 ethnic groups in 40 combined samples from 38 regions was taken from nine studies within the SCM framework (Ntotal = 8077; approximately Mage = 25 years and 60% female). The dataset contained nine Western European regions (Belgium, Denmark, Finland, Germany, Italy, Norway, Portugal, Spain, Switzerland), one Southeast European region (Greece), one Central European region (Slovakia), four Eastern European regions (Belarus, Georgia, Russia, Ukraine), two Сentral Asian regions (Kazakhstan, Uzbekistan), seven Middle East regions (Afghanistan, Egypt, Iran, Iraq, Israel, Jordan, Lebanon), one Central African region (Uganda), four Southeast Asian regions (Hong Kong, India, Malaysia, Pakistan), one Eastern Asian region (Japan), two Southwest Pacific regions (Australia, New Zealand), and two North American regions (Canada, United States), one Сentral American region (Costa Rica), and three South American regions (Bolivia, Chile, Peru). This dataset and the description of samples are available in Supplemental Material 1.
Procedure
The SCM predictions have shown their robustness across different cultural contexts and over time, as well as using different research methods, and regardless of types of data collection (representative or convenient samples and collected online or paper-and-pencil); moreover, demographic differences within countries do not modify the results (Cuddy et al., 2009; Fiske, 2017). This allows widely employing the Fiske Lab dataset on the SCM maps in research across countries (e.g., Durante et al., 2013, 2017).
This study used an updated version of the Fiske Lab dataset of aggregated social groups evaluates, which also included data from post-communist countries and new data for the US (Bai et al., 2020, Study 1 and Study 2). The dataset was also completed by the combined samples from Canada (Kil, 2014), Germany (Froehlich & Schulte, 2019; Hellmann et al., 2015), Iran (Sharifian et al., 2022), Norway (Bye et al., 2014), Russia (Grigoryev et al., 2019), Slovakia (Findor et al., 2020), and Switzerland (Binggeli et al., 2014), which had an exclusive focus on ethnic groups evaluation.
The studies had identical procedures with one exception. Ethnic groups appeared spontaneously in many SCM groups-listing studies, which then included them in the main SCM surveys in the Fiske Lab dataset. The final sample excluded diaspora minorities (Jews and Roma) and some minorities (e.g., “African Americans” in the US, indigenous groups) because historically it is difficult to associate these ethnic groups with specific countries of origin and estimate the wealth of these places within the current comparative perspective of the study.
Measures
Outcome Variables
Perceived competence and warmth for each ethnic group were measured using a 5-point Likert scale (1 = not at all; 5 = extremely), according to the standard SCM instructions, which asks how they think their society views each group as sincere, trustworthy, capable, competent, etc. (Fiske et al., 2002). The median of the reported Cronbach’s alphas of these measures was above .80.
Antecedent Variables
Latitude for each region was retrieved from Google (Google Developers, 2012 - https://developers.google.com/public-data/docs/canonical/countries_csv [July 15, 2020]). Temperature was operationalized as the average annual mean temperature for each region from 1901 to 2016 according to the World Bank (Climate Change Knowledge Portal - https://climateknowledgeportal.worldbank.org/watershed/161/climate-data-historical [July 15, 2020]). GDP per capita (current US$) as the average estimated score for each region from 1960 to 2018 was taken from the World Bank to assess national wealth (World Bank national accounts data - https://data.worldbank.org/indicator/NY.GDP.PCAP.CD [July 15, 2020]). Figure 1 is a visual presentation of this data. Visual presentation of the data for 77 countries origin of the ethnic groups.
Data Analysis
All statistical analyses and visualization were conducted using R packages (Bates et al., 2015; Lüdecke, 2020; Makowski et al., 2019; R Core Team, 2020; Wickham, 2016). Robust bivariate correlations were applied for the preliminary analysis. The estimated linear mixed models for the main analysis of the dependent data included the independent variables as fixed part as well as ethnic group and sample as random part according to the following equation:
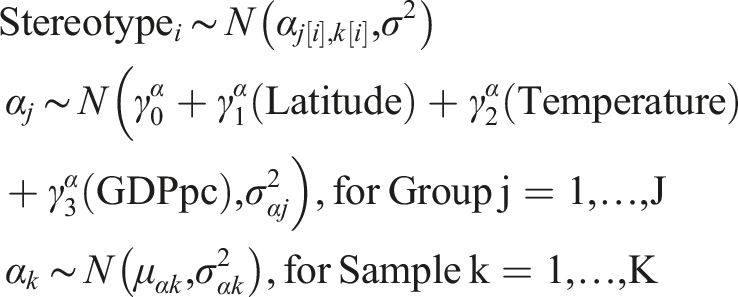
No data transformations (e.g., logarithm, squaring, and etc.) were applied for the estimation.
Results
Robust Bivariate Correlations Between the Focal Variables (N = 188).
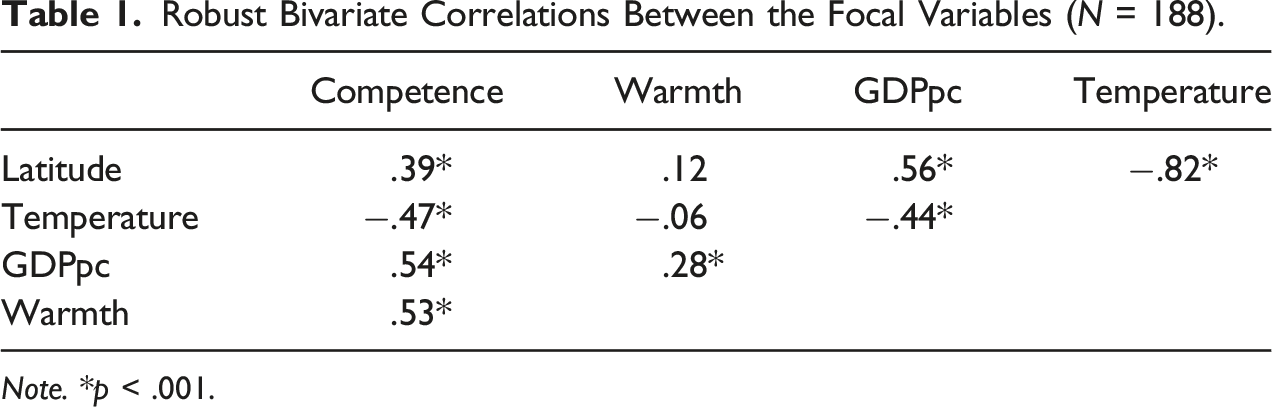
Note. *p < .001.
Unstandardized Estimates by the Linear Mixed Models Predicting the Stereotype Content (N = 188).
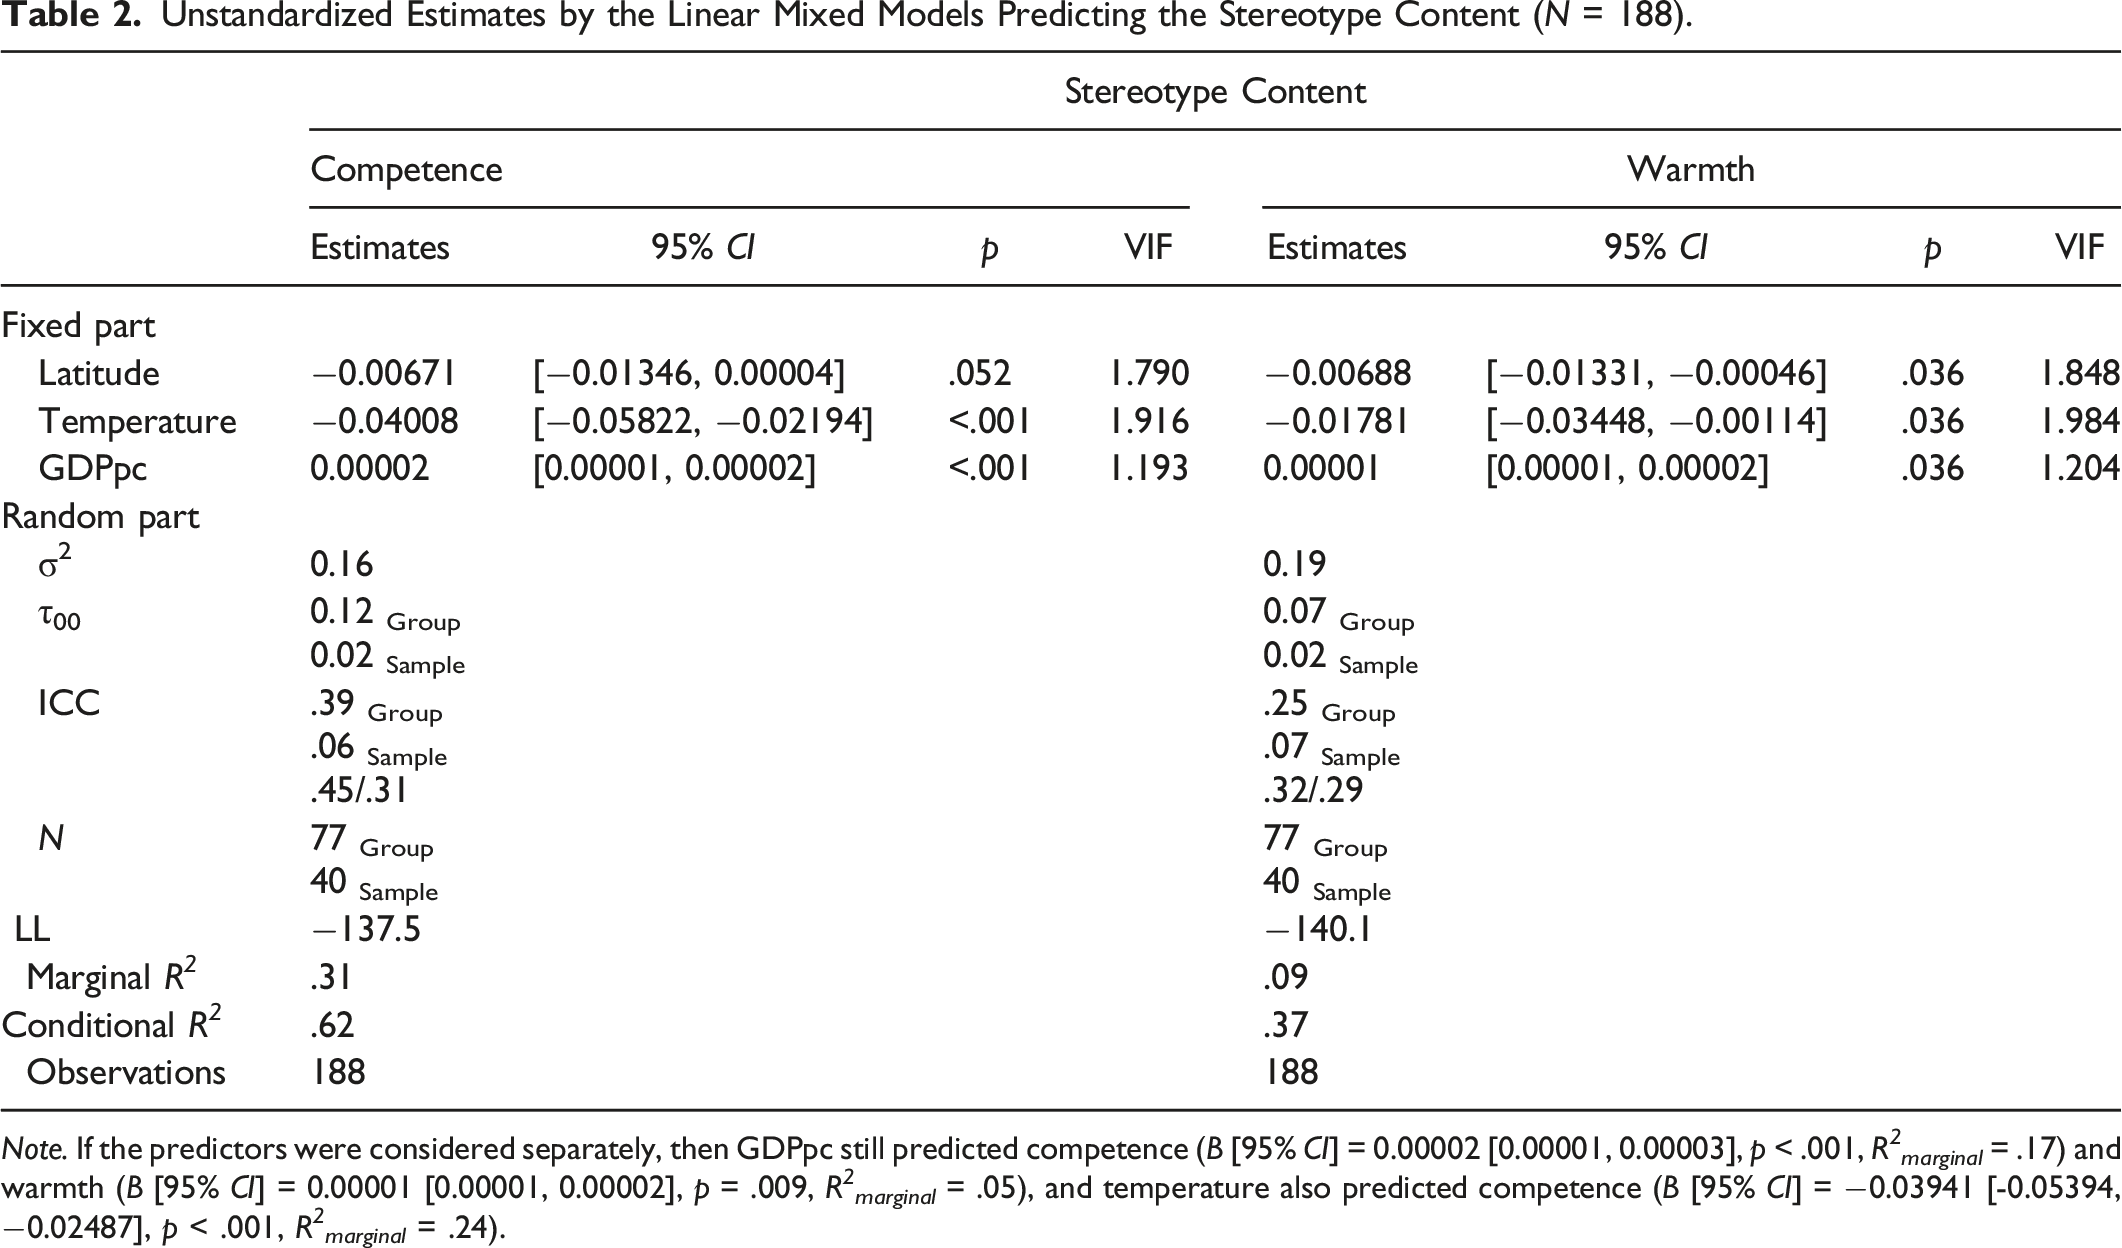
Note. If the predictors were considered separately, then GDPpc still predicted competence (B [95% CI] = 0.00002 [0.00001, 0.00003], p < .001, R 2 marginal = .17) and warmth (B [95% CI] = 0.00001 [0.00001, 0.00002], p = .009, R 2 marginal = .05), and temperature also predicted competence (B [95% CI] = −0.03941 [-0.05394, −0.02487], p < .001, R 2 marginal = .24).
Unstandardized Estimates by the Linear Mixed Model Predicting the Ambivalence (Mixed) Stereotype Content (in Terms of the Difference in Means between Warmth and Competence; N = 188).
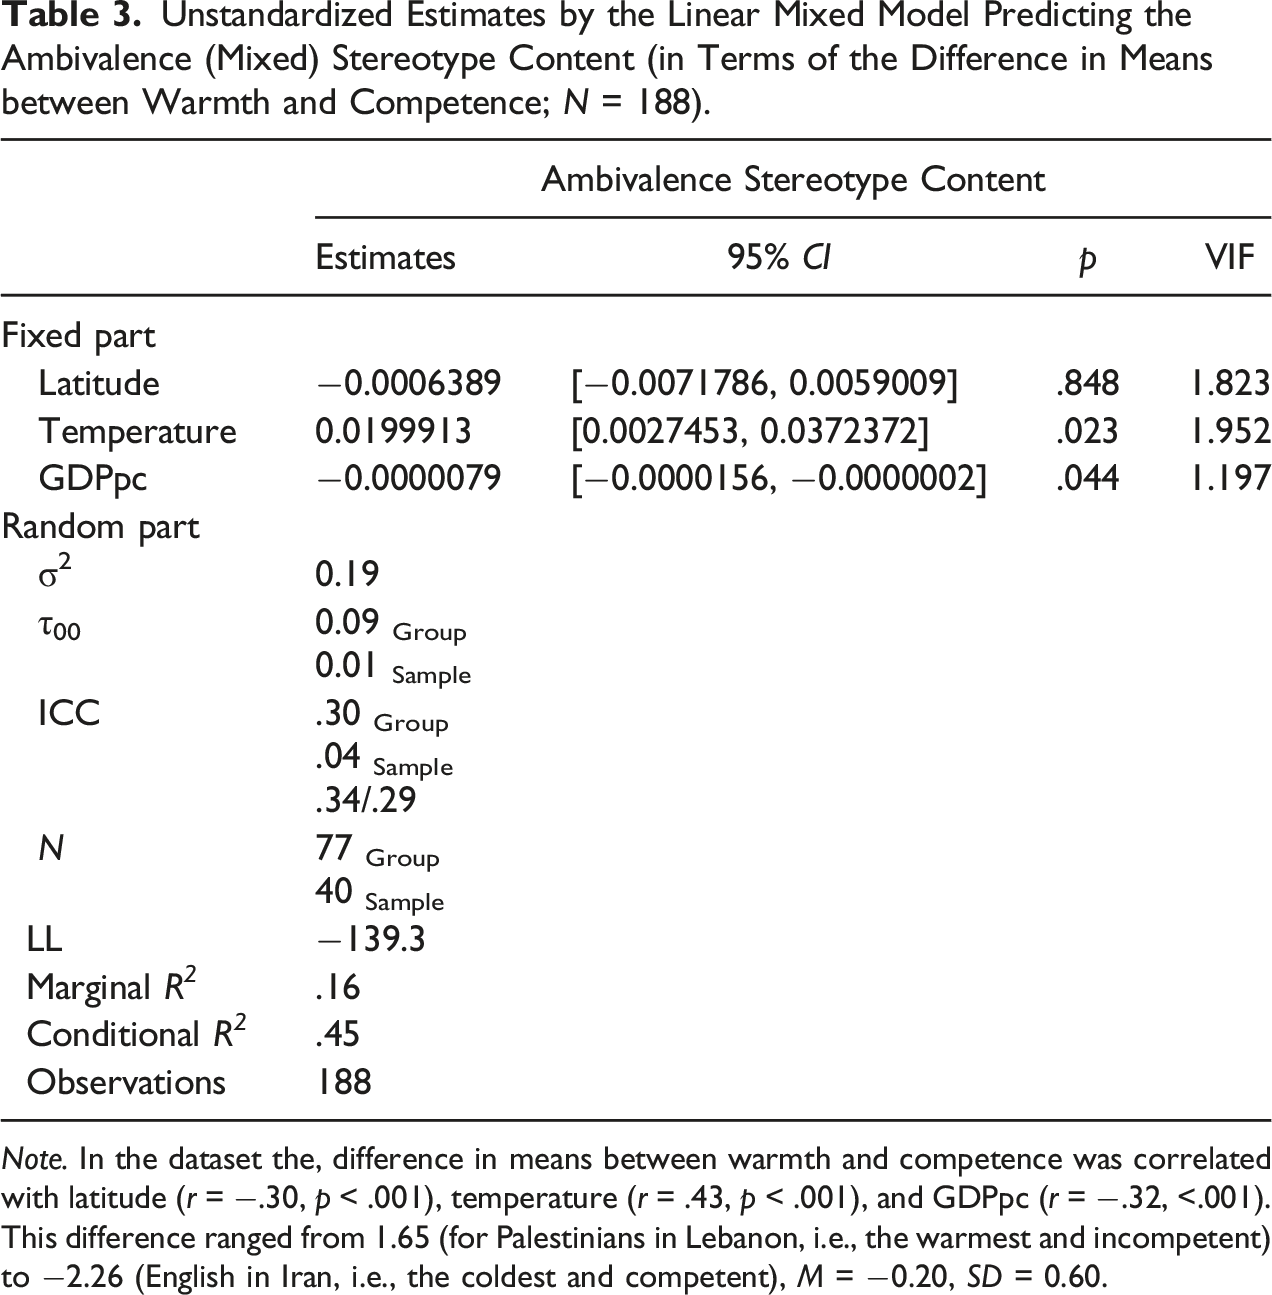
Note. In the dataset the, difference in means between warmth and competence was correlated with latitude (r = −.30, p < .001), temperature (r = .43, p < .001), and GDPpc (r = −.32, <.001). This difference ranged from 1.65 (for Palestinians in Lebanon, i.e., the warmest and incompetent) to −2.26 (English in Iran, i.e., the coldest and competent), M = −0.20, SD = 0.60.

Plotting fixed effects of the linear mixed models predicting the stereotype content.

Plotting fixed effects of the linear mixed models predicting the ambivalence (mixed) stereotype content.
Preliminary Analysis
Competence and warmth stereotypes were positively correlated. Competence was associated with all the independent variables (positively with latitude and GDPpc and negatively with temperature), while warmth was positively associated only with GDPpc. Also, latitude was positively associated with GDPpc and negatively associated with temperature, which in its turn was negatively associated with GDPpc. The bivariate correlations between these variables in the dataset are shown in Table 1.
Main Analysis
The model diagnostics indicated that the estimates were adequate (see Supplemental Figures 1(c)–18(c) in Supplementary Material 3), and the linear mixed models did not indicate multicollinearity (VIF < 1.99). The results are available in Table 2. Both competence and warmth stereotypes were negatively predicted by temperature and were positively predicted by GDPpc. While latitude negatively predicted warmth, there was no robust evidence for a relationship between latitude and competence.
The fixed part of the model was associated with 31% of the explained variance of competence and 9% of warmth, while adding the random part (i.e., a residual variance at a higher level) increased these values to 62% for competence and 37% for warmth. Hence, the random part for competence was also associated with more explained variance than for warmth (31% vs. 28%, respectively). All the grouping conditions had approximately medium size ICCs, but which in general were lower for warmth (i.e., the evaluation of warmth more varied across ethnic groups).
The ambivalence in stereotype content in terms of the difference in means between warmth and competence was positively predicted by temperature and negatively by GDPpc (see Table 3 and Figure 3). The fixed part was associated with 16% of this difference, whereas adding the random part increased these values to 45%.
The quadratic approximation for latitude described 30% of the predicted distribution of competence and 12% of the predicted distribution of warmth by the main models (see Figure 4). Also, according to Figure 4, the dispersion of competence was more than the dispersion of warmth. For comparison of the results with van de Vliert (2020), temperature was correlated with cold stress at −.90, with heat stress at .73, and with ecostress at .82 in the current dataset. Hence, the variable of temperature was overlapping 95% with cold stress, 91% with ecostress, and 85% with heat stress, which additionally indicated some convergence of the results. Plotting the quadratic approximation for latitude describing the predicted bell-shaped distribution of competence and warmth.
Additional Analysis
Samples sizes for some countries were sufficient to run additional analyses at the within-country level (see Supplemental Material 2). This set of additional analyses showed the most strong evidence that competence is negatively associated with temperature and positively associated with GDPpc. It seems that some other effects are just small to manifest in results on such small samples.
In addition, the US subsample demonstrated strong evidence that status is (1) associated with both competence (.88) and warmth (.66); (2) predicted by temperature (−.46) and GDPpc (.41) of countries of origin; (3) to a great extent traced to a bell-shaped distribution around the equator. In general, all the results fit the main claim of this paper that images of ecology, status, and stereotypes are systematically related.
Discussion
This paper explored the North-South hypothesis for competence and warmth. Controlling on GDPpc, the results supported the North-South polarization in stereotypes particularly with regard to temperature. Ethnic groups from warmer climates and from lower wealth countries had a lower evaluation in both stereotypes. Thus, it seems that ethnic groups from more hopeful ecologies were primarily perceived as capable, competent, and trustworthy in comparison to ethnic groups from desperate ecologies surrounding the equator, who possibly were seen as more inefficient, lazy, and aggressive. Hence, this covariation constitutes the North-South polarization in competence and warmth. Note that the results were stronger with temperature than with latitude, which was demonstrated that ethnic groups from more northerly countries are also given a lower evaluation in warmth (discussed in detail below).
The current results can be considered as some evidence that supports the latitudinal gradient of the stereotype content when perceived competence and warmth of ethnic groups are decreased towards the equator in both hemispheres. That is being a part of the social perception process, the stereotype content to some extent follows a bell-shaped distribution around the equator like some other intergroup differentiation variables, conflict culture, national wealth, agricultural subsistence, pathogen stress, and climate demands (see van de Vliert, 2020; van de Vliert & Conway, 2019; van de Vliert & van Lange, 2019). Indeed, the overwhelming majority of the Global South countries (or Third World) are located surrounding the equator according to the traditional definition of the North-South divide from economic geography regarding human development (developed vs. developing).
The results expand on previous findings (see Williams et al., 2015) that stereotypes associated with ethnic groups across countries to some extent track the stereotypes associated with the ecologies in which these ethnic groups are assumed to predominantly live. Moreover, the recent literature actively uses the concept of status of countries of origin (e.g., Gheorghiu et al., 2022; Kustov, 2019; Zhao & Biernat, 2022) but does not provide a systematic view on the ranking includes mapping countries of origin. Thus, this paper has filled this gap. The further discussion considers how these findings can be situated within the broad literature on ethnic stereotypes. In particular, this section suggests a more comprehensive view of the status of ethnic groups and what diagnostic information this provides for social perceivers, as well as what are the effects of countries of origin for warmth evaluation and ambivalence stereotype content.
Comprehensive View on Status of Ethnic Groups
According to the Status Construction Theory, status evokes an inferential process about the abilities of target groups by their relative group position in society (Berger et al., 2002; Ridgeway, 2000, 2018). Status of ethnic groups are widely emphasized as a crucial factor for intercultural relations (e.g., Batkhina, 2020; Berry et al., 1977; Campbell, 1967; Grigoryan, 2020; Grigoryev et al., 2019; Jost et al., 2005; Zou & Cheryan, 2017; see also Koch et al., 2016). In particular, it is argued that status determines contact likelihood across groups and lessens dehumanized perception (Khatry et al., 2021; Kraus & Stephens, 2012; Fiske, 2013). Higher status for minority members is related to more interethnic friendships with natives through more meeting opportunities (Damen et al., 2021).
In the results within the SCM framework, the status of ethnic groups was antecedent to both competence and warmth (see Binggeli et al., 2014; Chen et al., 2021; Froehlich & Schulte, 2019; Grigoryev et al., 2019; Janssens et al., 2015; Kil et al., 2019; Tsukamoto & Fiske, 2017). 3 The perceived structural features of a region (socially and economically unfavorable conditions) had a direct negative association with the status of ethnic groups, suggesting that this variable can be a socio-geographical marker of status, and this may influence stereotypes confounded by the status (Grigoryev et al., 2019). The additional analysis of the data from the US in this study supported as well that status is related to the ecological variables regarding countries of origin (see Supplemental Material 2).
However, it is obvious that information about the status of an ethnic group, which comes from the position of the group in the social structure of society and national wealth of country of origin, is not always consistent. For example, Nigerian immigrants reach a quite high socioeconomic status compared to other ethnic groups in the US, whereas Nigeria is be considered a low national wealth country (of 187 countries, Nigeria ranks below 130 in terms of GDPpc; Kusow, 2014; Oyebamiji & Adekoye, 2019). Ethnic stereotypes presumably reflect both features of ethnic groups in countries of origin and group characteristics carried by ethnic groups in new contexts (Sevillano & Fiske, 2013). For this reason, reactions to ethnic groups differ partly depending on the countries of origin mixed in people’s minds with information about geography, climate, and national wealth, which depends in part on historic accident, determining which social segment in the population will turn up and what are their circumstances (see also T. L. Lee & Fiske, 2006). The details of how these two types of information about group status are combined remain to be understood. For example, Zhao & Biernat (2022) recently discussed that the individual-based/occupation-based status of immigrants could interact with their country-based status to affect assimilation expectations by the host society. Nevertheless, the recent work demonstrated that Spanish host society members prefer immigrants of higher country status over those of lower country status regardless of immigrants’ individual characteristics (Kustov, 2019).
Diagnostic Information of Target’s Status Evaluation for Social Perceivers
The test of the hypothesis that the attitude to exclude or to admit foreigners to society among host members can be formed on the basis of a foreigners’ country of origin economic standing (i.e., the preference to exclude foreigners from relatively poor countries of origin than foreigners from relatively rich countries) provided some evidence for Europe as a whole (Gorodzeisky, 2010; Schmidt, 2021; see also Echabe & Gonzales Castro, 1996; Gheorghiu et al., 2022). 4 Researchers who work within the framework of human capital theory explain the social and economic situation of immigrants by the limited convertibility of human capital across national borders (Chiswick & Miller, 2015). This is because some immigrants have foreign qualifications, often lack language skills in the host country, or have incomplete information about the local labor market. Immigrants are more likely to be unemployed or work part-time, often facing difficulties in getting recognition of their educational qualifications and professional experience. These difficulties are not limited to the first generation of immigrants, for instance, the ethnic group-level analysis found that on the order of four generations or 100 years was required for some ethnic groups to “catch up” in the labor market (Borjas, 1994). 5
Thus, the prior information about the country of origin of each ethnic group might be diagnostic for judgments about the economic value (i.e., opportunity) or burden (i.e., threat) of a particular group for society. It echoes a recent study within a bottom-up intersectional approach that found two main dimensions of immigrant stereotypes in the US. The first dimension referred to hardworking and overlapped with competence and warmth at about 30%, whereas the second dimension referred to national asset and overlapped with competence and warmth at about 55% (see Savaş et al., 2021). Moreover, individuals with a structural goal (e.g., getting an overview of society), when an unknown group increasing in their nation, showed increased interest in competence-related facets as well (Nicolas et al., 2022).
However, how accurate can these stereotypes be? According to a functional approach, stereotypes can be considered as both efficient and accurate tools in intergroup relations (Berry, 1970). Indeed, ethnic stereotypes can have some degree of accuracy, and immigration policy preferences among the host population may be based in part on these accurate stereotypes. For example, Kirkegaard et al. (2020) compared how residents in Denmark perceived fiscal contributions of 32 ethnic groups with actual net fiscal contributions and found the stereotypes to be accurate. This phenomenon of cultural stereotype accuracy can be associated with the concept of “crowd wisdom” 6 and Eagly & Koenig’s (2021) statement that stereotypes stem from observations. 7
At the same time, it is still necessary to clarify this claim in more detail given that national-character stereotypes were often inaccurate. Many works based on the Five-Factor Model of personality inventories consistently found little national-character stereotype accuracy (e.g., Allik et al., 2011; 2015; McCrae et al., 2013; Realo et al., 2009; Terracciano et al., 2005). Firstly, there is variation in descriptive stereotype accuracy by type of accuracy and target group (Jussim et al., 2015). Some group features are more tangible than others, therefore, it is reasonable that judgments about life outcomes or circumstances, physical descriptions, and behaviors would be more accurate than about attitudes and traits of stereotyped groups. Being an imprint of group positions in social structure, competence and warmth do not reflect personality traits but life outcomes. Moreover, judgments about personality traits are very complex since they are closely related to the issue of implicit personality theories.
Secondly, the studies of national-character stereotypes deal with personal stereotypes, while the SCM considers cultural stereotypes, as mentioned above. The SCM procedure asks for society’s views, so it tends to emphasize a culturally shared lay theory of groups in society. Indeed, people from the same culture, whether actively biased or not, know their own cultural stereotypes (e.g., Devine, 1989; Fiske, 1993, 2017). Finally, certain stereotypes, which afterward will be related to threats or opportunities, are a fundamental, evolved feature of the human mind and will be accurate to a nontrivial extent (Neuberg & Sng, 2013).
Variation in Warmth
As it was found earlier, economic power is positively associated with competence and morality (one of the facets of warmth; Poppe, 2001). However, it has been additionally suggested that warm climates can be metaphorically associated with stereotypes of warm interpersonal traits (in many languages friendly people are described as warm and distant people as cold), in the opposite, hot weather can be associated with more prevalence of aggressive behavior and hence lower stereotype warmth (e.g., McCrae et al., 2007). Meanwhile, the results from the multivariate model in this paper showed that ethnic groups from warmer climates, from more low wealth countries, and from more northerly countries had a lower evaluation in warmth. Indeed, aggression and violence that are due to low self-control increase as one moves closer to the equator (van de Vliert & van Lange, 2019; van Lange et al., 2017) that can explain a lower evaluation in warmth for ethnic groups from warmer climates. While a lower evaluation in warmth for ethnic groups from more northerly countries can be explained by Northerners are viewed as less emotionally expressive (e.g., Linssen & Hagendoorn, 1994; Pennebaker et al., 1996) that refers to sociability as another of the facets of warmth. Thus, all the findings indicate some convergence with the previous literature.
Moreover, warmth was predicted by the model worse than other stereotypes and had more variability across ethnic groups. This can indicate the relational character of warmth indeed (see Koch et al., 2020). Perhaps evaluations of warmth depend more on specific intercultural relations in each region and evaluated ethnic groups (i.e., local conditions). However, beyond intergroup relations within societies, international relations likely matter for warmth as well. For example, friendliness, which refers to political antagonism between countries and their military history (e.g., Boster & Maltseva, 2006; Petrenko et al., 2003; Phalet & Poppe, 1997), might be a useful addition to the concept of group interdependence in terms of the SCM regarding ethnic groups.
Ambivalent Stereotypes
One of the main insights of the SCM is that beyond simple negative or positive images of groups this model deals with ambivalent (i.e., mixed) stereotypes (Fiske et al., 2002). Ambivalence in stereotype content refers to the paternalized groups quadrant (i.e., warm and incompetent, LC-HW) and the envied groups quadrant (i.e., cold and competent, HC-LW), which is in a group perception context to be akin to the degree of threat that a group is perceived to possess (Kervyn et al., 2013). The original concept of North-South polarization in stereotypes has not addressed the ambivalence in stereotype content. However, the obtained results showed that ethnic groups from warmer climates and from lower wealth countries were perceived as more ambivalent in the stereotype content (more warm and incompetent) across samples and could manifest some opposite patterns within subsamples (e.g., for more low wealth countries in the US; see Supplemental Material 2).
Previous studies examined other macro variables and covered differences within countries (Gini coefficient and Global Peace Index; see Durante et al., 2013, 2017). They found evidence for some patterns (e.g., high inequality and intermediate peace-conflict within societies predicted high ambivalence) but it was not able to explain all cases. Therefore, future research needs to combine differences within and between countries to consider the interaction of their effects for explanations of the findings regarding the compensatory mechanisms in social cognition.
Convergence With the Other Dimensions
While this paper followed the SCM, the previous literature suggested modernity and self-control as dimensions of spontaneous national stereotypes, at least among Europeans; it seems that the modernity versus self-control space (see Figure 1 in Boster & Maltseva, 2006) could be divided by roughly diagonal lines into the quadrants, which would fit the SCM: HC-HW (e.g., nations: Swedish, German; stereotyped attributes: hard-work, honest), LC-HW (e.g., nations: Italians, Spanish; stereotyped attributes: lazy, generous), HC-LW (e.g., nations: Chinese, Japanese; stereotyped attributes: hard-work, distrust), and LC-LW (e.g., nations: Roma, Nigerian; stereotyped attributes: lazy, aggressive). These hypothetical quadrants and the positions of the groups and stereotyped attributes within them would correspond to what the SCM finds across cultures (see Fiske, 2017). It indicates some convergence of both findings. Moreover, the authors of both models claim some convergence with evaluation and potency by the Osgood semantic differential. As mentioned above, status can determine evaluation in relation to ethnic groups.
However, it is likely that these and other vertical and horizontal dimensions with different labels in fact differently rotated solutions (i.e., statistical artifact) reflecting the same or closely related underlying dimensions of groups’ social perception. The different solutions are outcomes of the difference in applied sets of assessment of stereotyped attributes, which are clustered towards predominant (in terms of quantity and meaning) stereotyped attributes. In particular, this suggestion well explains why the factor loadings in the bifactor confirmatory model on the competence and warmth factors decrease substantially or become insignificant (see Sayans-Jiménez et al., 2017).
In addition to the similarities between these two approaches to the stereotype content, they also demonstrated potentially contradictory findings regarding the consequences of intercultural contact for the differentiation of stereotypes. It was found within the SCM that more-differentiated stereotypes in ethnically homogeneous contexts but more similar, overlapping stereotypes in diverse contexts (i.e., at national, state, and individual levels, more ethnic diversity was associated with less stereotype dispersion; Bai et al., 2020). However, Boster & Maltseva (2006) reported that the geographically close evaluating nations evaluated more similarly (especially target nations that were relatively far away from them) and geographically close nations were evaluated more similarly (especially if they were relatively far away from the evaluating nations).
Limitations
Still Limited Generalizability
Only six groups (Argentines, Australians, Bolivian, Brazilians, New Zealanders, Peruvians) and five samples (Australia, Bolivia, Chile, New Zealand, Peru) represented in the data correspond to residents of the Southern Hemisphere. As a result, the findings so far can be generalized principally to residents of the Northern Hemisphere. However, at least the differences between states in Australia, which are reversed in location, appear to support the findings for the Northern Hemisphere country data. For example, two states that resembled the “South” stereotype were Queensland and Western Australia, whereas the two states that resemble the “North” stereotype were Victoria and South Australia (see Berry, 1969). When the SCM explores in new contexts, further focus on human biogeography and climatoeconomic conditions could help to explain the variation of stereotypes and covariation with them in more detail.
An additional limitation is that diaspora minorities and some other minorities (e.g., Jews, Roma, African Americans) that cannot be associated with an origin from a specific country have been excluded from the dataset of this study, whereas they can represent a significant proportion among ethnic groups across societies. The study has also not considered indigenous groups (e.g., Native Americans) because they are not from another geographic region. Although there is strong experimental evidence that social perceivers possess a lay understanding of ecology’s influence on behavior, whereas stereotypes about African Americans in the US (e.g., impulsive, less invested in their education and children, engaged in opportunistic behavior, sexually promiscuous) may also actually reflect Americans’ stereotypes about African Americans’ presumed home ecologies (see Williams et al., 2015). 8
While this paper provides some results on the ambivalence stereotype content for ethnic groups, the available empirical evidence and the current state of the literature still cannot suggest a strong explanation for the compensatory mechanisms. Therefore, the paper (1) primarily contributes to the understanding of the dichotomy of “valued” versus “devalued” ethnic groups (Global North vs. Global South) and unambivalent ethnic stereotypes (HC-HW vs. LC-LW), and (2) just calls to further work in this direction.
Lack of Process Mediating Variables
A detailed genesis and development of the North-South polarization in stereotypes as historical accident remains underlooked. According to Berry’s ecocultural framework (2018), there are some process mediating variables between ecology and variations in behavioral expression, which were not explored in this paper. As a result, many paths from the distal factors are yet to be explored. To illustrate, personality profiles derived from the diagnostic words of each nation bear close resemblance to national-character stereotypes, which may be partially grounded in the collective linguistic behavior of nations (Snefjella et al., 2018). Furthermore, ecological threats (pathogens, warfare, and resource scarcity) predicted greater cultural tightness, and people in tighter cultures were more prejudiced against ethnic minorities (Jackson et al., 2019). In its turn, these ecological threats and linguistic characteristics are also related to climate and North-South differences (van de Vliert & van Lange, 2019, 2020). In addition, stereotypic traits have the different extent to which they are likely to be expressed in interpersonal discourse, and some of them become and remain culturally normative, whereas others do not (Conway & Schaller, 2007).
Implications
Theoretical Contribution
When the SCM is dealing with ethnic groups, it needs more attention to their status considering information about countries of origin as an important background variable. The SCM needs a greater intersectional focus. There are different interactions between ethnicity and status that still require more attention (Dupree et al., 2021; Fiske & Markus, 2012; Moore-Berg & Karpinski, 2018; Thomas Tobin et al., 2020). Also, stereotypes of men tend to resemble stereotypes of their ethnic groups more than did stereotypes of women (e.g., Eagly & Kite, 1987). The current findings do not address this gender difference, while the ongoing theoretical work on intersectionality suggests how evaluation for ethnicity and gender can be combined (see e.g., Hall et al., 2019; Hester et al., 2020; Savaş et al., 2021).
However, some suggest that despite intersectionality, the most important differences are between the rich and the poor, rather than between different ethnic groups; ethnic differences distract from group-based resource inequalities and social class (Moghaddam, 2020). In turn, the content of the stereotype of the poor consists of relatively low ratings on both competence and warmth, including unfavorable stereotyped attributes, which most often are being lazy, having low intelligence, and not being interested in self-improvement (Lindqvist et al., 2017). In other words, the intercultural relations field needs to also focus on poverty and resource inequalities.
Nevertheless, the perceived high status of Canadian minority groups negatively predicted the integration acculturation expectation (i.e., less support for engaging in both the heritage culture and the larger society) for them among English Canadians (see Kil et al., 2019). This can indicate that in intercultural relations research the SCM also needs to continue considering both tangible and intangible threats as additional aspects of competition, as well as system justification beliefs.
Changing the Content of Stereotypes
Koenig & Eagly (2019) claimed that changing the content of stereotypes requires changing a group’s intergroup relations and/or its typical roles within societies. For example, minimum wage laws that increase the pay of less-skilled occupations could lead to modest changes of status. And, improving access for ethnic groups to appropriate opportunities (e.g., education and training) can lead to changes in roles. A good example is gender stereotypes. When women in the US started in large numbers to enter professions such as lawyer, physician, and professor, then their perceived competence increased, and as a result, men and women stereotypes regarding competence are now more similar (see Eagly et al., 2020).
Berry et al.’s framework (2022) can suggest additional perspective for changing the content of stereotypes through improving intercultural relations in plural societies in three ways: (1) increasing feelings of security (cultural, economic, and personal) constitute positive conditions under which individuals are able to accept and interact with those of other cultural backgrounds (multiculturalism); (2) having friends from other cultural groups and experiencing frequent interactions with others provide the social basis for seeking integration into the society and being positive with respect to the value of cultural diversity for the society as a whole (contact); and (3) seeking to identify with and participate in one’s own cultural group and in the larger society serves as the basis for one’s positive adaptation in the culturally diverse society (integration). Increasing interdependence between groups in these ways should improve the evaluation of warmth for ethnic groups.
In addition to these approaches to interventions within societies, the current results highlight the importance of the establishment or expansion of policies and programs regarding international inequality in terms of the traditional definition of the North-South divide from economic geography. The international inequality evokes upward/downward social comparison, which in turn gives rise to cultural stereotypes about the life outcomes of ethnic groups. Economic development in different places with a desperate ecology could lead to a change in ethnic stereotypes over time.
Conclusions
People can employ their representations about the features of countries of origin of ethnic groups with a combination of information about intergroup relations within societies to deduce status for them, which evokes the corresponding ethnic stereotype content. The information about countries of origin is likely the starting point and the most accessible and quite diagnostic information regarding the judgment about economic outcomes of ethnic groups, especially when people lack information about targets’ unique personal characteristics (i.e., individuating information). This underlines the complex nature of social judgments about ethnic groups, which takes into account multiple sources of information in the social perception process.
Supplemental Material
sj-pdf-1-ccr-10.1177_10693971221080618 – Supplemental Material for Ethnic Stereotype Content Beyond Intergroup Relations Within Societies: Exploring the North-South Hypothesis for Competence and Warmth
Supplemental Material, sj-pdf-1-ccr-10.1177_10693971221080618 for Ethnic Stereotype Content Beyond Intergroup Relations Within Societies: Exploring the North-South Hypothesis for Competence and Warmth by Dmitry Grigoryev in Cross-Cultural Research
Supplemental Material
sj-pdf-2-ccr-10.1177_10693971221080618 – Supplemental Material for Ethnic Stereotype Content Beyond Intergroup Relations Within Societies: Exploring the North-South Hypothesis for Competence and Warmth
Supplemental Material, sj-pdf-2-ccr-10.1177_10693971221080618 for Ethnic Stereotype Content Beyond Intergroup Relations Within Societies: Exploring the North-South Hypothesis for Competence and Warmth by Dmitry Grigoryev in Cross-Cultural Research
Supplemental Material
sj-pdf-3-ccr-10.1177_10693971221080618 – Supplemental Material for Ethnic Stereotype Content Beyond Intergroup Relations Within Societies: Exploring the North-South Hypothesis for Competence and Warmth
Supplemental Material, sj-pdf-3-ccr-10.1177_10693971221080618 for Ethnic Stereotype Content Beyond Intergroup Relations Within Societies: Exploring the North-South Hypothesis for Competence and Warmth by Dmitry Grigoryev in Cross-Cultural Research
Footnotes
Acknowledgments
The author is grateful to Valeria Vlasova for the work on preparing the dataset, which was part of her research internship under his supervision. The author also thanks Hali Kil (University of Montreal) and Mohammad Hasan Sharifian (University of Tehran) for sharing their data.
Declaration of Conflicting Interests
The author(s) declared no potential conflicts of interest with respect to the research, authorship, and/or publication of this article.
Funding
The author(s) disclosed receipt of the following financial support for the research, authorship, and/or publication of this article: The article was prepared within the framework of the HSE University Basic Research Program.
Supplemental Material
Supplemental material for this article is available online.
Notes
Author Biography
References
Supplementary Material
Please find the following supplemental material available below.
For Open Access articles published under a Creative Commons License, all supplemental material carries the same license as the article it is associated with.
For non-Open Access articles published, all supplemental material carries a non-exclusive license, and permission requests for re-use of supplemental material or any part of supplemental material shall be sent directly to the copyright owner as specified in the copyright notice associated with the article.