
Abstract
Over the last two decades, Turkey has enjoyed high rates of economic growth. This study uses “the adjusted net saving” approach to explore to what extent Turkey achieved this growth at the expense of rapid natural resource use and increased environmental pollution in violation of basic sustainability criteria. We examine the components of adjusted net savings (i.e., changes in physical, natural, and human capital) for the period 1970 to 2011 and consider the sectoral shifts resulting from capital investments and accompanying state policies that are driving industrialization in Turkey. We find that the so-called miracle growth in the 2000s has come at the expense of massive natural capital utilization. Although gross fixed capital formation has continued to grow, it has been accompanied by high depreciation, and thus, in the post-2000 period, the net accumulation of physical capital has followed a declining trend.
While the adverse impacts of global warming and environmental degradation have already become prevalent, many national governments continue to prioritize economic growth, depleting renewable and nonrenewable resources in an unsustainable pattern. Alongside such patterns of environmental exploitation is the crucial question of how the rents accruing from such processes are being utilized and invested. Amid debates on the sustainability of current practices of production, trade, and consumption, the global community has failed to give a common and strong response to sustainability concerns that might mitigate against the strong growth ambitions of individual economies and countries.
In this regard, Turkey deserves to be looked at more closely as a developing country making use of its various capital assets as it proceeds upon its economic growth path. To this end, this study explores the changes in Turkey’s physical, human, and natural capital together with the environmental degradation the country is currently undergoing due to the growth-promotion strategies Turkey has been following since the 1970s. Specifically, this study focuses on the 2000s, using an “assets approach” to address the question of Turkey’s sustainability.
As a middle-income country, Turkey achieved high growth rates in the 2000s, with an annual average of around 5%. This rapid economic growth has been widely celebrated by the ruling party, the Justice and Development Party (AKP), and its supporters in the media and academic world, even though the growth process has intensified pressures on the environment. Turkey’s increasing industrialization, urbanization, energy production, and consumption, in progress since the 1980s, but particularly intensifying in the 2000s, have led to air and water pollution, decreasing water sources, loss of biodiversity, coastal erosion, and deforestation (Adaman & Arsel, 2010; Aktar & Baykan, 2012; Baykan, 2008; Ignatow, 2005; Organisation for Economic Co-operation and Development [OECD], 2008). Meanwhile, “Turkey’s share of global CO2 emissions jumped from the 31st place in 1960 to 21st in 2005” (Halıcıoğlu, 2009, p. 1156). In addition, according to the energy balance tables of Turkey’s Ministry of Energy and Natural Resources, as of 2012, the share of renewable energy in the total primary energy supply was only 10.2%. The focus remains on a strong growth economy, despite the impact of these policies on emissions and energy sources, although Turkey also recognizes the need for further work in relation to climate change, energy efficiency, and a transition to clean and renewable energy options. Still, the gap between the policy targets outlined in the 5-year development and action plans and the actual experience of implementation and adherence to environmental regulations remains to be addressed.
In Turkey, productive capital formation accelerated in the 2000s accompanied by rising production and the export of higher value-added manufacturing goods. The share of low value-added sectors (e.g., textiles) in total manufacturing exports declined, while the share of medium-tech industries (e.g., automotive, electrical, and electronic and machinery) increased (Hisarciklilar, Gültekin-Karakaş, & Aşıcı, 2014). However, rising industrial production relied mainly on the use of imported energy and intermediate goods, causing alarmingly high current account deficits in Turkey (US$45.9 billion of current account deficit, which makes around 5.7% of the gross domestic product [GDP] in 2014; World Bank, 2015). Given the dependence of the Turkish economy on imported energy and inputs, the domestic manufacturing and energy production industries continued to be extensively subsidized by the state via successive investment incentive plans in 2004, 2009, and 2012. Moreover, in a similar move, after benefiting from various state support programs, the construction industry also became a leading sector in Turkey in the 2000s, turning the whole country into a construction site. As a result, the 2000s signaled a breaking point from the past not only in terms of industrial production and export but also in terms of rising environmental pressures within Turkey. Nevertheless, the environmental consequences of such a growth-oriented policy have remained secondary at the level of policy making, despite vivid criticisms made by civil society and occupational organizations within Turkey. The countrywide public protests that started in 2013 against the construction project of a shopping mall in Istanbul’s Gezi Park were precisely an expression of widespread dissatisfaction with the environmentally destructive policies of the state, combined with public dismay at the politically oppressive climate operating at that time in Turkey.
In light of these arguments, the current article first presents the theoretical background of the adjusted net saving (ANS) indicator, which is a measure of sustainability that corrects net savings for natural resource depletion, environmental degradation, and educational improvements in human capital. Second, relevant international and Turkish literature on the economic growth–sustainability nexus is reviewed. Third, ANS and its subcomponents as well as its relationship to GDP are descriptively and econometrically analyzed for the 1970–2011 period, with a particular focus on the last decade. Finally, the results are discussed in the last section.
Theoretical Background
Despite not being widely reflected in economic practice, sustainable development has been a concern as well as a target for many countries since the 1990s. In response to this, a wealth of theoretical literature exploring sustainability issues has emerged alongside various models that aim to facilitate the analysis of a country’s economic development in relation to those issues. Of several definitions that take into account various dimensions of sustainability, we find the following comprehensive definition most useful for our purposes: “The long-run process of economic change and development that maximizes the needs and aspirations of the current generations without sacrificing the ability of future generations to meet their needs and aspirations” (van den Berg, 2012, p. 272).
In an attempt to simultaneously cover economic, social, and environmental implications within their analyses, studies such as Barbier (1987) and Pearce, Markandya, and Barbier (1989) have defined sustainability as nondeclining per capita human well-being over time. This framework rests on “an intertemporal equity principle rather than an efficiency principle” (Pearce & Atkinson, 1992, p. 1) where nondeclining per capita well-being simply means nondeclining per capita consumption over time (Hicks, 1946). Needless to say, the achievement of intertemporal and intergenerational equity requires the responsible use of all types of capital—including natural capital—now so that it is possible to maintain, or indeed improve, standards of living in the future. The sustainability question becomes more urgent when we consider that most of the natural resources we utilize today are nonrenewable and therefore must necessarily be exploited responsibly.
Hartwick (1977) proposes a method of ensuring nondeclining consumption across generations by focusing on the case of resource rents arising from nonreproducible natural capital. Hartwick’s rule is based on the principle that countries should reinvest their nonrenewable resource rents in reproducible capital so that future generations will enjoy at least the same level of consumption as that of today. If rents are wasted, he argues, and are not invested in other productive areas, countries are unable to maintain a constant level of consumption. This is a capital assets approach to sustainability that relates long-term human welfare to maintenance of capital stock that consists of renewable and nonrenewable natural resources, environmental assets, human-made (physical) capital, and human capital.
A widely used indicator that leans on this framework is the ANS or the so-called Genuine Saving, which incorporates changes in all types of capital, namely human-made capital, human capital, and natural capital. Based on previous studies on green accounting, the World Bank (2002) estimates genuine savings for countries using the following formula:
Here, net national saving (NNS) is obtained after deducting depreciation of fixed capital from gross national saving; current operating expenditures on education stands for additions to human capital; value of natural resource depletion is the decline in the value of natural resource stocks, and value of damages from pollutants indicates the decrease in the value of environmental quality. (The detailed calculation of each component is summarized in the data section.) If ANS < 0, well-being is expected be lower at some point in the future, and the development path is considered unsustainable. If, on the contrary, ANS > 0, it signals that social welfare is increasing, and the development path is currently sustainable. 1 For social utility (as an increasing function of consumption) to be constant along the development path, genuine savings should be invested in reproducible assets, as human-made assets and natural assets are treated similarly in the ANS framework.
Despite its widespread utility, the ANS indicator has various shortcomings that need to be addressed. From a theoretical perspective, the concept of genuine saving provides a “weak sustainability rule” because the idea underpinning its principles is the perfect substitutability of all types of capital (Pearce & Atkinson, 1993, p. 105). Due to the fact that natural capital does not resemble physical capital, because it is both time-consuming and, once totally exploited, often impossible to regenerate, an assumption of perfect capital substitutability is not realistic. A country needs to keep the level of natural capital stock stable if strong sustainability is desired. Therefore, to arrive at an accurate indication of a country’s performance using the ANS framework, the subcomponents of the ANS must also be part of the analysis. Without this corrective, the total ANS score may obscure the extent of natural resource depletion and environmental pollution in the given country.
An associated problem is how to account for natural capital depletion and general environmental degradation. For instance, living and nonliving resources and pollutants should be dealt with differently while constructing a welfare indicator. Researchers such as Weitzman (1976) and Hamilton (1994, 1996) made major contributions to green accounting measures in which changes to environmental damage, the impact of various pollutants, resource discoveries, extraction and harvest costs as well as the growth of resource stocks are taken into account. However, to be considered in analysis, these components all require reliable data inputs. The World Bank’s ANS calculation falls short of addressing some types of natural resources (such as fisheries, biodiversity, and various uses of water). The ANS calculation also fails to incorporate all aspects of environmental quality such as soil degradation and use of artificial fertilizers and pesticides within its estimates. Data unavailability does not allow for the inclusion of damages from all types of pollutants, counting specifically carbon emissions and particulate matter of less than 10 µm in diameter. As we can see, there is a clear need to improve the capture and generation of relevant data for the environmental dimension of the ANS model.
Recent discussions and criticisms surrounding ANS estimates also question the ethics of attempting to put a price on nature. George Monbiot, a British journalist and environmental commentator, wrote an article for the U.K. newspaper The Guardian in 2012 in which he tore down the environmental policies of the U.K. government, accusing them of commodifying Britain’s natural environment to serve market interests and arguing vociferously that such an approach leads to lots of ecological problems (Monbiot, 2012). The article triggered a series of discussions among activists in the environmental community as well as academics about the governing culture of attaching financial value to natural assets. 2
Nevertheless, the World Bank’s ANS indicator is undoubtedly valuable as a tool for comparing sustainability impacts across different countries. Because national statistics usually vary greatly with respect to methods of data collection, and make use of diverging definitions of indicators and data coverage from country to country, the ANS indicator is a valuable attempt to facilitate comparisons between countries and across time. Furthermore, ANS estimates provide us with clues and ideas about potential approaches to economic policy in terms of diversifying new investments and reducing wasteful consumption to ensure a sustainable development path for societies (Acar, 2011). More important, for our specific purposes in questioning Turkey’s miracle growth, we find it valuable to decompose the ANS results and to explore the trends in its subcomponents over time, as this allows us to track the changes in natural resource depletion and damages from pollutants produced in the process of Turkey’s economic growth. The decomposition of the figures makes possible to deal with one of the weaknesses of ANS measurement; that is, the assumption of perfect substitutability between all types of capital. The following analysis shows that despite the achievement of a relatively higher ANS level since the mid-1980s, natural resource depletion and pollution have accelerated in Turkey, endangering nature and the environment and impacting the general quality of life. On this basis, the current study utilizes the World Bank data for Turkey’s ANS during the 1970–2011 period while also supplementing that data and enriching the scope of analysis by decomposing the numbers behind the subcomponents of the ANS estimate.
Literature on the Economic Growth–Sustainability Nexus
International Literature
There is a vast theoretical literature on environmental or green accounting that aims to understand sustainable development using the capital approach. Nevertheless, empirical research on the economic growth–sustainability nexus has remained unsatisfactory and limited in its conclusions because economic growth has widely been perceived as sufficient in itself to indicate a sustainable development path. Despite this, the long-term growth trends of resource-dependent economies have clearly shown us that economic growth can be costly to nature. The so-called resource curse literature attests to these examples to the extent that it does not equate economic development solely to GDP growth. The ways in which countries utilize resource revenues determines whether their economic development paths will be sustainable or not.
Within the “resource curse” literature, several studies deal with the genuine income or saving patterns of resource-dependent countries. Among them, Atkinson and Hamilton (2003) conduct a cross-country analysis to investigate whether resource-rich economies fail to transform natural resource rents into savings. They use the share of resource rents in GDP for a range of natural resources, including energy, mineral, and timber resources, and also initial period ANS rates as explanatory variables that might lead to a lower or higher growth rate of GDP per capita. As such, the authors question if resource rents are successfully channeled into economic growth. Their main finding is that countries that experience lower rates of GDP growth are those with low or negative ANS rates.
Reestimating the growth regressions of Sachs and Warner (1997) for the 1970–1998 period, Neumayer (2004) analyzes genuine income, which is derived by deducting natural and physical capital depreciation from GDP, in his search for evidence of the resource curse. He undertakes a cross-country analysis of average income growth rates and average genuine income growth rates. His findings point out that a higher reliance on natural resources gives rise to lower growth rates in terms of both income and genuine income.
By relating increasing ANS numbers to several factors, such as control of corruption, trade openness, and population growth, Barbier (2010) examines how a prevalence of corruption affects both the ways in which natural resources are utilized and the reinvestment of resource rents back into other assets. He performs a panel analysis of Asian and African countries for the period of 1970 to 2003 and makes use of natural resource indicators such as export share of agricultural raw materials and a dummy for subsoil wealth per capita to estimate their effects on control of corruption. He finds that controlling corruption levels helps to boost a country’s genuine saving growth. Similarly, Dietz, Neumayer, and Soysa (2007) evidence the negative effects of corruption on the ANS results in resource-abundant countries. Hess (2010) and Acar (2011) prove that resource dependence, proxied by the share of fuels, ores, and metals in merchandise exports, significantly and negatively affects ANS numbers in the investigated countries.
In terms of retrospective analyses, a recent study by Lindmark and Acar (2013) estimates Sweden’s historical ANS series during the period from 1850 to 2000 and detects a point of transition to positive ANS around 1910, which is paralleled by rising growth rates. The authors attribute this transition to increasing investments in human capital, improved sanitary conditions, reduced forest depletion, and accelerated investments in machinery and infrastructure. In a similar study, McLaughlin et al. (2014) investigate Britain’s wealth accounts for the 1760–2000 period, incorporating estimates of produced, natural, and human capital. Their analysis reveals that the evolution of ANS in Britain over time illustrates a transition from depleting natural capital to accumulation of human and produced capital stocks.
To sum up, studies that examine different countries and periods point to the necessity of sustainable use of resources, among other requirements, to grow sustainably. Channeling resource rents into productive means remains crucial to pave the way for sustainable growth.
Literature on Turkey
Studies on Turkey examine the relationship between the environment and economic growth from various angles, but to our knowledge, there is no study that addresses the ecological price of growth-oriented policies by utilizing the ANS indicator. A limited number of works discuss the environmental effects of economic policies in Turkey at a general level (see, e.g., Adaman & Arsel, 2010; Aktar & Baykan, 2012; Baykan, 2008; Ignatow, 2005; OECD, 2008). Some empirical analyses specifically focus on the determinants of CO2 emissions such as GDP per capita, population, energy consumption, and foreign trade (Arı & Zeren, 2011; Atıcı & Kurt, 2007; Özcan & Kayman, 2008). Other studies focus on the sectoral dimension: For instance, Atıcı and Kurt (2007) state that Turkey’s production and exports have tended to draw more on polluter industries, contributing to the country’s rising emissions. Indeed, Tunç, Türüt-Aşık, and Akbostancı (2007) report that in 1996, most CO2 was emitted by “manufacturing” and “energy and mining” sectors (32% and 30%, respectively).
The basic academic question that attracts the attention of many scholars in this field is why Turkey neglects the issue of environmental degradation. Studies tend to attribute this neglect to rent-seeking activities by vested interest groups, patronage-based reciprocity, bribery-based relations, the concept of an authority gap, and general institutional deficiency (Adaman & Arsel, 2008, 2010; Kalaycıoğlu & Gönel, 2005; Ozveren & Nas, 2012). The apparent conflict between well-developed environmental regulations at the theoretical level and the sacrifice of environmental quality at the level of practice is also explained by arguing that Turkey has weak civil society structures that limit the effectiveness of social activism. Pressure from the European Union (EU) for environmentally friendly policies is seen as insufficient to reverse this trend (Adaman & Arsel, 2010). However, Ozveren and Nas (2012) argue that besides the country’s own ambition of development, what lies behind the “ceremonial environmentalism” (p. 1257) is the growth-oriented policies suggested by international institutions, such as the World Bank. Ignatow (2005) also cites Turkey’s dependence on foreign investment and loans as a reason for the poor implementation of environmental regulations.
For several authors, however, Turkey’s energy dependence should be given priority. They view Turkey’s energy dependence, for instance, as a negative result of the country’s inefficient use of domestic resources. Rather than depend on imported energy, these studies argue that Turkey should produce more energy, using domestic hydraulic, coal, oil, and renewable resources (see, e.g., Pamir, 2003). Çağlar (2004) likewise claims that unproductive use of factor endowments prevents Turkey from fulfilling its growth potential.
As the earlier review of the literature indicates, this article is the first that sheds light on the capital investment or disinvestment impacts and the environmental costs of the growth-centred policies in Turkey by using the ANS indicator. Extending the analyses of the World Bank, which estimates overall ANS for Turkey, this work first explores the decomposition of ANS and the trends in its subcomponents for the 1970–2011 period and then analyzes the potential determinants of these savings specifically focusing on GDP. The two lines of analysis complement each other: By investigating the componential changes in ANS alongside the process of economic growth, we are able to determine whether sustainable growth was taking place or not.
An Analysis of ANS in Turkey
The Turkish industry achieved a certain degree of sophistication after the shift from domestically oriented, heavily protected industries toward export markets in the post-1980 period. Turkey’s industrial transformation continued in the mid-1990s where a growing share of higher value-added goods in the manufacturing production and export sector can be seen. The integration of the Turkish economy into the global economy accelerated in the 2000s through rising international trade and monetary flows as well as foreign direct investment (FDI). Moreover, in the 2000s, the construction sector rapidly expanded, thanks to state incentives by providing the needed physical structures in the processes of industrialization and urbanization.
The continuous pressure for growth brought with it rising environmental degradation and resource depletion in the country. Even though this phenomenon was a constituent part of Turkey’s economic model during the import substituting industrialization period, as the analysis later shows, the environmental degradation accelerated dramatically alongside Turkey’s shift to export-oriented industrialization after 1980. However, the literature on the environmental degradation in Turkey does not much engage with the channels through which neoliberal economic policies negatively affected the environment in the post-1980 period. Accordingly, it is commonly argued that if the institutional deficiencies and bad practices were removed, the country’s environmental problems could, to a large extent, be solved. The analyses later aim to highlight the environmental costs of such a growth-centric policy by examining the trends in the components of ANS in Turkey.
Descriptive Analysis of ANS and Its Components
In line with our aim of detecting how sustainable the Turkish growth strategy has been in terms of its various uses of capital, this section examines each component of ANS, describing what it includes, how it is measured, and what kind of trends it displays as the economy grows over time. To this end, we utilize the World Bank data for Turkey in the 1970–2011 period.
The World Bank calculates ANS accounting for each type of capital as follows:

GNS
It is the difference between gross national income and public and private consumption plus net current transfers (World Bank, 2002). It is measured using various data sources such as the OECD, United Nations, International Monetary Fund, and World Development Indicators.
CFC
It corresponds to the decrease in value of capital used up in the process of production. In other words, it is the depreciation of fixed capital and taken from “United Nations Statistics Division’s National Accounts Statistics: Main Aggregates and Detailed Tables, 1997, extrapolated to 1999” (World Bank, 2002). To account for physical capital investments, NNS is calculated by deducting CFC from GNS.
Figure 1 shows gross savings and NNS of Turkey together with CFC. NNS was on an increasing trend until the end of the 1990s. We can see that CFC accelerated very dramatically at the beginning of the 2000s, albeit rising gross savings, which brought a decline in NNS. The recent NNS amount was far below that of the 1990s.
Gross saving, consumption of fixed capital, and net national saving.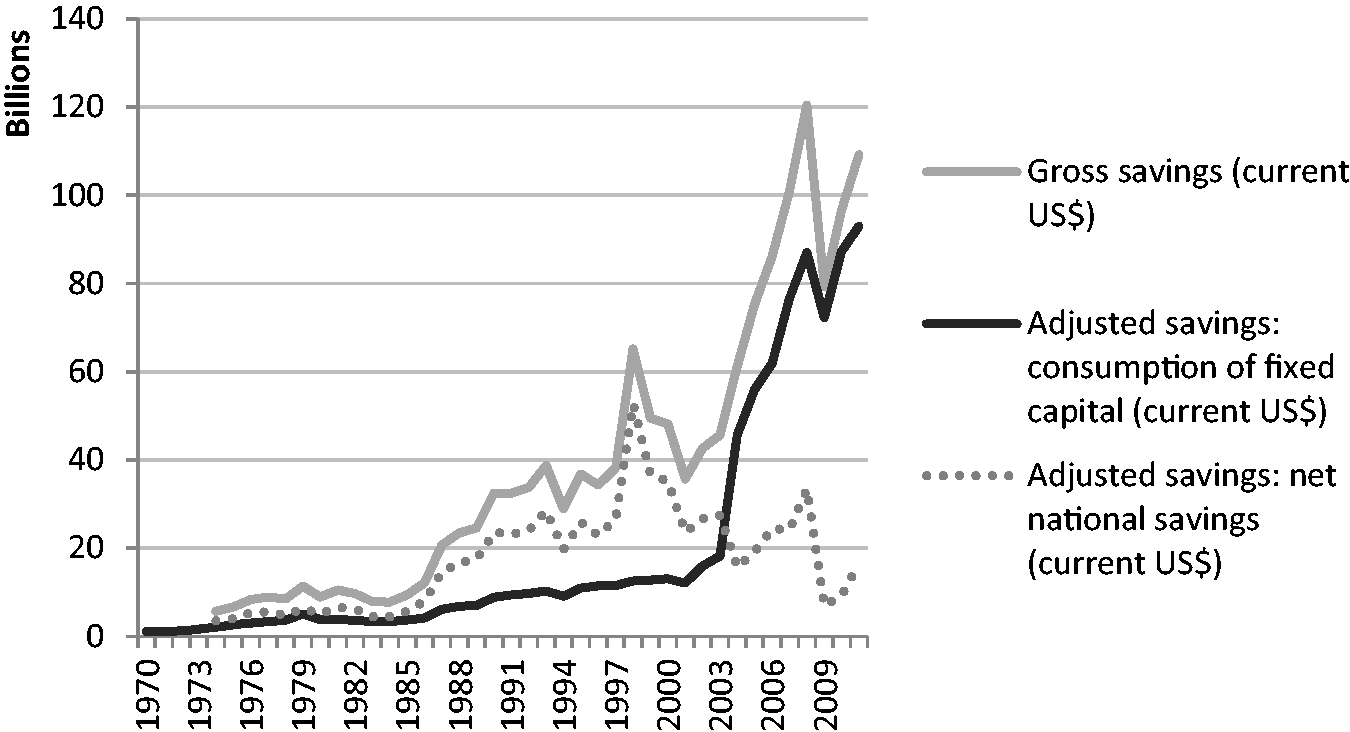
Despite the achievement of a high annual average growth rate in Turkey after the 2001 financial crisis, domestic saving rates continued to decline substantially, making the finance of the growth process volatile. Thus, gross fixed capital investments have been mainly financed through international capital inflows. The period from 2004 to 2008 experienced increases in fixed capital investments, reaching 2.8% of the GDP. The search for productivity growth to achieve a higher level of international competitiveness led capital in Turkey toward higher mechanization and, together with the rising capacity utilization, depreciation also accelerated. Therefore, in the 2000s, along with depreciation, gross fixed capital investments also sharply increased.
EDE
Another component of ANS is the change in human capital, that is, human capital investment, which is measured as “the current operating public expenditures in education” (EDE), including teachers’ salaries and the purchase of books but excluding capital investments in buildings and equipment (World Bank, 2006, p. 155). Standard national accounts would consider EDEs as disinvestment or consumption. However, the fact that human capital is a productive asset that works with or eases the operation of other assets means we must necessarily regard it as an investment (Hamilton, 1994). Thus, the World Bank counts EDEs reported by the United Nations Educational, Scientific and Cultural Organization within the account of human capital investments.
Doubtless, EDE is far from being a perfect measure for human capital changes. One reason is that it takes into account only education but does not directly address the conditions for general public health, knowledge creation, and skills development within the given society. Another reason is that some human capital is embedded in the development of technologies, which is not addressed by genuine saving measurement. Hence, there is a degree of endogeneity that leads to an undervaluation of human capital. In addition, the World Bank methodology assumes that human capital is not subject to depreciation although we know that human capital might deteriorate or decline if it becomes outmoded or old-fashioned.
Despite such deficiencies, EDE is still useful in signaling the more significant trends in human capital formation. Figure 2 clearly shows that Turkey’s EDE increased very slowly in the 1970s and 1980s. It started to rise in a fluctuated manner in the 1990s and then finally began climbing quite sharply after the mid-2000s. The year 2011 accounts for Turkey’s EDE levels amount to US$20 billion. Besides, the available data from the OECD on the school enrollment rates and the educational attainment level of the younger generation indicate that Turkey has significantly paced up its educational expenditure since the year 2000.
3
The steady levels of EDE prior to the 2001 economic crisis were replaced by increased budget allocation for education in the last decade. This increase is understood to be part of an attempt to raise the low skill level of the workforce in Turkey, which, as it stands, is a factor commonly stressed by business associations and official sources as one of the main obstacles hindering a shift toward the production of more sophisticated manufactured goods. The target of higher mechanization and productivity thus requires a transformation in the skill level and composition of the labour force; therefore, the restructuring of the Turkish education system in the 2000s is in line with the needs of the market economy.
Education expenditure.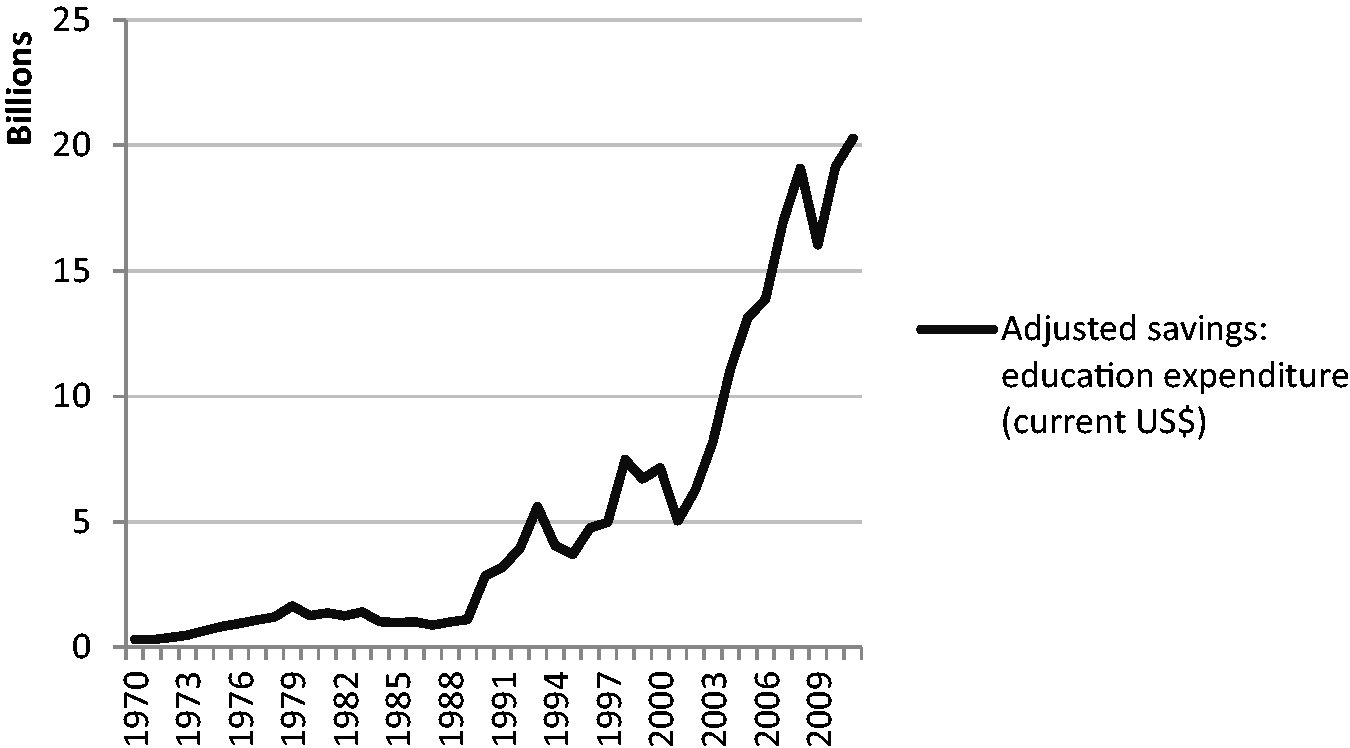
To this end, more emphasis has been put on technical and occupational education, and school attainment has increased across the whole country. In addition, the number of public and private universities increased sharply from 83 in 2004 to 184 in 2014. Nevertheless, significant differences in human capital composition continue to exist between different groups of age, gender, and regions. Furthermore, looking at only educational expenditures and school attainment disregards the significance of the quality of education being provided and devalues those aspects of education that serve to elevate social well-being and happiness, ascribing value to those elements of the education system which serve only to accelerate economic growth. As Yıldız (2015) discovers, Turkey continues to remain below international standards in terms of the indicators measuring education quality. Furthermore, she adds that education spending increasingly moves from the public sector to households, containing also an increase in the share of the highest 20% income group in total EDEs in Turkey. This fact together with the overall privatization policies in education signals that the inequality in access to education between different income segments of society will increase over time.
END
Energy resources are one of the main constituents of natural capital. END consisting of crude oil, natural gas, hard coal, and lignite is measured in terms of the rents they generate. The unit rent is calculated as the difference between the international market price and average unit production cost, because the marginal unit cost is very difficult to obtain. Then, total rent is computed by multiplying the unit rent by the production volume. More formally, END is the ratio of present value of rents, discounted at 4%, to exhaustion time of the resource (World Bank, 2002).
MID
The value of MID is also measured as the rents from various minerals including bauxite, copper, gold, iron, lead, nickel, phosphate, silver, tin, and zinc. Formally, it is calculated as the ratio of present value of rents, discounted at 4%, to exhaustion time of the resource, and finally total rent is calculated multiplying unit resource rents by physical quantities of mineral extracted (World Bank, 2002).
Figure 3 demonstrates END and MID figures for Turkey since the 1970s. One observation that strikes us is the intensification in the use of energy and mineral resources after 2002. Before 2002, END almost never exceeded US$0.5 billion. Similarly, MID was always floating at very low levels. Both disinvestments experienced a sharp decline in 2009, in large part due to the contraction in local and world demand following the global financial crisis. Nevertheless, due to the retrieval of economic growth and continued government support for exploration of natural resources (comprising the new investment incentives for coal extraction and energy generation introduced in 2009 and 2012), the pace was regained shortly after 2009.
Energy and mineral depletion.
Support for local resources has been a strategic priority for the Turkish economy and has found its place in the new development plan (2014–2018). A recent report by Acar, Kitson, and Bridle (2015) estimates the amount of quantifiable subsidies to the coal sector (which range from direct transfers from the Treasury to coal aid for poor families, expenditures for new coal-fired plants, government research and development [R&D] expenditures, and exploration subsidies) in 2013 as US$730 million in total. The sectoral share of mining in GDP has risen from 1.2% in 2006 to 1.5% in 2012 as a result of an almost 10-fold budget allocation during this period. In the long term, it would be legitimate to expect END and MID in Turkey to continue to rise.
An increased need for higher value-added production necessitates more investments in energy. However, the increased capacity for energy production has brought about environmental concerns throughout the whole country, particularly due to small-scale hydropower plants. The dependency on imported energy endangers the continuity of capital accumulation in Turkey and the state has provided incentives for large- and small-scale, foreign and local capitals for energy investments, which has lead to a rise in the use of domestic minerals (Ercan, 2010). In addition, Turkey aims to make greater use of domestic renewable and nonrenewable energy sources to reduce the vulnerability created by the dependency on the imported energy, which now has become a threat to the continuation of economic growth due to the high share of energy in trade deficit.
NFD
Measuring the value of forest depletion departs from measuring rents from exhaustible resources. For instance, it accounts for rent arising from the portion of wood extraction, which exceeds natural increment in every country. It is calculated by the formula “NFD = (roundwood production − increment) × average price × rental rate” (World Bank, 2002, p. 16). The World Bank does not include the part of rents where net natural growth is positive. Hence, for Turkey, NFD figures for all the years from 1970 to 2011 appear to be zero. The idea behind the World Bank’s calculation is that not all the standing forests are merchantable and, also, that the extraction of wood becomes unsustainable when a greater amount of wood is extracted than the forest is able to regenerate. Evidently, this creates a bias in the ANS calculation, obscuring the fact that vast deforestation has taken place across Turkey and that there has been a calculable loss of tree cover in many areas (e.g., Global Forest Watch, which monitors global forest and deforestation trends, reports that Turkey had a tree cover loss of 333,711 hectares in the 2001–2014 period.)
CO2
CO2 damage is evaluated by multiplying emissions (in tons) by US$20, which is assumed to be (a conservative) indication of the social cost of carbon in 1995, taken from Fankhauser (1994). The 1995 figures are then deflated consecutively against the U.S. GDP deflator to calculate the damage in other years. The estimate for carbon damage is obtained via multiplying the value of CO2 emissions by the factor 12/44 due to the atomic weight of carbon in carbon dioxide (World Bank, 2002).
PM10
Particulate matter (PM10) consists of particles with a diameter of 10 µm or less that are harmful to human respiratory systems. Exposure to such particles results in health damage, which is measured as “the willingness to pay to avoid mortality and morbidity attributable to particulate emissions” and calculated as disability adjusted life years lost due to PM10 emissions multiplied by willingness to pay (Hamilton, Ruta, & Tajibaeva, 2006, p. 157). The data for PM10 damage exist only after 1990 (World Bank, 2002).
Figure 4 displays the damages from CO2 and particulate emissions, demonstrating an increase over time. PM10 damage appears to be higher than CO2 damage in all the reported years, and a very large increase between 2001 and 2008 can be seen. Although Turkey had previously enjoyed one of the lowest amounts of per capita CO2 emissions (equivalent to 5.3 tons in 2007) among the OECD countries, the emissions figures exhibit an accelerating trajectory. The ever-increasing levels in CO2 are mainly attributable to the high rates of economic growth and population increase, and unless additional effort is given to reduce carbon intensity, this damage will continue to grow over the long term.
CO2 and PM10 damages.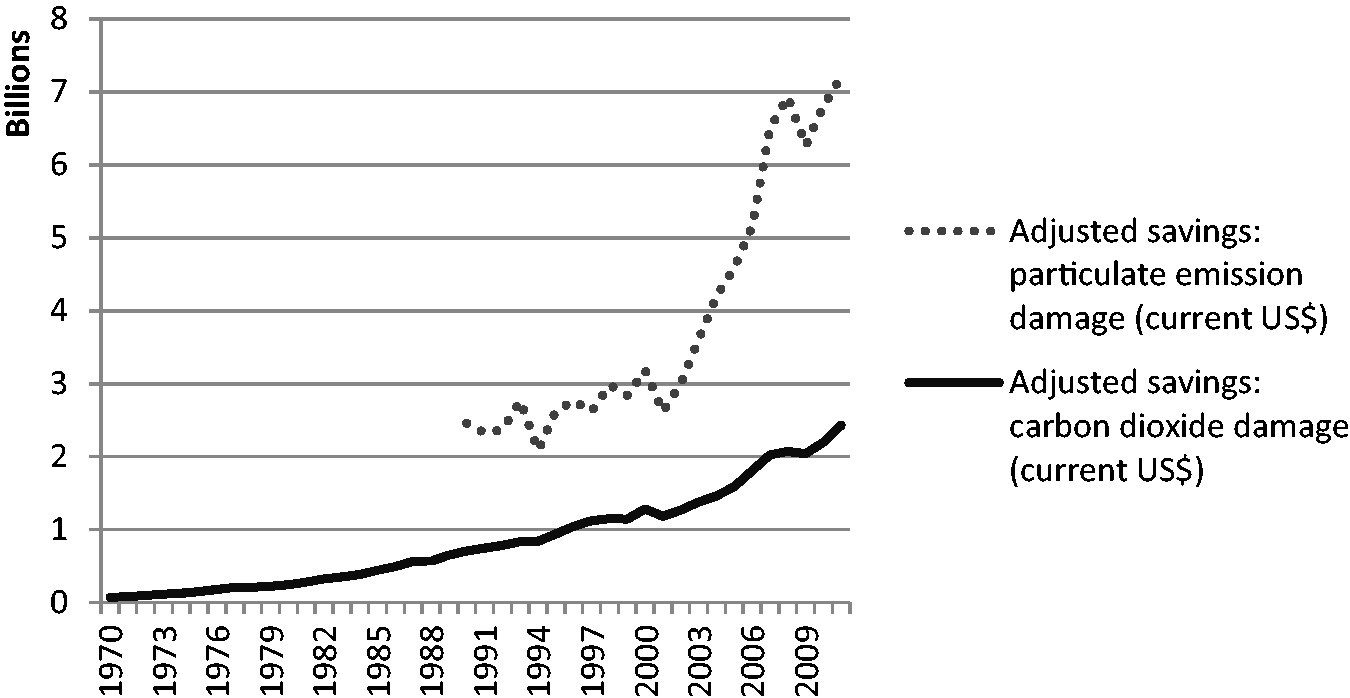
ANS
Adding up NNS and EDE and subtracting natural resource depletion and environmental damage yields the ANS. Because the data for PM10 damage is not available for the pre-1990 period, we plot two ANS figures for the period from 1970 to 2011, one excluding and the other including PM10 as in Figure 5.
Adjusted net saving, excluding and including PM10.
As Figure 5 depicts, Turkey experienced an increasing trend in ANS in favor of sustainability until the end of 1990s and then made a significant turnaround toward a more unsustainable pattern in the 2000s. When the particulate damage is also considered, the extent of environmental damage is revealed further, and ANS consequently decreases. Clearly, additional measures to decrease the intense resource dependency of the economy could help lower the damage.
By decomposing the ANS figures and focusing on the energy and MID as well as CO2 and particulate matter damage, we can see that Turkey’s deepening industrialization and urbanization have not been accompanied with an equal concern for the protection of Turkey’s natural environment. As Aydın (2005) notes, “the long-term environmental consequences of development policies are either simply ignored or not given much attention” (p. 64): While the state has been signatory to international agreements on environmental protection and has incorporated environmental protection into development programs, it simply has turned a blind eye to environmentally harmful industrial and agricultural activities or, even worse, actually has planned some of them. (Aydın, 2005, p. 66) the need for more R&D and innovation so that Turkish manufacturing can produce higher value-added products; increasing domestic saving rates to reduce the dependency of Turkish industry on foreign resources; increasing domestic production of industrial inputs and goods to reduce current account deficits; and more flexibility in labour markets.
FDI inflows, being integral to Turkey’s industrial policies, have also meant rising pressure on the environment. FDI flows to Turkey reached a historically high level in the 2000s, albeit being lower than the flows to the Czech Republic, Hungary, and Poland, countries that became the three most important host countries of the transition economies in the 1990s and 2000s (Yılmaz, 2007, p. 10). As Figure 6 shows, the sectoral distribution of foreign investment reveals that during this period, following the financial intermediation business, manufacturing was the second most attractive sector for transnational corporations (TNCs). More strikingly, in the third place, FDI concentrated on natural resource-based industries such as electricity, gas, and water; real estate and construction; mining and quarrying; hotel and restaurants; and agriculture and fishing, attention to all of which indicated the pressure on the environment created by the TNCs’ activities (Reyhan & Mutlu, 2012).
FDI shares of industries, 2000–2011.
At this point, one should note that since the 1990s, increased use of external financial sources (portfolio investment, FDI, and loans) has been needed by domestic capital to accelerate capitalist industrialization. Therefore, environmental degradation in the country cannot be attributed solely to the financial dependency on rich countries and the interests of TNCs. The interiorization of international money capital to Turkey has been also sought by domestic capital to finance capitalist development. That is to say, environmental concerns have become subservient to rapid industrialization in Turkey, which, as a late capitalist country, has tended to pursue the interests of not only foreign capital but also domestic capital.
The rising need for energy production in the process of economic growth led the Turkish state to initiate the processes for the building of nuclear power stations, despite opposition from the civil society (Aydın, 2005). This fact indicates that environmental degradation in Turkey has not been simply a by-product of rapid economic growth but that the overuse of natural resources has in fact been integral to the mechanisms for growth. Duru (2010) states that being squeezed between the requirements of EU membership and the needs of expanded capitalist accumulation in Turkey, successive AKP governments have prioritized economic growth by modifying the environmental legislations that had previously been harmonized with those of the EU. As a result, the author stresses, environmental degradation accelerated in the 2000s compared with the 1980s and 1990s. Despite the discourse of the AKP on its commitment to sustainable development, the policy implementations such as the steps taken for the establishments of nuclear power stations show that AKP, rather, has been more committed to its words in its 59th government program that sees “the environment … as the stock of the capital” (Pusch, 2005, p. 138).
Econometric Analysis of ANS and Its Determinants
This section is an attempt to provide an insight into the factors that could influence per capita ANS in Turkey. Leaning on the literature findings regarding the determinants of sustainable income and genuine savings, our aim here is to evaluate the effect on ANS per capita of increased GDP especially in the last decade and to detect whether income growth has led to a sustainable or unsustainable development path in Turkey. The available data only allow us to analyze the 1974–2011 period, which is a short trajectory with which to quest the relative sustainability of a country’s economy. However, this analysis complements the descriptive one by trailing the impact of a growth-oriented strategy on sustainable saving patterns in recent years.
The model and the variables of interest for the ordinary least squares estimation of ANS per capita are listed as follows:

OLS Estimation With Robust (HAC) Standard Errors.

Note. OLS = ordinary least squares; HAC = heteroskedasticity and autocorrelation consistent.
p = .10. ***p = .01.
On the other hand, several developing countries such as South Korea (in the 1970s and 1980s), China and India (especially in the 1990s and 2000s), and Malaysia (in the 1990s) seem to have escaped such a problem and have enjoyed increased ANS rates alongside faster economic growth (World Bank, 2011). Auty and Gelb (2001) point out that competitive industrialization with the help of increased human and social capital accumulation was key to the sustainability of the Korean development trajectory in comparison with its counterparts, which depleted natural resources very intensively. Similarly, Malaysia, which is abundant with diffuse natural resources, enjoyed increasing shares of genuine savings in their incomes during the 1990s. This is explained by higher accumulation of produced capital in the development stages of competitive manufacturing and diversifying the economy as it grew and developed (Auty & Gelb, 2001).
Needless to say, one could take into account various other factors to explain each component of ANS as every component displays different characteristics. The present econometric analysis sticks to explaining the determinants of ANS as a whole, with a focus on GDP per capita, in questioning the impact of a growth-oriented strategy on Turkey’s sustainable saving patterns. For a deeper analysis, the distribution of resource rents, public saving and investment decisions, EDEs, and social cost of pollutants need to be investigated in detail.
Conclusion and Discussion
This article explored the impacts of Turkey’s progrowth economic policies on various uses of capital and found that the so-called miracle growth period in the 2000s took place at the expense of massive natural capital utilization. As we have seen, natural capital stocks were rapidly depleted in the 2000s, and those proceeds from natural capital (mines or nonrenewable energy resources) have not been transferred to any other productive asset other than EDEs. Even though gross fixed capital formation continued to grow, it was accompanied by a high amount of depreciation, and thus, the net accumulation of physical capital, which is shown by NNS, has been on a declining trend in the recent period. Moreover, as already stated earlier, the education data do not signify improvements in education quality and equality per se. Furthermore, environmental degradation, shown by an increase in air pollution (PM10) and CO2 emissions, has accelerated in recent years.
Unfortunately, in Turkey’s immediate future, any consideration of environmental sustainability within the country’s general economic policy design appears to be off the table. On the contrary, the structural shift of Turkish manufacturing toward production and the export of higher value-added goods, a trend that, as we have seen, accelerated in the 2000s, is still top of the government’s agenda. Domestic capital in Turkey aims at higher profitability and competitiveness in world markets on the basis of productivity growth. The dependency of Turkish manufacturing on imported inputs fuels the high current account deficits, making the continuity of capital accumulation vulnerable to sudden shifts in the flows of international money capital that finance the deficits in Turkey. To mitigate against this, the state started to give generous incentives for domestic production of imported goods and inputs during the 2000s. In particular, domestic hydropower and coal-based energy production have been encouraged in an attempt to tackle the growing current account deficits resulting from oil imports. In addition, some coastal areas, state forests, natural and historical places have been privatized and opened up to investments (Balaban, 2008). As Aktar and Baykan (2012) add, “housing, transportation and energy projects, which form the basis of the development initiatives in the recent years, are not seeking environmental and social sustainability” (p. 1), and thus, the administrative culture and legal framework is not set up to be eco-friendly. Such progrowth policies will only serve to accelerate environmental degradation in Turkey in the near future.
The increasing subordination of environmental concerns to the priorities of rapid and deepening industrialization shows us that Turkey has been consuming natural resources at the expense of the ecological well-being of future generations. As mentioned before, genuine saving as an indicator of weak sustainability suggests a substitution between different types of capital assets. This assumes that if a decline in one of the capital assets is compensated by an increase in another asset, genuine saving would not decline and sustainability would be ensured. Yet, even if we accept that the decrease in natural resource stocks could be offset when the resource rents are invested in human capital or physical capital, this has demonstrably not been the case. More crucially, relying on the strong sustainability definition, given that degradation of natural capital cannot be compensated by rising human capital and physical capital investments because of irreversibility and nonsubstitutability of natural capital, Turkey’s ambitious development projects apparently harm natural resources. Such policies discount notions of the future generations’ right to live healthily on the planet and, more importantly, disrespect the existence of nature in itself.
Overall, the requirements of the structural transformation in Turkey’s industry and associated conjunctural agendas of fractions of capital need to be considered in the explanation of the environmentally harmful growth policies. The AKP, the ruling party in Turkey since 2002, while facilitating environmental regulations according to the EU norms, has been responsive to the demands from its supporter capital groups by also leaving legal loopholes or weakening the environmental legislations through amendments (Kurt, 2013). The mining licenses given to a TNC destroying Mount Ida in western Turkey represent a good example of the lack of environmental concerns at play in these governmental decisions. In addition, the demands by the international financial institutions such as the International Monetary Fund and World Bank for continuous economic growth and liberalization conflict with the prioritization of environmental protection (Aydın, 2005). Having a significant share in the Turkish economy, small- to medium-size enterprises, whose primary concern is their search for profitability and competitiveness in both the domestic and world markets, in many cases disregard the environmental problems created by their economic practice (see Kalaycıoğlu & Gönel, 2005). In particular, the so-called Anatolian Tigers and small to medium-size enterprises in general, which operate under subcontracting relationships with TNCs and large domestic capital, are often highlighted as the prime culprits in environmental pollution within Turkey (Aydın, 2005). Akbulut and Adaman (2013) draw attention to the generous state incentives in the construction and energy sectors in the 2000s, which accelerated accumulation in the hands of precisely the small- to medium-scale capital that supports the ruling party and which aims to expand both domestically and internationally. This growth fetishism, they argue, has a spatial characteristic and accelerated the process of commodification of natural assets in Turkey. Thus, in general, the AKP’s policies have responded to the demands of domestic and foreign capital to varying degrees. Successive AKP governments have managed the legislative and regulatory changes to facilitate the integration of domestic economy into the global economy, and in the process, increasingly turning natural resources into an input for capital accumulation (Duru, 2010).
Going forward, an important question arises surrounding which sectors and subsectors ought to be prioritized when making investments to ensure sustainability. However, at this stage, we can first say that without a paradigmatic shift in the current organization of production, trade, and consumption, both in the world and in Turkey, the resultant environmental damages will continue in the future. The search for “more production, more sales, more consumption and more profitability” by corporations and regulatory policies (at the local, national, and international levels) that facilitate global integrations of expanding geographies to the world capitalism will only accelerate environmental costs. On this basis, at least environmental damage could be lessened if national governments consider environmental protection along with growth-oriented policies. Industries that pollute less could be prioritized; coastal areas, water sources, and forests could be protected; alternative rural development policies could be put into practice by prioritizing the needs of rural population rather than turning localities merely into nodes of capitalist accumulation. Currently, Turkey is far away from such a perspective, as we can witness in the rapid erosion of the environment. Indeed, on the contrary, the shift in regional policies in Turkey in the 2000s under the auspices of the EU, OECD, and World Bank contributed in fact to the extensive use of natural resources. Rather than reducing massive regional disparities in line with the equity principle, regional policies in Turkey have increasingly aimed at increasing regional competitiveness by mobilizing local resources. Adopting such an approach was expected to ease the integration of regional localities into the world economy under subcontracting relationships with TNCs and large-scale domestic capitals (Ercan, 2006). Yet, this shift in regional policies has also contributed to accelerated environmental degradation and resource depletion, as can be seen in the example of the immense damage caused by the mushrooming hydropower and wind power plants in Anatolia. Rather than providing generous state incentives to utilize inefficient coal mining, renewable sources of energy that do not destroy the natural environment must be prioritized. Furthermore, the ongoing construction projects of the third airport in Istanbul, the third bridge over the Bosphorus, and the planned Canal Istanbul project (an artificial seaway between the Black Sea and the Marmara Sea) are all expected to increase both population density and construction activities in the northern part of the city, an area that contains Istanbul’s last remaining forests, its water sources, and its natural wildlife habitats.
In conclusion, the ANS is not a direct environmental sustainability indicator but allows us to see some trends in resource depletion and pollution throughout economic growth process. Future research is necessary to explore the environmental costs of Turkey’s growth-centric policies by utilizing other tools that directly assess environmental sustainability. A potentially illuminating area for future studies in this field would be an analysis of the data in conjunction with the Ecological Footprint and the Environmental Performance Index.
Footnotes
Acknowledgments
The authors would like to thank A. Yasemin Örücü, who has contributed to this study with her valuable suggestions, and the participants of the Istanbul Carbon Summit (Turkey, April 3–5, 2014) and the International Conference of the Turkish Economic Association (Turkey, October 18–20, 2014) for fruitful comments.
Declaration of Conflicting Interests
The authors declared no potential conflicts of interest with respect to the research, authorship, and/or publication of this article.
Funding
The authors received no financial support for the research, authorship, and/or publication of this article.