



Abstract
Iconic destinations are benchmarks for tourism development, but their effects on the environment are debatable. To highlight the tourism attractiveness factors of sustainability in the world’s most visited destinations, we applied clustering and multiple regression to specific indicators for the period 2000–2020. We observed a relatively high heterogeneity in terms of sustainability, with destinations split into four clusters: C1 (France, Spain, Italy, Germany and UK), C2 (Mexico and Thailand), C3 (USA, China) and C4 (Turkey). Unsustainable factors in all destinations include the industry and construction sector, social insecurity, inflation and transport services development. Renewable energy consumption is sustainable, while economic growth, education and tourism indicators have antagonistic effects. The effects of tourism attractiveness factors on the environment have decision-making implications at all levels. The novelty of this analysis lies in the tourism attractiveness factors examined, and the results can help shape tourism development policies in balance with structural policies such as energy and environment.
Introduction
Tourism is a growing sector worldwide. It has also become an important activity for developing countries as it supports economic convergence and growth. Tourism development depends on numerous economic, social and infrastructural factors such as transport, geopolitical conditions, investment, culture, peace, environment, people, number of tourists, education, price and income levels, the size of the economy of the countries sending and receiving tourists, cultural heritage and natural resources to which are added other determinants related to economic growth and development. In the absence of additional factors of progress, tourism loses its explanatory power for growth, including in predominantly tourist countries, so that, for a long-term contribution to economic growth, tourism becomes effective only when it is integrated into a broad development strategy.
The most attractive destinations in the world are a benchmark for countries which pursue growth through tourism, but the way in which this objective is achieved, including in relation to the environment, remains debatable. The most popular destinations in 2019, based on the number of visitors, were France, Spain, USA, China, Italy, Turkey, Mexico, Thailand, Germany and the United Kingdom (World Population Review, 2023). These destinations have formed the hierarchy of the world’s top ten most visited tourist destinations in recent years, sometimes changing their order. These ten destinations constitute a model of development through tourism, being considered the most attractive ones.
The main tourism attractiveness factor is culture (Canale et al., 2019; Ouchen & Montargot, 2021). In 2021, there were 1153 UNESCO World Heritage Sites worldwide, with the highest number located in Italy, with 58 sites (53 cultural and 5 natural). Other significant UNESCO heritage sites are in China (56), Germany (51), Spain (49), France (48), India (40), Mexico (37), the UK (34), Russia (29) and Iran (26). The USA, Brazil, Japan, Austria and Canada each have 20 UNESCO heritage sites (Buchholz, 2021). Coincidentally or not, the most attractive destinations for tourists are often included on the UNESCO list, with rich cultural and natural heritage. In addition to culture, there are other determinants of attractiveness with uncertain environmental effects. Currently, sustainability and well-being are paramount values in the development of tourist destinations (Faroldi et al., 2019). For any destination, it becomes important to maintain a balance between attractiveness and environmental quality.
The attractiveness of a destination refers to its ability to meet visitors' expectations regarding facilities, activities, landscapes, biodiversity and sometimes depends on the marketing practiced (Kronenberg et al., 2020). Tourism attractiveness is perceived as a key element for attracting visitors and investors (Sinambela, 2021). For tourists, attraction to a destination reflects their feelings, beliefs and opinions about its ability to provide optimal conditions for fulfilling vacation needs. A destination should include qualitative basic elements which can influence tourists' decisions, such as attractions, accommodation, accessibility and local communities (Tseng et al., 2019). The value of tourism attractions stimulates interest in a destination and increases the number of tourists. Maintaining or even improving attractiveness also involves the action of anthropogenic factors with effects on the environment by increasing greenhouse gas emissions as a result of deforestation, construction, transport, etc.
Some tourism attractiveness factors affect the environment through their direct or indirect impact on emissions. In this study, we equate the amount of greenhouse gases decrease with sustainability. Starting from the importance given to tourism and sustainability, this paper aims to highlight the sustainability of certain factors of attractiveness in the world’s most visited tourist destinations. The novelty of this study consists in the analysis of the effect of some tourism attractiveness factors on sustainability measured by the amount of greenhouse gases in the most visited destinations in the world.
Achieving the objective requires an approach which includes the analysis of the literature framework on three components, sustainable tourism, attractiveness factors, sustainability of tourism attractiveness factors, the succinct presentation of the methodology – data and methods, the presentation of results and conclusions.
Literature Review
Sustainable Tourism
In the literature, we find numerous analyses about the effects of tourism and its determinants on emissions and sustainability. Sustainability is studied from four perspectives: environmental, socio-cultural, economic and institutional (Doğan, 2019). From an economic perspective, tourism is known as a contributor to the income of human communities, but from an ecological standpoint, it poses a challenge. Filipiak et al. (2020) describe sustainable tourism as the form of activity which has a minimal impact on the visited places and a positive impact on society.
The tourism industry is considered one of the major contributors to emissions, but Banga et al. (2022) have noticed that tourism is not significantly related to pollution due to the growth of production and consumption of renewable energy. On the other hand, D’Souza et al. (2023) have explained the concept of last chance tourism in relation to emissions growth and have noted that despite awareness of the environmental risks associated with tourism, consumption patterns have not changed. The fact that tourism is unsustainable is also evident in the study conducted by Campos et al. (2022).
The impact of tourism on environmental quality, assessed by the amount of greenhouse gas emissions, has been studied using indicators such as the number of tourist arrivals (Santos et al., 2022), energy consumption, economic growth and globalisation (Xiong et al., 2022), architecture and construction (Doğan, 2019), international tourism receipts in relation to education and government spending (Anser et al., 2019), people`s socio-economic characteristics (Tardieu & Tuffery, 2019) and air transportation demonstrating the unsustainable nature of tourism attractiveness factors.
Canale et al. (2019) found that economic well-being and environmental concerns play an important role in attracting tourists, along with the degree of economic openness. Le & Nguyen (2020) conducted a study and found that tourism-related transportation pollutes the environment, as does the increase in the number of tourists, but the effects of tourism on the environment vary greatly when analysing different income levels. Eyuboglu & Uzar (2019) found that economic growth and energy consumption drive long-term tourism but also lead to increased emissions, and visitors pay attention to the environmental quality of their destinations.
Tourism Attractiveness Factors
Cillo et al. (2019) consider that the attractiveness of a destination depends on cultural opportunities, the quality of accommodation and transportation infrastructure, while Lee (2020) discussed the 4A’s (Attractions, Access, Amenities and Auxiliary Services). Dey et al. (2020) divided the tourism attractiveness factors into two categories: cultural and rural attractions, and the destination’s location and transportation, with uniqueness enhancing the relationship between these factors. The most important tourism attractiveness factors include infrastructure, location, services and natural attractions. Tseng et al. (2019) characterised tourism potential as the capacity of a place to fascinate and attract tourists through convenient access, high-value resources, education, facilities, services and infrastructure.
Digitisation and new technologies protect cultural heritage and promote tourism (Tse & Tung, 2021). The internet has become the most used tool to access information, and digital content influences the perception of certain destinations, as stated in a study by Cillo et al. (2019). Ferrer-Rosell et al. (2020) observed that social media networks became a fundamental tool used for promotion, customer interaction and sales stimulation. According to Filipiak et al. (2020), the digitisation of the tourism economy contributes to the increased efficiency of economic operators with a positive impact on consumers.
Usmani et al. (2020) specify that there is an interdependent relationship between tourism and economic growth, as tourism development supports economic growth, and economic growth supports tourism development. Sigalat-Signes et al. (2019) find that tourism is strongly related to development, and its dynamism has helped it become a factor of progress, correlated with the techno-digital revolution transforming destinations into smart ones.
Pike and Kotsi (2020) consider safety as a key tourism attractiveness factor, along with linguistic similarity, local respect, adequate air infrastructure, cleanliness of the environment, attractiveness of the area and the offering of new experiences. Ouchen & Montargot (2021) find that the number of tourists is positively and significantly determined by political stability, absence of violence, human development evaluated through living standards, life expectancy, and education, and an increase in the number of visitors from one country has a positive impact on neighbouring countries.
Education is important as it shapes the residents’ behaviour. Tse and Tung (2021) note the existence of various types of resident behaviour, which are undoubtedly influenced by education. Positive behaviour associated with interaction and communication skills strengthens tourists' vision and improves the image of the destination. Vaduva et al. (2020) consider education, especially in tourism, indispensable for destination development, improving the quality and price of tourist products.
Accommodation, gastronomy, facilities and conditions offered by a destination arouse tourists' interest, constituting factors of attractiveness and loyalty, as shown in a study by Yin et al. (2020). Khairi and Darmawan (2021) described an attractive tourist area as accessible in terms of transportation infrastructure, safe, offering comfortable facilities and an environment capable of supporting tourist facilities.
Shpak et al. (2022) divided the tourism attractiveness factors into two categories: major factors (natural resources, anthropogenic resources, labour resources, material and technical base) and minor factors (marketing support – local brands, external infrastructure, management system; country image, environmental quality and local population). Ul and Chaudhary (2021) mentioned primary attractiveness factors (nature, culture and local architecture) and secondary attractiveness factors (accommodation, transportation, services and facilities).
Sustainability of Tourism Attractiveness Factors
The tourism attractiveness factors motivate the travel decision, but they develop a certain relationship with the environment. The paths to sustainability are difficult to evaluate holistically.
A study conducted by Destek and Aydın (2022) aimed to investigate the impact of tourism on sustainable development in the top ten most visited countries. It concludes that tourism, energy intensity and urbanisation have positive effects on economic growth and negative effects on sustainability. The harmful effects of tourism (such as the number of tourists and tourism revenues) on sustainable development are greater than the positive effects on economic growth. Adebayo et al. (2022), studying the case of Thailand, conclude that globalisation, tourist arrivals, economic growth and the consumption of renewable energy from conventional sources are unsustainable, thus highlighting the need for solid and efficient environmental policies. Bekun et al. (2021) studied emerging industrialised countries and found that non-renewable energy and economic growth affect environmental quality, and sustainable tourism has an increasingly detrimental effect on economic growth. Tourism and the increasing demand for non-renewable energy have unsustainable consequences, hence the need for a paradigm shift towards sustainability, along with the adoption of the principle that polluters pay to mitigate the negative implications of energy consumption from conventional sources.
Stein et al. (2020) argue that sustainable development requires an appropriate educational framework, and our way of existence has an inherently violent and unsustainable nature. They propose a shift from education for sustainable development to education for the end of the world as we know it, based on the belief that education resolves issues which only superficially stem from lack of information, immorality, harmful desires and investments, and promised satisfactions of modernity. Education becomes an optimal pathway for changing attitudes towards the environment and behaviour. According to Kohl et al. (2021), higher education, from its beginnings, has shown a strong commitment to sustainability, limited by primarily focusing on information provision.
Jamwal et al. (2021) mentioned that the issue of global sustainability emerged with the development of industrialisation. Developed countries have addressed this issue, with their industries becoming sustainable as a result of adopting new technologies, but emerging countries face limitations in resolving this aspect. Ogunmakinde et al. (2022) note that the construction industry plays a significant role in economic growth but hinders sustainable development goals. The fourth industrial revolution and digital transformation, according to Ghobakhloo’s study (2020), are progressing exponentially, changing the way people live and bringing new optimism for sustainability. Filipiak et al. (2020) state that countries with low economic growth seek to improve their situation through the use of digitisation, with a focus on sustainable development.
Long and Ji (2019) emphasised that for a sustainable development strategy, the quality of economic growth is a critical concern. Waheed et al. (2019) find that energy growth and consumption are significant sources of unsustainability, particularly in developing countries. In developed countries, lack of sustainability is not associated with economic growth, and in both categories of countries, the consumption of renewable energy highly determines sustainability.
Khan et al. (2019) studied the effects of logistics operations on the environment, including transportation services, and found that their intensification was negatively associated with social and environmental issues. Similarly, political instability, natural disasters and terrorism have similar effects. Transportation services and the entire infrastructure associated, according to Thacker et al. (2019), are driven by the desire to increase economic productivity and workforce employment, and directly and indirectly influencing the achievement of sustainable development goals. In an economic context, Bilal et al. (2022) have shown that alternative energy sources and inflation are negatively associated with economic growth and negatively impact environmental quality.
Methodology
Data
The indicators come from multiple databases, describe tourism attractiveness factors, and correspond to the period 2000–2020. Most of the indicators were taken from the World Bank (2023), Eurostat, and Countryeconomy (2017, 2023) countryeconomy.com sites.
The quantity of greenhouse gas (GHG) represents the dependent variable of the study. In the literature, GHG is used for sustainability assessment (Campos et al., 2022).
The independent variables describe the tourism sector (number of arrivals (ARR), International Tourism Receipts (ITR), and Air Transport Passengers (AT)), economic factors (gross domestic product per capita (GDP), a measure of economic growth; value added by industry and construction (IC), Renewable energy consumption (CREG), Transport services (TS), and inflation rate (IR)), educational factors (gross enrolment ratio in primary school (EPS), gross enrolment ratio in secondary school (ESS), gross enrolment ratio in tertiary school (ETS), and average School Years Number (ASN)), and related aspects – digitisation and safety (Individuals using the internet (IUI) and International Homicides (IH), which according to countryeconomy.com represents the intentional homicide rate per 100,000 inhabitants).
In the literature, tourism indicators are considered tourism attractiveness factors (Colloca & Lipari, 2022) with effects on the quantity of greenhouse gases (Eyuboglu & Uzar, 2019; Le & Nguyen, 2020). The literature includes analyses regarding the relationship among residents' education, tourism and sustainability (Salmi and D’Addio, 2020). The relationship between economic indicators and emissions has been the subject of numerous studies (Eyuboglu & Uzar, 2019), as well as the relationship between digitisation and safety on one hand, and emissions and tourism on the other (Wang et al., 2020).
Methods
Clustering Method
In the empirical analysis, we employed two methods, clustering and regression. We applied clustering because the countries in the target group are geographically, economically and socially heterogeneous. Five are European states, two are Asian, two are from the American continents and one is Euro-Asian. In terms of human development, eight are highly developed states and two are developed. Among the top ten tourist destinations, Germany (ranked 9) is the most developed in terms of the Human Development Index (HDI). The United States (ranked 21), Spain (ranked 27), France (ranked 28), Italy (ranked 30), Turkey (ranked 48) and Thailand (ranked 66) are among the highly developed economies, while China (ranked 79) and Mexico (ranked 86) are among the developed ones (United Nations, 2022). The heterogeneity requires evaluating the commonalities of the destinations in relation to the variables analysed. Clustering is a segmentation method which identifies homogeneous groups of elements (clusters). The elements within a cluster are similar to each other, but different from those in another cluster. Clustering involves five steps: selecting the variables (dependent variable and all independent variables), selecting the clustering procedure (Ward linkage), selecting the measure of similarity or dissimilarity, deciding on the number of clusters, and validating and interpreting the cluster solution.
Agglomerative clustering, a type of hierarchical clustering, allows dividing the sample into clusters based on the principle that points within the same cluster are similar and close, while those in different clusters are different and distant. The method works by successively combining clusters, starting with individual ones and ending with a single cluster which includes all the data. Wald linkage involves combining clusters based on the probability that two clusters are merged. The Wald statistics measures the distance between two clusters according to formula (1).

Clusters are combined when the Wald statistics exceeds a threshold value, chosen empirically based on the data. Wald linkage is a robust and efficient method when it is important to preserve the relationships between clusters.
Regression Method
Since sustainability is a concern for society, and tourism has become an industry with negative effects on the environment, we assess the sustainability of tourism attractiveness factors by applying multiple regression. The model takes the form of Y = f(X1, X2, …, Xn) + ε, a relationship which is translated into equation (1).

Results and Discussions
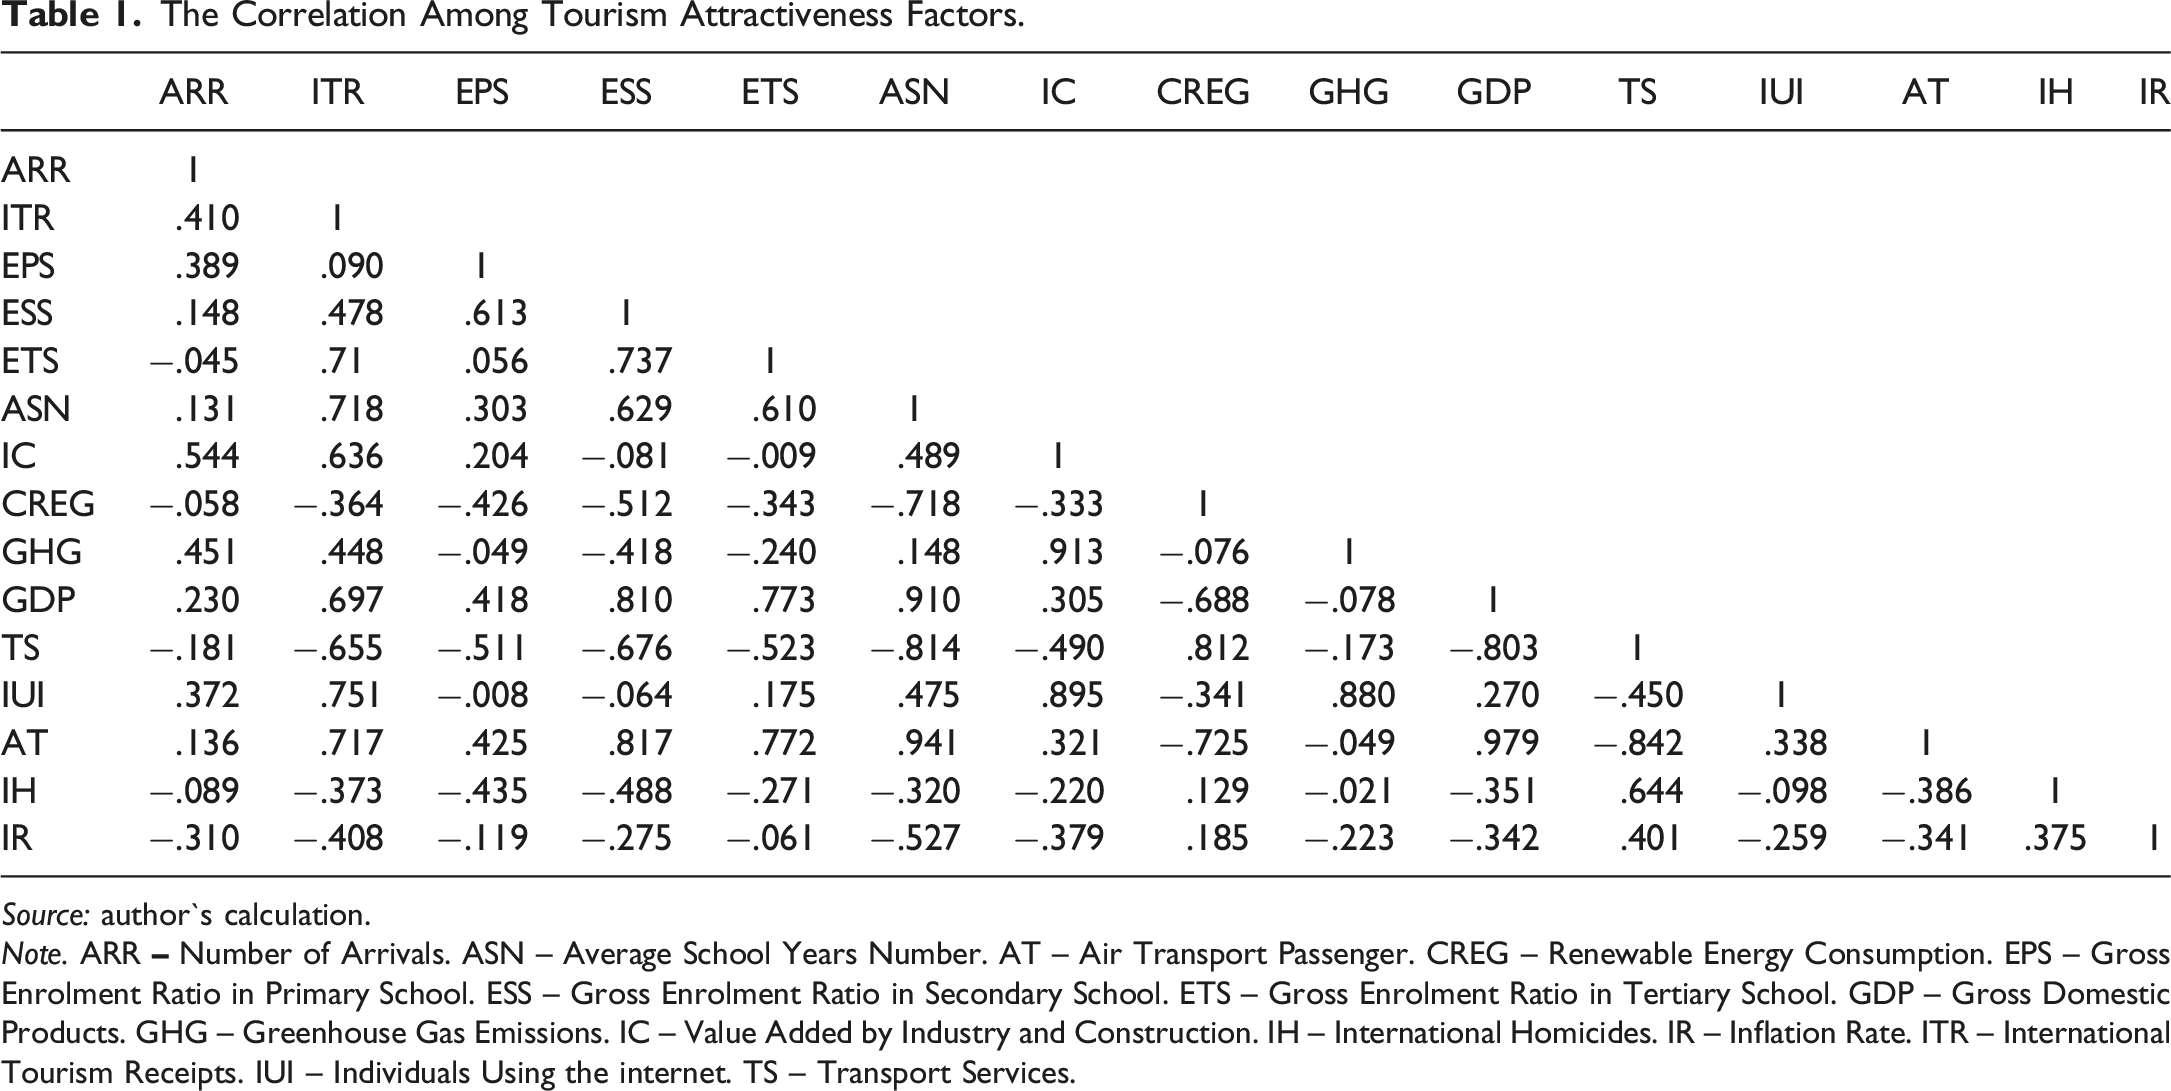
The Correlation Among Tourism Attractiveness Factors.
Source: author`s calculation.
Note. ARR
Table 1 shows that the impact of the tourism sector is ambivalent. The improvement of tourism indicators is positively correlated with primary and secondary education (EPS and ESS), years of schooling (ASN), value added by industry and construction (IC), economic growth (GDP), digitisation (IUI) and airport passenger flows (AT). Conversely, this is negatively correlated with renewable energy consumption (CREG), transport services (TS), price instability (IR) and social security (IH). The relationship between tourism indicators and residents’ higher education shows that access to higher education tends to reduce tourist flows but attracts more tourism revenue. The tourism sector proves to be unsustainable. The education sector supports economic growth and stability, expansion of AT and social security. The IC is positively correlated with the tourism sector, GDP, IUI, and AT, and negatively correlated with CREG, TS, IR and IH. CREG is sustainable, but not in the context of economic growth and at the expense of digitisation and airport passenger flows.
To find similarities based on these variables among the top ten global destinations, we applied the clustering method.
France, Spain, Italy, Germany and the UK form one cluster (C1); Mexico and Thailand form another (C2); the USA and China form another (C3); while Turkey remains separate (C4). The European countries exhibit common characteristics and relative homogeneity because of convergence policies. These destinations share similarities in terms of the IC sectors. Tourism and education are important sectors, and economic growth has occurred under less sustainable conditions. A common characteristic of destinations in C1 is their shared culture. C2 includes destinations from two continents, relatively similar in terms of economic development but with different cultures. Destinations in C3 demonstrate a greater concern for safety and price stability. The IC sector is an important factor, and AT have a higher impact compared to the ARR. In the case of Turkey, IR growth and TS play a more significant role compared to the other three clusters.
In terms of the average values of certain variables (IC, ARR, ITR, EPS, ESS and TS), the differences among clusters are significant. The segregation of destinations is primarily based on the differences in the other variables. In terms of ASN, the average values are similar for countries in the first three clusters. States in C3 exhibit the highest levels of pollution, while economic growth is more pronounced in C1. Higher passenger flows have been recorded in destinations in C3, while those in C1 are more digitised and safer. Destinations in C4 and C3 have faced higher inflationary problems compared to the other destinations.
France, USA and China attract most tourists, followed by Spain, Mexico and Italy. The number of visitors is not directly proportional to tourism revenues. The ability to generate income depends largely on other factors, such as education, safety, modernisation and the state of the economy. USA, Spain and France show high capacity to generate tourism revenues, while Thailand, Turkey and Mexico are at the opposite end. Residents’ education of has significant economic and social effects, influencing behaviours and mentalities. In Spain, the population with primary and secondary education is more numerous compared to other destinations, while the USA and countries in C1 have the largest population with tertiary education and inclination to study.
The industry and construction sector is well-developed in destinations in C1, although the differences among destinations are not significant. In Thailand, the value added by this sector is lower, but it has the highest average consumption of renewable energy, followed by China, which also has the highest level of pollution, followed by the USA and Germany. Spain and Thailand have the lowest pollution levels. The USA and C1 are destinations with high economic growth, while China has the lowest. Thailand, Mexico, Turkey and China record high average TS values, and Germany, the USA and the UK record lower values. The destinations with the best airport flows (AT) are the USA, China and the UK, while Thailand, Mexico and Italy have more modest traffic. From this perspective, it is important to consider whether the destination is also a transit point. The size of the country plays an important role as the indicator evaluates the passenger flows on domestic routes as well. In the USA and C1, digitisation is more advanced and closely related to education and economic growth. The most evident differences among destinations are observed in terms of social safety. Mexico, the USA and Thailand are the least secure destinations, while Italy and Spain are the safest. Price volatility is also a factor to consider. Turkey and Mexico face higher inflationary issues compared to the other destinations, with no significant differences among them.
C1 has the highest consistency. Cluster analysis based on all fifteen variables shows that C1 holds a weight of 50%, C2 and C3 each hold an equal weight of 20%, while C4 only holds 10%. C1 concentrates half of the educated resident population, as well as the value generated by industry and construction, transportation services, and renewable energy consumption. 30% of the internet users in the top ten destinations reside within the countries of C1. European destinations, together, have a smaller share of economic growth and airport passenger flows on a more sustainable basis compared to other destinations. Furthermore, European destinations are characterised by lower inflationary pressures and higher social safety, but they only attract 20% of the tourism revenues in all ten countries combined.
C2 and C3 concentrate 30% of the tourists visiting the top ten destinations. Inflation is higher in C2 countries, which supports the fact that they manage to attract 40% of the tourism revenues and airport passenger flows. Destinations in C2 and C3 are less secure compared to those in C1, as they account for 40% of the homicides in the top ten destinations. Only 30% of the internet users reside in C2 destinations; however, in terms of the education sector as a whole and a considerable part of the economic sector, the weight is only 10%, which represents a weak point for this cluster.
Destinations in C3 and C4 do not concentrate higher shares of 30% in terms of tourism attractiveness factors. C3 concentrates 30% of the number of visitors, residents with primary education, renewable energy consumption, emissions and homicides, which defines them as less secure destinations. On the other hand, they only account for 10% of tourism revenues, transportation services and passenger flows, with lower inflationary pressures. Turkey (C4) attracts 30% of tourism revenues and 10% of the number of tourists. Adding a relatively developed transport services sector (30%), Turkey stands out for the efficiency of its tourism sector based on a comparatively weaker educational foundation than other destinations, as well as modest renewable energy consumption and social safety.
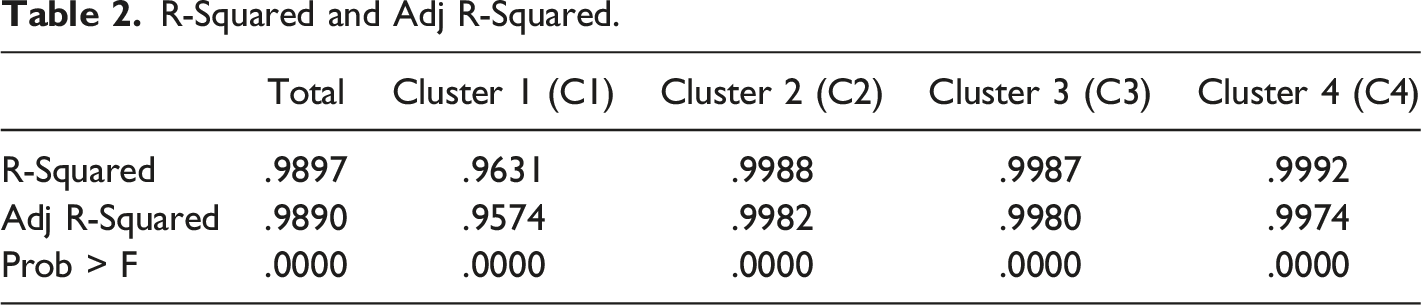
The differences in weights result from the limitations of the clustering method as it yielded four clusters with unequal numbers of members. The sustainability of tourism attractiveness factors is analysed using multiple regression, both overall and within clusters. The method highlights the effect of each tourism attraction factor on the sustainability of the top ten destinations.
R-Squared and Adj R-Squared.
The Effects of Tourism Attractiveness Factors on Sustainability.

For destinations in C1, six variables are statistically significant. Tertiary education (β = −.121), renewable energy consumption (β = −.133) and economic growth (β = −.788) reduce pollution in a sustainable manner. Primary education (β = .599), industry and construction (β = .920) and social insecurity (β = .067) contribute to pollution in an unsustainable manner. Unsustainable factors have a stronger impact compared to sustainable factors (β values are lowest). Industry and construction represent the most unsustainable sector (β = 1.182).
For destinations in C2, seven variables are statistically significant. The number of tourists (β = .088), years of schooling (β = .535), economic growth (β = .368), passenger flows (β = .027) and inflation (β = .006) contribute to pollution in an unsustainable manner, while tourism revenue (β = −.088) and renewable energy consumption (β = −.263) reduce pollution in a sustainable manner. The majority of tourism attractiveness factors are unsustainable. Economic growth has the greatest impact on pollution (β = .572), followed by the tourism sector (βARR = .246). Improvement in residents’ education (βASN = .165) and passenger flows at airports (βAT = .038) also contribute to pollution on an inflationary background (βIR = .036). In this cluster as well, the impact of sustainable factors is weaker compared to unsustainable factors (βITR = −.153, βCREG = −.300).
For destinations in C3, six variables are statistically significant. Tertiary education (β = .186), years of schooling (β = .818), industry and construction (β = .694), and transportation services (β = .118) contribute to unsustainable pollution. Economic growth (β = −.554) and renewable energy consumption (β = −.232) have a sustainable character. Industry and construction significantly contribute to pollution (β = 1.399), while the educational progress of residents tends to support unsustainable behaviours (βASN = .833 and βETS = .450). Sustainability is supported by renewable energy consumption (β = −.366) and economic growth (β = −2.632).
For destinations in C4, ten variables are statistically significant. The number of tourists (β = .306), secondary education (β = .340), tertiary education (β = .933), industry and construction (β = .568), and social insecurity (β = .233) contribute to unsustainable pollution. Primary education (β = −1.016), years of schooling (β = −1.223), economic growth (β = .399) and passenger flows (β = −.315) reduce pollution in a sustainable manner. While in C1, C2, C3 and all top ten destinations, industry and construction have the strongest unsustainable impact, in C4, tertiary education has this effect (β = .933). Industry and construction are unsustainable (β = .568) in C4 as well. The number of tourists (β = .306), social insecurity (β = .233) and secondary education (β = .340) also contribute to unsustainability. Unsustainable tourism attractiveness factors have a stronger effect compared to sustainable ones (βEPS = −1.016, βGDP = −.765, βASN = −.816 and βAT = −1.285) in this cluster.
The results allow rewriting equation (2) in forms (3)–(7).




In the absence of tourism attractiveness factors, sustainability decreases overall for destinations, except for those in C2 (β0 = 11.612) and C4 (β0 = 6.045). The number of tourists is sustainable for all destinations (βARR = −.038), except for those in C2 (βARR = .088) and C4 (βARR = .306). Tourism revenues are statistically significant in two cases: for all destinations where the effect is unsustainable (βITR = .265), and for C2 where the effect is sustainable (βITR = −.088). The improvement of residents’ education can be either sustainable or unsustainable depending on the case. Primary and secondary education are sustainable only in C1 and C4 (positive values of β). While in C1, the improvement of primary education increases pollution, in C4, the effect is the opposite. We can draw conclusions regarding the effects of secondary education only for C4, where it is not sustainable (βESS = .340). Tertiary education is unsustainable for all top ten destinations together, C3, and C2, and it is sustainable for C1. The number of years of schooling is unsustainable for all destinations, C2, and C3 (positive βASN values), and it is sustainable in C4 (βASN = −1.223). Improving the education of the resident population does not guarantee sustainable behaviour. Education opens the opportunity for increased prosperity, which also involves behaviours which are less environmentally inclined. Industry and construction contribute to pollution, while renewable energy consumption reduces emissions in all situations. Except for C2, economic growth has a positive impact on the environment. In relation to digitisation, we can draw conclusions only for the destinations where the growth in the number of internet users is sustainable. Social insecurity is an unsustainable factor of attractiveness for all destinations, inflation has the same effect in all destinations and C2, and transportation services in C3. Passenger flows contribute to increased pollution in C2 and to its reduction in C4. Therefore, tourism attractiveness factors do not have the same effects on the environment in all destinations and in each cluster separately. Industry and construction prove to be the most aggressive tourism attractiveness factor in all situations. Similar effects are observed with social insecurity, inflation and transportation services, while renewable energy consumption reduces emissions. The residents’ education in destinations with a higher degree of development tends to manifest through sustainable behaviour, and economic growth has a positive impact by supporting the renewable energy consumption. The educated population behaves differently regarding sustainability depending on the degree of development of the destination. Economic safety and stability contribute to the increased sustainability of tourist destinations.
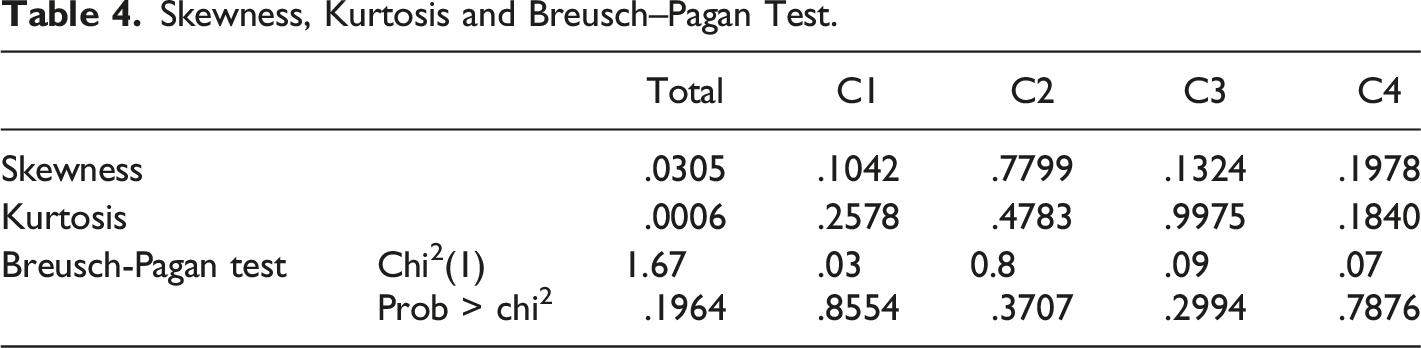
Skewness, Kurtosis and Breusch–Pagan Test.
The results do not indicate the existence of a sustainability model for the tourism attractiveness factors in the world’s most visited destinations. Sustainability largely depends on the level of development of the destination. The results show that the IC significantly affect the ecosystem. One explanation is the extensive deforestation, which is considered a high-level anthropogenic environmental problem, especially in less developed countries (Tsiantikoudis et al., 2019) and for tourism destinations. Environmental problems extend to waters, their sustainability being a big challenge (Kyriakopoulos, 2021), especially since tourism, and not only, relies on this resource. The competitiveness of a destination is increasingly dependent on digitisation, the way it is promoted through high-quality content, tourists’ perception based on information distributed online, the impact of economic growth, education and the quality of the environment maintained by the action of each individual of tourism attractiveness factor.
Adequate digital content, resulting from technological development and the increase in the IUI, is a valuable tool for the tourism sector, creating emotional added value (Štreimikienė et al., 2021). It becomes important to focus on investments in research and development with the aim of increasing competitiveness and industrial added value in a context in which education, especially tertiary education, plays a decisive role (Streimikiene & Kyriakopoulos, 2022).
The results do not indicate the existence of a sustainability model for the tourism attractiveness factors in the world’s most visited destinations. Sustainability largely depends on the level of development of the destination. The competitiveness of a destination is increasingly dependent on digitisation, the way it is promoted through high-quality content, tourists’ perception based on information distributed online, the impact of economic growth, education and the quality of the environment maintained by the action of each individual tourism attractiveness factor.
According to the results obtained, each destination must identify the effects of attractiveness factors. Through coherent and inclusive policies, a destination strengthens its sustainable character. Otherwise, there is the possibility of a setback in the tourist hierarchies with all the economic and social consequences which derive from this, especially as tourists become aware of the need for sustainability. On the other hand, there is a great risk of neglecting sustainability as long as the world’s main destinations are attractive by themselves and by the tourist offer which defines them. Main global destinations can be affected by risks stemming from crises which are usually accompanied by inflationary spikes, political instability, social instability, and which affect both the tourism sector and the sustainability. The current context is conducive to the manifestation of economic and social risks likely to trigger a vicious circle (reduction in the number of tourists, tourism revenues, passenger flows and impact on the tourism sector in general and related activities with a harmful economic impact on growth) and at the same time virtuous (reduction in economic activity has beneficial sustainable effects). Regardless of the context, a move towards sustainability appears necessary even in the world’s most visited destinations.
Conclusions
The world’s most visited destinations serve as examples for countries seeking sustainable tourism competitiveness. To highlight the sustainability of tourism attractiveness factors in these popular destinations, we applied clustering and regression methods. By analysing fifteen tourism attractiveness factors, we found that the top ten destinations can be divided into four clusters based on these factors, and their environmental effects are antagonistic, except for the industrial and construction sector, which is unsustainable. The same effect applies to social insecurity, inflation and the development of transportation services. Increasing the renewable energy consumptions ensure sustainability in all destinations and clusters, making it inherently sustainable. Economic growth, improvement of residents' education and tourism indicators (number of tourists, tourism revenue and airport passenger flows) have different impacts on the environment from one cluster to another. The sustainability of tourism attractiveness factors develops as the economy and society improve their parameters. Depending on the environment impact, tourism attractiveness factors are divided into three categories: with a sustainable effect (renewable energy consumption and digitisation), with an unsustainable effect (industry and construction, inflation, and transport services) and with an antagonistic effect (residents’ education on all its levels, economic growth and tourism indicators).
Tourism indicators do not fit into a sustainability model. In some destinations, tourism presents itself as a sustainable activity, while in others, it is seen as unsustainable. There are situations where certain aspects of tourism demonstrate a sustainable nature, while others do not. These results confirm the conclusions reached by Canale et al. (2019) and Eyuboglu and Uzar (2019) and partially those reached by D’Souza et al. (2023), Campos et al. (2022) and Destek and Aydın (2022).
The effects of education on sustainability align with the results obtained by D’Souza et al. (2023), who note that despite risks and concerns regarding the environment, consumer behaviours do not change. The results show that indeed, education does not guarantee a change in environmental behaviour, especially in less developed destinations. Education serves as a lever for material well-being, and this often involves making opportunistic decisions, leaving environmental issues to third parties at the expense of sustainability. However, education offers the hope of improving the degree of sustainability on the model of developed destinations, which confirms the results of Stein et al. (2020). The results on the effects of industry, construction, insecurity, inflation, transport, renewable energy, economic growth are in agreement with those of Khan et al. (2019), Thacker et al. (2019), Banga et al. (2022), Waheed et al. (2019), Adebayo et al. (2022), Bekun et al. (2021) or Long and Ji (2019).
Although the results are not entirely convergent, they emphasise the need to support renewable energy consumption, pay attention to certain areas to make them more sustainable, and promote appropriate measures in countries where tourism attractiveness factors are unsustainable due to state policies. Embracing progress through digitisation has proven to be not only an attractive factor but also a sustainability factor for all ten destinations.
Limitations of the study stem from the relative availability of data and certain methodological inconveniences. Extending the period analysed, as well as applying different empirical methods could influence the results. The results must be interpreted with great care and should not be generalised.
The novelty of the study lies in the group of countries analysed, the time period and the conclusions. In terms of applicability, the study contributes to the literature in the field, serves as a scientific reference, and inspires decision-makers in the tourism and related sectors. In this analysis, we highlighted the sustainable attractiveness factors and distinguished those which require support for the development of sustainable tourism. This study has implications in the scientific domain as well as in economic policy: in the short term, aiming to reduce emissions; in the medium term, aiming to stimulate tourism revenue and channel it towards sustainable economic growth; in the long term, aiming to develop a sustainable industry, appropriate infrastructure, facilitate access to quality services, including in the context of digitisation, based on access to education, increased safety and improved quality of life, so that tourist destinations can maintain their attractiveness under sustainable conditions.
Footnotes
Declaration of Conflicting Interests
The author(s) declared no potential conflicts of interest with respect to the research, authorship, and/or publication of this article.
Funding
The author(s) received no financial support for the research, authorship, and/or publication of this article.
