
Abstract
Ecosystem service valuation (ESV) can inform land-use change policy and adaptation responses to climate change in Pacific Small Island Developing States. Despite Small Island Developing States communities relying acutely and directly on ecosystem service (ES) flows, methodologies must contend with limited valuation data and challenges. We undertake ESV to generate coefficients we then apply to mapped habitat extents for Vanuatu. We find the contribution of ESs to the people of Vanuatu is considerable and significantly larger than its gross domestic product. Therefore, policies that support ecologically sustainable exploitation of ESs are paramount in promoting community well-being. We also identify and discuss context-specific methodological challenges, which, if not addressed, risk distorting valuations, supporting perverse policy responses, and eroding confidence in ESV. We make recommendations to address the challenges of accounting for ecosystem condition, data gaps, and consideration of customary benefits, provide context to the interpretation of our results, and suggest where further research can ameliorate risks.
Keywords
Environmental economics has built robust methods and a strong case for the economic valuation of the contributions of nature to human well-being (Boyd & Banzhaf, 2007; Braat & de Groot, 2012; Costanza et al., 2017).This has been conceptualized through ecosystem service (ES) classification, originally developed by the Millennium Ecosystem Assessment (MEA; 2005) and further developed by de Groot et al. (2012) and the Common International Classification for Ecosystem Services (Haines-Young & Potschin-Young, 2018). From the original MEA conceptualization, ESs are classified into three broad categories: (a) provisioning—biological products used by humans obtained directly from ecosystems (b) regulating—benefits obtained through natural regulation of ecosystem processes and (c) cultural—the nonmaterial benefits people receive from ecosystems. The importance of ecosystems to human welfare has numerous dimensions (ecological, sociocultural, and economic); however, expressing value in monetary terms has proved useful in helping to consistently frame trade-offs between options that have to address multiple assessment criteria (Costanza et al., 2017; Díaz et al., 2018; Georgiou et al., 1997). Within this context, ecosystem service valuation (ESV) has three broad purposes (Laurans et al., 2013): to be (a) informative, such as raising awareness of the value of biodiversity (Costanza et al., 1997, 2017; Kumar, 2010) and providing data for ecosystem accounting for integration into green gross domestic product (GDP; Andrade & Garcia, 2015; Secretariat of the Convention on Biological Diversity, 2010) and for full-cost corporate accounting (Epstein et al., 2011; Natural Capital Coalition, 2016); (b) technical, such as setting compensation rates for loss of environmental amenity (Aultman et al., 1993); and (c) decisive, such as informing policy making in land use using benefit-cost analysis (Barbier, 2012; Gashaw et al., 2018; Sinner et al., 2016; Sumarga & Hein, 2016). Unlike normal market goods, most ESs do not lend themselves to “spatial arbitrage” to take advantage of higher willingness to pay elsewhere (the exception to this rule is carbon sequestration services, which provide benefits at a global scale as a public good or a private good if traded as a permit; Boyd & Banzhaf, 2007, p. 622; UN Statistical Division, 2018); therefore, many ESV applications involve integrating a spatial element, enabling analysts to estimate the ES benefits for a spatially defined unit.
Spatial aspects of ESV are codified in the UN Statistical Commission’s System of Environmental Economic Accounting-Experimental Ecosystem Accounting (SEEA-EEA; UN Statistical Division, 2018). SEEA-EEA integrates environmental assessment with the human economy through the quantification of ecosystem assets and measurement of the flows of ESs into and out of human society. SEEA-EEA takes a landscape view—assessing ecosystem assets in terms of type, extent, condition, and the services they provide. The links between ecosystem flows and society are assessed in terms of both ES benefits and the impacts of human activities on ecosystems that can influence their future capacity to continue to deliver benefit flows (externalities; Hein et al., 2006). Ecosystem assets generate a specific, quantifiable combination, or “basket,” of potential environmental material and nonmaterial flows (Obst et al., 2016, p. 12), analogous to (but not completely overlapping with) the MEA/Common International Classification for Ecosystem Services conception of ES. SEEA-EEA incorporates spatial units that are both natural/unmodified and influenced by human activity (e.g., urban areas, subsistence gardens, and tree plantations).
SEEA-EEA is designed to be compatible with the UN system of national accounts, which, among other measures, standardizes estimations of national GDP. SEEA-EEA resolves to deploy only exchange values for ESs—the price at which an ES is, or would be, exchanged if a market for the same, or similar, service existed. It therefore determines the contribution of ecosystem assets by the product of its quantity of service provided and derived exchange value, or price. Importantly, this excludes valuations that estimate a consumer surplus—the difference between what someone would be willing to pay and its price in a market. Because most ES, particularly regulating and cultural services, are nonexcludable and thus “free” at the point of use (they are public goods, or common pool resources), people can enjoy an increase in welfare without any notional exchange. The ESV literature, more broadly, incorporates both exchange- and surplus value--based approaches, from the full gamut of economic valuation methods, including those reliant on respondent stated preferences in hypothetical scenarios. The inclusion of the broader set of ESVs allows valuations of spatial units to be greater than GDP and SEEA-EEA-based ecosystem accounting.
To date, with some exceptions (Chen & Zhang, 2000; Costanza et al., 1997; de Groot et al., 2012; Deloitte Access Economics, 2017; Kubiszewski et al., 2017; Sannigrahi et al., 2018), most ESV focusses on marginal changes in the value of a narrow suite of ES flows, commonly from a single, locally important habitat (Baskara et al., 2017; Matthew et al., 2018; Pascal et al., 2016). In application, these values are typically used in social benefit cost analysis of specific proposals (Georgiou et al., 1997; van der Ploeg & de Groot, 2010). However, from a policy maker’s or program funder’s perspective, what is often required is an ESV of aggregated flows from a particular habitat, or an estimate of the value of all ESs within a particular biophysically or politically defined landscape, known as total ecosystem service value (TESV; Gashaw et al., 2018; Mackey, Ware, Nalau, et al., 2017; Tolessa et al., 2018).
The context of this article is one such study, undertaken for the Republic of Vanuatu and one of its islands, Tanna, to reveal the TESV of its habitats (Buckwell et al., 2019a; Mackey, Ware, Nalau, et al., 2017). The study formed part of the Pacific Ecosystem-based Adaptation to Climate Change Project—a program that advocates for ecosystem-based adaptation to be integrated into national adaptation and planning processes (Secretariat of the Pacific Regional Environment Programme, 2018). TESV is applicable to a range of scenarios, including (a) assessing trends in the value of ESs over time as a result of external factors, such as climate change (Buckwell et al., 2019b); (b) assessing the cost-effectiveness of ecosystem-based climate change adaptation options (Buckwell et al., 2018); (c) assessing benefit trade-offs involved in macro land-use trends (Gashaw et al., 2018; Troy & Wilson, 2006); (d) determining appropriate price envelopes for payments for ecosystem service (PES) schemes (Bishop & Hill, 2014); and (e) identifying community dependencies and vulnerabilities to economic and social change, especially where reliance on ESs for immediate provisioning needs, such as food and materials, is direct, immediate, and significant (Buckwell et al., 2018; Mackey, Ware, Buckwell, et al., 2017). Isolated from global trade flows, rural communities in Vanuatu, outside the major centers, are dynamic and complex socioecological systems, where market-based exchange is limited, and well-being and natural resource management are arbitrated through customary institutions and relations.
Estimating TESV requires making judgments as to what constitutes intermediate ESs and final ESs—those that are directly “enjoyed, consumed, or used to yield human well-being” (Boyd & Banzhaf, 2007, p. 619). If both intermediate and final ES values are totalized, contributions are double counted. For example, pollination services are intermediate inputs into the final food production value provided by agriculture, forests, and plantations. Therefore, the value of pollination services is embedded in the provisioning ES value for food. Ecosystem accounting reconciles inputs and outputs so that the value of final services is the sum of value--added through intermediate components. However, as we also included ESVs that estimate a consumer surplus, accounting principles cannot be adhered to. In general, regulating ESs are intermediate services to final benefits enjoyed locally and therefore not totalled in a TESV (though nevertheless present useful information for decision-making). The exceptions to this are (a) air quality regulation (an ends in itself); (b) climate regulation, which, although provides a measure of an intermediate service (a stable climate) that contributes to local food production, for example, also provides a final service to global society as a public good or a private good if emissions reductions are converted into a carbon permit; and (c) the moderation of disturbance functions of coral reefs and mangroves, providing coastal protection.
Undertaking primary ESV research is cost prohibitive to many nongovernmental organizations and Pacific Small Island Developing States (SIDS). Accordingly, these communities have been subject of few studies, despite the apparent importance of ESs. Therefore, practitioners are resigned to draw on secondary, often methodologically heterogeneous data, or accept gaps, risking misleading valuation that may provide misguided support for perverse policy responses and may erode confidence in ESV. Furthermore, as development funding is often determined on the basis of GDP per capita, the missing contribution of ESs to welfare via the “nonobserved economy,” which may considerably outweigh the conventional measures of well-being (Organisation for Economic Co-operation and Development, 2002; van Heemst, 1984), may misguide contributions toward rural communities at the expense of the urban poor, for example.Consequently, to provide more representative or meaningful measures of economic and environmental disadvantage, there is a pressing need to obtain and improve broad-spectrum TESV.
The purpose of our study is to report on our findings from two economic valuation case studies (Vanuatu and Tanna), which use prior-generated spatial and land cover data (see Supplementary Information) and economic valuation to produce landscape-level valuations of ESs. While providing useful data in and of themselves, these case studies also provided insights into data sensitivities and methodological challenges, and we discuss how these can be mitigated, accounted for, or acknowledged in the presentation of such findings to policy-- and decision makers. The next section describes our case study locations in some detail so as to properly inform our subsequent discussion. This is followed by a description of our ESV method (the original mapping component is contained in Supplementary Information). Then, the Results section reports the results for our case study sites, and the Discussion section examines sensitivities and challenges. A final section concludes our discussion.
Case Study Context
The Republic of Vanuatu is an island nation in the southwestern Pacific Ocean. It has a land area of 1.22 million hectares (see Figure 1). Many of the islands are steep, with fertile, but unstable, soils of volcanic origin with little permanent freshwater. Shorelines are mostly rocky, with some fringing coral reefs. Vanuatu’s population is estimated to be 272,459, with an annual growth rate of around 2.3% (double the global mean) and a relatively young median age of 20 years (UN Department of Economic and Social Affairs/Population Division, 2017; Vanuatu National Statistics Office, 2016). In terms of GDP per capita, Vanuatu is seemingly poor, ranked 126th from 192 listed countries by the UN (UN Statistics Division, 2017). Vanuatu has a history of European colonial interference, dating back to the 1880s one that has included transport of indentured labor to Australia (Hunt, 2007), a base for war operations, and the imposition of tax haven status in service of colonial currency manipulation interests (Rawlings, 2019), all of which have had an enduring legacy on the country’s political institutions, religious life, society, and economy. Historic colonial and contemporary development of export-based agricultural industries, such as beef, copra, and sandalwood, has also disrupted subsistence livelihoods. Vanuatu regained its independence from France and the United Kingdom in 1980.
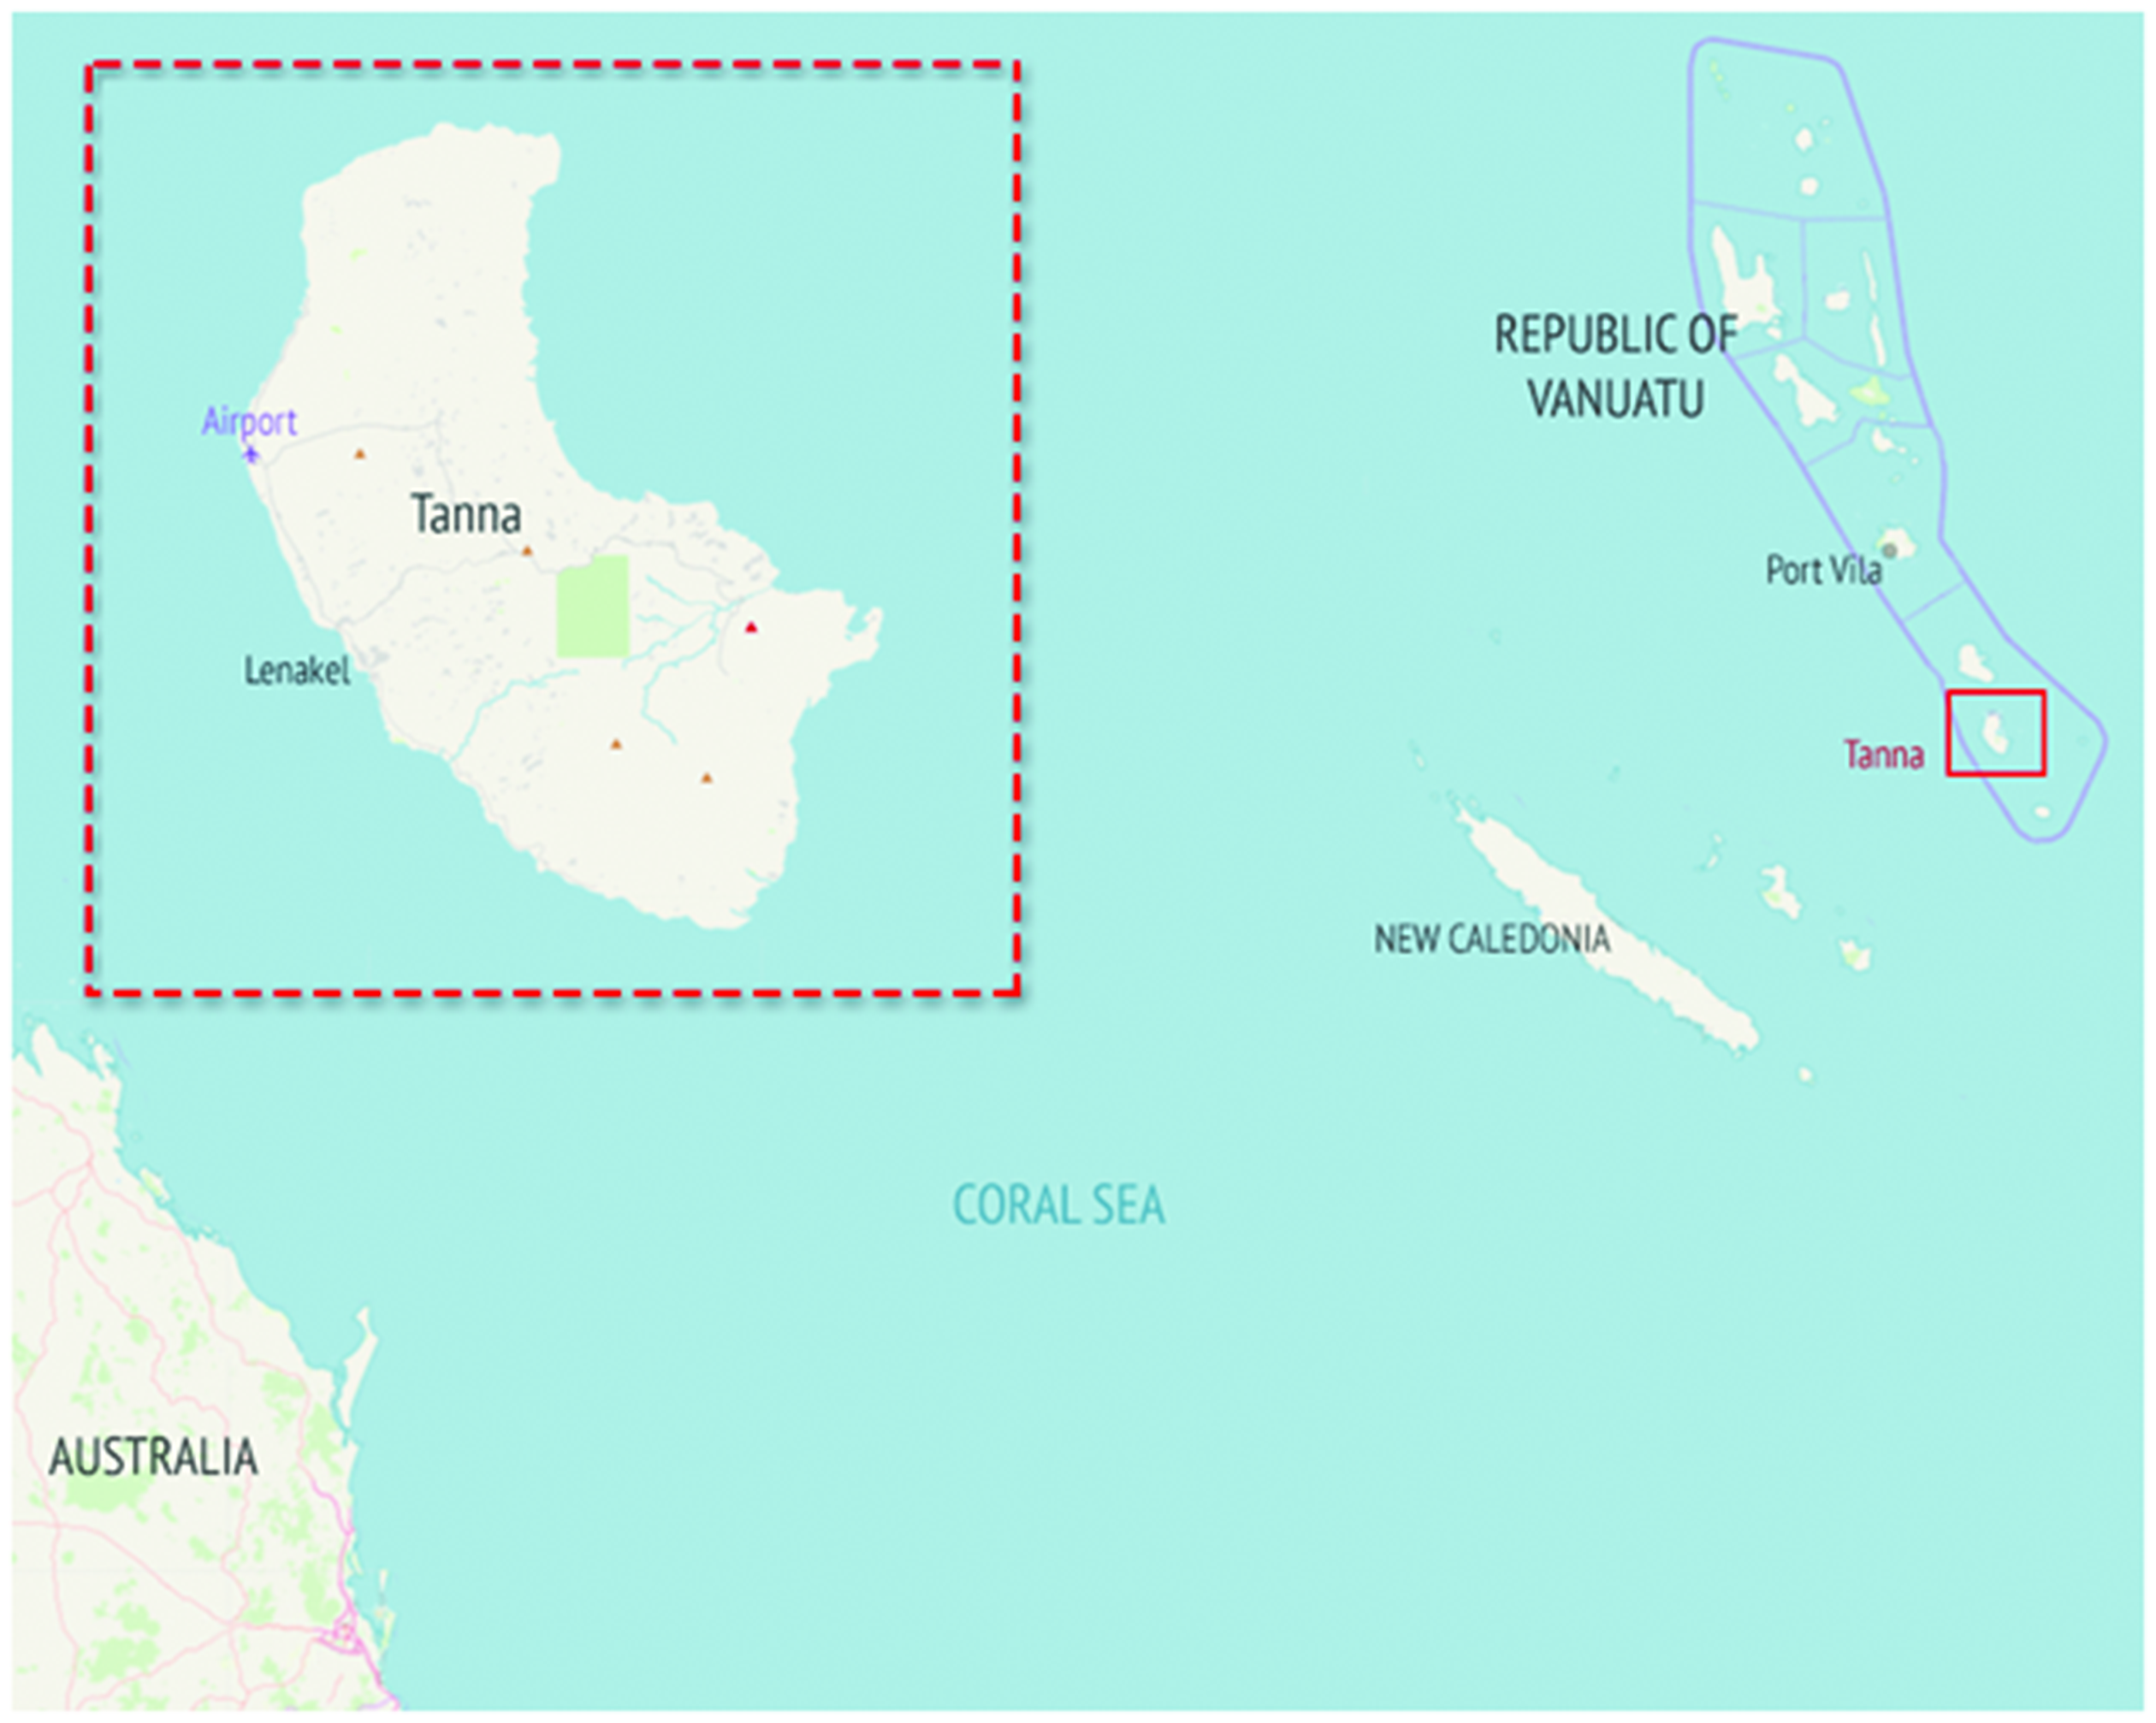
Location of Tanna and the Republic of Vanuatu.
Broader economic opportunities and employment specialization outside the main centers (Port Vila and Luganville) are limited. The majority of the population engages in small-scale traditional (and generally subsistence) farming and coastal fishing. Approximately 75% of the population live in rural areas, and more than 98% of households nationwide undertake some form of food production (Vanuatu National Statistics Office, 2009). Rural farming systems typically comprise three components: (a) shifting cultivation, (b) perennial plantation, and (c) an arboricultural system (Blanco et al., 2013; Clarke & Thaman, 1993; Thaman et al., 1993). The shifting cultivation component, which most closely relates to traditional subsistence agriculture, is a rotational system of slash and burn of secondary forest to grow root vegetables and, after depletion of the soil’s fertility, a fallow period of forest regrowth (Mackey, Ware, Nalau, et al., 2017). Perennial cultivation constitutes the main source of any cash income, mostly grazing cattle in among coconut plantation, growing coffee and cacao, and harvesting sandalwood (Lamanda et al., 2006). Last, large trees, such as breadfruit, nuts, and fig, are often kept standing among the garden plots for their productive and cultural value. This interdependent, cyclical relationship between rotational subsistence agriculture, perennial planting, secondary forest regrowth, and use of forest products is part of an intricate and complex pattern of land use that supports community well-being throughout much of rural Vanuatu.
Tanna is in the southern Vanuatu province of Tafea. It covers 58,793 ha and has a recorded population of 32,280 (Vanuatu National Statistics Office, 2016). Many of the tribes on the island live in traditional housing in village-based systems. Tanna is a stronghold of Kastom 1 —a place where people still know traditional songs, can trace their lineage, and participate in rituals, community decision-making processes and ceremonies (Lindstrom, 2011). However, common to many Pacific islands, customary practices are eroding under the influence of “Western” economic systems and philosophical traditions 2 (Brosi et al., 2007; Nalau et al., 2018). Currently, virtually all of the population of Tanna depend on a combination of traditional farming, fishing, and wild food and nonfood harvesting (for housing and ceremonial dress) for their livelihoods (Vanuatu National Statistics Office, 2016).
Vanuatu, typical of Pacific SIDS, have economic development pathways, in part due to being isolated from global trade flows and variable levels of poverty linked to increasing environmental and resource pressures, climate change (Klöck & Nunn, 2019), and a shift toward urban living, based on cash incomes, and away from Kastom land, which limits capacity for food production (Carter et al., 2007; Fafchamps, 2003). However, the rural Ni-Vanuatu have remained relatively shielded from destitution, hunger, and food insecurity due to continuation of widespread subsistence farming and fishing and their legally recognized control of Kastom lands, prohibiting involuntary alienation (Asian Development Bank, 2003; Farran & Corrin, 2017; Gerbeaux et al., 2007). Resource-based conflict exists but arise more from competing uses of ecosystem assets and supply of different, or competing, ES rather than from control of the ecosystem per se. Tribal boundaries are defined but can be contested and are porous to incursion and manipulation by extractive industries as regulation of uses is poor. Communities across the archipelago face pressure from local and global ecological, geological, and socioeconomic factors, including climate change, which has the potential to increase the incidence of destructive weather and alter local climates and optimal traditional crop-growing envelopes (Roy & Connell, 1991); population growth; land-use change away from traditional, subsistence gardens, which puts pressure on forests and fringing reefs (Siméoni & Lebot, 2012); and falling yields from gardens, driving demand for cash incomes to purchase alternative imported commodities, such as rice and canned meat (Fleming, 2007; Pachauri et al., 2014; Mackey, Ware, Nalau, et al., 2017; Siméoni & Lebot, 2012). The combination of these risks commonly place Vanuatu at the top of World Risk Reports (United Nations University, 2019). At the same time, there is potential for rapid cultural and socioeconomic dislocation, as communities transforms from village-based agrarian subsistence to an economy based on exchange and specialization (Boydell & Holzknecht, 2003; World Travel & Tourism Council, 2017). Vanuatu’s National Sustainable Development Plan (Republic of Vanuatu, 2016) seeks to address these risks to well-being and to harness the country’s natural resources, in service of homegrown food and national development but also in the conservation of the range of ES. 3
Valuation Methodology
We determine the TESV provided by key habitats of the Republic of Vanuatu and Tanna. Our method is based on a spatial component, to determine habitat type and extent, and an economic valuation component, to determine the value of ESs. The spatial component, which identifies and classifies ecosystem types, is in Mackey, Ware, Nalau, et al. (2017) and summarized in Supplementary Information, Table S1. For the economic component, we determined ES coefficients for per hectare per year contributions to well-being and calculated the TESV by calculating the product of the two. We employed two valuation methods, namely, benefit transfer (Richardson et al., 2015) and the residual method (Young, 2010). Benefit transfer estimates the economic value of ESs at a target site by employing data from an existing study (or studies) conducted at an alternative source site or sites. Undertaking benefit transfer typically involves searching the published literature to identify existing studies in relevant contexts of socioeconomic and biophysical characteristics to the target site, in terms of the population density, property rights regimes, and ecosystem exploitation patterns (Cordes, 2017; Georgiou et al., 1997). Although benefit transfer has been referred to as a “second-best strategy” (Troy & Wilson, 2006, p. 436), in the absence of alternative primary data, it is nonetheless widely, but not uncritically, accepted as providing reasonable ESV estimates (Johnston & Rosenberger, 2010). We also used the residual method, which quantifies the value attributable to nonpriced inputs to agricultural production (Young, 2010). For example, plantation cropping demands a combination of human and natural inputs to provide the final ES (food). Human inputs (labor, fuel) generally have clear exchange values already priced into the cost of production. The residual method subtracts the costs of human inputs from the gross revenue obtained from agricultural production and then assigns the resulting margin as the return attributable to relevant nonmarket, unpriced inputs, such as ESs.
Our strategy for determining ES coefficients is in line with the following hierarchy (see also Table 1 and Figure 2):
Treatments to Determine Ecosystem Service Coefficients.
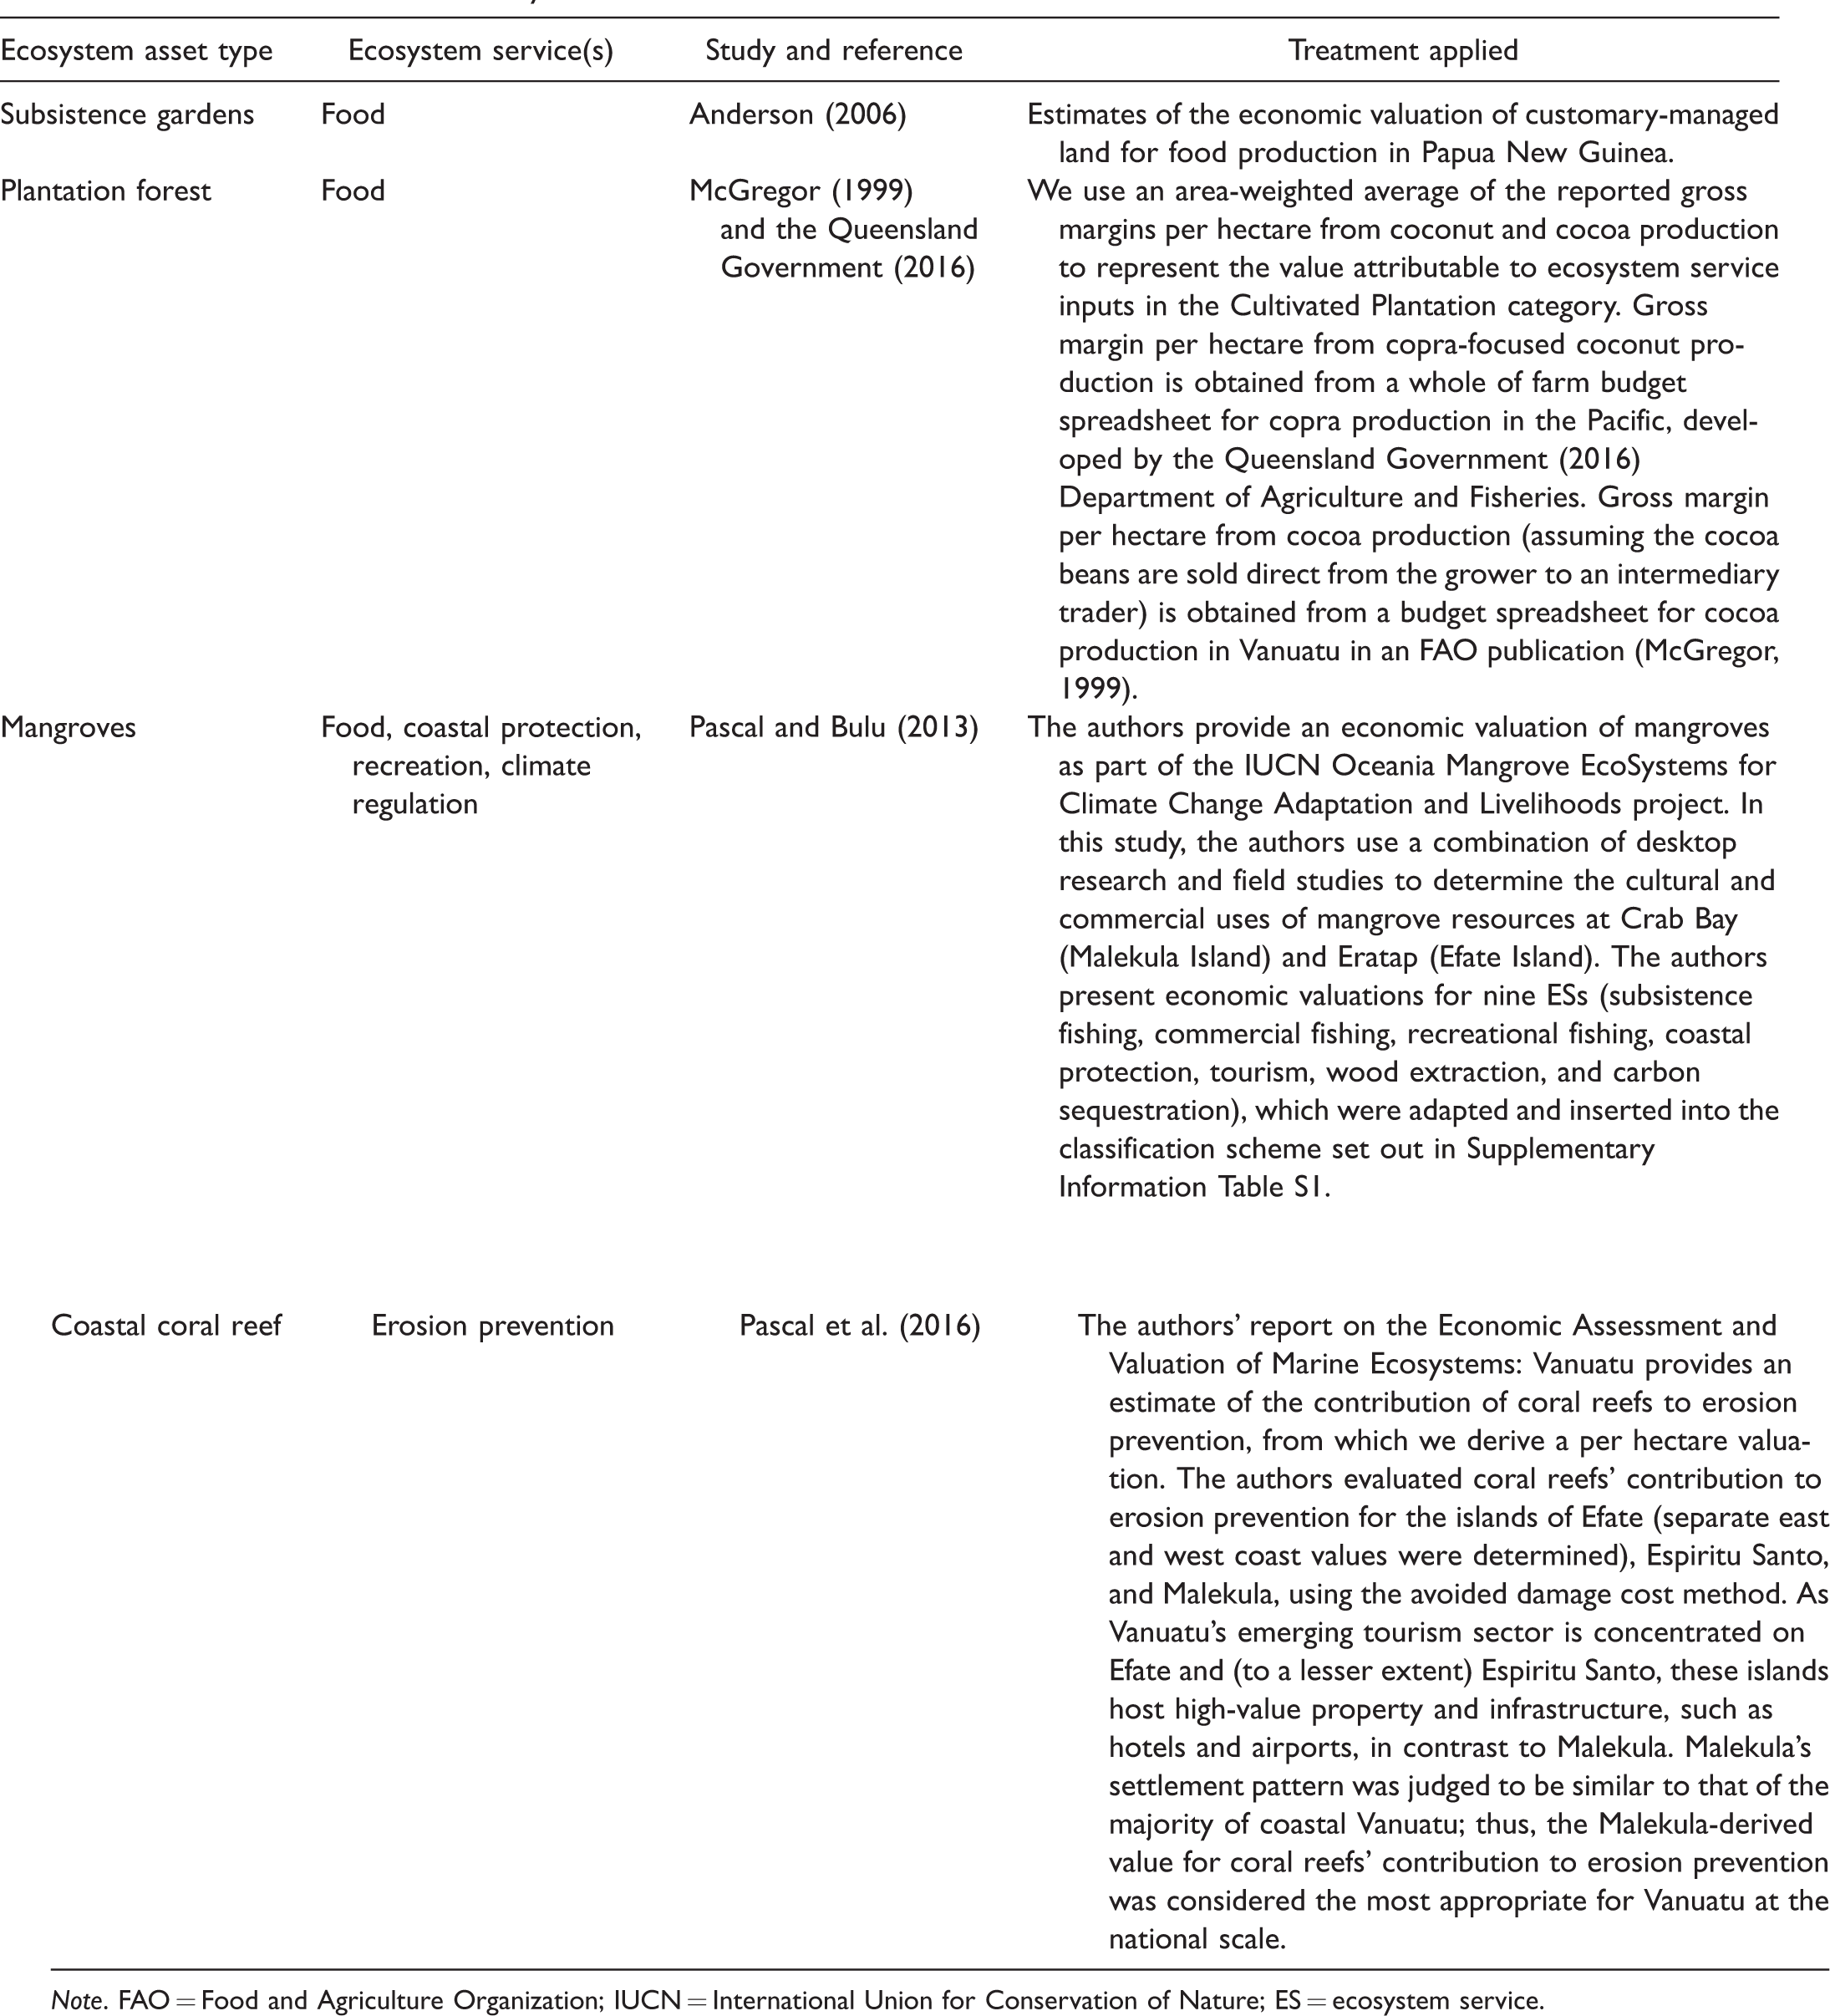
Note. FAO = Food and Agriculture Organization; IUCN = International Union for Conservation of Nature; ES = ecosystem service.
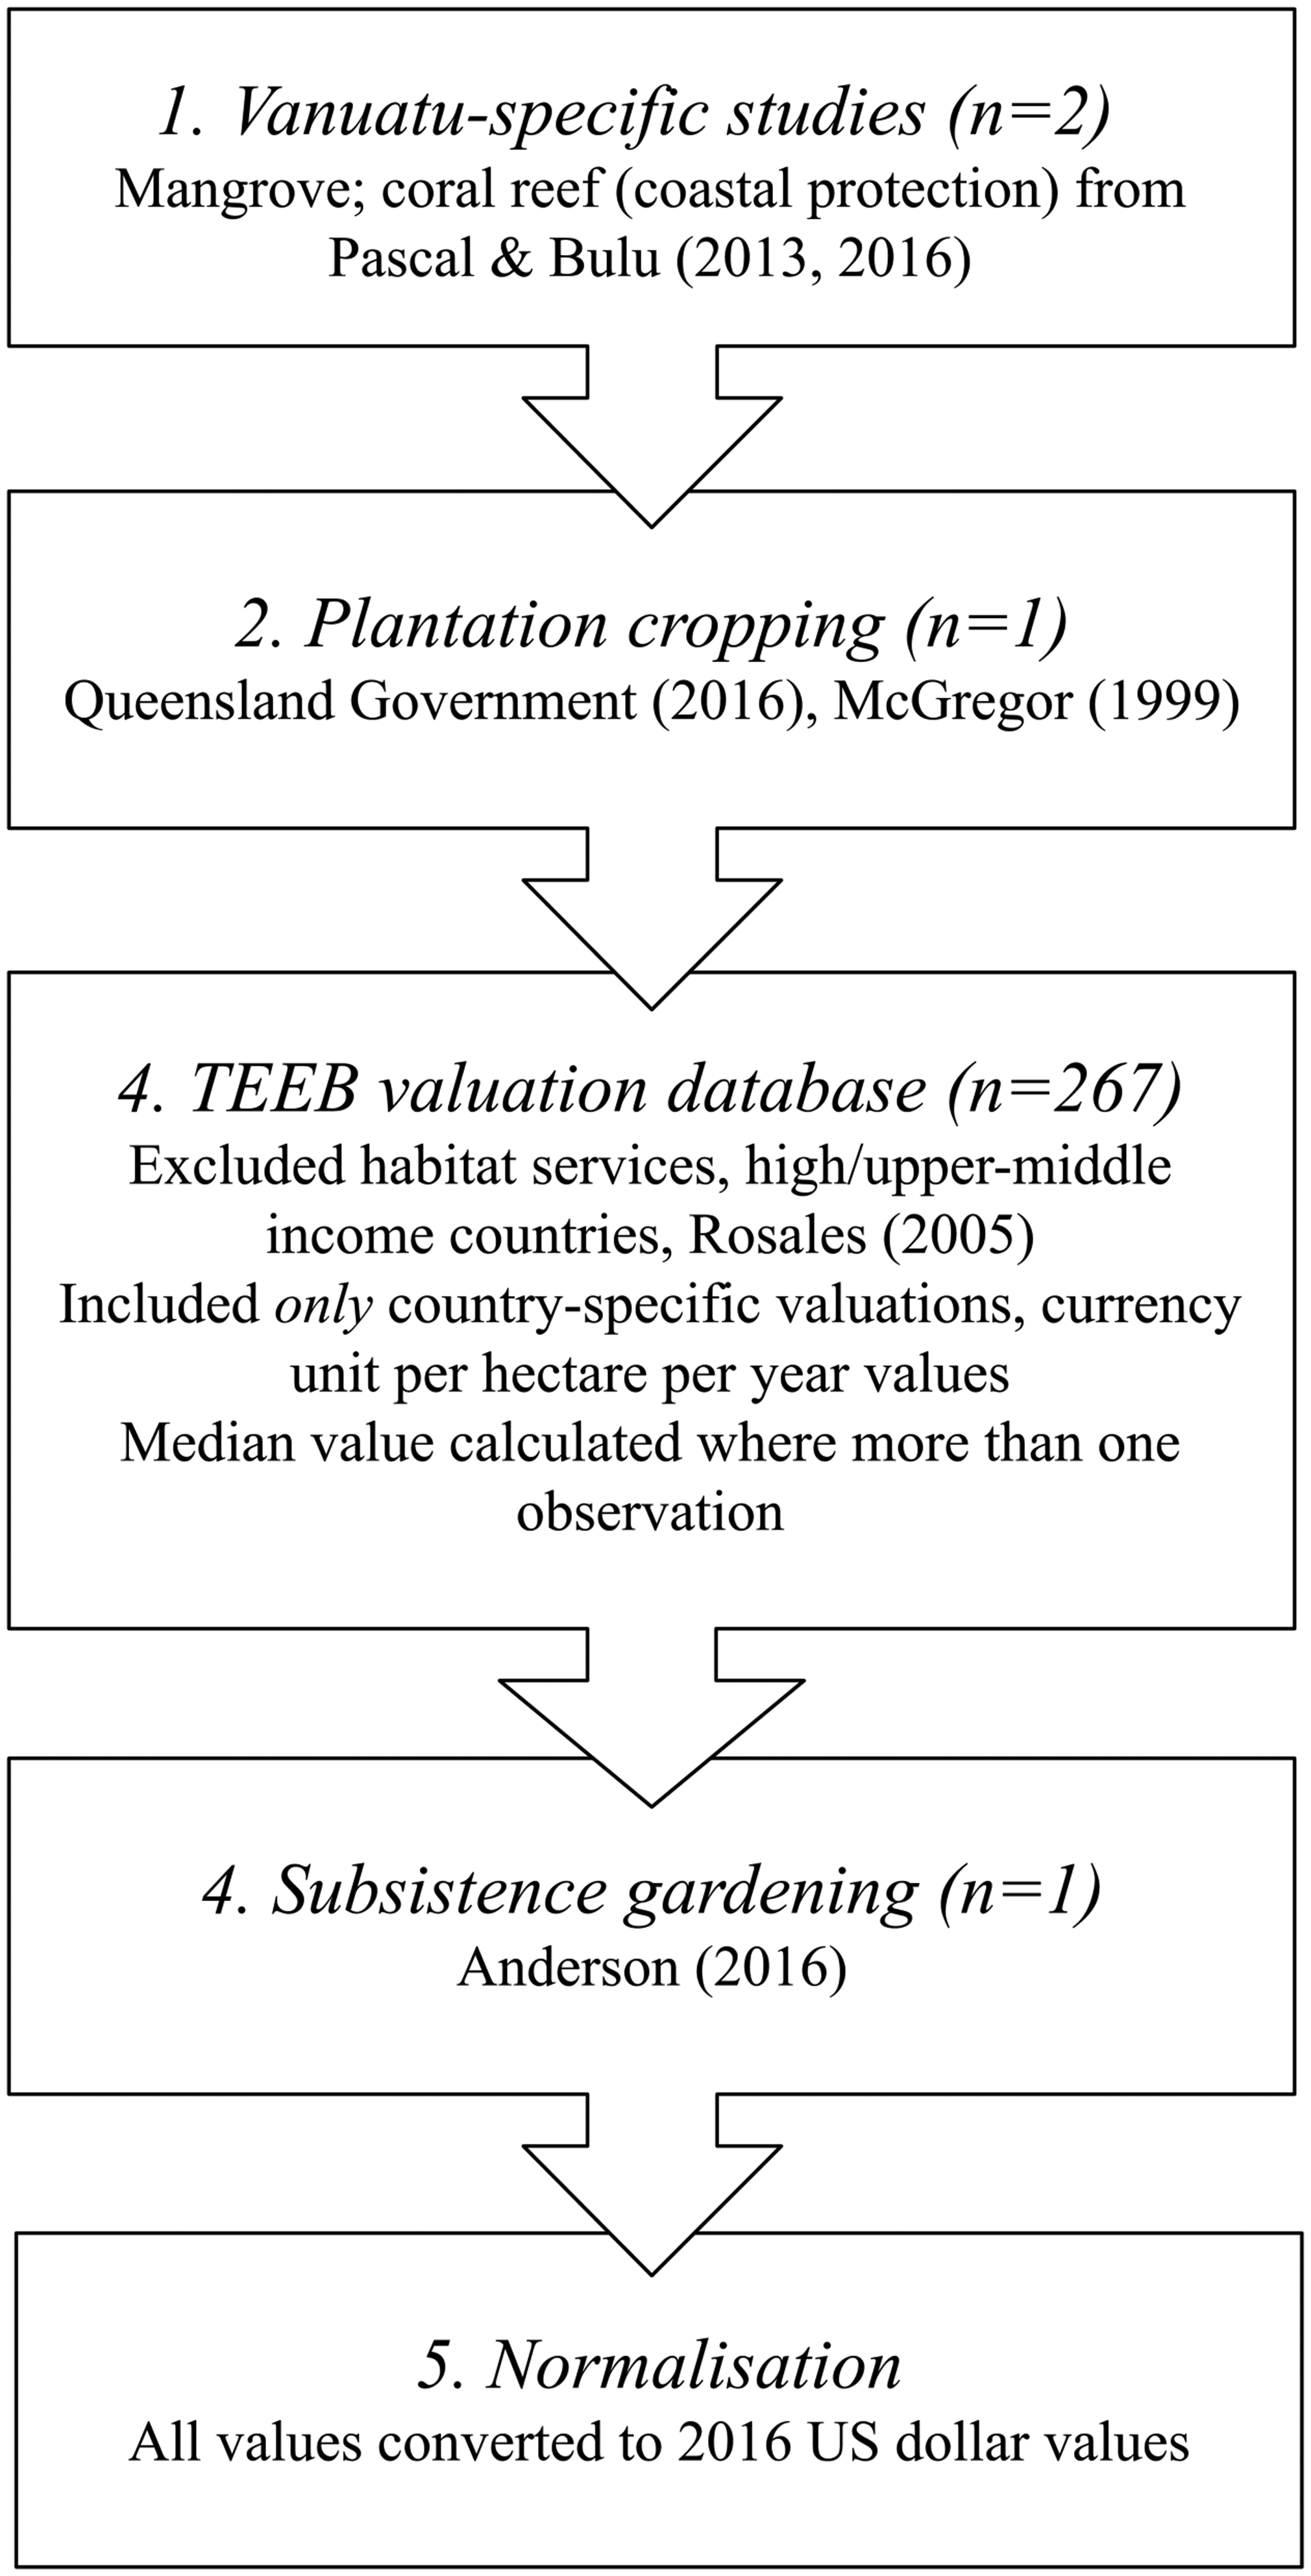
Summary of Our Valuation Method.
We undertook a literature search for Vanuatu-specific ESV studies (n = 2) to apply in the first instance. Studies identified were Pascal and Bulu’s (2013) economic valuation of mangroves and Pascal et al.’s (2016) estimate of the economic contribution of coral reefs to coastal protection.
For plantation cropping, we used the residual method for determining an ESV based on data from the Queensland Government (2016) Department of Agriculture and Fisheries and the Food and Agriculture Organization (McGregor, 1999).
To obtain the majority of our ES coefficients, we queried the database constructed by van der Ploeg and coworkers (van der Ploeg & de Groot, 2010; van der Ploeg et al., 2010). In this work, the authors collated and assessed 1,310 studies for The Economics of Ecosystems and Biodiversity (TEEB) study (TEEB, 2010). This database provides monetary values for 12 “biomes” (that contain 38 more granular categories of “ecosystems”), which we aligned with the ecosystem types from Mackey et al. (2017; Table S1 in Supplementary Materials). The database includes 29 categories of “ecosystem services,” further granulized into 78 “subservices,” which we rationalized into 22 ESs across provisioning, regulating, and cultural categories. To ensure the most appropriate studies were used for benefit transfer, we filtered the TEEB database as follows (also summarized in Figure 2): a. excluded values for “Total Economic Value” (TEV; i.e., already aggregated ES values); b. excluded “Habitat Services” to avoid double counting of final ES value (Boyd & Banzhaf, 2007); c. excluded “High Income” and “Upper Middle Income” countries from “Country Income Group,” on the basis that the primary benefits derived from ESs in these countries bear little resemblance to the primary benefits derived from the same ES flows in developing nations, such as Vanuatu; d. excluded the more generalized criterion of “World” from the column “Country” to exclude valuations being inflated by developed world values (a single continent-wide value in the “Country” column, for “Africa,” was included in our study); e. included only studies that were valued on a currency unit, per hectare, per year basis; and f. excluded valuations considered highly specific to the context of the source site, or inappropriate for the Vanuatu context (n = 1), 4 where the filters returned more than one ES value for an ecosystem type, we determined the median, mean, maximum, and minimum values.
Neither the Vanuatu-specific literature nor the TEEB database contained a valuation for subsistence gardens. Therefore, to obtain this value, we used Anderson’s (2006) estimates of the value of customary-managed land for subsistence food production in Papua New Guinea (culturally also Melanesian). This study estimates a maximum and minimum value, from which we determined a median and mean. 5
Thaman, Elevitch & Kennedy (2006) describe describe the likely and growing contribution of urban agriculture to food security in Pacific SIDS and to urbanizing Ni-Vanuatu (temporary or permanent).Although we could map the extent of urban areas (see the Supplementary Information), and to do so is consistent with the SEEA-EEA framework, we could not ascertain any ESV from the literature. 6
A range of treatments were required to standardize valuations from the aforementioned Items 1 to 4. These are summarized in Table 1. Finally, we transformed all ES coefficients into U.S. dollar values and further adjusted them using the U.S. dollar deflator as appropriate (World Bank, 2018a). The final output was a directly comparable 2016 U.S. dollar per hectare per year value for each ecosystem type.
Results
To derive our final TESV results, we use the product of our 2016 U.S. dollar per hectare per year ES coefficients from Table 2 for each of the nine ecosystem types for Vanuatu and the ecosystem extents generated by Mackey et al. (2017; see Supplementary Information, Table S1). This output is the median total final ES value per year for Vanuatu and Tanna and is detailed in Tables 3 and 4. Using the median values for our ES coefficients safeguarded against the value being unduly influenced by outlier ES values.
Ecosystem Service Value Coefficient and Median Calculated Ecosystem Service Value for Ecosystem Types for Vanuatu (2016US$ha–1 yr–1).
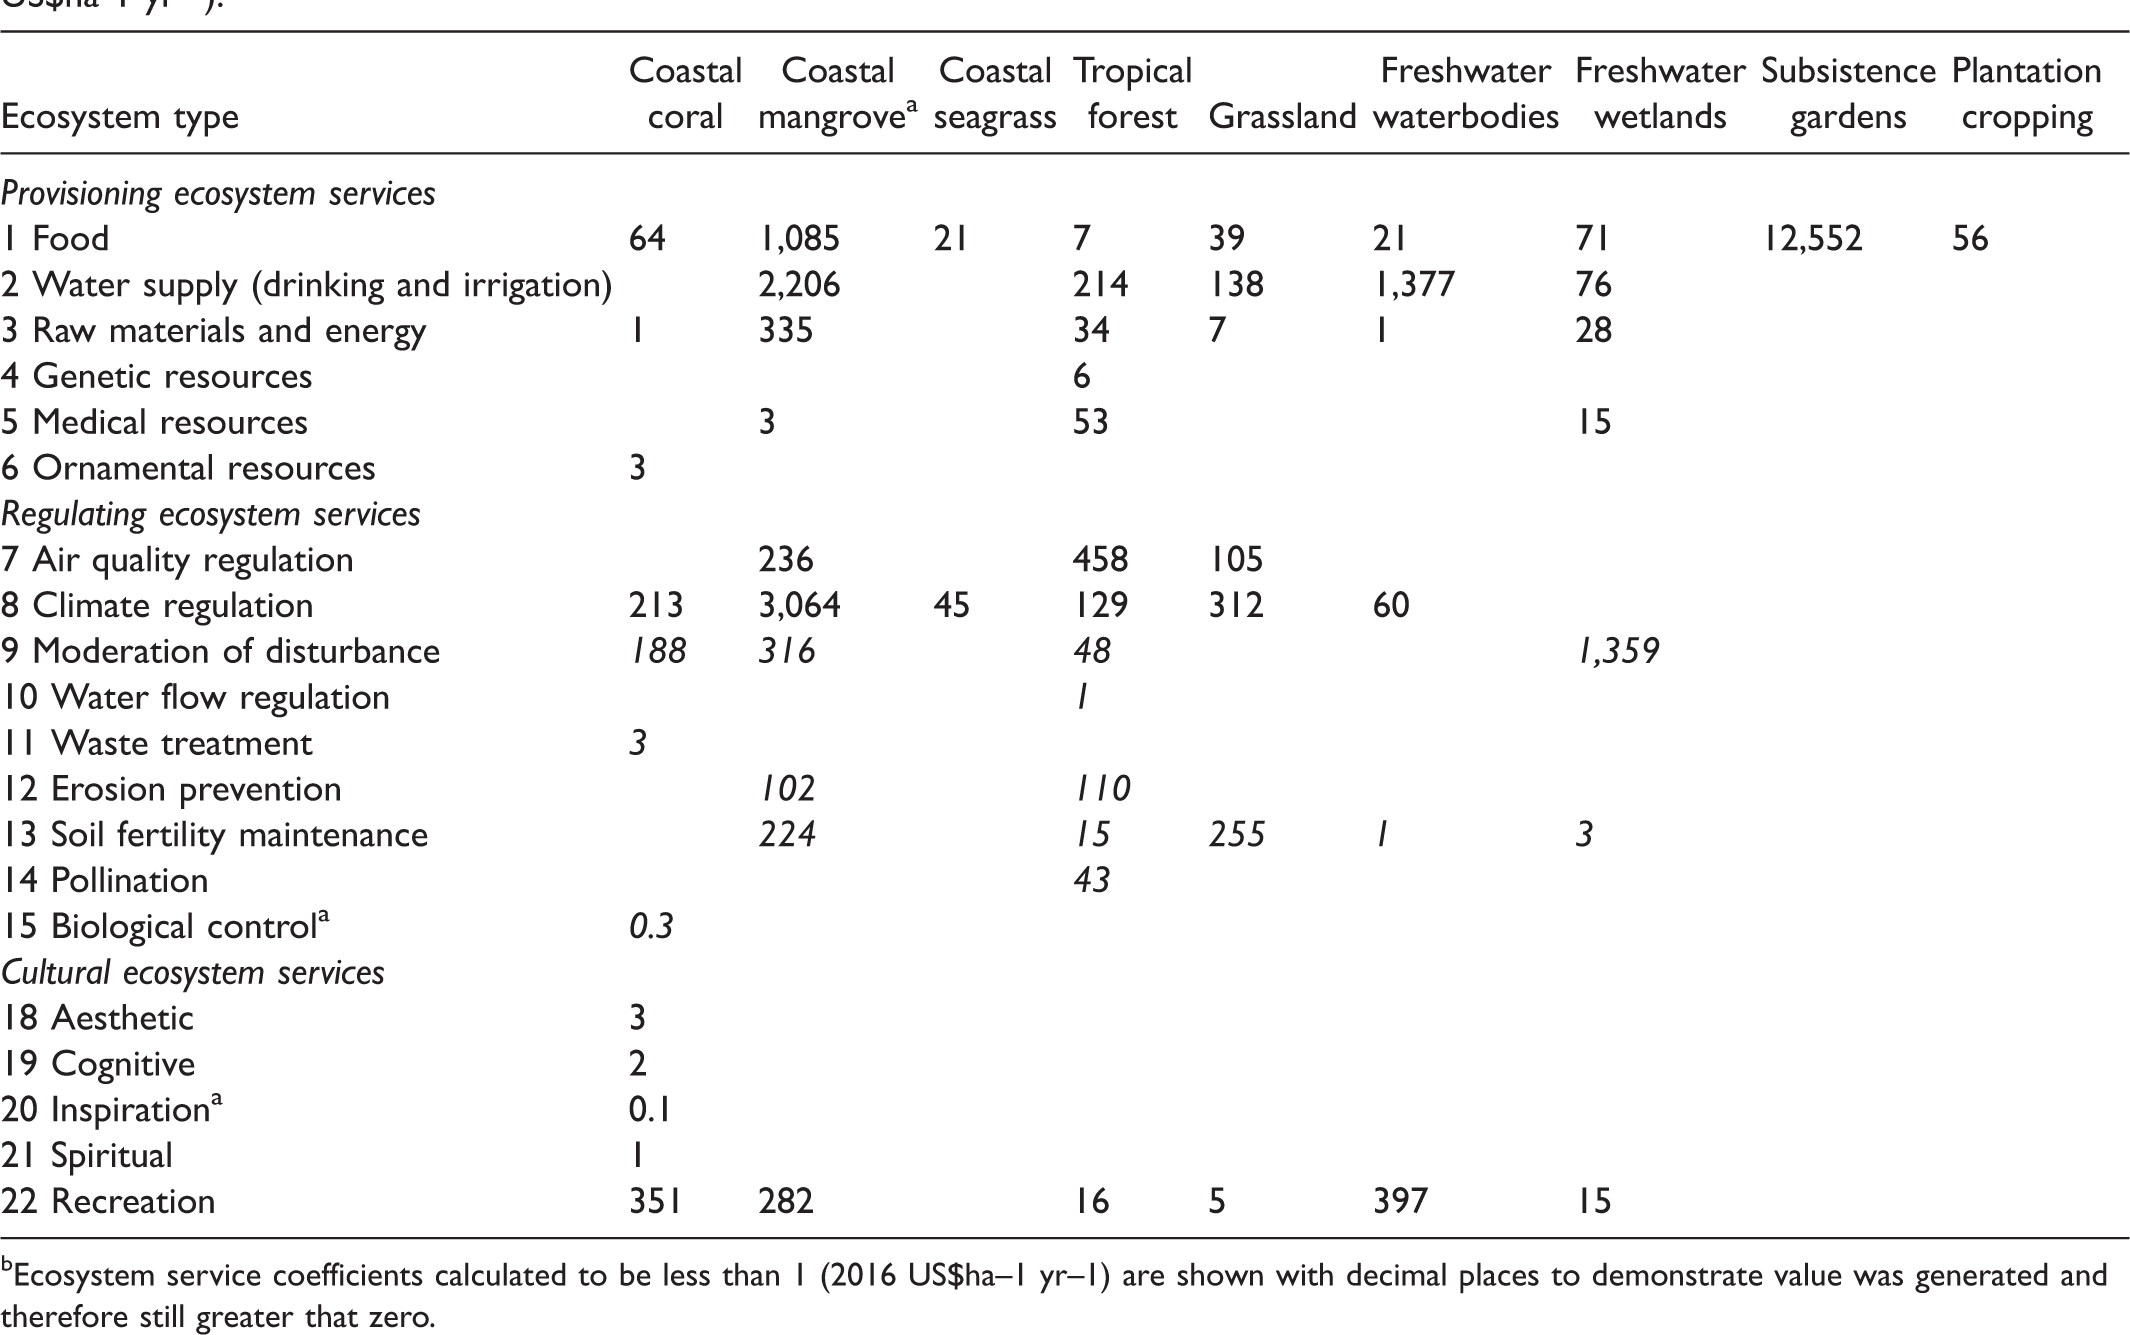
bEcosystem service coefficients calculated to be less than 1 (2016 US$ha–1 yr–1) are shown with decimal places to demonstrate value was generated and therefore still greater that zero.
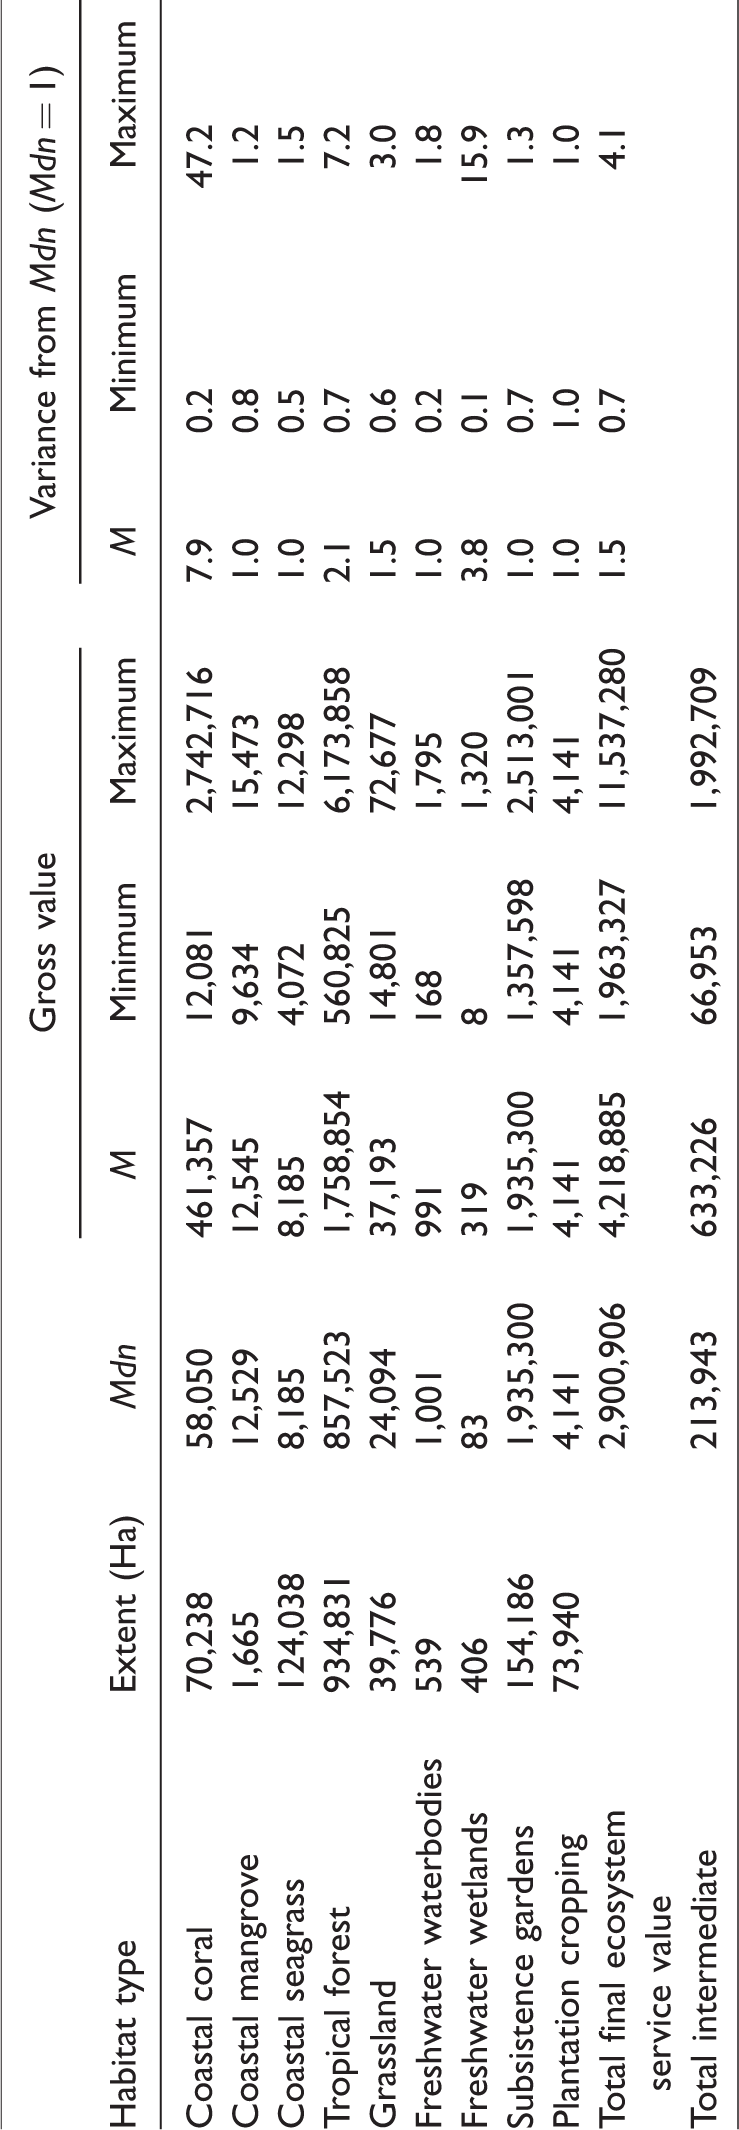
Total Median, Mean, Minimum, and Maximum Final Ecosystem Service Value for Vanuatu (thousand US$yr–1) Based on Habitat Extent.
Total Median, Mean, Minimum, and Maximum Final Ecosystem Service Value for Tanna (Thousand US$yr–1) Based on Habitat Extent.

TESV for Vanuatu
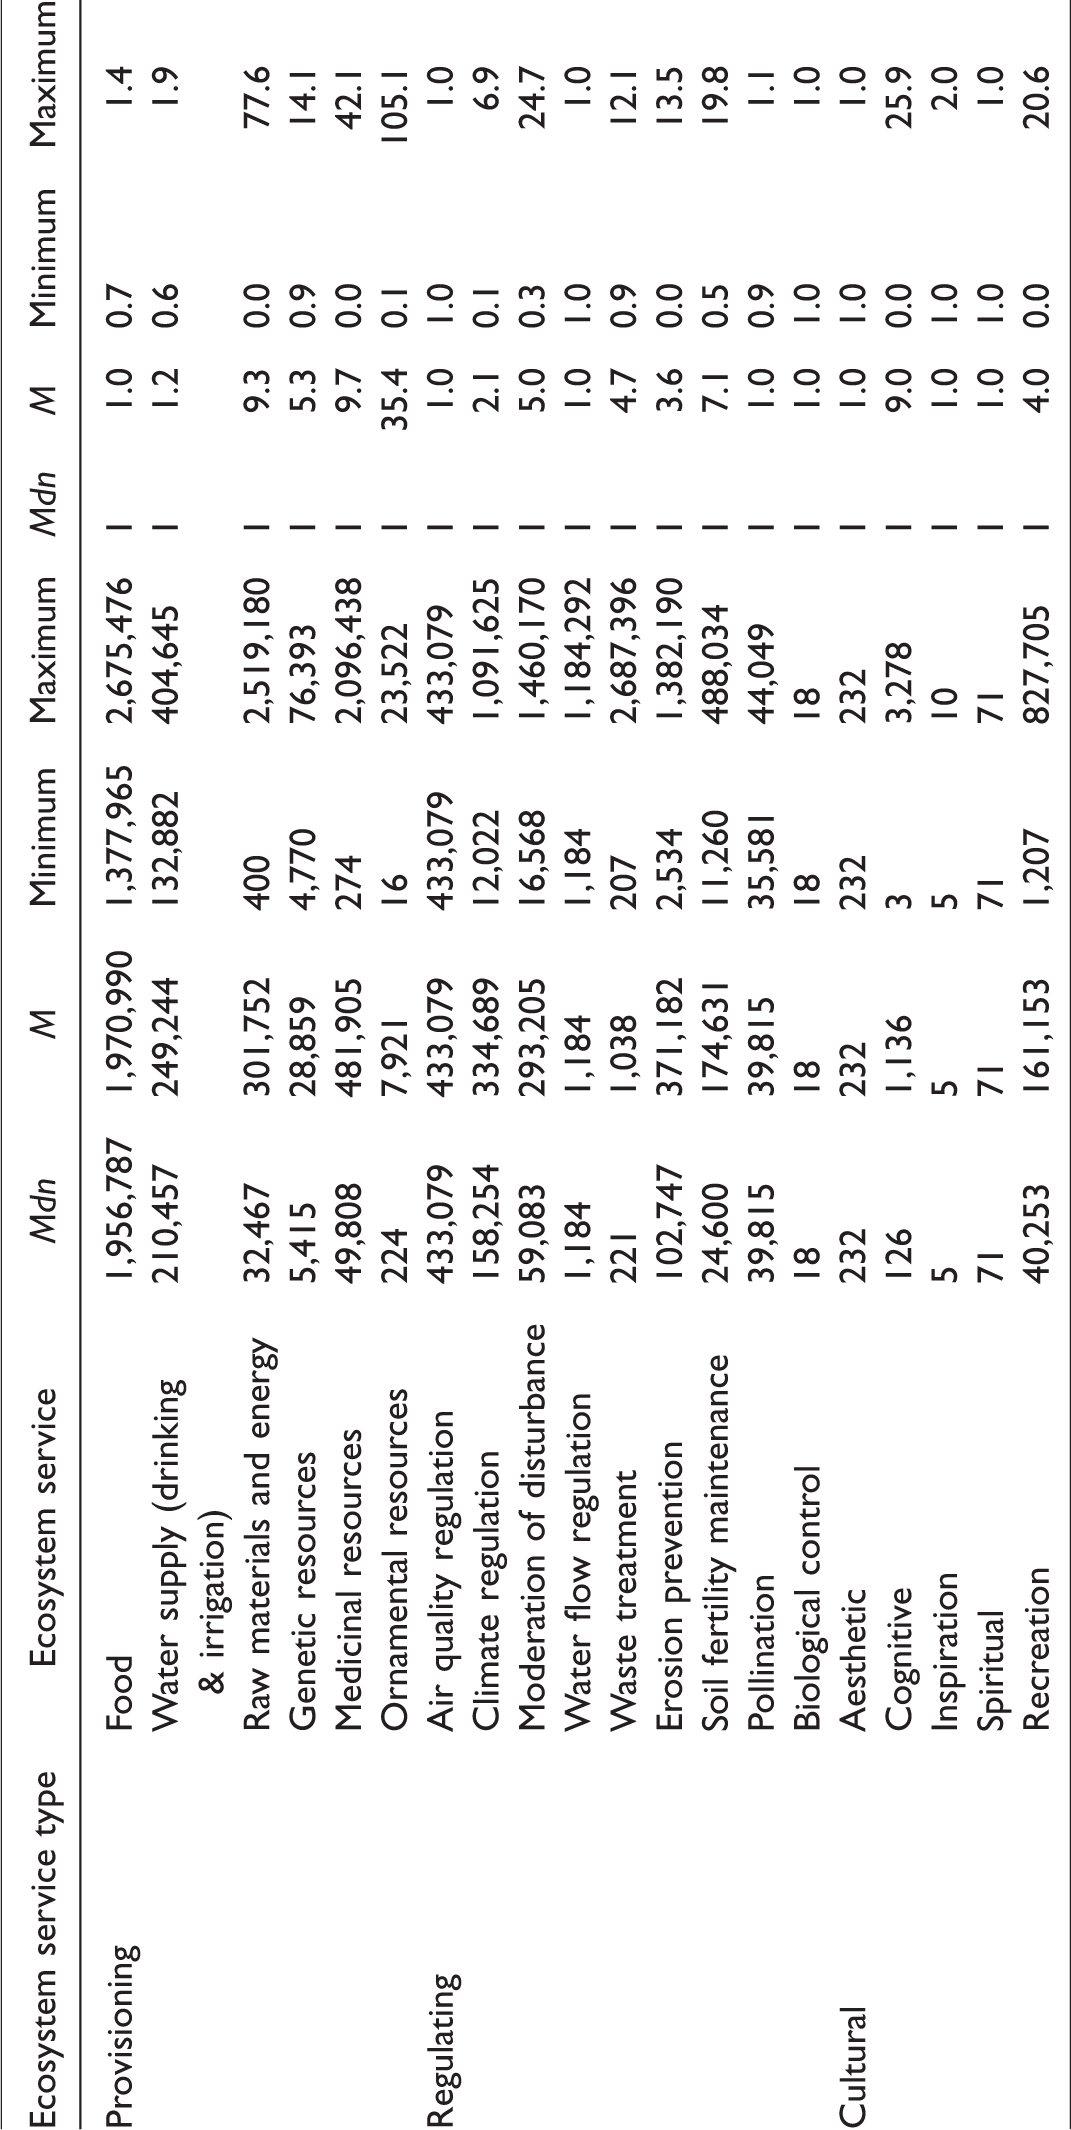
The value of Vanuatu’s ESs to human society is considerable, delivering a median value of more than $2,901 m per year (min.: $1,963 m; max.: $11,537 m; Table 3). On a per capita basis, this is $10,423 per annum (min.: $7,054; max.: $41,452). By comparison, Vanuatu’s GDP for 2016 was $804 million (m; World Bank, 2018b)—smaller by a factor of 3.6—and Vanuatu’s GDP per capita is $2,890 per annum. This reflects the relative importance of ESs to the people of Vanuatu, when compared with goods and services traded through formal markets. Food provision, predominantly originating from the system of subsistence agriculture and agroforestry, is the most important ES by a considerable factor, representing 67.8% (median: $1,957 m yr–1) of final ES value to Vanuatu. Air quality regulation (15%; median: $433 m yr–1), water provision (7.3%; median: $210 m yr–1), and climate regulation (5.5%; median: $158 m yr–1) comprise the majority of the remainder. Provisioning ES provide $2,255 m yr–1 (78.1% of total), regulating services provide $591 m yr–1 (20.5%), and cultural services (mainly tourism) provide $40.7 m yr–1 (1.4%). Of Vanuatu’s TESV, 87.6% derives from just two ecosystem types: subsistence gardens and tropical forests (Table 3).
TESV for Tanna
Similarly, the value of final ES to the people of Tanna is considerable, providing $325 m yr–1 (min.: $368 m; max.: $681 m; Table 4). On a per capita basis, this is $10,053 per annum (min.: $6,973; max.: $21,100). Comparisons with Tanna’s gross island product are not possible, due to lack of data. For Tanna, $304 m yr–1 (93.6%) of final ES value is delivered through provisioning services, $19 m yr–1 (6.0%) is delivered through regulating services, and $1.4 m yr–1 (0.4%) is delivered through cultural services. Approximately 99.0% of Tanna’s ES value derives from just two ecosystem asset types: subsistence gardens and tropical forests.
Discussion
In our case studies, we applied a typical economic valuation methodology for estimating the TESV of two defined landscapes (Vanuatu and Tanna), where primary data are scarce and analysts must rely predominantly on benefit transfer. Our assessment provides a snapshot of ES benefits at a point in time. Repeated application, holding ESs values (or “prices”) steady, enables an understanding of longitudinal trends in ES flows as a result of land-use changes (Boyd & Banzhaf, 2007), such as those carried out by Tolessa et al. (2018) in Ethiopia and Kreuter et al. (2001) in the United States. Our approach can also inform scenario-based planning, which is relevant in light of projected increases in risk from a rapidly changing climate, for example, by assessing ecosystem-based adaptation to both meet the challenges of climate change and provide social benefits as positive externalities (Buckwell et al., 2019b; Morris et al., 2018). Such ESVs can play a role in the global, cross-sector drive toward achievement of the Sustainable Development Goals, specifically target 15.9, which aims to integrate ecosystem and biodiversity values into local planning processes and national accounts. Finally, this methodology can be used to demonstrate the monetary values of ESs that have the potential to attract revenue through PES schemes (Bishop & Hill, 2014). To date, the majority of PES schemes have focused on incentivizing carbon sequestration through forest and mangrove protection and/or rehabilitation through frameworks such as REDD+ (Venter & Koh, 2012). Our approach demonstrates to program sponsors the value of a range of cobenefits associated with habitat conservation, some of which could be potentially monetized in the future (Brown et al., 2017; Webb & Martin, 2016). Our valuations should help Pacific SIDS assist communities to codesign schemes to capture greater value from natural capital stocks under their management, which may otherwise become degraded either through overexploitation or in the pursuit of economic development pathways incompatible with local sustainable development. Overall, our study, by demonstrating the value of the full gamut of ESs and, in particular, including nonmarket and climate regulation values, reveals the considerable contribution that Vanuatu’s natural capital assets deliver to human society, locally (e.g., food and provisioning services), nationally, and globally (e.g., climate regulation).
Our valuations immediately telegraph the need for discussion about comparisons between the contribution of ESs to well-being and Vanuatu’s GDP. In 2016, GDP (current prices) was reported to be US$804.3 m (World Bank, 2018b). Our valuation estimates the contribution of ESs to well-being is between US$2,901 m and US$11,537 m—larger by a factor of between ∼2½ and ∼17. The gulf between GDP and TESV might, in part, explain the disparity between Vanuatu’s global ranking in terms of GDP per capita (126th out of 192; UN Statistics Division, 2017) and its position of fourth in the Happy Planet Index (2016). Published Vanuatu national accounts for 2013 (the latest publication of these data) include assessment of the contribution of “subsistence custom/traditional” agriculture of US$112.29 m (2013 prices). As a proportion of GDP, between 2004 and 2013, the reported contribution of subsistence gardens fluctuates slightly, but we estimate a mean contribution in 2016 to be 14.9%. From this, we estimate the 2016 contribution of subsistence gardening to be US$119.8 m, or US$430 per capita. In contrast, our ecosystem assessment estimates a contribution of between $4,878 and $9,029 per capita per year—larger by a factor of between ∼11 and ∼21. From a theoretical standpoint, our estimate (derived from Anderson’s value of subsistence agriculture) is compatible with system of national account estimations, as it uses an exchange value (prices from a local market) and includes no consumer surplus from nonmarket cultural values or any external costs that may have emanated from any environmental damages from the production of the food. Therefore, the values are directly comparable, and the discrepancy suggests there is a potential undervaluation of the contribution of subsistence agriculture to Vanuatu, which warrants further in situ research to calibrate.
Critiques of GDP as a proxy measure for human well-being are welldeveloped (Giannetti et al., 2015; Philipsen, 2015; Saunders & Dalziel, 2017; Stiglitz et al., 2010), encompassing environmental, distributional, and feminist critiques particularly pertinent to SIDS. More sophisticated alternatives are being adopted by national and state governments, including in Vanuatu itself (Malvatumauri National Council of Chiefs, 2012). However, progress in developing, codifying, and embedding these alternatives into policy is slow and GDP remains a pervasive measure in driving policy decisions, perhaps because alternative outputs tend not to support political imperatives. As our case studies have shown, in Vanuatu, estimating the level of individual and community well-being via GDP alone potentially underestimates the important contribution of ecosystem assets to human well-being, perhaps leading to misdiagnoses of community threats and pursuit of maladaptive land-use policy. While further development of ecosystem accounting through the SEEA Central Framework (UN Statistical Division, 2012) and the incorporation of ecosystem flows into “green GDP” will start to close this gap, it remains imperative to also consider locally specific consumer surplus values associated with nonmarket spillovers when designing policy and programs in Pacific SIDS contexts. Not considering the full gamut of ES values will also likely have distributional consequences, favoring policy that promotes monetary exchange of what would otherwise be Kastom goods and services, outside the production boundary, such as housing, food, and materials.
In undertaking our TESV estimation, a number of context-specific sensitivities and challenges were evident, which, if not adequately addressed, or at least acknowledged, may result in misleading valuations, provide misguided support for perverse policy responses, and erode confidence in valuations.
Sensitivity and Data Gaps
In data-poor environments, analysis risks significant sensitivity in valuation. Analysts must trade-off between “specificity, reliability, and applicability” to provide justifiable and replicable valuations (Troy & Wilson, 2006, p. 445). Our results show reasonable spread in the median, minimum, and maximum values. For example, on a dollar per hectare per year basis, for Vanuatu, coastal coral exhibits the greatest spread, with minimum and maximum values varying from the median (1.0) by 0.2 and 47.2, respectively (Table 3). The largest spread in value for individual ESs was for ornamental services (1.0, 0.1, 105.1). In general—and unsurprisingly—the greater the number of observations abstracted through our economic valuation strategy, the greater the spread in ES values. However, this relationship was a poor fit (R2 of .0016). For example, the variance for food, which had the greatest number of observations, was relatively modest (1.0, 0.7, 1.4), though this is strongly influenced by the value attributed to food for subsistence gardens (Table 3). Overall, the variance across all ESs was between 0.7 (min.) and 4.1 (max.).
Variation in valuation estimates is undoubtedly a reflection of the heterogeneity in the socioeconomic-ecological environments of the original studies and the valuation methods employed rather than a systemic weakness in benefit transfer. However, the reasonable variances from the limited number of studies indicate that incorporation of data sets from new studies could significantly change our coefficients. The work completed for the TEEB valuation database by van der Ploeg and de Groot (2010), though highly cited, is now more than 10 years old and based on studies going back much further. Encouraging funding for more primary studies is the obvious answer; however, continually supported and curated valuation databases of existing studies would also improve this situation. More broadly, our study identified there is a lack of ES valuation data from research conducted in Vanuatu and Pacific SIDS, more generally. For example, our search revealed just two valuations for Vanuatu and relied on a single source for subsistence gardens in a Melanesian context (see Valuation Methodology section).
Our method also highlighted gaps in key data. For example, our case studies lack an important estimate for biological control for tropical forests and climate regulation for subsistence gardens. Such gaps result in an underestimation of the ES values for these habitats. These gaps also extend to spatial data. Our method’s data source for seagrass estimated zero extent for Tanna, yet from fieldwork conducted by the authors in 2018, we discovered and measured seagrass beds on Tanna’s south coast.
Variance in Final Ecosystem Service Value for Vanuatu (thousand 2016 US$ha–1 yr–1).
Ecosystem Integrity
It is not contentious to assert that the quality and thus quantity of ES flows reduce with declining ecosystem integrity. For example, 10 fragmented 10 ha blocks of tropical forest when compared with a single, intact 100 ha block will have a lesser potential for the provision of a number of ESs, including as a carbon stock, refuge for wildlife, and regulation of sediment and microclimates (Briant et al., 2010; Broadbent et al., 2008; Forman & Alexander, 1998; Hamilton et al., 2017; Kindu et al., 2018). Benefit transfer valuations commonly lack the local data needed to match the condition of ecosystems with either the potential or realized flow of benefits. We know from field transects carried out in 2017 and 2018 that, while Tanna’s coral reefs are generally in adequate condition (localized pressure in proximity to the main town, notwithstanding), there is wide variation in the condition of Tanna’s tropical forests, which range from young secondary regrowth to intact primary forest. The converse can be said for the condition of coral reefs across Vanuatu, which is not consistent with the relatively good condition of those around Tanna (Naviti & Aston, 2002). While it is probable that the values on which our ES coefficients are derived are from habitats that span a range of conditions, site-specific survey data are needed for these relationships to be quantified and appropriate adjustments made to the coefficient values of relevant ESs. This is an ongoing subject of further research, recognized in the SEEA-EEA framework (UN Statistical Division, 2018). SEEA-EEA tackles this challenge from two directions: first, by including only those ESs for which there is a measurable local demand, thus ensuring that the demonstrated demand can never exceed supply, and second, by reporting indicators of ecosystem asset condition that can be used to scale the ability of specific assets to deliver particular ES flows (Keith et al., 2019). In our case study, reflecting only services for which there is a local demand would ensure more robust final ESV for subsistence gardens and plantation forests but would come at very significant cost in terms of demanding detailed primary research.
Application of Data
Our inclusion of subsistence gardens and plantation cropping as “ecosystem types” (consistent with the SEEA-EEA framework) lends to results being interpreted in a way that suggest land-uses can be traded off to increase the TESV generated by a landscape. In our case studies, the trade-off between tropical forests, plantation forests, and subsistence gardens presents a pertinent tension. Across much of Vanuatu (mountainous areas, aside), each of these ecosystem types are interchangeable and are in competition. A forest, for example, provides different and often incompatible services to distinctive user groups who might wish to utilize it in competing ways—using a forest for timber extraction impacts on others who harvest nontimber forest products, yet both groups may have legitimate access to the habitat. The potential conflicts between incompatible land uses highlight the need to understand the role of synergies among and between regulating ESs that arise from the connectivity between ecosystems, such as the role of tropical forests in protecting coral reefs by reducing sediment runoff (Brown et al., 2017) and the role of secondary tropical forest regrowth in providing soil fertility. Ostensibly, at a per hectare per year level, the contribution of subsistence gardens to food is US$12,552, whereas tropical forest contributes US$917 in final services. This suggests conversion of tropical forest to subsistence gardens represents optimal policy for increasing well-being. It also, perhaps, explains the reality on the ground: On Tanna, the conversion of tropical forest to subsistence gardens is occurring at a significant rate (∼60 ha per year; Mackey, Ware, Nalau, et al., 2017). Simplistically, the greater the rate of conversion of tropical forest to subsistence gardens, the greater the level of welfare that can be obtained from the land.
Our data assume a linear relationship between ecosystem asset area and ES delivery. Despite an overall increase in the area of cultivated land, population growth (2.3% per annum) has reduced the cultivated area per capita (however, it is possible urbanization might have offset the per capita loss of cultivated area for rural subsistence households). This trend suggests that increasing demand for food is resulting in the overexploitation of current agricultural land, leading to encroachment on forests in the search for new, more fertile soil for subsistence agriculture (Reardon et al., 1996). While tropical forests provide important ESs, subsistence gardens provide the most pressing of human needs: food. Reported reductions in agricultural yields, most likely from root crop diseases and falling soil fertility from insufficient fallow periods, coupled with population growth that increases the demand for food, will likely lead to further deforestation pressures until forest scarcity equalizes the opportunity cost of more clearing. This trend has implications for the ongoing protection of tropical forests on Tanna and their associated ESs, including the regulating services they in turn provide to subsistence gardens, as apparent, observed ecological state and thus, the signal of scarcity, might not be in equilibrium.
On Tanna, external pressures, such as climate change impacts and the increased demand for food from population growth, will undoubtedly heighten pressures on habitats, increase the likelihood of degradation in their condition, and potentially invoke irreversible changes. Experience elsewhere across a range of ecosystems highlights that the risk of reductions in future yields of ESs (particularly provisioning and regulating) may not become evident before thresholds have already been breached and state change has become inevitable (Koch et al., 2009). Current ES flow is thus not necessarily the final equilibrium outcome of present drivers and current state. For example, it is unclear if current fishing effort on Tanna is within long-term sustainable thresholds, or the “safe operating space” for coastal coral reefs (Hughes et al., 2017). Community consultations on Tanna reveal the shore-based reef fishery is both important to local food supply and has been subject to significant changes in catch, in terms of quantity and fish species. Time-series data collection should be a priority to detect any changes in ES delivery. However, we currently lack the information to identify thresholds in ecosystem asset areas below which specific ESs begin to degrade nonlinearly.
Incorporating Kastom Conceptions of ESs
Governing services are those “co-produced by humans using societal institutions and nature’s components and processes” (Spangenberg et al., 2015, p. 202). In this instance, the authors were discussing developed world governance structures—laws, policies, governments that protect private property—but similarly, Mackey et al. (2017) introduced the concept of “Kastom services” to articulate the close coupled socioecological systems, such as how Kastom land and reef resource management is an enabler for people and communities to harvest and benefit from ESs. Estimates of these contributions to aspects of Kastom in the Pacific SIDS context have been attempted (Kenter et al., 2011; Paudyal et al., 2016). Although Ni-Vanuatu communities undoubtedly experience significant benefits from habitats and landscapes providing ESs to culture, including sense of communal identity, sacred sites for ceremonies, and other aspects of traditional knowledge (Nalau, Becken, Schliephack, et al., 2018), there are very few studies from which benefit estimates could be transferred. Furthermore, benefit transfer is likely not an appropriate method for Kastom services as, by their nature, they are highly situation-specific (Kenter et al., 2011). We, therefore, did not attempt to derive a monetized valuation of one of the most important benefits of tropical forest ecosystems in the Vanuatu context, namely, their Kastom use. Kastom use is largely of a nonextractive nature, including cultural practices and harvesting of some non-timber-based products. The cloud forest on Tanna, in particular, has both high biodiversity and Kastom values, as have numerous places across Vanuatu and Pacific nations. While it is not essential to obtain monetized valuations for cultural ES, it is worthwhile investigating whether there are feasible approaches to qualifying Kastom values in a way that can integrate with ESV through multi-criteria assessment, particularly as, in our case studies, these forests are under pressure from poorly regulated timber extraction and expansion of subsistence agriculture.
While the demand for food, raw materials, and water is direct, immediate, and well understood in the community, regulating and cultural services, which undoubtedly contribute essential elements of value, are more difficult to evaluate (Fischer & Eastwood, 2016; Rasmussen et al., 2017). This has implications for data capture methods in future research into the ESV in SIDS and least developed countries and perhaps suggests that discursive elicitation techniques should be used in parallel to traditional valuation methods to better capture social and shared benefits provided by the different ES types (Jacobs et al., 2016; Kenter et al., 2011, 2016). For example, the value of the Tanna reef fishery is not simply a function of the catch rate but also an outcome of an understanding of the role of cultural relations within and between tribes and their relationship with Kastom natural resource management (Foale et al., 2011; Lindstrom, 2011; Stoeckl et al., 2018).
However, the very concept of “cultural services” is critiqued. For example, Satz et al. (2013) argue cultural benefits are more conceptual rather than material, which has tended to lead the category being used as a miscellaneous basket into which unallocated, nonmaterial services get placed when no better basket can be determined. Instead, the authors suggest cultural ESs be revised and the term intangible/immaterial ESs be used to clarify boundaries. Further critiques have looked at the relational aspects of cultural services, arguing cultural services are coproduced by nature and society (Díaz et al., 2018) or the value lays in the state of the “stock” of relational strength between people and nature (Jackson & Palmer, 2015).
Willingness to Pay as a Measure of Value
Economic valuations of ES in low-income contexts, such as those from low-income countries in the TEEB database, will typically yield very low willingness to pay values. In predominantly cashless, subsistence communities, where land is majority customarily owned, there is often lower values associated with the utility of money (as there is often little to buy with cash) when compared with communities for whom exchange via cash is dominant (Bush et al., 2020; Kenter et al., 2011). Kastom communities in the Pacific also have a tendency to accumulate and share common wealth (Lindstrom, 1982; Nalau, Becken, Schliephack, et al., 2018) rather than retain it only at the individual or household level—the standard unit of neoclassical economic analysis. From initial fieldwork on Tanna, it is evident common ownership principles do not extend to the full gamut of material goods (fishing gear, boats, and household items are exclusively “owned” by households or families), but clearly land and coral reefs and the provisioning of goods from these habitats are customarily owned and therefore do not lend to individualistic notions of willingness to pay estimation of value.
Monetary values of ESs elicited through economic valuation methods assume that demand curves are derived from opportunity costs in efficiently functioning markets, not one where the price is opaque or the market is distorted, which is often the prima facie case for undertaking the economic study in the first place. For example, basing the marginal ES value of a subsistence garden on the cost of goods purchased at a nearby market (in this instance, the value from Anderson, 2006) assumes the prices at those markets have already accounted for any externalities (positive and negative) in their production, such as forest loss and depletion of localized regulating ESs to grow cash crops. This is never likely to be the case. Vinde Folkersen (2018) suggests a range of value-indicators, such as time, labor, geographical distance, and collective community efforts be explored in the evolution of social and nonmonetary valuation of ecosystems in Pacific SIDS contexts, which reflect complex, social norms and cultural value systems, such as Kastom (Costanza et al., 2017; Kenter et al., 2016; Stoeckl et al., 2018; Vinde Folkersen, 2018). Further research that reveals more locally explicit exchange values for the contribution of subsistence agriculture (e.g., based on replacement cost) would fill an important research gap at the national or regional scale; however, overlaying these values with complex, social values at the local scale should also be included where budgets allow.
Last, nonmarket valuation methods assume that social welfare (or the total value of a good, or the net social benefit of a project) is the sum of individual willingness to pay values. There is growing recognition that benefits associated with the environment are frequently interdependent (i.e., “complex”; Stoeckl et al., 2018). Researchers who aggregate partial values to estimate TESV risk both double counting overlapping values and precluding interdependent values that may be synergistic; that is, the whole may comprise more than the sum of its parts. Furthermore, simple aggregation of individual estimates of “value” may be inappropriate in some contexts, particularly when both the ecosystem asset and their values are held at the community level (Adamowicz et al., 1998). This suggests that “integrated valuation” or “participatory valuation” methods could be both fruitful and useful (Costanza et al., 2017, p. 8).
The Political Realm
Finally, ESV as a decision support tool should be placed in a political context. Vanuatu has international commitments to the Convention on Biological Diversity and the Aichi Targets, which binds its government to achieving biodiversity protection outcomes. These targets provide impetus to policy from the top down to the community level to support sustainable management of ecosystems and Kastom resources through its own National Biodiversity Strategy and Action Plan (Republic of Vanuatu, 2018), which includes nationally appropriate interpretations of the Aichi Targets by referencing sustainable management of natural resources, protection of biodiversity for future generations, and protection of the legal rights of Ni-Vanuatu as resource custodians and users. ES value estimates should be used as merely one type of evidence among many (e.g., habitat assessments, ecological field studies, biological inventories, socioeconomic research, etc.) in supporting natural resource allocation and management decisions (Troy & Wilson, 2006), particularly to avoid risks of commodifying nature (Gómez-Baggethun & Ruiz-Pérez, 2011).
Conclusion
Our study estimated final TESV provided by the habitats of Vanuatu and Tanna to their people. This value is substantial, far outweighing measures of economic activity recorded in GDP. However, in undertaking our work, a number of sensitivities and challenges were identified, which, if not accounted for, or acknowledged, can encourage misinterpretation or maladaptive responses to environmental pressures. Our assessment of these sensitivities and challenges can guide analysts to improve methods and the communication of results to stakeholders so that the original purpose of the study—often to highlight market failures and to incorporate nonpriced goods and services—do not serve to support perverse outcomes and continued overexploitation of natural resources. We have pointed to a number of ways of improving ESV in Pacific SIDS contexts, such as hastening new primary research, maintaining serviceable valuation databases, augmenting ecosystem accounting with stated preference valuations to incorporate complex, social values, such as Kastom value, incorporating data on ecosystem condition into benefit transfer approaches, and supplementing survey methods with more participatory methods of value elicitation.
Despite decades of defensible and replicable ESV and incorporation of these values into policy evaluation and benefit cost analysis in the developed and developing world, it could be argued there has been little improvement in environmental outcomes. Information alone is a necessary but insufficient condition, as economic development pathways have tended toward running down natural capital. Pacific SIDS communities, which, as we have demonstrated, rely heavily and directly on nature for the provisioning of their immediate needs, such as food, water, and shelter, and who experience close spiritual and cultural connections to their traditional land and ocean resources, are reliant on the continuation of ecosystem functions and processes. The extent of this reliance is missing from prosaic measures of well-being. ESV can provide a vital role in highlighting trade-offs inherent in economic development and continues to evolve in response to experience in valuation exercises in the field and in new contexts, including Pacific SIDS.
Footnotes
Acknowledgments
Research specific to the Republic of Vanuatu is enabled by a Research Agreement between the Vanuatu National Cultural Council and Griffith University (May 17, 2018). We are also grateful for the on-the-ground assistance of Allan Dan, as the Ecosystem and Socio-economic Resilience Analysis and Mapping Tanna Island project officer, and to the Tafea Provincial Government for the support and cooperation and the Tanna community for their hospitality, support, collaboration, and sharing of local knowledge.
Declaration of Conflicting Interests
The authors declared no potential conflicts of interest with respect to the research, authorship, and/or publication of this article.
Funding
The authors disclosed receipt of the following financial support for the research, authorship, and/or publication of this article: This research was made possible by program funding through the Pacific Ecosystem-based Adaptation to Climate Change project, a 5-year initiative implemented by the Secretariat of the Pacific Regional Environment Programme in partnership with the governments of Fiji, Solomon Islands, and Vanuatu and the funding support of the German Federal Ministry for the Environment, Nature Conservation, Building and Nuclear Safety. The research was also supported by a grant to Griffith University from a private charitable trust that wishes to remain anonymous.
Supplemental Material
Supplemental material for this article is available online.