




Abstract
This study explored the longitudinal measurement invariance in the Beck Depression Inventory–II (BDI-II) in early adolescents (junior high school students). The participants were 730 early adolescents (330 boys and 400 girls), who were followed up over 3 years (in six waves). To reduce the size of longitudinal model and verify the stability of the findings, the Fall and Spring series data sets were analyzed separately. Each series includes three waves of data with about 1-year apart. It was found that the three-factor model (Negative Attitude, Performance Difficulty, and Somatic Elements) best fitted the data. Results of both data sets provided support for the longitudinal measurement invariance (threshold invariance) of the three-factor model, suggesting that the BDI-II measured the same construct over 3 years. The study also examined the category function of the BDI-II on the basis of the pattern of threshold estimates. Finally, the implications of the findings on the continuing use of the BDI-II are discussed.
Depression has become a globally prevalent condition, and it is a common psychological state in both clinical and nonclinical conditions (Ferrari et al., 2013). Longitudinal studies that explore the relationships between depression and other covariates across different contexts are common in health and counseling psychology (e.g., Michl, McLaughlin, Shepherd, & Nolen-Hoeksema, 2013; Moon, Smith, Lahr, & Cutrer, 2013; Steinberg, Karpinski, & Alloy, 2007). The Beck Depression Inventory–Second Edition (BDI-II; Beck, Steer, & Brown, 1996) has been widely used to measure the severity of depressive symptoms in respondents in these longitudinal studies. The observed scores of the BDI-II obtained on different occasions are usually compared to assess the changes in respondents’ depression. The underlying assumption in doing so is that the same construct of the BDI-II is measured over time. The comparison of BDI-II scores is justified only when longitudinal measurement invariance (LMI) of the construct is demonstrated. More specifically, if the BDI-II fails to measure the depression construct equivalently across different occasions, any inference about developmental change over time may be inaccurate and misleading.
In longitudinal research, the violation of LMI hampers the validity of score comparison, especially in interventional studies. For example, respondents change their perceptions on BDI-II items following intervention programs, and this change may lead to increase or decrease in the effect of treatment. For example, Fokkema, Smits, Kelderman, and Cuijpers (2013) found that the BDI-II failed to operate equivalently over the course of depression treatment, resulting in baseline depressive symptoms being underestimated compared with follow-up measurement. Consequently, comparison of the observed total scores of the BDI may underestimate treatment efficacy and result in biased conclusions. In clinical settings, the efficacy of depression treatment is partly based on the change in scores of the self-reporting measurement (e.g., BDI-II) over time. Therefore, it is important to address the issue of LMI to ensure a valid and sensitive longitudinal assessment of BDI-II with which to accurately assess the development and treatment of depression.
Longitudinal Measurement Invariance of the BDI-II
LMI explores whether the same constructs are assessed over time within the same group to ensure that changes in test scores over time can be attributed to actual changes in the construct under investigation. In other words, the expected value of individuals’ scores on indicators is the function of their scores on the latent variable, not depending on time of measurement (Meredith, 1993). Testing for LMI involves at least three forms of measurement invariance: configural, weak/metric, and strong/scalar invariance, with each level specified by an increasingly restrictive set of requirements. The first level of configural invariance evaluates whether the pattern of indicators in relation to factors remains constant over time. The second level of invariance is metric (factor loading) invariance: If configural invariance holds, metric invariance can be assessed by evaluating whether the factor loadings are the same over time. Factor loadings refer to the strength of the linear relation between each factor and its associated items (Bollen, 1989). When the strengths of factor loadings change, potential changes in the levels of latent variables may not be adequately represented by changes in measured variables.
The third level of invariance is scalar invariance. Depending on the nature of measured variables, this level of invariance involves either the intercept or threshold invariance. If measured variables are assumed to be continuous and interval-scaled, the intercept invariance can be tested. If measured variables are assumed to be ordinal and categorical, the invariance of thresholds over time should be tested. This scalar invariance is required for comparing latent mean differences (Chen, 2008; Little, 1997). Without the assessment of invariance over time, one cannot be sure whether observed changes over time represent true changes or the results of changes in the interpretation of items of the construct (Brown, 2006).
Although many past studies examined the cross-gender or cross-cultural measurement invariance of the BDI-II (e.g., Byrne, Stewart, Kennard, & Lee, 2007; Whisman, Judd, Whiteford, & Gelhorn, 2013; P.-C. Wu, 2010a, 2010b), few studies investigated the measurement invariance of this instrument over time. Two studies have examined the LMI of the BDI-II and found considerable changes in factor structure of the BDI-II over the course of mental health treatment (e.g., Elhai et al., 2013; Fokkema et al., 2013). Fokkema et al. (2013) assessed depression in 155 participants diagnosed with major depressive disorder (MDD) and found that compared with before treatment, after-treatment item scores appeared to overestimate depressive symptoms (noninvariant intercept) over time. Elhai et al. (2013) assessed the depression of 1,025 psychiatric in-patients at admission and after 1 month of treatment, and found that factor loadings increased, but item intercepts decreased significantly after 1 month of treatment. These findings suggest that subjects may have changes in their interpretations of depression symptoms and standards of measurement during the treatment. However, these results obtained from the use of patient subjects may not be generalized to the nonclinical sample. With an investigation with Hong Kong community adolescents, Byrne, Stewart, and Lee (2004) tested the LMI of one second-order factor model of the BDI-II and found that both the lower and higher order factor loadings were invariant over a 6-month measurement period. However, this study did not examine the scalar invariance over time.
It is apparent that although various language versions of the BDI-II have been used globally, there is no convincing evidence that this measure can be used to assess the development or treatment effectiveness of depression. Furthermore, the three previously mentioned studies assumed the response scales of the BDI-II to be continuous variables when evaluating LMI. Essentially, the BDI-II is an ordered categorical measure in which the response options of the items are both discrete and ordinal. The measurement invariance analyses of this kind of measure could be carried out using categorical confirmatory factor analysis (CCFA; Millsap & Yun-Tein, 2004). Accordingly, the goal of the present study is to investigate the LMI of the BDI-II in the framework of CFA for ordered categorical measures.
The first onset of depression emerges in early adolescence, at a mean age of 13 to 15 years (Lewinsohn, Clarke, Seeley, & Rohde, 1994). However, the early onset of depression has frequently been unrecognized or even neglected (Son & Kirchner, 2000). Depression in teenagers tends to produce a higher likelihood of recurrence of adolescent or adult depression (Simons, Rohde, Kennard, & Robins, 2005). However, little is known about the LMI of the BDI-II in early adolescents. To fill this gap in the literature, this study explores the LMI of the BDI-II with junior high school students.
Method
Participants and Procedure
Data for the study came from a 3-year longitudinal project conducted in Taiwan. The data sets for this project were collected from five junior high schools from the Fall semester of 2011 through to the Spring semester of 2014. All participants and their parents completed informed consent forms during the students’ first year in junior high school. They completed the survey twice per year at 6-month intervals. Fall data were collected approximately 8 to 10 weeks after the beginning of the school year (from the end of October to the beginning of November), and Spring data were gathered 6 months later, from approximately the end of April to the beginning of May. In the longitudinal model, the numbers of observed variables rapidly increase with the numbers of assessments, which in turn makes computation difficult (Vandenberg & Lance, 2000). Additionally, one may wonder whether the same findings would be obtained from the analyses of two data sets. Therefore, the three-wave data sets collected during the Fall semesters were analyzed first to assess the LMI of the BDI-II, and then the Spring data sets were analyzed to examine whether the findings obtained from the analysis of the Fall data sets could be replicated. There were 730 participants (330 boys and 400 girls) in this study. Participants had a mean age of 13.4 years (SD = 0.43) in the first year of this project.
To ensure data collection quality (i.e., reducing the probability of missing data), within 1 week of the data collection in each wave, the research assistants returned to the schools to collect data from participants who had been absent or unavailable for testing. In Taiwan, high school education is compulsory. As such, there was only a small degree of partial item nonresponse (i.e., missing responses on one or some items) for the six waves of assessments, with the attrition rates ranging from 0.96% to 4.79%.
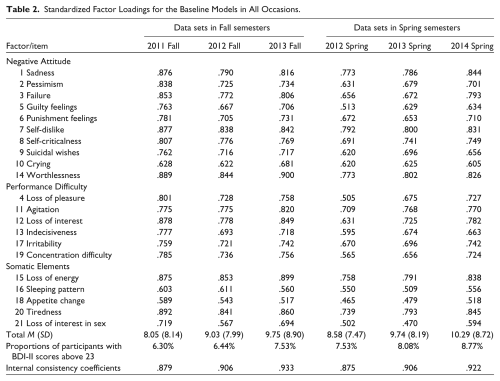
The mean scores for the six waves of assessments (shown in Table 2) were below the cutoff value for minimal depression (i.e., BDI-II score of 13; Beck et al., 1996). However, based on the cutoff score (23) of the presumptive diagnosis of MDD for adolescents (Dolle et al., 2012), 6.30% to 8.77% of the participants had MDD. Apparently, the sample investigated in this study included some adolescents who showed moderate to severe depressive symptoms over time.
Instrument
The Chinese version of the BDI-II (BDI-II-C) was used to measure the participants’ levels of depression. The BDI-II-C consists of 21 items, and each item includes four response options indicating increasingly severe levels of depression. Participants were asked to choose the option that best described their conditions during the past week. Satisfactory reliability estimates for the BDI-II-C total scores were obtained, with an internal consistency of .88 to .94 for adolescents (Byrne et al., 2004; P.-C. Wu, 2010a) and .88 for adults (P.-C. Wu, 2010b). In this study, internal consistency coefficients for six waves of data ranged from .875 to .933.
Analysis
The initial step of the analytical procedure for this study was to establish the baseline model for the further assessment of the LMI of the BDI-II. Past studies on the factorial structure of the BDI-II with nonclinical samples commonly found a two-factor model (Cognitive-Affective and Somatic factors; Beck et al., 1996; P.-C. Wu & Chang, 2008); a three-factor model (Negative Attitude, Performance Difficulty, and Somatic Elements; P.-C. Wu, 2010b; P.-C. Wu & Huang, 2014); and a second-order factor model (with the same three first-order factors; Byrne et al., 2004). In addition, because a latent depression trait was assumed to underlie the responses to the BDI-II in clinical scoring mechanism, one single factor model was also fitted to the data. These four factor structures were separately fitted to each of the six-wave data to assess which model best fitted the data generally and should be considered as the baseline model. The baseline model was judged to have an adequate fit if the comparative fit index (CFI) > .95, the Tucker–Lewis index (TLI) > .95, and root mean square error of approximation (RMSEA) < .06 (Hu & Bentler, 1999).
Because the items of the BDI-II are measured with ordinal categories, the estimator of weighted least squares with mean and variance adjusted (WLSMV) was used in Mplus 7.11 (L. K. Muthén & Muthén, 2013). The WLSMV assumes that underlying each categorical observed response variable is a continuous latent response variable, with thresholds to distinguish between categorical responses (L. K. Muthén & Muthén, 2013). In the case of the BDI-II, a 4-point Likert-type scale contains three threshold values. The first threshold indicates the expected value (z score) of the latent response variable at which an individual transitions from a value of 0 to a value of 1 on the categorical outcome variable. The second threshold delineates the expected value of the latent response variable at which an individual transitions from a value of 1 to a value of 2 on the categorical outcome variable, and so on. In Mplus, when the weighted least square estimator is used in a model with no covariates, pairwise deletion of missing data is used as the default.
In the second step, tests for LMI were conducted with a series of the nested models by successively setting the equality of the parameters of the measurement model across occasions. The overall procedures for testing LMI with categorical data were similar with continuous data. In the configural invariance model, the same pattern of free and fixed factor loadings was specified for three waves of data simultaneously, but neither factor loadings nor the thresholds were constrained to be equal across occasions. The uniqueness of the same indicator was allowed to be correlated across occasions. Furthermore, additional constraints were added to variances when latent response variables and thresholds were included. The baseline unique variances, unique variances for the reference item, and factor variances at each time point were fixed to 1. Additionally, the factor mean was fixed to 0 (Bontempo, Grouzet, & Hofer, 2012). These constraints needed theta parameterization in Mplus (B. O. Muthén & Asparouhov, 2002).
In the weak (metric) invariance model, the factor loadings were also constrained to be equal across occasions. In the strong (scalar) invariance model, due to the replacement of intercepts with thresholds for ordinal variables, equality constraints on item thresholds were added to evaluate whether the thresholds of each item remained constant across occasions (Millsap & Yun-Tein, 2004). It should be noted that the strict (uniqueness) invariance model, which requires the residual variances of items across times to be set as equal, was not assessed in this study for two reasons. First, achieving the scalar invariance level is necessary for comparisons of latent factor means (Chen, 2008; Little, 1997), which is usually done for the purpose of research and clinical assessment. Second, the longitudinal designs in which the same individuals are measured on multiple occasions are prone to produce unequal residual variance, making it unrealistic to obtain residual invariance in the longitudinal research (A. D. Wu, Liu, Gadermann, & Zumbo, 2010). For example, Fokkema et al. (2013) reported that all but two items of the BDI-II exhibited unequal residual variance across two occasions.
To evaluate the invariance at each level, the chi-square difference test (using the DIFFTEST option in Mplus) was computed but not used, given that the chi-square test statistic is very sensitive to minor parameter changes in large samples. Instead, in addition to the relative fit indices in the first step, change in the CFI index (ΔCFI) was used to assess the nested models, with changes smaller than .01 signifying that the more restrictive model and the less restricted model were equivalent (Chen, 2007; Cheung & Rensvold, 2002).
Results
Factor Structure of the BDI-II
Before examining the LMI, a baseline model of the BDI-II data in each wave had to be established. Table 1 shows the fit indices of four factor structures of BDI-II in each wave of assessment. Overall, a single factor model provided the least adequate fit because no fit indices reached the cutoff values (except the data from Fall 2011). Compared with the other two models (i.e., a two-factor model and a second-order factor model with three first-order factors), the three-factor model yielded better fit indices in each wave of data, judging by its CFA and TLI values being greater than .95 and RMSEA value being less than .06 (except data from Spring 2012). Additionally, all item factor loadings loaded moderately to strongly (from .465 to .900, p < .001, shown in Table 2) on their corresponding factors on six occasions. Thus, the three-factor model was chosen as the baseline model for the assessment of LMI.
Model Fit Indices for the Fall and Spring Data Set From 2011 to 2014.
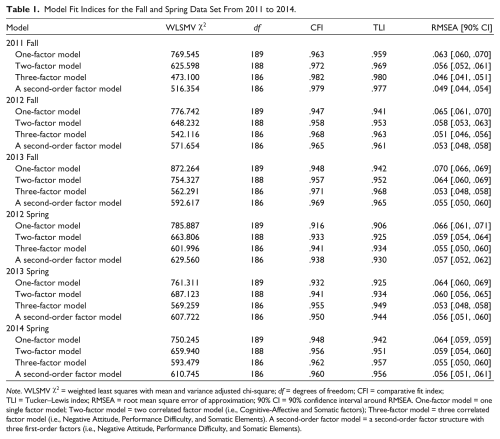
Note. WLSMV χ2 = weighted least squares with mean and variance adjusted chi-square; df = degrees of freedom; CFI = comparative fit index; TLI = Tucker–Lewis index; RMSEA = root mean square error of approximation; 90% CI = 90% confidence interval around RMSEA. One-factor model = one single factor model; Two-factor model = two correlated factor model (i.e., Cognitive-Affective and Somatic factors); Three-factor model = three correlated factor model (i.e., Negative Attitude, Performance Difficulty, and Somatic Elements). A second-order factor model = a second-order factor structure with three first-order factors (i.e., Negative Attitude, Performance Difficulty, and Somatic Elements).
Standardized Factor Loadings for the Baseline Models in All Occasions.
Longitudinal Measurement Invariance
The baseline model for the three-factor solution provided a good fit to the data for all waves, allowing for further examinations of LMI. To reduce the size of the model, LMI was evaluated separately for the Fall and Spring data sets. Table 3 reports the results of a series of the nested models in the Fall and Spring data sets. In the Fall and Spring data sets, the configural invariance model yielded good fits (CFI = .977, TLI = .975, RMSEA = .025 for Fall data set; CFI = .961, TLI = .957, RMSEA = .028 for Spring data set), providing support for the configural invariance of the baseline factor model. The analysis of the metric invariance model, where factor loadings were set to be equal across different occasions, produced good fit indices as well as negligible differences of CFI between configural and metric invariance models (ΔCFI = .003 for Fall data set; ΔCFI = .006 for Spring data set). These findings provided support for the metric invariance of the BDI-II across different occasions. The threshold invariance model was then tested by restricting all item thresholds to be equal across time. This model provided good fit indices as well as a nonsignificant change in CFI (ΔCFI = .004 for Fall data set; ΔCFI = .003 for Spring data set). Thus, the threshold invariance of the BDI-II held over 3 years . Additionally, the findings of threshold invariance obtained from the Fall data set were replicated with the Spring data sets.
Results of Assessing the Longitudinal Measurement Invariance of the Three-Factor Model.
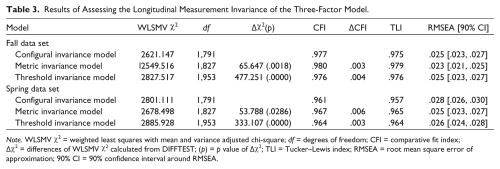
Note. WLSMV χ2 = weighted least squares with mean and variance adjusted chi-square; df = degrees of freedom; CFI = comparative fit index; Δχ2 = differences of WLSMV χ2 calculated from DIFFTEST; (p) = p value of Δχ2; TLI = Tucker–Lewis index; RMSEA = root mean square error of approximation; 90% CI = 90% confidence interval around RMSEA.
Table 4 reports the threshold estimates for the threshold invariance model. Because the threshold estimates in both data sets were similar, only the results of threshold estimates for the Fall data set are shown. The BDI-II uses a 4-point Likert-type scale with three threshold values in each item. Several aspects of the findings were noteworthy: (a) The threshold estimates in all of the items increased in a monotonic order. Threshold values delineating movement from 0 to 1 ranged from −0.611 to 1.757 (M = 0.64, SD = 0.65), thresholds describing movement from 1 to 2 ranged from 1.368 to 3.483 (M = 2.57, SD = 0.55), whereas thresholds delineating movement from 2 to 3 ranged from 2.350 to 4.712 (M = 3.64, SD = 0.65). (b) The interval between two successive thresholds generally decreased. The magnitudes between Thresholds 1 and 2 (M = 1.93, SD = 0.54) were larger than those between Thresholds 2 and 3 (M = 1.07, SD = 0.38). (c) The first threshold values (z scores) of two items (Item 16: sleeping pattern, Item 20: tiredness) were below 0, suggesting that an individual could move from responding 0 to responding 1 in these two items when his or her expected value of the latent variable was below the average.
Threshold Estimates for the Threshold Invariance Model.

Conclusion and Discussion
Factor Structure of the BDI-II
Most validation studies on the factor structure of the BDI-II have assumed classic test theory, assuming items as continuous responses (e.g., Beck et al., 1996; Storch, Roberti, & Roth, 2004; Whisman, Perez, & Ramel, 2000). These studies consistently confirmed the BDI-II as a multifactor structure, evaluating multiple domains of depressive symptoms. On the other hand, fewer studies have employed an item response theory approach, treating the BDI-II items as ordinal responses (e.g., Lerdal, Kottorp, Gay, Grov, & Lee, 2014; Siegert, Tennant, & Turner-Stokes, 2010; P.-C. Wu & Chang, 2008). These studies identify several BDI-II items that fail to fit to the Rasch model, suggesting the lack of unidimensionality in the BDI-II.
In line with the item response theory approach, this study applies categorical CFA (WLSMV estimator) to investigate the baseline model of the BDI-II. Results showed that the three-factor model represents the best model of the BDI-II for junior high school students over six occasions of assessment. These findings contribute to a clear understanding of the factor structure of the BDI-II using a categorical CFA.
Longitudinal Measurement Invariance of the BDI-II
LMI is an important issue that needs to be addressed for the validity of mean comparison in longitudinal research. The BDI-II is commonly used to examine longitudinal changes in depressive symptoms in health and counseling psychology, but not much literature has addressed the LMI of the BDI-II. To fulfill this need, this study tested the LMI of the BDI-II with early adolescents (junior high schools students). The results showed that 6.30% to 8.77% of early adolescents had BDI-II scores greater than 23 (a presumptive diagnosis of MDD) during their high school years. The prevalence of depression found in this study was higher than the 5.7% reported from a meta-analysis of adolescent depression (Costello, Erkanli, & Angold, 2006). This may be due to the adolescents in this study being evaluated on the basis of the BDI-II scores rather than by clinical diagnosis.
This study assessed the LMI of the BDI-II separately for the Fall and Spring data sets. Such analysis could reduce the size of the longitudinal model. It also allowed us to test whether the findings from the Fall data set were replicated in the Spring data set. The results showed that full scalar/threshold LMI was found in both Fall and Spring data sets, suggesting that the BDI-II measured the same construct over different occasions for junior high school students. This implies that the mean difference in depression scores on the BDI-II from any two occasions could be interpreted as true changes in the level of depression experienced.
The findings on LMI have significant implications for the longitudinal use of the BDI-II. For example, in the longitudinal models (e.g., latent growth model), the matrix of input becomes enormous with many occasions of assessments. To address this problem, item parceling is commonly used. The use of parcels as indicators, however, may mask the measurement invariance tests at item parcel level (Meade & Kroustalis, 2006). Thus, achieving full scalar LMI of the BDI-II at item level in the current study provides justification for the use of item parcel sets in the longitudinal models. Furthermore, the LMI of the BDI-II is particularly relevant for clinicians or researchers interested in the development of early adolescent depression. When using the BDI-II in early adolescents, they should be more confident that changes in BDI-II scores over time are indicative of true changes in depression levels, not an artifact of changes in the interpretation of items in the measure. More specifically, the BDI can be used to adequately assess the development of depression for early adolescents.
The Category Functions of the BDI-II
This study also explored the category functions of the BDI-II in terms of the pattern of threshold values. Results revealed that all threshold values monotonically increased, suggesting that categorical responses of the BDI-II were adequately used. However, this finding is inconsistent with those of Siegert et al. (2010) and P.-C. Wu and Chang (2008), who identified several disorder thresholds using Rasch analysis. Additionally, Items 16 (measuring sleeping patterns) and 20 (measuring tiredness) were found to be easier to endorse from Categories 0 to 1 since their first thresholds were relatively lower. This finding is consistent with P.-C. Wu and Chang’s (2008) research on older adolescents. Importantly, this study demonstrated the need to evaluate the BDI-II as a latent construct composed of categorical indicators to fully account for different levels of severity across items.
Limitations and Future Research
This study is the first attempt to investigate the LMI of the BDI-II over 3 years with Asian adolescents using categorical CFA. Although this study yielded several significant findings, some limitations should be noted and addressed in future research. First, the impact of violating LMI in interventional programs has been recognized, especially in counseling and clinical psychology (e.g., Ahmed, Mayo, Wood-Dauphinee, Hanley, & Cohen, 2004; King-Kallimanis, Oort, Nolte, Schwartz, & Sprangers, 2011; Oort, Visser, & Sprangers, 2005). In such studies, the participants were primarily clinical samples. There is little research on the LMI of the BDI-II with nonclinical samples. Although this study contributes to the understanding of LMI for the BDI-II with nonclinical subjects, the findings of the study are exploratory and may be valid only for junior high school students. More studies are needed to validate these findings in different populations.
The study used WLSMV estimator to evaluate the LMI of the BDI-II. In such analysis, it requires that the same number of response categories be chosen by subjects across different occasions of assessment. However, this requirement may not be met in a longitudinal study. For example, for some items, four response categories of the BDI-II are endorsed in one wave, but only three categories are used in the other wave. Under this situation, the WLSMV cannot calculate the threshold estimates based on the marginal distribution of frequencies of response categories. Although this problem did not occur in this study due to the use of large sample, the low frequency of the last response category for some items of the BDI-II might bias the threshold estimates. This problem may be addressed by collapsing the last two categories.
In conclusion, the BDI-II is one of major MDD diagnostic measures. Its longitudinal psychometric properties (e.g., longitudinal factor structure, LMI) are of importance in clinical practices and research. The findings of the current study not only provide a further understanding of longitudinal structure of the BDI-II with ordinal response options but also demonstrate that the BDI-II appears to be well suited for evaluating changes in depressive severity over time for nonclinical adolescents.
Footnotes
Declaration of Conflicting Interests
The author(s) declared no potential conflicts of interest with respect to the research, authorship, and/or publication of this article.
Funding
The author(s) disclosed receipt of the following financial support for the research, authorship, and/or publication of this article: This research was supported by a grant from the Ministry of Science and Technology of Taiwan (NSC 100-2410-H-153-003-MY3).