
Abstract
All measures of depression yield a global summary scale indicating the severity of depressive symptoms, implicitly conceptualized as a homogeneous construct. However, depression is a heterogeneous construct, with different presentations, subtypes, correlates, and responses to interventions. In response, the National Institute of Mental Health (NIMH) has suggested changes in the way depression is assessed, moving the focus to specific factors, such as cognitive, somatic, or affective symptoms. Still, there is little factor overlap between measures, and shared factors are weighted differently. To help fulfill NIMH’s strategic plan, this study used canonical correlation analysis (CCA) to explore shared latent variables and redundancy across the measures. It also analyzed the psychometric properties of factor-based subscales in the Beck Depression Inventory–2nd edition (BDI-II), Center for Epidemiologic Studies Depression scale (CES-D), Inventory for Depression and Anxiety Symptoms (IDAS), and Inventory of Depressive Symptomatology (IDS). Using a diverse sample of 218 students who reported at least mild depressive symptoms, this study found that the IDAS was best aligned with NIMH’s strategic plan; it has complete DSM-IV/DSM-5 symptom coverage and content-valid, psychometrically sound subscales. The BDI-II, CES-D, and IDS did not have consistent subscales, nor had incomplete or incongruent coverage of DSM criteria. Furthermore, CCA revealed low redundancy across measures (23% to 41% shared variance). These results suggest that different measures of depression do not measure the same construct. As a partial solution, empirical conversion tables were provided for researchers and clinicians to empirically compare total scores from different measures.
Although the phenomenon of depression has been documented for centuries (Burton, 1621/2001), its recognition as a disorder and delineation of specific, reliable criteria for its diagnosis has occurred relatively recently, culminating in the current DSM-5 diagnostic system. Diagnostic criteria for depression have shifted over time, leaving behind a series of measures based on slightly different symptom criteria and theoretical orientations. As subtypes have been identified, measurement has not kept up. In addition to the usual limitations of self-report measures, they may not use the same diagnostic criteria, they may use the same criteria without equal weighting, and they do not provide subscales that might capture important subtypes and other variability. This study examines the measurement characteristics of commonly used depression scales, specifically clarifying factor differences and psychometric properties among self-report measures, increasing communicability between them, and testing the feasibility of factor-based scales.
Heterogeneous Construct, Homogeneous Measures
In their strategic plan for mood disorders research, the National Institute of Mental Health (NIMH) identified the assessment of depression as one of the top priorities for research and criticized existing measures (NIMH, 2003):
The traditional assessment and diagnosis of depression has proved insensitive for the identification of likely respondersto existing psychosocial and psychopharmacological treatments . . . the most widely used instruments in clinical settings have generally failed to provide clear documentation of the symptoms experienced by individuals and instead typically have offered only global indices of depression. (p. 93)
In response to the preponderance of global indices, the NIMH urged that our current conceptualization be broken down to subtypes that can be reliably linked to different psychological, social, and genetic variables. This unpacking of depression symptom domains is critical as the NIMH has recently redirected funding for psychopathology research to Research Domain Criteria, which give priority to interrelationships across a broad range of domains and units of analysis (Sanislow et al., 2010). Breaking down the general construct and creating reliable and valid measures for these subconstructs, or content domains, will improve our ability to identify and detect subtypes empirically. Researchers have done so using their own measures or lists of diagnostic criteria (Blatt, 2004; Carragher, Adamson, Bunting, & McCann, 2009). Is it possible to do so using the depression symptoms scales currently in wide use?
Using Factors to Distinguish Content Domains
One method of creating subscales from measures of a general construct is factor analysis. Factor-derived scales show promise for depression for a number of reasons. First, groups may have different mean scores for factors. One study by Endler, Rutherford, and Denisoff (1999) found that Canadian men and women had different mean factor scores, with women scoring higher on cognitive and somatic factors of the Beck Depression Inventory (BDI). In another study (Yen, Robins, & Lin, 2000), the authors were able to differentiate Chinese inpatients and outpatients, as well as Chinese and American respondents using factor patterns on a Chinese translation of the Center for Epidemiologic Studies Depression scale (CES-D).
Second, factor-derived subscales may have unique relationships with other disorders and neuropsychological impairment. Mackinger and Svaldi (2004) found that only the cognitive factor of the BDI moderated memory performance in sleep apnea patients. Third, different factors may have unique predictive value for important outcomes. For example, one study that divided the Zung Self-Rating Depression Scale (SDS) into four factors found that somatic and well-being factors predicted survival in individuals with coronary heart disease (Barefoot et al., 2000). However, the relationship between survival and the somatic factor may be more indicative of general physical complaintsand less of a mood disorder. Another study found that a cognitive-mood factor longitudinally predicted comorbidity and negative response to treatment (Wardenaar, Giltay, van Veen, Zitman, & Penninx, 2012).
Finally, treatment may affect certain factors of depression, but not others. In a meta-analytic review, Faries et al. (2000) reported that factor-derived subscales of theclinician-rated Hamilton Rating Scale for Depression (HRSD) consistently outperformed the total score as a measure of change in studies of differences in antidepressant medication. The authors reported that studies that used only the global score would have to increase their sample size by one third in order to detect change that factors could detect.
Factors are also important because they allow us to determine how well scores from each measure can communicate with each other. Although there are a number of studies demonstrating high correlations between global depression symptom scores, few studies have explicitly compared content domains across measures, or examined how well specific symptom profiles on one scale correspond with those on another scale. This is of particular importance for clinicians and researchers who may want to compare their results with previous research studies. For example, a clinician may want to know if the decrease in depressive symptoms as measured by the BDI after the second week of a treatment is equivalent to the decrease that treatment research studies have reported using the Inventory of Depressive Symptomatology (IDS).
Some researchers have discussed whether the general or specific content domains should be interpreted. In response, bifactor measurement models that incorporate latent structure variance from general depression and specific content domains have been proposed (Brouwer, Meijer, & Zevalkink, 2013; Reise, Moore, & Haviland, 2010). Although there is some debate with regard to the ease of interpretation and clinical utility of such models (Reise et al., 2010; Vanheule, Desmet, Groenvynck, Rosseel, & Fontaine, 2008), results from these promising models suggest that subscales not be interpreted. However, few studies have empirically tested the performance of subscales. Those that have done so show promising findings (Barefoot et al., 2000; Endler et al., 1999; Faries et al., 2000; Mackinger & Svaldi, 2004; Wardenaar et al., 2012; Yen et al., 2000).
In summary, factors distinguish content domains and have conceptual and empirical importance for our understanding of depression. However, as NIMH’s report suggests, researchers and clinicians overlook these aspects of measurement. Thus, psychologists may be unaware of what components of depression a measure emphasizes and whether different measures of depression tap the same components equivalently.
Absence of Cross-Measure Equivalence
Although there is a multitude of depression measures, research has demonstrated that they do not measure depression equivalently. Shafer (2006) conducted a meta-analysis that compared factors in different measures, which found less overlap than expected. The author synthesized multiple factor analytic studies of four measures of depression: the BDI, CES-D, HRSD, and SDS; only two of seven reliable factors were shared between all four measures: negative affect and somatic symptoms.
When measures do tap into the same domains, they may not give them the same weight. For example, one measure may have two items in the somatic domain, whereas another measure will have seven items. Although this may not be surprising when one considers that measures were developed with different theoretical orientations, what is surprising is that measures of depression are often treated as equivalent. This disregard of content validity can lead to serious problems, such as overrepresenting, omitting, or underrepresenting some construct facets or including irrelevant variance due to other constructs (Haynes, Richard, & Kubany, 1995). Given this varied coverage, it is important that psychologists agree on standard criteria that measures should reflect in item content.
Clearly, measures of depression need more overlap and a standard set of symptoms by which to evaluate their content validity. Many assert that the current standard for depression measures should be DSM-5 symptoms—which are the same as DSM-IV (American Psychiatric Association [APA], 2013)—but incorporating a dimensional classification system to facilitate severity assessment (Joiner, Walker, Pettit, Perez, & Cukrowicz, 2005; Klein, 2008; Watson, 2005). Although self-report measures of depressive symptomatology are not meant to be diagnostic tools, they should be informed by current nosological criteria, especially because they are often used to screen for possible depression and track changes in previously diagnosed depression. Despite this, a content validity study concluded that the BDI, HRSD, and IDS did not assess DSM-IV core and subtype criteria equally (Gullion & Rush, 1998).
Evidence of Measure Confusion
Although the literature previously reviewed suggests that giving multiple measures of depression to the same individuals may lead to divergent results, few studies have documented the actual occurrence of such findings. We highlight some clinical trials that have incidentally documented differential results with depression measures.
Muñoz, Ying, Bernal, and Pérez-Stable (1995) tested the effect of a preventative intervention on low-income minorities. After 6- and 12-month follow ups, the researchers found that there was a statistically significant reduction in depressive symptoms when measured with the BDI, but not when measured with the CES-D (Muñoz et al., 1995). Another preventative intervention study with college freshman found that the intervention had significant effects when using the BDI, but not when using the HRSD (Seligman, Schulman, DeRubeis, & Hollon, 1999). Both interventions used cognitive techniques, which may account for the significant findings using the BDI, which weights cognitive symptoms heavily. Had the studies used factors for the other measures, they may have found significant differences on cognitive factors. How many studies using only one assessment instrument have yielded nonsignificant results because they did not match that instrument to their intervention? Perhaps an assumption that measures assess depression equivalently has led some researchers to disregard content validity issues when selecting measures to document intervention change. When assessment instruments are not so selected, researchers run the risk of erroneous null results.
Goals of Present Study
We assert that the conceptualization and measurement of depression should move toward use of factors that measure its content domains. The purpose of this study is to increase our understanding of different measures of depression. In line with NIMH objectives, this study aims to determine the feasibility of using factor-based subscale scores on several widely used measures of depression. Although some factors across measures overlap, not all do, nor has their relationship been described before in published research. This study created subscales for the BDI-II, CES-D, Inventory for Depression and Anxiety Symptoms (IDAS), and IDS based on previously reported factor structures for each measure, calculated psychometric characteristics, and explored how they relate to each other. The first two are included because of their canonical status and the last two are included because of their promise described below.
Given that different measures of depression have different factors, another aim of this study was to facilitate communicability among them. Although correlations between measure summary scores and factor analyses have been used to describe relationships between and structure within measures respectively, this study used canonical correlation analyses (CCA) to provide a more complete, subscale-level picture of the relationships between two groups of variables and describe the relationship between pairs of measures. Previously published studies have either described correlations between the general summary score for each measure or looked at factor analyses within each measure. Based on these separate techniques, the conclusions have been: these measures are highly related, and these measures are meaningfully distinct. CCA provides a more complete picture, inasmuch as measures that are more related to each other will have a higher redundancy statistic, or more shared variance.
In the spirit of acknowledging differences between measures and increasing communicability between them, another goal is to create conversion tables for summary scores. Conversion tables will allow clinicians and researchers to accurately compare their results using one measure with previous literature that used another measure. For example, what score on the IDS corresponds to a score of a 24 on the BDI-II?
Method
Sample
Since most measures were designed for use with symptomatic individuals, a large sample of undergraduates was screened to select those with at least mild depressivesymptoms. Two-hundred and forty-eight undergraduates had a score above 5 (cutoff for mild depression) on the Patient Health Questionnaire depression screener (PHQ-9; Kroenke & Spitzer, 2002). Of those 248, 30 individuals did not complete all measures or were careless responders. Careless responding was determined by a series of three validity questions (e.g., “Have you answered questions about sleep problems in the past few pages?”) or endorsing only one response type (e.g., all 3s) for several measures. This screening left a final sample of 218 symptomatic undergraduates.
The sample had an average age of 20.2 years (SD = 2.7) and was mostly women (74.8%). The ethnic breakdown was as follows: 58.1% White, 17.9% Hispanic, 12.6% Black, 11% Asian, and 0.4% other. With regard to marital status, 74.8% identified as single, 19.9% were in a committed relationship, and 4.5% were married. Nineteen percent of the sample (n = 41) self-reported a past diagnosisof a psychiatric disorder, of which 76% were mood disorders (n = 31).
Measures
Patient Health Questionnaire–Depression Screener
The PHQ-9 is a nine-item screener derived from the full PHQ (Kroenke & Spitzer, 2002). The PHQ is a self-report version of the Primary Care Evaluation of Mental Disorders (PRIME-MD), which measures symptoms for five common DSM-IV disorders (Nezu, Nezu, Friedman, & Lee, 2008). The PHQ-9 has a question for each DSM symptom for a depressive episode; total scores can range from 0 to 27, with the following suggested cutoffs: 1 to 4, none; 5 to 9, mild; 10 to 14, moderate; 15 to 19, moderately severe; and 20 to 27, severe (Kroenke & Spitzer, 2002). With regard to internal consistency, test–retest reliability, and convergent validity, the PHQ-9 has strong psychometric characteristics (Kroenke & Spitzer, 2002; Kroenke, Spitzer, & Williams, 2001; Kroenke, Spitzer, Williams, & Lowe, 2010). Research support a single-factor latent structure (Merz, Malcarne, Roesch, Riley, & Sadler, 2011).
Beck Depression Inventory–Second Edition
The BDI was originally developed in 1961 and revised in 1996 to improve psychometric characteristics and reflect DSM-IV depression criteria (Beck, Steer, & Brown, 1996). It was based on Beck’s cognitive theory of depression, which posits the main etiology of major depressive disorder to be overly negative construals. The BDI-II consists of 21 questions with a possible range of 0 to 63 that is organized by the following cutoffs: 0 to 13, minimally depressed; 14 to 19, mildly depressed; 20 to 28, moderately depressed; and 29 to 63, severely depressed (Rush, First, & Blacker, 2008). The BDI-II has demonstrated very high internal consistency, convergent and discriminant validity in multiple populations (Beck et al., 1996; Dozois, Dobson, & Ahnberg, 1998; Osman et al., 1997). The BDI-II manual reported a two-factor structure (cognitive-affective and somatic-vegetative) in both their samples through the use of exploratory factor analyses (Beck et al., 1996). There has been considerable debate surrounding the latent structure with research in different populations and languages (Brouwer et al., 2013; Vanheule et al., 2008). We chose to the use manual’s reported factor structure because our sample is also student-based and because the manual’s structure is the reference point for all subsequent variations.
Center for Epidemiologic Studies–Depression Scale
The CES-D was published by Radloff in 1977 and based on previous measures of depression such as the BDI, MMPI Depression Scale, and SDS. The intent of the scale was to measure depressive symptoms in nonclinical populations for epidemiological studies. It consists of 20 items with a total score range from 0 to 60. Shean and Baldwin (2008) found that cutoff scores of 16 had sensitivity and specificity rates of 86.7 and 76.6 for identifying depressed individuals, whereas a cutoff score of 21 had a sensitivity and specificity rate of 73 and 96.1. The CES-D has been validated with several ethnic groups and demonstrated good internal consistency, test–retest reliability, and convergent and discriminant validity (Hiott, Grzywacz, Arcury, & Quandt, 2006; Radloff, 1977; Shean & Baldwin, 2008). Radloff (1977) reported four factors for the scale: depressed affect, positive affect, somatic symptoms, and interpersonal problems. A meta-analysis has confirmed this factor structure as accurately representing the scale’s latent structure (Shafer, 2006).
Inventory for Depression and Anxiety Symptoms
The IDAS was developed to address the conceptualization of depression as a homogeneous construct (Watson et al., 2007). Instead of revamping older, commonly used questionnaires, the authors decided to create a new measure that was multidimensional in design. The IDAS consists of 64 items that are part of two general scales and 10 specific subscales. The two general scales are a 20-item general depression scale, which is similar to more traditional depression scales, and a 10-item dysphoria scale, which focuses on the cognitive and emotional symptoms of depression. There are no cutoff scores indicating severity categories. The specific subscales are the following: well-being, panic, lassitude, insomnia, suicidality, social anxiety, ill temper, traumatic intrusions, appetite loss, and appetite gain. The scales have demonstrated strong internal consistency, test–retest reliability, convergent and discriminant validity in different populations (Watson et al., 2007).
Inventory of Depressive Symptomatology
The IDS (Rush, Gullion, Basco, & Jarrett, 1996) was developed to measure symptoms for DSM depression and subtypes. The self-report version was used for this study and consists of 30 items with a total score that can range from 0 to 84, with the following cutoff score suggested: 0 to 11 normal; 12 to 23 mildly depressed; 24 to 36 moderately depressed; 37 to 46 moderate to severe depression; and 47 to 84 severely depressed (Rush et al., 2008). Different studies have assessed the internal consistency, test–retest reliability, convergent and discriminant validity of the IDS in different settings (González, Boals, Jenkins, Schuler, & Taylor, 2013; Rush et al., 2006; Vittengl, Clark, & Jarrett, 2005). A three-factor structure (cognitive/mood, anxiety/arousal, and sleep complaints) has support for the IDS (González et al., 2013; Rush et al., 1996).
Procedure
The study was approved by an institutional review board. Participants were given course credit as compensation for participation. Consenting participants completed a battery of computerized measures including demographic information, PHQ-9, BDI-II, CES-D, IDAS, and IDS. These measures were counterbalanced, and it generally took 45 minutes to complete the battery. This study only examined participants with a PHQ-9 score at or above 5.
Statistical Analyses
Unweighted factor-based subscales were calculated by summing the scores on individual items that have previously been linked to a factor in the literature, and a correlation matrix including all subscales was created. Correlations were compared using an effect size difference to determine if the difference was small (.10), medium (.30), or large (.50), paralleling Cohen’s (1992) use of these descriptors for effect sizes of individual correlations.
Psychometric statistics were calculated for each measure and factor-based subscales. To compare measures using item-level responses, CCA was used. Essentially, CCA determines how many latent variables (called variates) are shared across two groups of variables and determines how much variance each variate accounts for in the groups of variables.
One statistic that CCA yields is the redundancy statistic. This redundancy statistic reflects the amount of variance accounted for in one group of variables by the latent variables in another group of variables. Although measures of depression have strong correlations by Cohen’s (1992) standards, they do not necessarily have overlapping factors. The use of CCA may consolidate these seemingly discrepant findings to clarify the relationship between measures of depression and indicate whether we should view them as measuring the same construct, or as measuring subtly different constructs. To date, only one study has used CCA to look empirically at the overlap between measures of depression (Suzuki, Yoshino, Tsukamoto, & Abe, 1995), and only did so with Japanese-language measures designed for the study. If there are large differences in mutual variance accounted for by measures (low redundancy), this would lend further support to NIMH’s recommendation to focus on subscale scores instead of general scores.
Regression methods were used to provide conversion tables between different measures of depression in symptomatic student populations. Using the obtained regression coefficient and constant, different formulas are provided for each pair of scales. For example, if a clinician wanted to see if their client’s current score on the IDS matches a study that measured depression with the CES-D, they can insert their client’s IDS score into the equation provided and obtain the equivalent CES-D score.
Results
Descriptives
Scales and subscales were screened for outliers, normality, linearity, and heteroscedasticity and determined to be sufficiently normal. Means and internal consistency statistics are summarized in Tables 1 and 2. According to conventions, “adequate” Cronbach’s alpha would be considered to be around .70, whereas “very good” would be around .80, and “excellent” around .90 (Kline, 2010). Most values were more than adequate. The exceptions were the Interpersonal subscale from the CES-D and the Sleep subscale from the IDS, which were excluded from subsequent analyses. The BDI-II Somatic-Vegetative, CES-D Somatic, and IDAS Lassitude subscales were at the cusp of adequacy (<.70). Concerns of multicolinearity among subscales derived from the same scale were belied by correlation coefficients below .70.
Correlations Among Summary Scales.
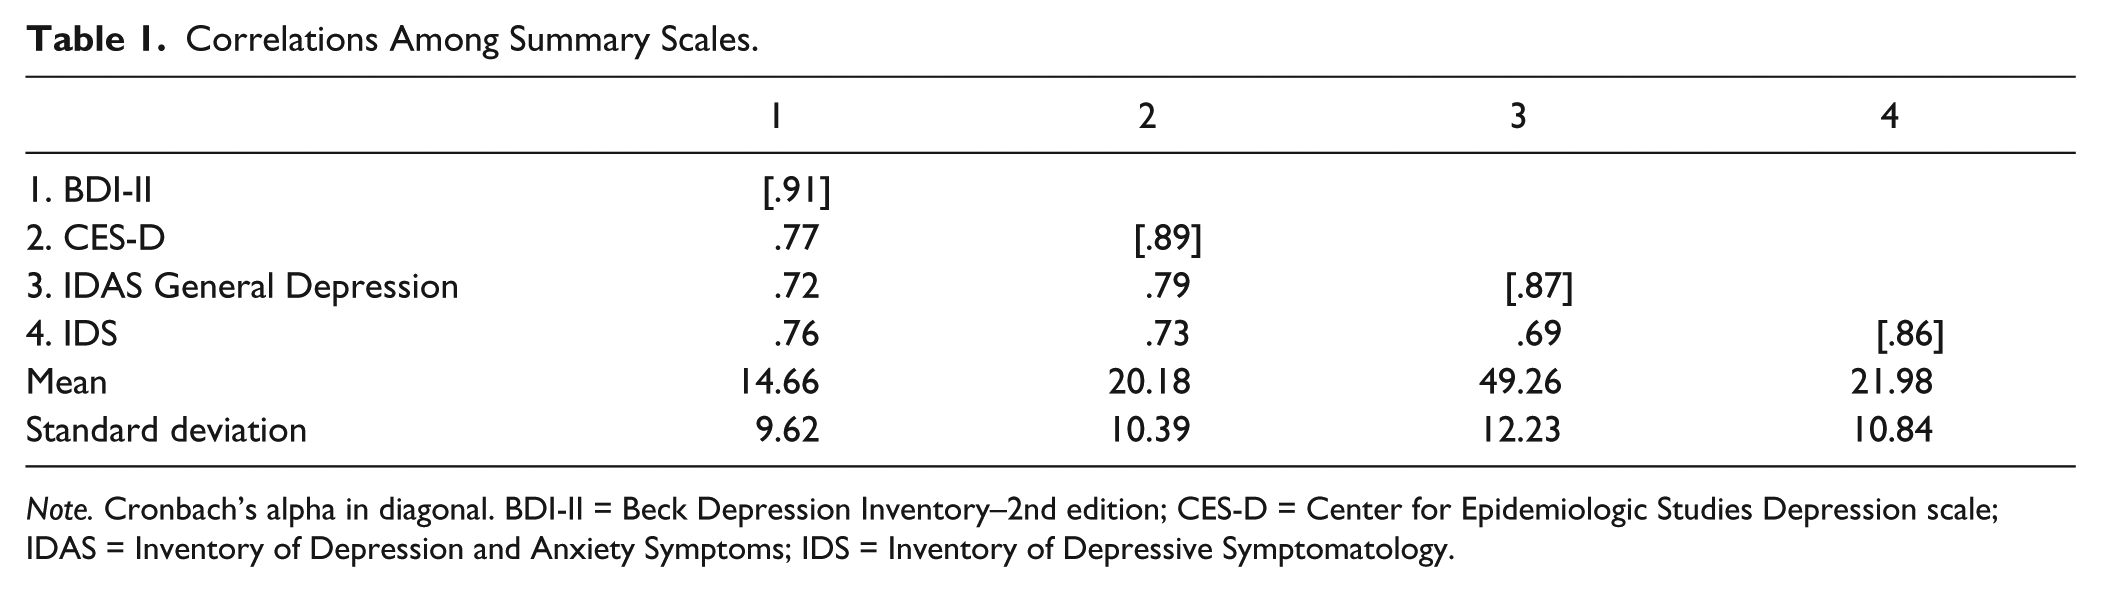
Note. Cronbach’s alpha in diagonal. BDI-II = Beck Depression Inventory–2nd edition; CES-D = Center for Epidemiologic Studies Depression scale; IDAS = Inventory of Depression and Anxiety Symptoms; IDS = Inventory of Depressive Symptomatology.
Correlations Among Subscales.
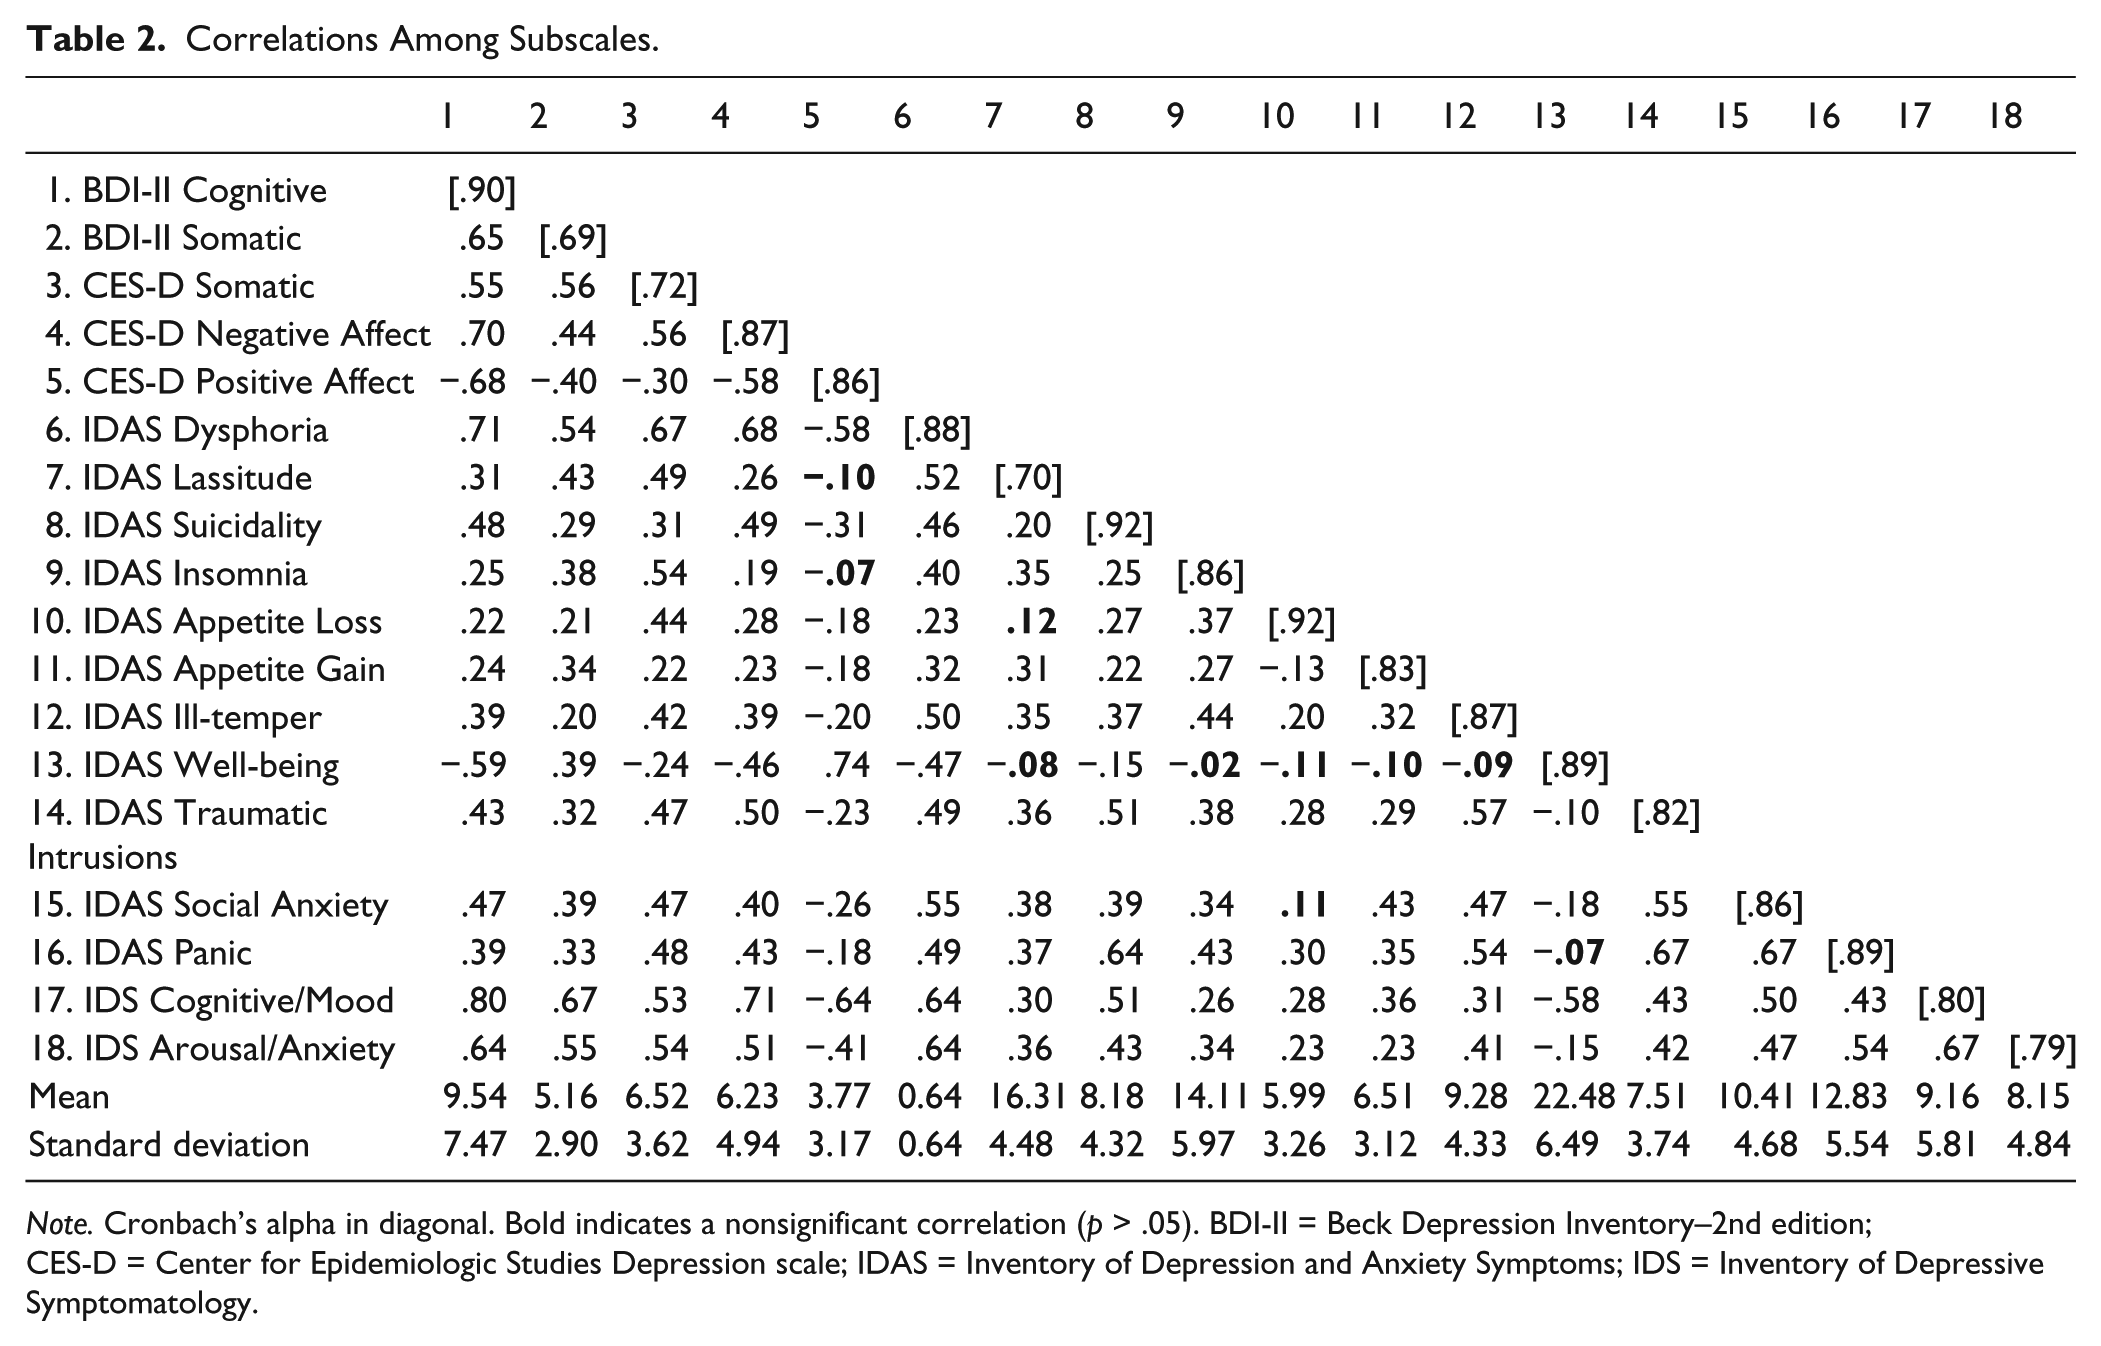
Note. Cronbach’s alpha in diagonal. Bold indicates a nonsignificant correlation (p > .05). BDI-II = Beck Depression Inventory–2nd edition; CES-D = Center for Epidemiologic Studies Depression scale; IDAS = Inventory of Depression and Anxiety Symptoms; IDS = Inventory of Depressive Symptomatology.
Correlations
To approximate convergent and discriminant validity, interscale relationships were calculated. Convergent validity was operationalized as a medium or large effect size correlation with a like subscale. Discriminant validity was at least a small effect size difference in correlation. The correlations are reported in Table 2.
Generally, all four scales had a cognitive/affective scale and these all had large correlations with other like scales, including the BDI-II Cognitive-Affective, CES-D Negative Affect, CES-D Positive Affect, IDS Cognitive/Mood, and IDAS Dysphoria and Suicidality subscales. These correlations were larger than correlations with other scales, indicating adequate discriminant validity. Generally, all four scales had a somatic/vegetative subscale, namely, BDI-II Somatic-Vegetative, CES-D Somatic, IDS Anxiety/Arousal, and IDAS Lassitude, Insomnia, and Ill-Temper, and these converged with generally large effect sizes. However, these scales also tended to have large relationships with cognitive or affective scales, suggesting poor discriminant validity. The IDAS Appetite change scales had a small negative relationship with each other, but had different-sized positive relationships with other subscales.
Canonical Correlation Analyses
Another psychometric goal was to use CCA to explore the relationships among measures and shared latent variables. Redundancy statistics were interpreted as indicators of variance explained by shared latent variables. All measures of depression had a statistically large amount of redundancy (23% to 41% redundancy), when considering all variates. Redundancy statistics and canonical variates for pairs of measures are reported in Supplementary Tables 1 to 4 (available online at http://asmnt.sagepub.com/content/by/supplemental-data). These supplementary tables report number of variates extracted from measure pairs, item correlations with variates, explained variance, and redundancy. To facilitate reading and interpretation, only loadings >.30 are reported. Of all the measures, the IDS had the lowest redundancy with other measures (23% to 28% redundancy). This indicates that the IDS, more than other measures, assesses distinct constructs not assessed by other measures. The number of canonical variates ranged from 4 to 8. In all cases, the first canonical variate was reflective of a general depression latent variable, although sleep items tended not to group to this variate. When only the first general depression variate was considered, redundancy was even lower (15% to 28% redundancy). Subsequent variates tended to center around specific DSM symptoms, such as mood, sleep, or concentration difficulties.
Communicative Goals
Another set of analyses focused on comparing different measures at a summary score level to allow researchers to empirically compare summary scales. Regression analyses are summarized in Table 3. All relationships were statistically significant. When the CES-D was predicting the BDI-II, a probability plot of residuals indicated that the relationship may not be exactly linear. A quadratic regression model was fitted, and it explained a statistically significant amount of variance beyond the original model. The same occurred for all scales that the IDAS was predicting, as well as when the IDS predicted BDI-II scores. Although the quadratic models explained statistically more variance, the practical change was negligible (ΔR2 = .01-.02). Given the complexity, only linear equations are included in Table 3. Table 4 provides regression equations for clinicians and researchers to use to predict an individual score and obtain a 95% confidence interval. This information provides an empirically informed method of estimating individual scores from other measures of depression instead of assuming that different measures are equivalent.
Results of Analyses for Predicting Scales Based on Other-Scale Scores.

Note. b1 = unstandardized polynomial regression coefficient; b2 = unstandardized regression coefficient; β = standardized regression coefficient; SE = standard error of estimate; BDI-II = Beck Depression Inventory–2nd edition; CES-D = Center for Epidemiologic Studies Depression scale; IDS = Inventory of Depressive Symptomatology; IDAS = Inventory of Depression and Anxiety Symptoms.
Regression Equations for Predicting Scales Based on Other-Scale Scores.
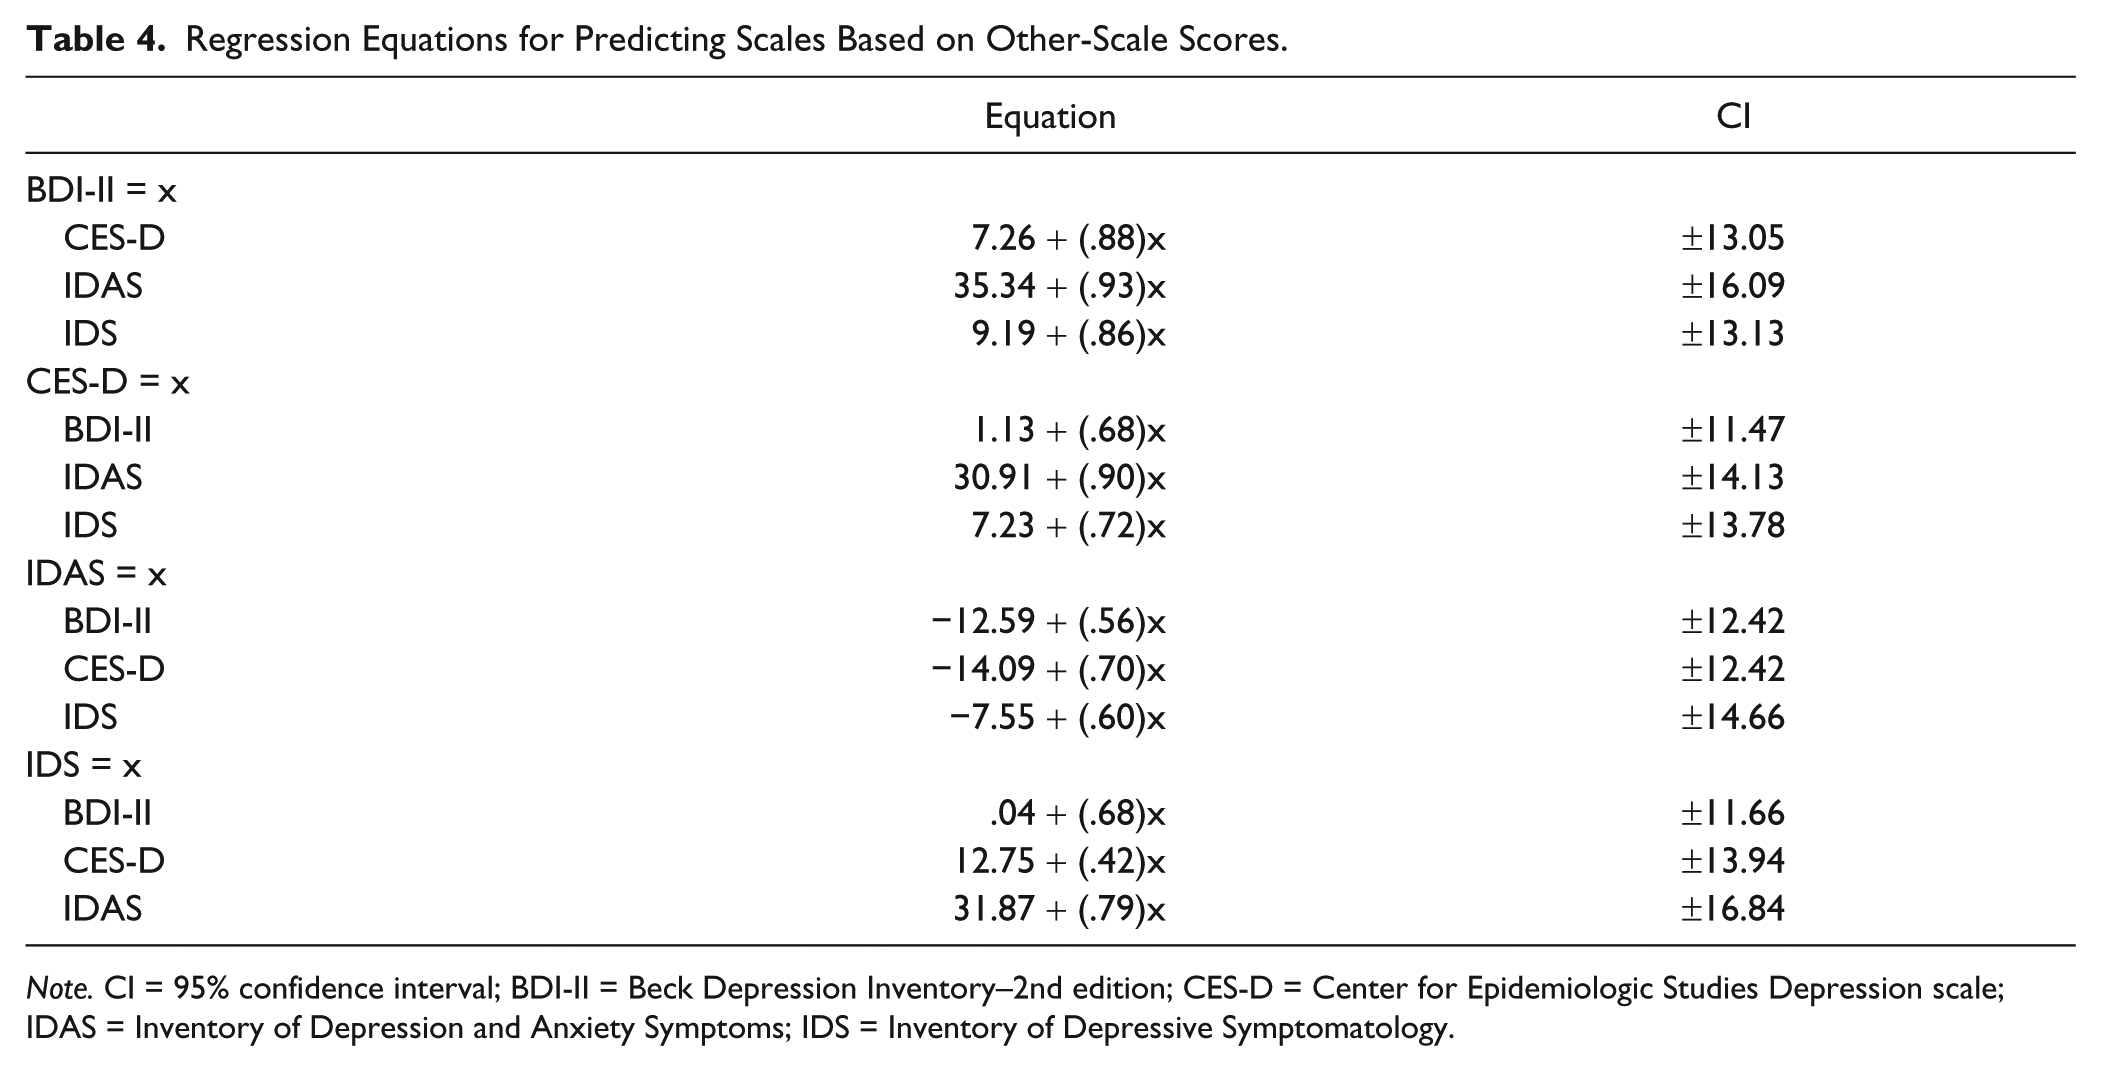
Note. CI = 95% confidence interval; BDI-II = Beck Depression Inventory–2nd edition; CES-D = Center for Epidemiologic Studies Depression scale; IDAS = Inventory of Depression and Anxiety Symptoms; IDS = Inventory of Depressive Symptomatology.
Discussion
The purpose of this study was to (a) determine whether various depression scale factors have adequate psychometric characteristics as subscales in a sample of symptomatic individuals, (b) use CCA to better describe the redundancy between measures based on shared latent variables, and (c) provide empirical conversion tables for total scores. The results demonstrated that cognitive subscales tend to be psychometrically sound, but that somatic scales tend to lack discriminant validity. Further analysis with CCA indicated that there was relatively little shared variance between measures based on overlapping latent variables (23% to 41%). These results were surprising given that regression with general summary scores explained more variance (47% to 63%). The provided regression tables also showed that although there is a positive relationship between total scores, specific individuals may score higher on onemeasure than another because of differences in the latent constructs being measured.
These findings have implications for the way clinicians and researchers measure depressive symptoms as well as the assumptions of cross-measure equivalence. The field should be cautious when selecting measures of depressive symptoms and carefully weigh the focus of their studywith the different measure characteristics highlighted inthis study. This careful consideration can yield a finer grained image of the currently heterogeneous construct of depression.
Summary and Recommendations
Based on the above information, it is recommended that researchers consider the IDAS. The 64-item scale provides a general depression scale that overlaps with other measures of depression. However, it also has additional theoretically based scales—most with adequate psychometrics—that measure components of depression. Furthermore, it measures all symptoms required for a DSM-IV/DSM-5 diagnosis of depression and is freely available. If a researcher plans to measure components of depression using other measures such as the BDI-II, CES-D, or IDS, a combined approach is recommended. This ensures adequate coverage of DSM-IV/DSM-5 symptoms and content domains. For example, the CES-D’s subscales appear to be consistent, which can be paired with the PHQ-9 to ensure cost-effective coverage of DSM symptoms. New research has employed item response theory to create subscales in the IDS, which can ensure measurement of content domains as well as DSM symptoms (González et al., 2013; Wardenaar et al., 2012).
Canonical Correlation Analysis
The results of CCA indicate that not all depression scales are created equal; some have more overlap with each other than others. In general, the shared latent variables of overall measures explained much less variance than would be expected based on theory (since these measures are supposed to measure the same construct) and on correlations of summary scores (with a typical correlation of .70; explained variance should be around 50%). Only 23% to 41% of the variance was explained by shared latent constructs in measures. The CES-D and IDAS General Depression scales had the most shared variance, meaning that they largely tapped similar latent constructs. The IDS tended to have the least shared variance across measures; it had a mean redundancy statistic of .25, meaning that it tapped latent constructs that other scales did not assess. This is not surprising when observing specific item content; there are four items related to sleep and others related to physical pain, general anxiety, and bowel movements. This information may be clinically useful, but does not reflect depression, per se.
The implications of these findings are that general summary scores may be adequate, but not the most effective use of these measures because they may be measuring subtly different constructs (e.g., the BDI-II having seven items asking about cognitions, or IDS having four items asking about sleep). Although a single general depression variate is present, it does not seem to explain all the variance in the overall measures because of the number of statistically significant variates extracted. These numerous variates tended to reflect diagnostic symptoms and varied in size depending on the number of items each measure had for that symptom. Therefore, we recommend considering factor-based subscales for more precise measurement of depressive symptoms. Considering both general summary scores and specific content domains is consistent with nested or bifactor measurement models (Reise et al., 2010).
An additional reason why the summary scores had less shared variance than expected is that there are slight differences, such as wording of the questions, response formats, and the scale used (e.g., 0-3 or 1-7). Although this should introduce systematic method error in measurement when comparing scores, it should not result in such stark differences in shared variance. Regardless, this explanation also raises questions about the assumption that different overall measures equivalently assess the same construct.
Conversion Tables
The conversion tables listed are important for a number of reasons. First, although this study highlights the importance of considering subscales and content domains, research supports the use of general summary scores. Second, instead of assuming that categories within distributions are equivalent across measures, this study shows that the same individuals can be labeled as having different levels of severity depending on the measure they are administered. For example, an individual scoring a 10 on the BDI-II is considered “minimally depressed.” However, this same individual is likely to score higher on the CES-D, estimated as 16. This score is past the suggested cut-score of 16 for accurately classifying major depression (Shean & Baldwin, 2008). Using the regression formulas in Table 4, a score of 16 on the CES-D is translated to a score of 12 on the BDI-II, which is within the same severity category as the original score of 10. As another example, an individual scoring 6 on the BDI-II would be labeled as minimally depressed, but that same individual would score around 14 on the IDS, which would label them as mildly depressed.
One may notice that there is not equivalent back-translation of scores (i.e., the BDI-II score of 10 becomes 12 when converting back from the predicted CES-D score). This is because there is greater error in regression for high or low values. The error of prediction decreases asymptotically (and accuracy of score back-translation increases) as the score approaches the mean. When using this conversion table, individuals should exercise more interpretive caution when the scores are significantly different from the means reported in Tables 1 and 2.
Given that each scale appears to assess somewhat different latent and manifest content, these conversion tables are important for intervention research where remission of symptoms is assessed with self-report measures. In some cases individuals may be labeled as likely having MDD with one measure (e.g., CES-D), when they are labeled as having minimal symptoms using another measure (e.g., BDI-II). This may lead to bias in the results of interventions and influence their implementation and funding of further research. Thus, it is of the utmost importance to take into account subtle differences between measures of depression.
Limitations and Future Research
This study has limitations that need to be addressed. One limitation is that it used a collegiate sample. Although all individuals included in this study were symptomatic (screened for mild depression with the PHQ-9), there are still environmental circumstances and lifestyles that set college students apart from other groups. One factor that can influence studies of depression scale validity is erratic sleep patterns that can influence the error variance associated with responses to sleep items. This was reflected in CCA results where sleep items did not group together with the general depression variates.
Another sample-based limitation is the fact that the sample was mostly women. Past research suggests that gender differences are in prevalence of depression and overall severity, not symptom profiles (Nolen-Hoeksema & Hilt, 2009; Watson et al., 2007). However, since most research has not focused on symptom profiles, there may be undetected gender differences not identified in this sample. A third limitation is the relative nature of the scales used to approximate convergent and discriminant validity. There are no established scales for measuring the cognitive, affective, or performance aspects of depression. Although the approach used was not ideal, it provides an initial empirical base for future research on components of depression.
With regard to recommendations, researchers should carefully consider the depression measures that they use. Future research may contribute to the literature by suggesting modifications to factor-based subscales that improve their psychometric characteristics. That was beyond the scope of this study, which had a more descriptive focus. Future research can extend these results to clinical andcommunity samples and validate conversion tables for different populations. Furthermore, unpacking depression symptom domains can facilitate new insights as part of Research Domain Criteria. Informed and detailed assessment of depressive symptoms can improve our understanding of this heterogeneous disorder and improve current interventions to reduce the incidence of MDD for future generations.
Footnotes
Declaration of Conflicting Interests
The authors declared no potential conflicts of interest with respect to the research, authorship, and/or publication of this article.
Funding
The authors received no financial support for the research, authorship, and/or publication of this article.
References
Supplementary Material
Please find the following supplemental material available below.
For Open Access articles published under a Creative Commons License, all supplemental material carries the same license as the article it is associated with.
For non-Open Access articles published, all supplemental material carries a non-exclusive license, and permission requests for re-use of supplemental material or any part of supplemental material shall be sent directly to the copyright owner as specified in the copyright notice associated with the article.