
Abstract
Washington state requires school districts to file court petitions on students with excessive unexcused absences resulting in thousands of youth becoming involved in the court system. Once in the system, decisions are made about the level of risk each youth has for maladaptive behaviors. The Washington Assessment of the Risks and Needs of Students was created to assist youth service providers, courts, and schools to identify an adolescent’s needs for social, emotional, or educational intervention. However, the profile-based decisions advocated for by test developers lack empirical justification. This study employed latent profile analysis to examine risk and needs profiles of adolescents based on the Washington Assessment of the Risks and Needs of Students assessment. Profiles were developed to aid understanding of behaviors associated with school truancy, and examined across outcome variables (e.g., suspensions, arrests) to evaluate evidence in support of predictive claims. Results suggest distinct profiles that differ on important outcomes.
One of the great challenges facing juvenile courts and school districts alike is how best to serve youth who are experiencing multiple behavioral and emotional problems and for whom school attendance and achievement are low (Baker, Sigmon, & Nugent, 2001; Belfield & Levin, 2007). There is a strong association between school failure and juvenile justice system involvement, especially for youth struggling with substance abuse, psychiatric disorders, and truancy (Hallfors et al., 2002; Henry & Huizinga, 2007; Henry, Thornberry, & Huizinga, 2009). This association has been referred to as a pernicious “school to prison pipeline” for youth (especially individuals of color) struggling with psychiatric and substance abuse disorders (American Academy of Pediatrics, 2003; American Civil Liberties Union, n.d.). Further exacerbating the issue, less than 10% of youth needing mental health services actually receive assistance (Costello, Egger, & Angold, 2005). Often, there is a failure to identify problems and intervene on a student’s behalf in a timely and developmentally appropriate manner. These critiques raise questions about what, in fact, constitute timely and developmentally appropriate interventions for an issue such as truant behavior, especially in the absence of empirical links to underlying problems (Cook, Hausman, Jensen-Doss, & Hawley, 2015). There is a lack of clarity, for instance, concerning under what conditions detention should be used as a response to truancy. Such decisions may best be informed by multiple sources of evidence, including standardized assessments.
Effective intervention for truant youth requires a multisystemic approach, as truancy may be linked to multidimensional problems such as substance use, family breakdown, and the posttraumatic sequelae of adverse childhood experiences (Dembo & Gulledge, 2009; Maynard, McCrea, Pigott, & Kelly, 2013). Any intervention that seeks to address a process as complex as the cascade from truancy, to school failure, to social and occupational failure, and potentially prison, must also involve timely and accurate assessment of the individual and social components that are likely to be causal in this progression (Strand & Lovrich, 2014). In that regard, to increase the probability of positive outcomes interventions must be informed by (a) effective assessment of potentially causal factors; (b) intervention that takes these factors into account and that is strength-based, multisystemic, and built on a relational foundation; and (c) follow-up that is informed by data relevant to each student’s response-to-intervention. From this list, it is evident that a bedrock of best practices is sound and trustworthy assessments which capture the factors truant youth must overcome to avoid negative long-term outcomes. Moreover, sound and trustworthy assessment must be meaningful and easy to integrate into practice (Cook et al., 2015).
Toward this end, the aim of the present study was to evaluate validity claims about the Washington Assessment of the Risks and Needs of Students (WARNS) to support interpretations of scores about adolescent risks and needs. Specifically, the study sought to identify latent profiles of students who had been referred to the courts for excessive unexcused absences from school. Such profiles may be useful for understanding how students who are at risk for negative outcomes present across a variety of risk and needs factors. The shape and level of profile scores can then be used to inform the level and type of intervention needed to support specific groups of youth. Robust support for the latent profiles in terms of model fit to adolescents’ responses would allow the clinician or practitioner to intervene effectively and confidently. Further analysis explored how identified profiles relate to important outcomes, including arrests and school suspensions. High levels of associations between the profiles and these outcomes using the hypothesized method would support the predictive utility of the risk–needs assessment.
State-Level Context
As many as 15,000 students may enter into the Washington state court system each year as a result of a requirement for school districts to file court petitions on students with excessive unexcused absences or truancy (Coker & McCurley, 2015). The WARNS was constructed to provide youth service providers, courts, and schools accurate information about the risk a youth has for maladaptive behaviors and their needs for support (George et al., 2015). Broad domains associated with maladaptive behaviors (e.g., substance abuse) are used to classify an individual as having an elevated risk for said behaviors. This classification of behaviors using profiles across broad domains aligns with the dominant approach to the assessment of children, which typically has identified two dimensions of pathology—externalizing and internalizing problems (Beauchaine, 2015; Downs, Strand, Heinrichs, & Cerna, 2012; Rescorla et al., 2011). Some evidence that such profiles can be useful does exist based on similar instruments. Dembo, Gulledge, Robinson, and Winters (2011), for example, identified three subgroups, which they labeled a low-delinquent/emotional problem subgroup, a multiple-problem subgroup, and a high-delinquent/emotional problem subgroup. They found that the externalizing group had high levels of substance dependency or abuse, whereas members of the other two groups had lower scores in these areas. For adolescents, strong indications of substance abuse, physical abuse victimization, and aggression may mark a high-need profile. However, there is presently no existing evidence to support WARNS classifications. Such evidence is essential for justifying decisions that can influence the future of at-risk adolescents within the court and educational system (American Educational Research Association, American Psychological Association, & National Council on Measurement in Education, 2014).
Person-Centric Analysis: Latent Profiles
Person-centric statistical approaches include a wide range of methodologies that attempt to depict the “shape” of observable variables underlying a latent construct (Marsh, Lüdtke, Trautwein, & Morin, 2009). These approaches represent a departure from variable-centered approaches, such as factor analysis, that focus on the level of the underlying latent trait, but do not seek to explore the qualitative differences between individuals with different scores. In the current study, we utilize a person-centered statistical approach called latent profile analysis (LPA; Collins & Lanza, 2010; Finch & Bronk, 2011) to place students into profiles of risks and needs based on their responses within each of the WARNS subscales. LPA develops profiles such that persons within a profile are more homogenous compared with persons outside that profile (Bradshaw, Waasdorp, & Leaf, 2015; Pastor, Barron, Miller, & Davis, 2007). Therefore, profiles can be seen as representing otherwise unobservable subgroups.
LPA has been utilized in recent school psychology studies to examine classroom-wide behavior (Pas, Cash, O’Brennan, Debnam, & Bradshaw, 2015) as well as the emotional and behavioral adjustment of a low-income preschool cohort (Bulotsky-Shearer, Bell, & Domínguez, 2012). Thus, the application of LPA to identify individuals with certain patterns of risk and needs is appropriate. The understanding of the elevated risk and needs areas that are associated with outcomes can allow clinicians and practitioners to more effectively intervene in this population.
Current Study
Using LPA to identify unobservable subgroups of individuals with distinct patterns of risk behavior expands on previous work (e.g., Maynard, Salas-Wright, Vaughn, & Peters, 2012; Thompson, Macy, & Fraser, 2011) in two key ways. First, the WARNS enables development of profiles from self-reported risk and needs rather than teacher reports (Thompson et al., 2011). Therefore, perspective on the patterns of risks and needs is depicted by the students themselves, rather than a third party. Second, the definition of risks and needs defined by the WARNS broadens the parental involvement aspect to a family environment construct. It also adds constructs for depression, anxiety, defiance, substance abuse, and peer deviance, while retaining the areas of school engagement and aggression investigated in previous studies mentioned above. Thus, we anticipate that the current study will build more complete risk profiles not obtained in previous work. The anticipated outcome is a better understanding of risk and needs of this population.
Within the context of this investigation, an argument-based validation framework (Kane, 2013) is used to advance two claims. First, we evaluate evidence for an interpretation claim that scores on the six WARNS subscales may be interpreted as components of distinct profiles that classify adolescents as high, medium, or low risk. We hypothesized that results from the LPA would support this claim by being able to clearly identify profiles consistent with theory. Building on the interpretation claim, a use claim is advanced such that profiles obtained by the WARNS can be used for assessing an individual’s risk for suspension or arrest. We hypothesized that youth with profiles indicating elevated levels of substance abuse and aggression would be more likely to have a higher suspension and arrest records, consistent with the literature. We use logistic regression analysis with posterior probabilities to evaluate this hypothesis in relation to the use claim.
Method
Participants
Participants were adolescents (N = 937, 53.3% male) between the ages of 12 and 19 years attending public school in Washington state. Data were provided by Washington State Center for Court Research (George et al., 2015), representing children for whom a court petition was filed with the state due to excessive absenteeism, in accordance with Washington state statutory law (BECCA Bill, 1995, E2SSB 5439). The racial–ethnic background of the sample was predominately Hispanic/Latino (44.7%) and White/Caucasian (37.6%). Variability existed in student school and social adjustment as indicated by behavioral indicators of school disengagement and juvenile court involvement (e.g., 25.7% never suspended, 12.3% with 11 or more suspensions; 57.6% never arrested, 12.2% with 3 or more arrests).
Instrument
The WARNS (George et al., 2015) is a self-report measure (40 items) consisting of six subscales (e.g., Aggression–Defiance, Depression–Anxiety, Substance Abuse, Peer Deviance, Family Environment, and School Engagement). Internal consistency reliability estimates via Cronbach’s alpha for the subscales and total scale on the current sample were computed. The Aggression–Defiance (α = .82, 8 items) subscale assesses the participant’s frequency of aggressive (“I got into physical fights”) and defiant (“I lied, disobeyed, or talked back to adults”) behaviors. The Depression–Anxiety (α = .87, 8 items) subscale assesses symptoms of depression (“I felt like nothing could cheer me up”) and anxiety (“I was so worried or bothered by things it was hard to concentrate”). The Substance Abuse subscale (α = .77, 5 items) measures the participant’s reported drug and alcohol usage (“I missed or skipped school to use or recover from drugs or alcohol”). Peer Deviance (α = .82, 5 items) assesses the level of deviance in peers as perceived by the participant (“My friends got drunk or high from alcohol, marijuana [pot, weed], or other drugs”) covering multiple areas of risk (e.g., substance abuse, defiance, and aggression). The Family Environment (α = .79, 5 items) subscale measures the quality of the parent–child relationship as well as the home environment (“If I wanted to do homework, my parents’ home was a good place to be”). Finally, the School Engagement (α = .84, 9 items) subscale measures the participant’s attachment to school and learning (“I liked going to school”), their efforts to succeed (“I studied for my quizzes and tests”), and the strength of their connections and attitudes toward school personnel (“I could talk to an adult at school if I had a problem”). All six subscales were measured on the same 4-point scale with 1 = never or hardly ever, 2 = sometimes, 3 = often, and 4 = always or almost always. The manual provides additional score reliability and validity information including support for a bifactor underlying structure, measurement invariance across boys and girls and major ethnicity groups, as well as high correlations with similar measures.
In addition, when the youth complete the WARNS assessment, they also respond to a set of demographic questions asking about their behaviors such as arrests and suspensions from schools. Their responses have low consequences in terms of influencing their treatment. Thus, social desirability responding was thought not to be a major concern.
Analysis
Mplus 7.11 (Muthén & Muthén, 2013) was used to estimate the LPA models using the six WARNS subscales. Models increased in complexity (i.e., the number of profiles was incremented by one for each model), with the best fitting model, and thus the optimum number of profiles, selected based on several statistical criteria in addition to theoretical interpretability (Marsh et al., 2009) and the posterior size of the profiles (Nylund, Asparouhov, & Muthén, 2007).
Five statistical criteria for model fit were used: (a) Akaike information criteria (AIC; Akaike, 1974), (b) Bayesian information criteria (BIC; Schwarz, 1978), (c) adjusted BIC (ABIC; Sclove, 1987), (d) bootstrap likelihood ratio test (BLRT; McLachlan & Peel, 2000), and (e) Adjusted Lo–Mendell–Rubin test (LMR; Lo, Mendell, & Rubin, 2001). The AIC, BIC, and ABIC are based on the model’s log likelihood; however, they each make slightly different adjustments based on model complexity. In all cases, decreases in values across models indicate improved model fit. The LMR and BLRT are statistical tests that compare the current model (with k profiles) with the previous model (with k−1 profiles), with significant results (p < .05) indicating that the current model is a significant improvement in model fit over the model with one less profile. The BLRT appears to be best performing of all five statistical criteria, followed by the BIC and ABIC, respectively (Nylund et al., 2007). However, no single index is perfect (e.g., LMR can overestimate the number of profiles). Thus, it is recommended to confirm model selection in context of theory (Marsh et al., 2009) and posterior size of the profiles (Nylund et al., 2007). The posterior profile size, for example, can show a profile that is made up of only 1% of the sample, and may represent a spurious pattern that would not be replicable across studies or useful in practice.
Participant Demographic Variables and Their Relation to Profile Membership
To ascertain if these profiles represent unique information that is not dependent on background characteristics, individuals were assigned to their most likely profile based on the posterior probability, and a nominal regression model was estimated on these profiles across demographics variables including age, sex, and ethnicity of the participants. Adjusted odds ratios (AORs) depict the change in probability of being placed in profiles based on these variables (Bradshaw et al., 2015), while the Nagelkerke R2 statistics indicate the relationship strength.
Associations With Other Variables
We used two logistic regression models to examine the relationship between profile membership and history of arrests and suspensions. This was accomplished by regressing individual profile posterior probabilities (which represent the probability of being assigned to each of the different profiles) on arrests and suspensions. The posterior probabilities were used and compared with profile assignment, to account for the uncertainty in profile placement (Pastor et al., 2007). The arrest and suspension data were collapsed such that individuals fell into never arrested (0) or arrested (1), and suspended twice or less (0) or three times or more (1). These categories were selected to be consistent with previous WARNS validation studies (George et al., 2015). The variance explained (R2), as well as the AORs indicated the relationship strength and direction. It was hypothesized that youth with profiles indicating elevated levels of substance abuse and aggression would be more likely to have a higher suspension and arrest records.
Results
Descriptive Statistics
Descriptive statistics for the WARNS subscales, the arrest and suspension covariates, and correlations among variables appear in Table 1. Each WARNS subscale was based on a different range of scores: Aggression–Defiance (min 8, max 32), Depression–Anxiety (min 8, max 32), Substance Abuse (min 5, max 20), Peer Deviance (min 5, max 20), Family Environment (min 5, max 20), and School Engagement (min 9, max 36), with higher values representing greater risk in the scale area. The values of each of these scales were standardized (M = 0, SD = 1) to ease interpretation of the profiles.
Descriptive Statistics and Correlations Across the Six Subdomains of the WARNS, the Arrest, and Suspension Covariates.
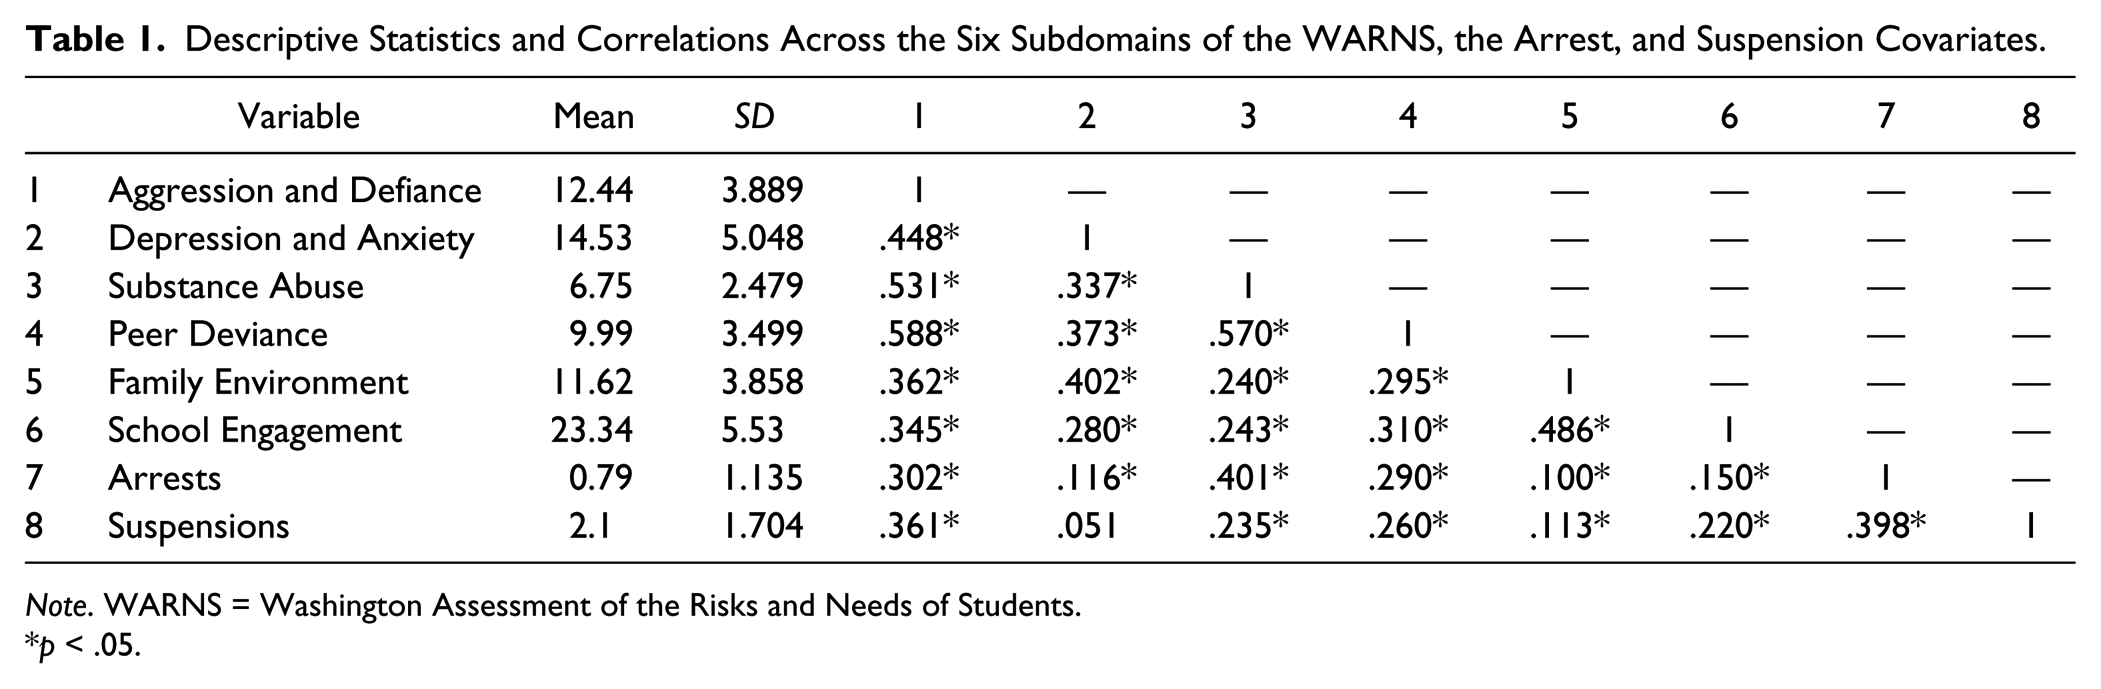
Note. WARNS = Washington Assessment of the Risks and Needs of Students.
p < .05.
Latent Profile Analysis
Table 2 displays fit indices for the LPA models. The more complex models (e.g., five and six profiles) did not reach satisfactory convergence criteria. These models were not stable, indicating more than four profiles may not be appropriate. Models 1 through 4 continued to improve in fit; however, the LMR test was nonsignificant for the four-profile model. Therefore, the three-profile model may be most accurate. As seen in Table 3, the smallest posterior profile size in this model still represents a sizeable portion of the total sample (i.e., 14%). This information and interpretation is consistent with WARNS research (George et al., 2015).
Latent Profile Model Fit Information.
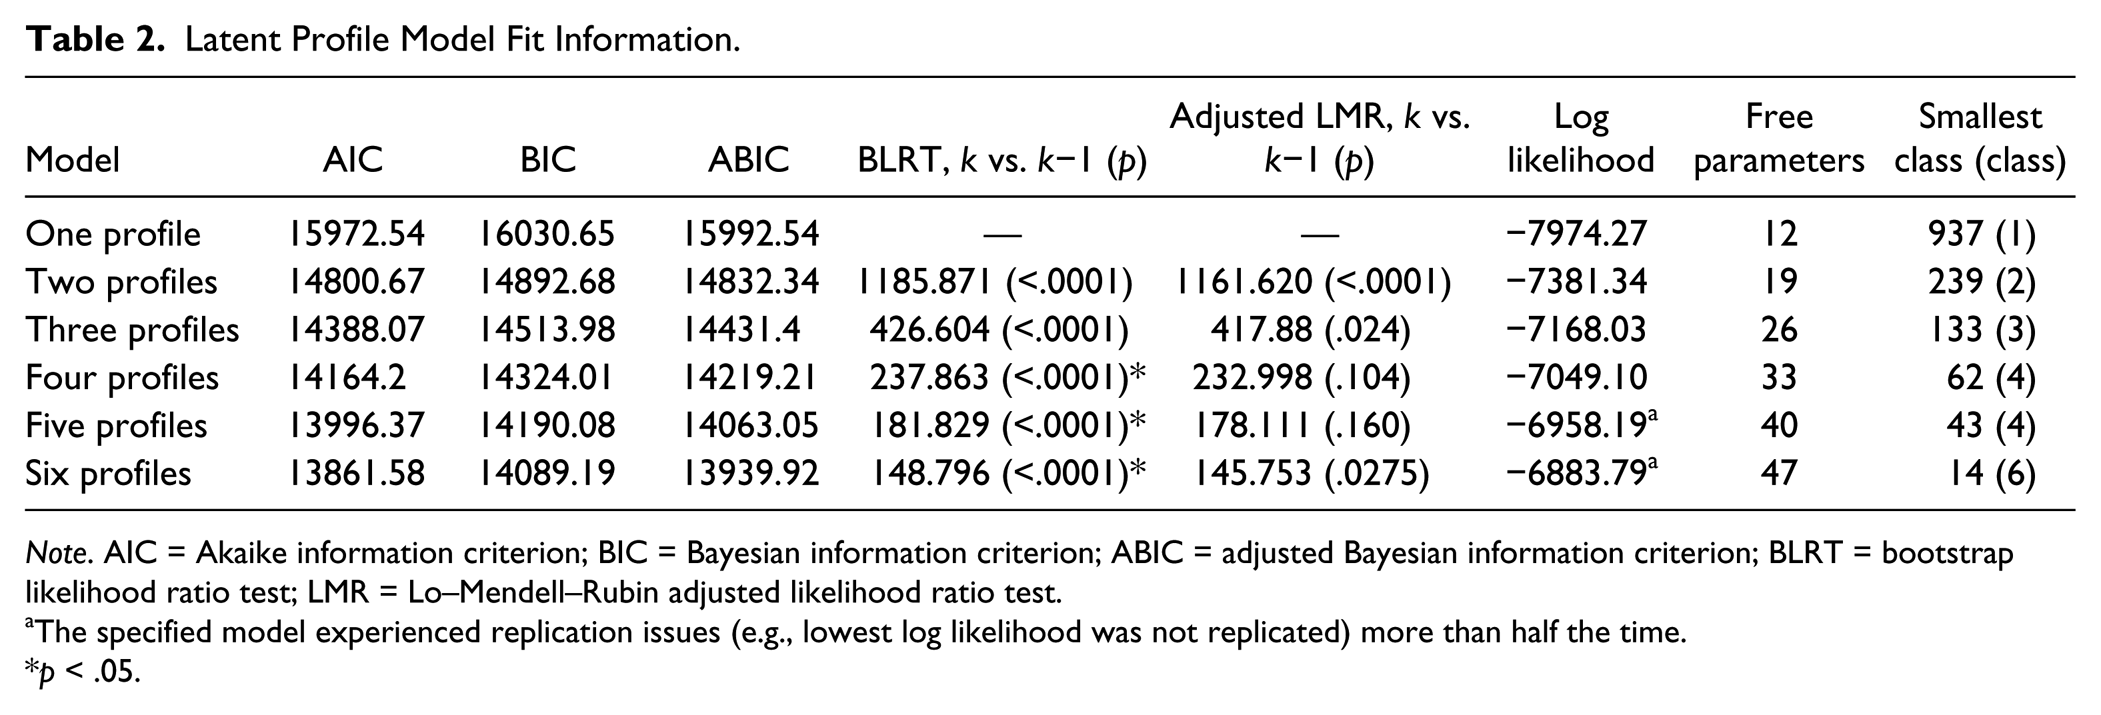
Note. AIC = Akaike information criterion; BIC = Bayesian information criterion; ABIC = adjusted Bayesian information criterion; BLRT = bootstrap likelihood ratio test; LMR = Lo–Mendell–Rubin adjusted likelihood ratio test.
The specified model experienced replication issues (e.g., lowest log likelihood was not replicated) more than half the time.
p < .05.
Profile z Scores Across WARNS Subdomains and Size of Profiles.
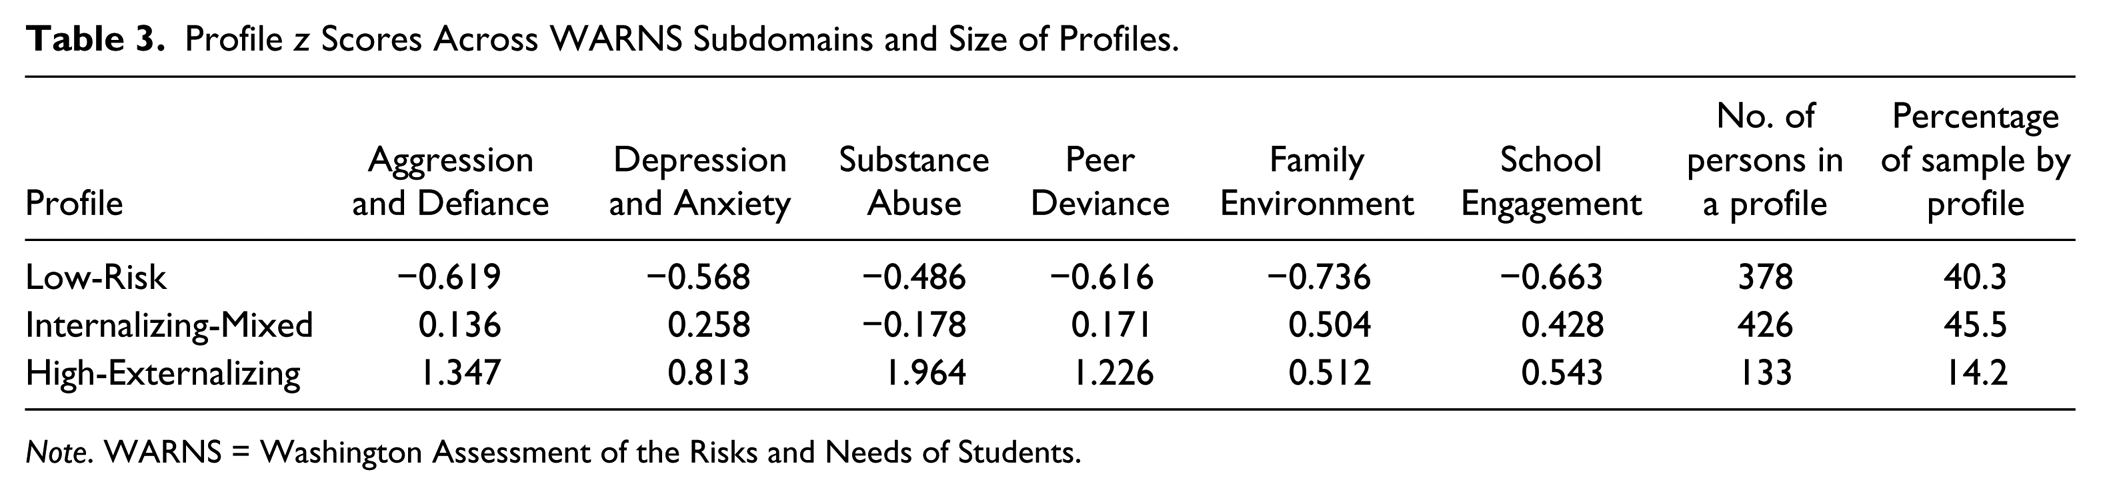
Note. WARNS = Washington Assessment of the Risks and Needs of Students.
The shape and level of this model can be seen in Figure 1, while the z-score values are presented in Table 3. Overall, these profiles suggest different levels and shape of risk and needs. The Low-Risk profile is characterized by overall low scores on all six variables. Youth in this profile would be classified as low risk for problem behaviors, needing no intervention at the time of assessment. This group represented 40.3% of the sample. The Internalizing-Mixed profile had scores higher than the Low-Risk profile, especially with regard to scores on Family Environment and School Engagement. The profile was marked by the similarity to the low-risk profile, however, in scores on the Substance Abuse subscale. This profile represented 45.5% of the sample. The High-Externalizing profile appeared to have elevated scores across all subscales compared with the low profile. Compared with the middle profile, there were elevations in Substance Abuse, Aggression Defiance, Peer Deviance, and Depression and Anxiety scores. In contrast, scores on Family Environment and School Engagement were nearly identical to the Internalizing-Mixed profile. This profile represented 14.3% of the sample.
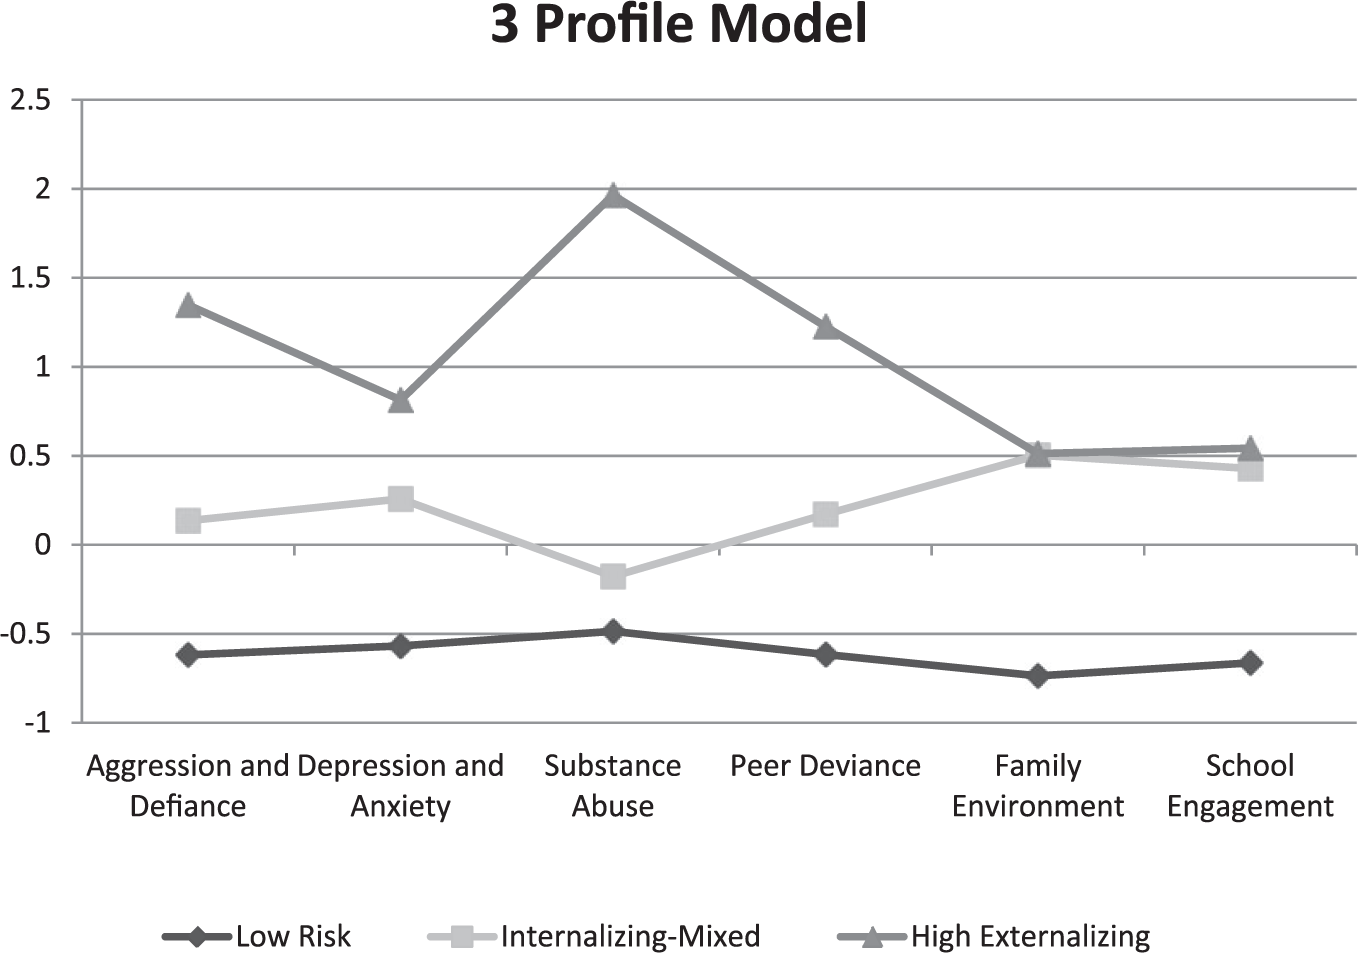
z Scores of indicator variables across profiles, depicting the shape and level differences between profiles.
Probability of Profile Assignment Based on Demographic Variables
The relationship between demographic variables and highest posterior probability profile was weak (Nagelkerke R2 = .034), as expected. Age, sex, and race/ethnicity accounted for less than 5% of the variation in profile assignment. Table 4 contains the AORs representing the probability change in being assigned to a profile other than the Internalizing-Mixed profile based on demographic information. As seen in Table 4, there are only two significant results. First, girls, compared with boys, were more likely to fall into the Internalizing-Mixed profile rather than the Low-Risk profile (AOR = 0.738). Second, those who self-reported as “Hispanic/Latino” were more likely to reside in the Internalizing-Mixed profile rather than the High-Externalizing profile compared with those who self-identified as “White/Caucasian.” In general, persons, regardless of demographic information, were dispersed throughout the profiles. In other words, profile assignment did not primarily depend on background characteristics available in this study.
Adjusted Odds Ratios (AORs) of Residing in Mixed-Internalizing Compared With the Other Profiles by Covariates.
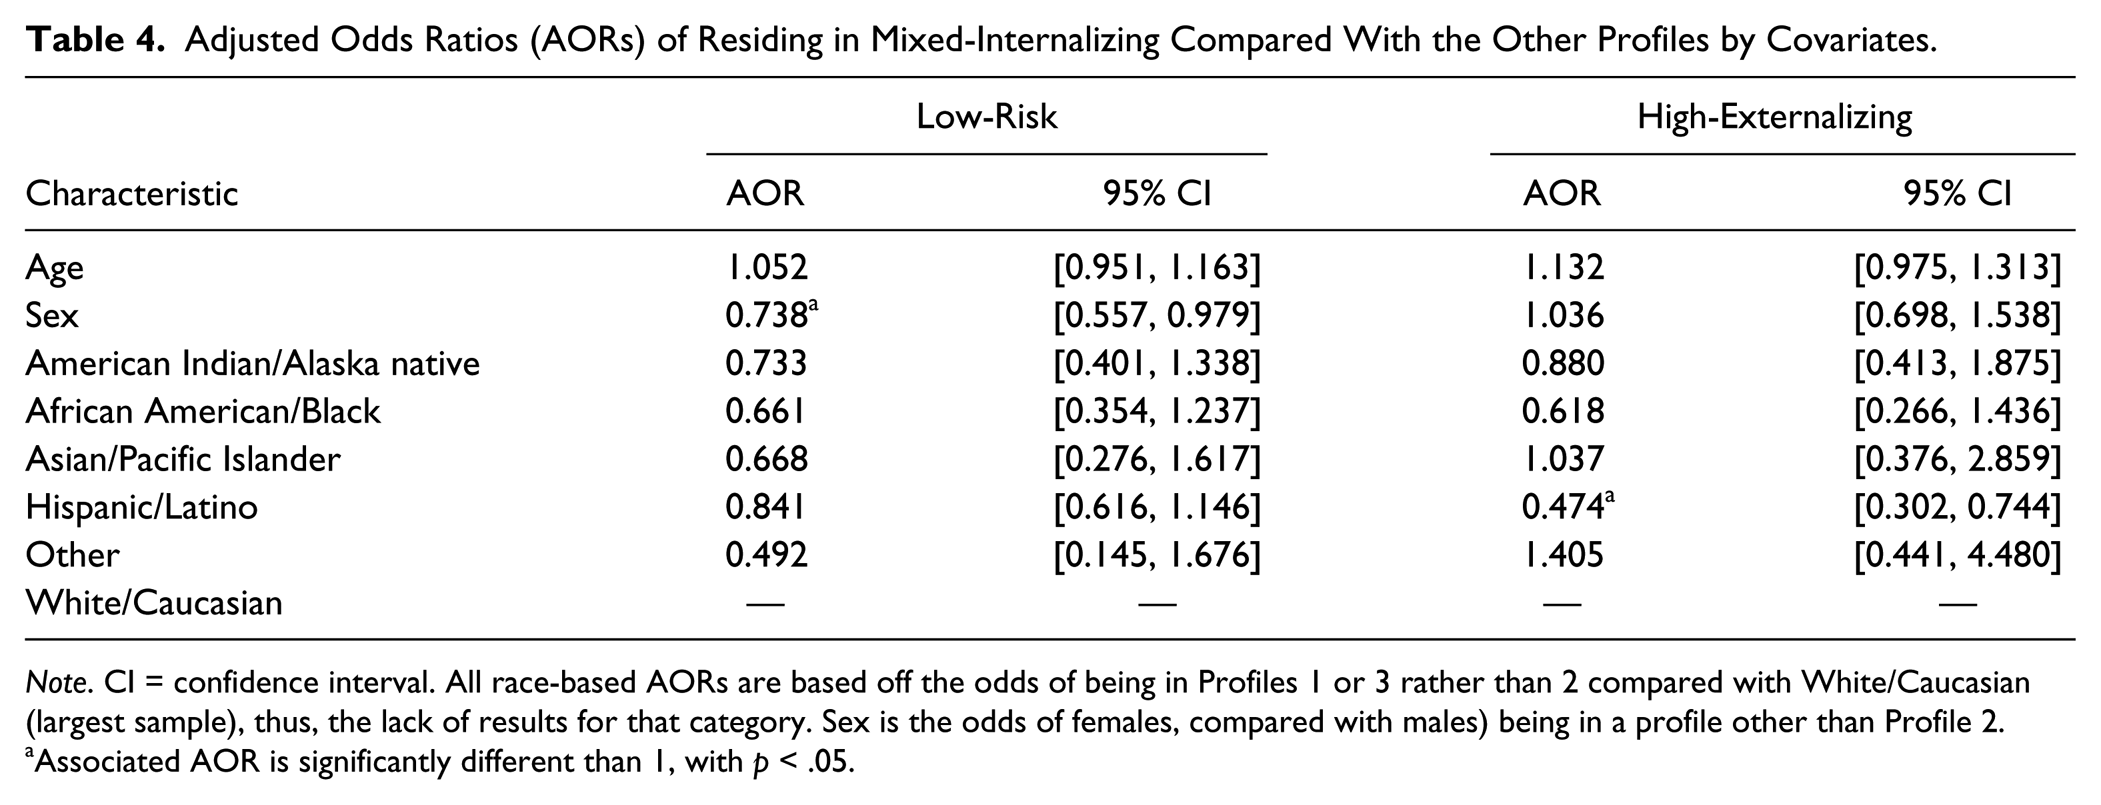
Note. CI = confidence interval. All race-based AORs are based off the odds of being in Profiles 1 or 3 rather than 2 compared with White/Caucasian (largest sample), thus, the lack of results for that category. Sex is the odds of females, compared with males) being in a profile other than Profile 2.
Associated AOR is significantly different than 1, with p < .05.
Profile Assignment Related to Outcomes
To evaluate the use of WARNS profiles as predictive indicators of serious negative outcomes, profile relationship with arrests and suspensions was examined. If the profiles aid in determining risk and needs, profile shapes that indicate higher needs and risks scores in certain areas (e.g., substance abuse) should have higher levels of suspensions and arrests. Approximately 13% of the variance in arrests (Nagelkerke R2 = .137) and 8% of the variance in suspensions (Nagelkerke R2 = .086) was explained in these models. This variance explained is in accord with prediction of graduation rates and juvenile offenses (George, 2011). Table 5 contains the AORs, which depict the change in the odds of being arrested or suspended as individuals are placed in the Low-Risk profile to the Internalizing-Mixed profile to the High-Externalizing profile. For example, individuals in the High-Externalizing profile are three times more likely (AOR = 3.307) to have an arrest record and two times more likely (AOR = 2.046) to be suspended three or more times from school compared with peers in lower risk profiles. 1
Adjusted Odds Ratios (AORs) and Confidence Intervals (CIs) Representing Change in Arrests/Suspensions Across Profiles.
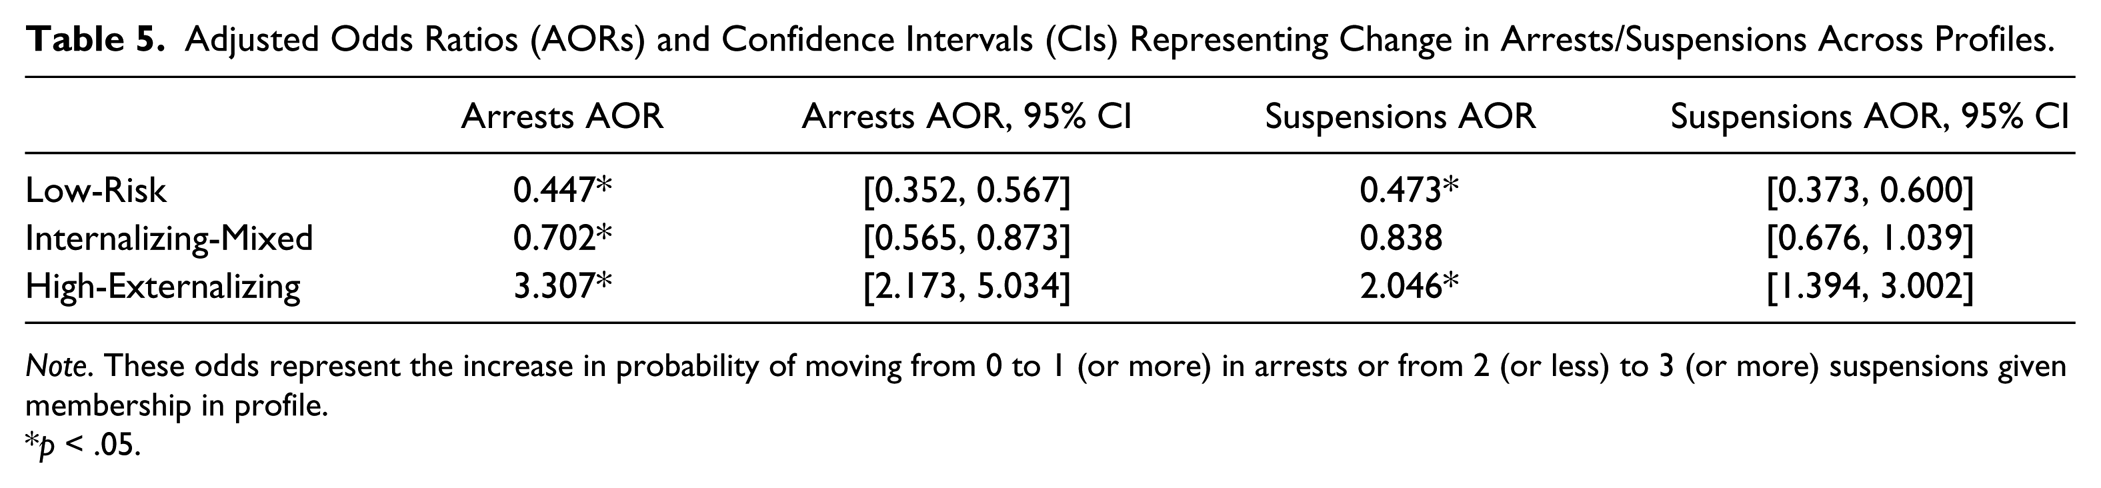
Note. These odds represent the increase in probability of moving from 0 to 1 (or more) in arrests or from 2 (or less) to 3 (or more) suspensions given membership in profile.
p < .05.
Discussion
The goal of this work was to examine unique profiles of risk and needs of youth in Washington state through the use of the WARNS instrument. There was specific interest in developing profiles that met both statistical and theoretical criteria that would be useful in practice. Three profiles consistent with WARNS descriptive work were supported. In general, sex and age categories were spread across the profiles. Additionally, students with elevated profiles, especially those high in substance and peer deviance behaviors were more likely to have been arrested or suspended from school in comparison with students in other profiles low in such behaviors. These results support the interpretation of WARNS subscale scores as components of distinct adolescent profiles and the use of WARNS scores for understanding, assisting, and working with youth who exhibit certain profiles of risk and needs.
The identification of subgroups of truant youth who present with different profiles can facilitate effective referrals and treatment. We identified three groups, two of which illustrate problems consistent with externalizing and internalizing pathology. These LPA results suggest different foci for intervention purposes for two of the three profiles (and 60% of the sample), in alignment with differential treatment guidelines according to externalizing and internalizing pathology (Jarrett, Siddiqui, Lochman, & Qu, 2014; Shapiro, 2015). These results also suggest that externalizing pathology elevations are most predictive of poor outcomes. These results are not surprising, but they do suggest the value of the WARNS for guiding decisions regarding predictors of future social and scholastic dysfunction. It is also noteworthy that family and school problems do not differ across children in the High-Externalizing and the Internalizing-Mixed groups. Therefore, while improving these social indicators is a valid target for intervention, it appears both groups experience these problems equally.
Although Depression and Anxiety scores were higher for the High-Externalizing profile compared with the Internalizing-Mixed profile, an examination across the behavioral domains illustrates that for the former group but not for the latter group the Depression and Anxiety scores are lower relative to the scores for the externalizing dimensions of aggression–defiance, substance use, and deviant peers. Therefore, from a within-profile standpoint, it may be important to distinguish the elevations of internalizing versus externalizing scores, as the primary distinction across these groups (Riglin et al., 2016). This has important treatment implications because it aligns with the research revealing the complexity of the internalizing/externalizing split with respect to functioning over time (Abram et al., 2015; Copeland, Shanahan, Costello, & Angold, 2009). In the case of the present results, what might be referred to as internalizing pathology is not distinguished from externalizing pathology by those in the Internalizing-Mixed profile displaying higher rates of internalizing scores than those in the High-Externalizing profile group—that is because a characteristic of externalizing pathology, the more serious form, is an overall elevated symptom profile. But what is different about those with internalizing pathology are relative elevations in anxiety/depression in the context of less elevations across the markers of externalizing pathology (aggression/deviance, deviant peers, and substance abuse).
This interpretive framework must be compared with one that identifies an elevation on substance abuse as the primary marker distinguishing the most pathological profile form. While this is a more parsimonious approach to the data, it is likely to be less robust across ages. That is, within the present sample of high school aged youth, experience with substance abuse may be a strong predictor, but it is likely to be a less salient feature of children at younger ages. Of the three indicators of what we are calling the High-Externalizing profile, substance abuse is the latest to emerge (Liu, Lynne-Landsman, Petras, Masyn, & Ialongo, 2013). For younger children, for whom opportunities for substance abuse have not yet become available, behavioral patterns characterized by aggression and deviance are already evident in the form of hyperactivity, oppositionality, and aggression toward peers, and are frequently accompanied by anxiety (Abram et al., 2015; Costello, Mustillo, Erkanli, Keeler, & Angold, 2003). Therefore, given the vagaries of heterotypic continuity, it is likely that the bellwether indicator of the externalizing disorder profile will shift across development, with elevations in one or more of the externalizing disorder trifecta always revealing substantial elevation relative to (higher than normal) indicators of internalizing disorder, as the primary indicator of that profile (Copeland et al., 2009).
Limitations and Future Directions
A limitation of the present study is that data represent self-reports which, even when completed under conditions of anonymity, are likely to underreport levels of psychopathology and substance use (Delaney-Black et al., 2010). Nevertheless, such reports are commonly used in clinical and research settings, and represent perhaps the best method for evaluating and intervening with respect to adolescent behavior problems. Underreporting may limit the extent of the problems in certain areas due to social desirability in their responses. However, we did observe difference across profiles on behaviors that one would suspect youth might be reticent to report (e.g., substance abuse), and we did find differences in profiles on self-reported outcomes (e.g., suspensions) that were consistent with expectations. Given the manner in which the WARNS is administered with no high-stakes consequences directly tied to the scores, there is support that youth are reporting honestly. That said, future work needs to consider this issue at a finer grain level, as to date, no empirical investigations have occurred with the WARNS for accuracy of the self-report data.
A second limitation relates to the malleability of these behaviors. The data used to model the profiles were sampled from one point in time. Given peer influence, intervention by parents or others, and typical youth development during these formative years, it is likely that behaviors change rapidly. What is unclear is when and how these three profiles emerge, and perhaps more important, how youth transition from one to another. Some evidence does give insight to possible changes (i.e., Copeland et al., 2009); however, the stability and the movement of youth between profiles over the course of a year or longer time horizon is in need of additional evidence. Future work should focus on determining an appropriate baseline for beginning such assessments and the frequency of interval assessments from that point. The goal with such a system would be to understand the transition points related to truancy and build prevention models grounded in empirical intervention frameworks in schools. This would align with the field’s emphasis on evidence-based treatments in everyday practice (e.g., Chambers, Ringeisen, & Hickman, 2005) with a push for prevention based on continual empirical data. In addition to this, even though the variance explained in the outcomes was relatively low (8% and 13%), it was in accord with the prediction of related outcomes of graduation rates (11%) and juvenile offenses (3%) when truant behavior is examined (George, 2011). Thus, as with malleability of behavior, there is a need to continue to investigate additional predictors in explaining these youth outcomes to increase the explained variance in risk and needs models.
Third, there is a need to consider the developmental aspect of these profiles with younger ages. Our sample limited our profile development to one age group without sufficient size at separate ages to obtain stable estimates by age groups. The first issue, as aforementioned, is understanding what development trajectories exist in these profiles that can be documented. Latent transition analysis should be considered in future work to understand, over time, how high school aged youth move between profiles and what variables (e.g., peer influence, media) are associated with such movement (Riglin et al., 2016). Second, a downward extension of the WARNS to middle school is certainly needed. This is not as simple as adapting the terminology of items for younger subjects, but rather understanding how behaviors that are related to the same six risk and needs factors manifest themselves at those ages and change over time. Such understanding could guide development of prevention systems before truancy and other negatively associated outcomes enter into the life of the youth.
Empirical evidence to support profiles based on the WARNS scores will assist in improving the identification of youth for risks and needs related to school truancy. Specifically, the profile and subgroup information will allow for more accurate decisions about youth, especially in terms of the type and level of intervention that may be needed to positively influence outcomes. Moreover, applying LPA to such groups is particularly useful and innovative in terms of understanding the variation in intervention and prevention impacts (Lanza & Rhoades, 2013). Profiles based on the WARNS will provide counselors, case managers, administrators, teachers, and students with an efficient method to collect and synthesize information to identify needed services, develop successful intervention plans, and allow students to receive help and be matched to specific services to minimize negative outcomes associated with truancy.
Finally, this study provides evidence for the use of WARNS scores for profiles to make accurate decisions about youth’s risks for maladaptive behaviors and potential interventions. The results support the interpretation and use claims advanced in this work, and continue to add to the body of research supporting the use of WARNS scores.
Footnotes
Declaration of Conflicting Interests
The author(s) declared no potential conflicts of interest with respect to the research, authorship, and/or publication of this article.
Funding
The author(s) received no financial support for the research, authorship, and/or publication of this article.