
Abstract
The Psychological Inventory of Criminal Thinking Styles-Short Form (PICTS-SF) is an abbreviated 35-item version of the PICTS, a measure of cognitions that support a criminal lifestyle. Despite use in research and clinical work, the PICTS-SF’s psychometric properties have not been tested. Using two archival datasets, we analyzed the PICTS-SF’s reliability and structural validity in multiply imputed data from adult males and females on probation in a residential treatment facility (n = 514). We also tested the PICTS-SF’s reliability and discriminant and postdictive validities among adult males in administrative segregation in prison (n = 95). We found evidence for the PICTS-SF’s internal consistency (α and ω ≥ .89), structural validity (CFI = .90, RMSEA = .05), discriminant validity (.22 ≤ r ≤ .39), and postdictive validity for receiving disciplinary infractions (incident rate ratio = 1.04). These results support the PICTS-SF’s use in research, and qualified use in clinical applications.
Keywords
Antisocial cognitions, a constellation of beliefs associated with criminal behavior, are one of the eight most robust predictors of criminal justice involvement (i.e., the Central Eight criminogenic risk factors; Bonta & Andrews, 2017). Housed within the larger construct of antisocial cognitions are the related but different concepts of antisocial attitudes and criminal thinking. Antisocial attitudes refer to the content (i.e., “what a person thinks,” Simourd & Olver, 2002, p. 429) that is supportive of rule violations or criminal behavior (Simourd, 1999; Simourd & Olver, 2002) and include attitudes toward the law, violence, and police, for example. Criminal thinking, on the other hand, refers to the thought processes that support a lifestyle of crime (Walters, 1995) and is “how a person thinks” (Simourd & Olver, 2002, p. 429). An individual thinking that a shoulder bump with a stranger on a sidewalk is an intentional power move to assert dominance, rather than as an accident, is an example of criminal thinking. The Psychological Inventory of Criminal Thinking Styles (PICTS; Walters, 1995) is a commonly used measure for research and clinical work to assess the “criminal thought content and processes” (Walters, 2003, p. 403) of people involved in the criminal justice system.
A 2002 meta-analysis found the original PICTS significantly predicted past and future criminal behavior, including institutional disciplinary infractions and post-release outcomes, as well as psychological treatment dropout (Walters, 2002). Additional evidence shows the PICTS General Criminal Thinking (GCT; i.e., overall measure of criminal thinking; Walters & Schlauch, 2008) and Reactive Criminal Thinking (RCT; i.e., impulsive and hot-blooded criminal thinking; Walters & Geyer, 2005) were significantly associated with disciplinary infractions among an incarcerated sample. GCT and RCT scales have also been shown to predict recidivism, regardless of charge type (Walters, 2011). Proactive Criminal Thinking (PCT; i.e., deliberate and cold-blooded criminal thinking) predicted recidivism for serious charges (Walters, 2011), as well as completion (Walters & Geyer, 2005) of a voluntary, prison-based program aimed to reduce antisocial behavior (Challenge, Opportunity, Discipline, and Ethics [CODE] Program; Correia, 2009). There is also evidence the PCT and RCT scales predict arrests for proactive and reactive aggression, respectively, and both scales predict cumulative frequency of arrests (Walters et al., 2007).
As the PICTS has proven effective at predicting criminal behavior and antisocial acts, it has gained increased attention in both clinical and research settings, including adaptations for specific settings and purposes. Beyond the original 80-item scale, there are now several versions of the PICTS in use, including a 35-item Short Form (PICTS-SF). The PICTS-SF was developed for more efficient clinical use with justice-involved populations (Walters, 2006). The PICTS-SF retained items from the long form, as well as the overall score, two composite scales, two content scales, four factor scales, and eight criminal thinking style scales, and omitted the PICTS’ four validity indicators and one special scale (see Measures). The most notable advantage of the PICTS-SF is that it is less than half the length of the full PICTS. The reduced length produces obvious advantages, given the limited resources within corrections, and a significant research advantage as it may allow for the inclusion of additional measures without increasing respondent burden.
Although the PICTS-SF is treated as a psychological measure, a formal psychometric evaluation of the PICTS-SF has yet to be conducted. In fact, research using the PICTS-SF has often reported the reliability and validity of the full version of the PICTS when describing the measure (e.g., Gaspar et al., 2019; Varghese et al., 2018; Walters, 2009). Though convenient, the transitive reliance on previous psychometric examination of the PICTS as evidence for the validity of the PICTS-SF is contrary to recommendations for the development and evaluation of short forms (Smith et al., 2000); thus, a rigorous evaluation of the PICTS-SF is necessary.
The Current Studies
Given the PICTS-SF’s use in correctional research (Batastini et al., 2019, 2020; Gaspar et al., 2019; Scanlon et al., 2022; Varghese et al., 2018; Walters, 2009), the current studies evaluated the following psychometric properties of the PICTS-SF: (1) reliability, (2) structural validity, (3) discriminant validity, and (4) postdictive validity. The purpose of Study 1 was to provide preliminary evidence of the PICTS-SF’s internal consistency reliability, and structural and discriminant validities. Study 1 was comprised of a sample of 514 justice-involved males and females completing probation sentences in a residential treatment facility. The purpose of Study 2 was to ascertain the generalizability of Study 1 findings to a prison sample of 95 incarcerated males, provide additional evidence of reliability and postdictive and discriminant validities of the PICTS-SF, and test the reliability of the PICTS-SF after modifications from results in Study 1.
In these two studies, reliability of the measure was tested using ordinal alpha (Cronbach, 1951) and ordinal omega estimates (McDonald, 1999). The PICTS-SF’s discriminant validity was tested against the Measure of Criminal Attitudes and Associates (Study 1) and the Criminal Sentiments Scale-Modified (Study 2), broader measures of antisocial attitudes. Because the constructs of antisocial attitudes and criminal thinking are both types of antisocial cognitions but not identical constructs, we hypothesized that the PICTS-SF and these two measures of antisocial attitudes should be significantly, positively, and moderately correlated (ranging from .30 to .50) in both studies. In Study 1, the PICTS-SF’s second-order factor structure was based on the theoretical structure of the construct of criminal thinking (Walters et al., 2011), in which GCT is an overarching factor and PCT and RCT as lower-order factors. This factor structure was tested using a categorical confirmatory factor analysis (CFA). If the factor structure is consistent with this theoretical conceptualization of criminal thinking, these findings would provide evidence for the PICTS-SF’s structural validity (De Vet et al., 2011; Mokkink et al., 2010). In Study 2, the postdictive validity of the PICTS-SF Historical Criminal Thinking scale was evaluated using previous instances of disciplinary infractions, consistent with previous research on the original PICTS (Walters & Geyer, 2005; Walters & Schlauch, 2008). The Historical scale was chosen due to the historical nature of the infractions and limited research on the postdictive validity of the measure per previous behaviors.
Study 1
Method
Procedures
Data included in the current study were gathered from males and females completing probation sentences in a [state] residential treatment facility from 2015 to 2020 for purposes of program evaluation. Upon entry into the facility, the respondents completed the PICTS-SF and MCAA at the same timepoint, before beginning treatment at the facility. Study 1 procedures were approved by [institution]’s Institutional Review Board (IRB).
Participants
De-identified, multiply imputed, archival data from 514 males and females completing probation sentences were used in Study 1. In total, data was collected from 815 respondents, of whom 396 respondents were not missing any PICTS-SF data; after conducting multiple imputation on missing PICTS-SF and MCAA item responses (see Data Analysis), the final sample size for the current analyses increased to 514 participants. Available self-report data from respondents indicated 50.2% of the sample was male (nmale = 258; nfemale = 188, 36.6%). Regarding race, the sample was largely White (n = 168, 32.7%) or Black (n = 163, 31.7%), with seven participants identifying as Asian/Asian American (1.4%), four as American Indian/Native American (0.8%), and 36 identifying as a member of another racial group (n = 36, 7%). About 15% of the sample identified as Hispanic (n = 81, 15.8%), compared to 23.3% who identified as non-Hispanic (n = 120). The available data indicated the sample’s average age was 34.57 years (n = 394, SD = 10.20), and average length of education was 10.98 years (n = 367, SD = 2.46).
Measures
PICTS-SF
The PICTS-SF is a 35-item, brief version of the original PICTS. It has four ordinal response options ranging from four (Strongly Agree) to one (Disagree); no items are reverse scored. Both the full version of the PICTS and the PICTS-SF are comprised of an overall measure of criminal thinking (General Criminal Thinking), two composite scales (Proactive Criminal Thinking, Reactive Criminal Thinking), two content scales (Current Criminal Thinking, Historical Criminal Thinking), two factor scales (Problem Avoidance, Self-Assertion/Deception) and eight thinking styles (Mollification, Cutoff, Entitlement, Sentimentality, Superoptimism, Cognitive Indolence, Discontinuity, Power Orientation). Because the aim of the current study is to test the theoretically (Walters et al., 2011) and empirically supported (Mitchell et al., 2017; Walters et al., 2011) hierarchical structure of the PICTS (in which the GCT is a higher-order factor, and the PCT and RCT scales are lower-level factors), only the GCT, PCT, and RCT scales are included in the current analysis. Previous research has provided evidence of the full PICTS’ internal consistency (α ranging from .54 to .94; Walters, 2013). A meta-analysis indicated the full version of the PICTS GCT, PCT, and RCT scales have demonstrated evidence of predictive validity for recidivism (pooled effect sizes ranging from .17 to .20; Walters, 2012). The PICTS GCT has also demonstrated predictive validity for any disciplinary infractions (r = .23, p < .01) and severe disciplinary infractions (r = .24, p < .01; Walters & Schlauch, 2008). In a test of the PICTS factor structure, Walters and colleagues (2011) found a second-order CFA model factor structure demonstrated acceptable fit (CFI = .82, TLI = .96, RMSEA = .06). For the psychometric properties of the PICTS-SF in the current sample, see Results.
Although the PICTS-SF scoring manual does not provide scoring guidelines to create the GCT, Walters has also referred to GCT as a “total score” (Walters et al., 2011). Thus, the current study will refer to all 35 PICTS-SF items as GCT. The PICTS-SF scoring manual includes item 14 on both PCT and RCT scales, though Walters (2006) recommends the item be included only on the PCT when independence of the two scales is necessary; per this recommendation, item 14 was included only on the PCT factor in the current analyses (see Table 1 for all the PICTS-SF items).
PICTS-SF Items and CFA Model Standardized Factor Loadings With Standard Errors.

Note. Standardized factor loadings are presented with standard errors in parentheses; standard errors not available for the first item on each factor (item 1 on PCT, item 2 on RCT). In the second-order CFA model, the standardized factor loading of RCT on GCT was .56, and PCT on GCT was 1.43. PICTS-SF = Psychological Inventory of Criminal Thinking Styles-Short Form; CFA = Confirmatory Factor Analysis; PCT = Proactive Criminal Thinking; RCT = Reactive Criminal Thinking.
The Measure of Criminal Attitudes and Associates
The Measure of Criminal Attitudes and Associates (MCAA; Mills & Kroner, 2001) is a self-report scale designed to measure criminal associates (Part A) and attitudes (Part B). Part A is comprised of four, five-part questions, and quantifies the number and frequency of contact with persons that have engaged in criminal behaviors; because it does not produce a scale relevant to attitudes or cognitions, it was not relevant to the current study and was therefore excluded. Part B, however, is comprised of 46 items that constitute four subscales: Attitudes toward Violence, Attitudes toward Entitlement, Attitudes toward Associates, and Antisocial Intent. The MCAA has previously demonstrated strong internal consistency (α = .90), predictive validity for general recidivism on five of six scales (r ranging from .19 to .46; the Violence scale was not significant, r = .16), and violent recidivism (r ranging from .18 to .38; Mills et al., 2002, 2004). Because antisocial cognitions broadly include the related constructs of antisocial attitudes and criminal thinking, and because the Part B is designed to capture antisocial attitudes, only Part B is used in this study.
Ordinal alpha and omegas estimates were calculated in each of the five reverse-scored and imputed datasets for the four MCAA Attitudes scales, and for all of the MCAA Part B items. All MCAA alpha and omega estimated indicated acceptable internal consistency; alpha estimates ranged from .94 (95% Confidence Interval [CI]: .94, .95) to .95 (95% CI: .94, .95), and all omega estimates were identical (ω = .94, 95% CI: .93, .95). The average inter-item correlation for the MCAA Attitudes toward Violence (Spearman’s ρ = .30, 95% CI = .26, .33), Attitudes toward Associates (ρ = .22, 95% CI = .18, .25), and Antisocial Intent (ρ = .23, 95% CI = .19, .26) items were acceptable (ρ ranging from .15 to .50). The average inter-item correlations for the Attitudes toward Entitlement (ρ = .14, 95% CI = .11, .18), and Part B (ρ = .14, 95% CI = .11, .18) items were low, but were retained as they demonstrated acceptable alpha and omega estimates, and acceptable estimates were contained within the inter-item correlations’ 95% CIs.
Data Analysis
Assumptions
Tests of outliers and normality in the PICTS-SF and MCAA imputed data were conducted in Excel. To detect potential outliers, scores from the PICTS-SF GCT, PCT, and RCT scales, and the four MCAA Attitudes scales were z-transformed. No z-transformed PICTS-SF scale scores were beyond|3.29| (Field, 2013), indicating there were no outliers. For the MCAA scales, there was one outlier (z = 3.45) on the Attitudes toward Associates scale. A sensitivity analysis was conducted to test if the removal of the outlier changed the results of the correlations conducted between the MCAA Attitudes toward Associates scale and three PICTS-SF scales; because the removal of this respondents’ data did not change the correlation coefficients or significance for any of the MCAA Attitudes toward Associates correlations, respondents’ data was retained in the correlation analyses. No PICTS-SF or MCAA scales demonstrated a skewness or kurtosis value beyond|2| (George & Mallery, 2010), and therefore were considered normally distributed.
Multiple Imputation
Of 815 participants included in the original dataset, 396 respondents had no missing responses to PICTS-SF items and were therefore included in the current analyses. Per Little’s Missing Completely at Random (MCAR) test, respondent’s data from all variables appear to be missing at random (χ2 [639] = 457.67, p = 1.00). Because multiple imputation with more than 10% of data missing may bias results (Dong & Peng, 2013), data from participants missing less than 10% of item-level data on the PICTS-SF were multiply imputed. Item responses to the PICTS-SF and MCAA were imputed within each measure using R’s MICE package (Van, Buuren, & Groothuis-Oudshoorn, 2011). MICE (multivariate imputation by chained equations), or fully conditional specification, does not require linearity and normality (see Liu & De, 2015; Van Buuren, 2018; Van Buuren & Groothuis-Oudshoorn, 2011), and is appropriate for imputing categorical variables. MICE imputes each variable sequentially based on a conditional density function for that variable (Van Buuren, 2018). Each variable was multiply imputed five times using predictive mean matching, wherein the missing data item is replaced with values from another observation with similar non-missing data points (Van Buuren, 2018).
Because missing data tends to bias results (see for example Cummings, 2013), we maximized our sample size to include data from as many respondents from the original sample (N = 815) as possible. By multiply imputing our data, we expanded the amount of usable data from 396 (48.5% of the original sample) to 514 (63%); the total sample included 514 respondents for all analyses.
Reliability
The internal consistency reliability of the PICTS-SF in this sample was tested using ordinal alpha and ordinal omega estimates calculated in R (version 3.6.3, https://www.r-project.org/). Alpha is a commonly reported measure of internal consistency, although it can underestimate reliability (Cortina, 1993; Deng & Chan, 2017); therefore, omega, an indicator of reliability for total scores, was also included to supplement the alpha estimates and provide a more comprehensive indicator of internal consistency (Deng & Chan, 2017). Reliability estimates were calculated in R using the userfriendlyscience package (Peters et al., 2018). For alpha and omega point estimates, 95% CIs are presented.
Discriminant Validity
Correlations were conducted to test the discriminant validity of the PICTS-SF scales with those measuring related, yet discrete constructs; specifically, the correlations were conducted between the PICTS-SF scales (GCT, PCT, and RCT), and the MCAA Attitudes scales (Attitudes toward Associates, Attitudes toward Entitlement, Attitudes toward Violence, and Antisocial Intent).
Structural Validity
The PICTS-SF factor structure (GCT as a higher-order factor, and PCT and RCT as two lower-order factors) was tested using CFAs to confirm the internal structure found in the PICTS (Walters et al., 2011) and PICTS—Layperson Edition—Short Form (PICTS-L-SF; Mitchell et al., 2017). For this reason, consistent with the previous literature, the current study examined only the PICTS-SF GCT, PCT, and RCT scales. A two-step approach, consistent with that presented by Anderson and Gerbing (1988), was used to test the measurement and structural model of the PICTS-SF. To test the measurement models of the first order PCT and RCT factors, two unidimensional CFAs were conducted. To test the structural model, a second-order CFA was conducted with PCT and RCT as first-order factors and GCT as a second-order factor.
Structural validity is evidence that a measure’s observed structure is consistent with the target construct’s dimensionality (Mokkink et al., 2010). The current factor analysis approach is theoretically consistent with the developer of the PICTS’ conceptualization of criminal thinking “as a higher order construct supported by two correlated factors (proactive criminal thinking and reactive criminal thinking)” (Walters et al., 2011, p. 925), and the organization of Walters et al.’s (2011) multilevel hierarchical model of the PICTS, where the “proactive and reactive criminal thinking subconstructs are sandwiched between general criminal thinking at the top of the hierarchy and individual PICTS items at the bottom of the hierarchy” (p. 930). Therefore, the second-order CFA is used to test the PICTS-SF’s structural validity (see for example Clark & Watson, 2019).
Model fit for all CFA models was tested using the Comparative Fit Index (CFI), Tucker–Lewis Index (TLI), and Root Mean Square Error of Approximation (RMSEA), where CFI and TFI indices of .90 or more are indicative of acceptable fit (Bentler & Bonett, 1980) and an RMSEA of 0.08 or less (Browne & Cudeck, 1993) are indicative of acceptable fit. Because the PICTS-SF response options are ordinal, a Weighted Least Squares Mean and Variance Adjusted (WLSMV) estimator was used instead of a Maximum Likelihood estimator (Rhemtulla et al., 2012). CFA analyses were conducted in R (version 3.6.3, https://www.r-project.org/) using the lavaan package for latent variable analysis (Rosseel, 2012).
Results
Reliability and Discriminant Validity
Ordinal alpha and ordinal omega estimates were tested for evidence of the PICTS-SF’s internal consistency reliability. Because multiply imputed reliability estimates are not able to be pooled due to not fitting a normal distribution and not having standard errors, these estimates were conducted separately for each of the five imputed data sets, as well as in the unimputed data. Ordinal alpha values were identical in all five imputed datasets (α = .96, 95% CI: .95, .96), indicating the PICTS-SF items demonstrated strong internal consistency reliability in the current sample. Similarly, ordinal omega estimates in all five imputed datasets (ω = .96, 95% CI = .95, .96) demonstrated identically strong reliability in the current sample. These internal consistency estimates are roughly consistent with prior reliabilities of the PICTS-SF (α = .94, Batastini et al., 2019; α = .91, Batastini et al., 2020; α = .94, Scanlon et al., 2022; α = .91, Varghese et al., 2018) and the PICTS-L-SF GCT (ω = .96, Mitchell et al., 2017). The average inter-item correlation for the PICTS-SF GCT (Spearman’s ρ = .30, 95% CI = .27, .34), PCT (ρ = .30, 95% CI = .26, .33), and RCT (ρ = .39, 95% CI = .35, .41) items were also acceptable.
All three PICTS-SF scales demonstrated positive, significant correlations with the MCAA subscales (Table 2). The PICTS-SF subscales were moderately correlated with the MCAA Attitudes toward Violence and Antisocial Intent subscales (Table 2), providing evidence for PICTS-SF’s discriminant validity in this sample. However, although significant and positive, the magnitude of the correlations between the PICTS-SF subscales and the MCAA Attitudes toward Entitlement and Attitudes toward Associates subscales were lower than hypothesized (r ranging from .22 to .25; Table 2).
Pearson’s r Correlations With 95% Confidence Intervals.
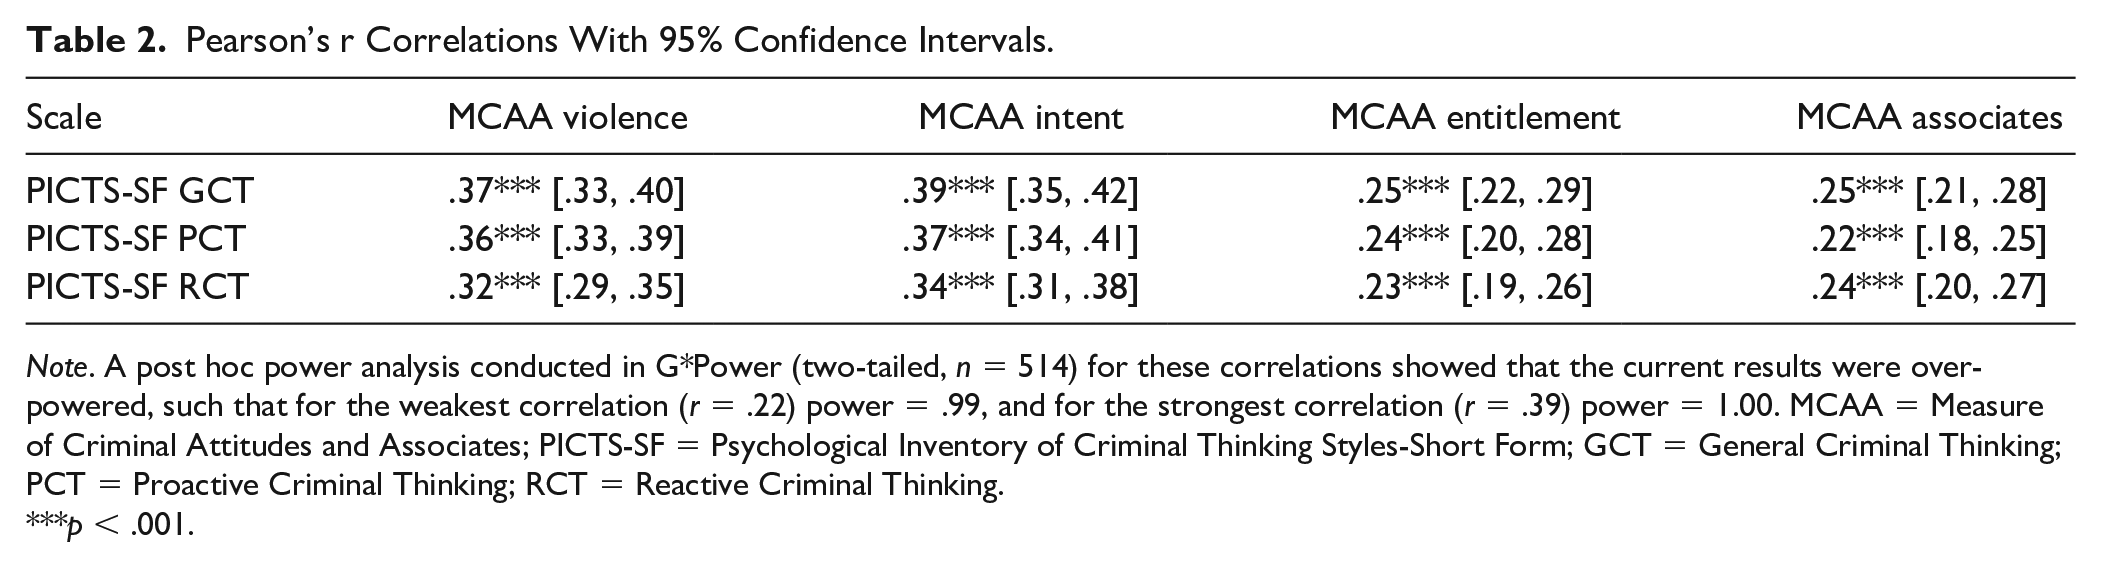
Note. A post hoc power analysis conducted in G*Power (two-tailed, n = 514) for these correlations showed that the current results were over-powered, such that for the weakest correlation (r = .22) power = .99, and for the strongest correlation (r = .39) power = 1.00. MCAA = Measure of Criminal Attitudes and Associates; PICTS-SF = Psychological Inventory of Criminal Thinking Styles-Short Form; GCT = General Criminal Thinking; PCT = Proactive Criminal Thinking; RCT = Reactive Criminal Thinking.
p < .001.
Structural Validity
The unidimensional PCT measurement model demonstrated acceptable fit (χ2 [135] = 397.45, p < .001, CFI = .90, TLI = .89, RMSEA = .06). No modification indices were provided to improve the model fit. Items 1, 4, 6, and 12 had the lowest parameter estimates (ranging from .27 to .32; see Table 1); without these four items, the model improved and demonstrated acceptable fit (χ2 [77] = 160.41, p < .001, CFI = .97, TLI = .96, RMSEA = .05).
The unidimensional RCT measurement model demonstrated good model fit (χ2 [119] = 311.62, p < .001, CFI = .95, TLI = .94, RMSEA = .06; see Table 1 for parameter estimates). No modification indices were provided to improve the model fit.
Finally, the second-order CFA structural model demonstrated acceptable fit (χ2 [559] = 1274.11, p < .001, CFI = .90, TLI = .89, RMSEA = .05; see Table 1 for parameter estimates), providing evidence for structural validity. When the second-order model was tested without the lowest parameter estimates from the unidimensional measurement model (items 1, 4, 6, and 12), the model produced six negative item variances and 70 suggested modification indices, indicating poor goodness-of-fit and an unacceptable model with these four items removed (see Byrne, 2005), despite acceptable fit indices (χ2 [404] = 861.64, p < .001, CFI = .93, TLI = .92, RMSEA = .05; see for example Gignac et al., 2005).
Discussion
The goal of Study 1 was to provide evidence for the internal consistency reliability and structural validity of the PICTS-SF. Results of Study 1 suggest the PICTS-SF offers a reliable and structurally consistent method for assessing criminal thinking. Using two measures of internal consistency, the current study’s evidence of the PICTS-SF’s reliability is consistent with reliabilities found in previous studies using the PICTS-SF (Batastini et al., 2019, 2020; Scanlon et al., 2022; Varghese et al., 2018). As hypothesized, the PICTS-SF GCT, PCT, and RCT subscales demonstrated discriminant validity with the MCAA Attitudes toward Violence and Antisocial Intent subscales, per significant, positive and moderate correlations. Although the PICTS-SF scales were also significantly, positively associated with the MCAA Attitudes toward Entitlement and Attitudes toward Associates subscales, these correlations (ranging from .22 to .25), and thereby the evidence of discriminant validity, were slightly weaker than hypothesized.
The unidimensional PCT model demonstrated poor-to-acceptable model fit. Upon further examination of PCT items, four items (1, 4, 6, and 12) were removed from the analysis due to low parameter estimates, resulting in acceptable model fit among the 31 items. However, items 1 (I will allow nothing to get in the way of what I want), 4 (The way I look at it, I’ve paid my dues and am therefore justified in taking what I want), 6 (I believe that breaking the law is no big deal as long as you don’t physically hurt someone), and 12 (When it’s all said and done, society owes me) appear to be clearly worded and theoretically tied to the construct of proactive criminal thinking—specifically, they are consistent with the hallmark intentional, antisocial thoughts that violate the rights or well-being of others (Walters, 2013). Therefore, despite statistical estimates indicating the removal of these items improves PCT model fit, there is also evidence supporting the retention of these items for theoretical meaningfulness in the construct of criminal thinking. In addition, items 1, 4, and 12 load onto the 8-item Entitlement scale; and item 6 loads onto the 2-item Mollification subscale and 10-item Self-Assertion/Deception scale. Although not tested in the current study, the removal of these items would also impact these thinking style scales. The unidimensional RCT demonstrated good model fit and required no modifications.
A second-order CFA of the 35-items demonstrated acceptable model fit and structural validity. Although model fit indices were further improved when items 1, 4, 6, and 12 were removed, the negative variances and number of suggested modification indices demonstrate the model without those four items is not acceptable. Additional tests in other samples are needed to continue the examination of the PICTS-SF. Although further examination of the PICTS-SF’s structure is needed, Study 1 provides preliminary evidence for the utility of this measure.
Study 2
To validate the results found in Study 1, and to evaluate the generalizability of the previous findings, a second series of analyses were conducted using a separate, unique correctional sample: 95 people placed in administrative segregation in prison. Importantly, people placed in administrative segregation constitute a unique subgroup within correctional populations, given evidence they higher levels of criminal risk compared to those housed in the general population (see for example O’Keefe, 2008). Therefore, this sample was chosen to confirm and expand the findings in Study 1.
Based on the results of Study 1, we evaluated the impact of removing items 1, 4, 6, and 12 on the reliability of GCT and PCT scales, as the four items load onto both scales. Although retaining the items may provide conceptually meaningful information in the construct of criminal thinking, the removal of these items could potentially improve the psychometric properties of these two scales in particular. The discriminant validity of the PICTS-SF was assessed by assessing the correlation between the instrument and a measure of pro-criminal attitudes: the Criminal Sentiments Scale-Modified. Finally, the reliability and the postdictive validity of the Historical content scale was also examined.
Method
Procedures
The [institution]’s IRB provided a letter documenting that IRB approval was not needed for Study 2, as the data were originally collected for program evaluation purposes and the program (which includes administration and review of PICTS-SF scores with clients for therapeutic goal setting and progress tracking) is part of standard clinical practice at the facility. The measures were administered at a maximum-security state facility within the Missouri Department of Corrections before and after participation in a treatment program. Participants were housed in administrative segregation and were approached for participation in the treatment program. The data presented in this study was collected between June 2018 and August 2019.
Participants
Study 2 analyses were conducted in unimputed data from 95 males incarcerated in prison. All respondents completed the PICTS-SF (along with other measures) as part of an intervention aimed at reducing criminal and mental health risk factors for persons placed in administrative segregation (see Batastini et al., 2020). Those who were incarcerated on this block are held in single cells for most of the day and are exposed to higher security, more restrictive conditions (e.g., limited recreational time, social contact, privileges). The sample included treatment completers (n = 45, 47.4%) and non-completers (n = 50, 52.6%). The majority of the sample were identified as Black (n = 69, 72.6%) and the remainder were White (n = 26, 27.4%). The sample’s average age was 32.7 years (SD = 10.87), and average sentence was 16.7 years (SD = 13.23), with 12 individuals documented as having a life sentence. In the sample, individuals had an average of .94 (SD = .41) previous placements in administrative segregation and 8.88 (SD = 15.00) previous disciplinary infractions (data on type, severity, and consequences of infractions were not available). Regarding previous offense type, the majority previously committed either a violent offense (n = 57, 60.0%) or a non-violent non-drug related offense (n = 34, 35.8%).
Measures
PICTS-SF
In this sample, the 35-item PICTS-SF (Walters, 2006; see Study 1 Measures) was administered to program participants prior to treatment implementation and, for treatment completers, after treatment (approximately 3 months after treatment initiation). For the psychometric properties of the PICTS-SF in Study 2, see Results.
Criminal Sentiments Scale-Modified
The Criminal Sentiments Scale-Modified (CSS-M; Shields & Simourd, 1991) is a 41-item measure of pro-criminal attitudes and beliefs associated with engaging in criminal activities. The measure includes five subscales: Attitudes Toward the Law (e.g., The law makes slaves out of most people for a few people on the top), Court (e.g., Almost any jury can be fixed), Police (e.g., The police are as crooked as the people they arrest), Tolerance for Law Violations (e.g., Most successful people broke the law to get ahead in life), and Identification with Criminal Others (e.g., People who have broken the law have the same sorts of ideas about life as me). In samples of justice-involved people, assessments of the measure’s psychometric properties have indicated that the instrument is both valid and reliable (Simourd, 1997; Skilling & Sorge, 2014). Previous evaluations of the CSS-M’s reliability found evidence of acceptable reliability; scales exhibited moderate (α = .51) to high (α = .87) internal consistency (Simourd & Olver, 2002). In addition, Simourd and Van de Ven (1999) found the CSS-M to be predictive of recidivism in a sample of violent offenders (adjusted R2 = .08). The internal reliability of the CSS-M was also found to be acceptable in this sample (Study 2), per alpha (α = .95, 95% CI = .94, .97) and omega coefficients (ω = .95, 95% CI = .94, .97). The inter-item correlations for this measure were also found to be acceptable (ρ = .25, 95% CI = .05, .43).
Data Analysis
Assumptions
Prior to conducting the analyses, the PICTS-SF GCT, PCT, RCT, and CSS-M scores were z-transformed to assess for outliers; none of the z-transformed scores for these scales were beyond|3.29| (Field, 2013), indicating there were no outliers. For the PICTS-SF Historical content scale, 24 respondents had z-transformed scores beyond|3.29| and were therefore removed as outliers. Because number of disciplinary infractions is a count variable, a Poisson distribution was used for the postdictive validity regression models.
Reliability
To validate Study 1 findings, internal consistency of the PICTS-SF was assessed by comparing the original 35-item instrument to the modified version following from Study 1’s findings. That is, items 1, 4, 6, and 12 were removed based on the Study 1 findings that these four items had low factor loadings, which is indicative of low discrimination parameters that will lead to more error in estimation. Removal of these items led to a 31-item version of the original instrument. The reliability of the instrument’s GCT and PCT scales was compared between the 35-item measure and the 31-item measure using ordinal omega and Cronbach’s alpha coefficients. As all four items belonged to the PCT scale, comparisons were not made with the RCT sale. As the postdictive validity of the Historical content scale was evaluated, the reliability of this subscale was also assessed. Reliability estimates were calculated in R using the userfriendlyscience package (Peters et al., 2018).
Discriminant and Postdictive Validity
Additional analyses assessed the discriminant and postdictive validity of the 35-item PICTS-SF. The discriminant validity of the 35-item PICTS-SF was assessed by evaluating the correlation between GCT scores, PCT scores, and RCT scores with the CSS-M, a measure of antisocial attitudes, using Pearson correlation coefficients. In addition, using a Poisson regression, the utility of the Historical content subscale as a predictor of the number of previous disciplinary infractions was evaluated.
Results
Reliability
The internal consistency reliability of the 35-item measure and 31-item measure were evaluated using ordinal alpha and omega coefficients. The 35-item measure GCT, PCT, and RCT scales demonstrated acceptable reliability, per alpha (αGCT = .94, 95% CI = .92, .96; αPCT = .89, 95% CI = .86, .93; αRCT = .92, 95% CI = .91, .95) and omega coefficients (ωGCT = .94, 95% CI = .93, .96; ωPCT = .90, 95% CI = .86, .93; ωRCT = .93, 95% CI = .91, .95). For the 31-item measure, analyses also indicated acceptable reliability per the alpha (αGCT = .94, 95% CI = .92, .96, αPCT = .89, 95% CI = .86, .92; no items were removed from the RCT scale) and omega coefficients (ωGCT = .94, 95% CI = 92, .96; ωPCT = .89, 95% CI = .86, .92). The average inter-item correlations for the 35-item measure were found to be acceptable (Spearman’s ρ = .25, 95% CI = .05, .44); similar results were found for the RCT (ρ = .34, 95% CI = .15, .52) and PCT subscales (ρ = .25, 95% CI = .05, .44). Results were not markedly different for the 31-item measure (ρ = .28, 95% CI = .07, .46) or modified PCT subscale (ρ = .29, 95% CI = .09, .48). The internal reliability of the Historical content scale was also found to be acceptable (α = .88, 95% CI = .85, .92; ω = .89, 95% CI = .85, .92; ρ = .32, 95% CI = .11, .49). As previous analyses did not indicate improved reliability after excluding the aforementioned four items, all subsequent PICTS-SF analyses were conducted using the 35-item version.
Discriminant Validity
The discriminant validity of the PICTS-SF was examined by evaluating the correlation between the CSS-M total scores and the following: GCT, PCT, and RCT scale scores. Both the PICTS-SF and CSS-M were administered during the course of the study. The PICTS-SF GCT (r = .38, 95% CIs [.18, .57], p < .001), PCT (r = .34, 95% CIs [.19, .54]), p = .001), and RCT scale scores (r = .30, 95% CIs [.09, .48]), p = .004) were significantly, positively associated with the CSS-M total scores, indicating a positive relationship of moderate strength between the GCT and PCT scales with the CSS-M total scores. The direction and strength of these relationships are similar to those found in another sample when assessing correlation between the 80-item PICTS and the CSS-M: PICTS-SF GCT (r = .36, p < .001), PCT (r = .38, p < .001), and RCT scale scores (r = .26, p < .001; see Morgan et al., 2010 for sample characteristics). Comparisons of these correlation coefficients found them to not be significantly different, with p-values ranging from .74 to .85.
Postdictive Validity
The postdictive validity of the Historical content scale was evaluated by using the scale to predict previous disciplinary infractions. After removing outliers, the Historical content scale was evaluated to determine if reports of past pro-criminal thinking were postdictive of past behaviors. Using a Poisson regression, the postdictive validity of the Historical content scale was assessed using the number of previous disciplinary infractions as an outcome variable. Results indicated a significant relation between number of previous disciplinary infractions and scores on the Historical content scale (χ2[1] = 28.16, p < .001). As such, the estimated increase in log count for a one-unit increase on the Historical content scale is 1.04 (95% CIs [1.03, 1.06]).
Discussion
Study 2 expanded on Study 1 by determining the impact of removing items with the lowest loadings on the reliability and validity of the scale. Items 1, 4, 6, and 12 were removed given Study 1’s finding that these items had the lowest factor loadings (.28, .32, .34, and .29, respectively). Results from Study 2 on the reliability of the 31-item PICTS-SF yielded similar results to the 35-item measure. These similar findings between the 31-item scale and 35-item scale suggest that removal of items 1, 4, 6, and 12 neither significantly improve nor worsen the reliability of the PICTS-SF. Therefore, as proposed in Study 1, we recommend these items be retained due to their theoretical meaning to the constructs of proactive and general criminal thinking.
Study 2 findings also provided further support for the discriminant and postdictive validity of the 35-item PICTS-SF. The PICTS-SF GCT, PCT, and RCT scales showed evidence of discriminant validity with a measure of antisocial attitudes in a prison population. In addition, the PICTS-SF Historical content scale demonstrated postdictive validity of receiving disciplinary infractions, suggesting that a one-unit increase in scores on the Historical content scale is associated with about a 1% increase in disciplinary infractions. Therefore, this result suggests that the Historical content scale does assess past criminal thinking given its relationship with past behaviors although this may be limited in scope; considering the small effect size, the utility of the Historical subscale may be somewhat limited when conducting retrospective evaluations of antisocial behaviors.
General Discussion
The current studies were the first psychometric investigation of the reliability and validity of the PICTS-SF, a measure that is commonly used in clinical work and research (Walters, 1995, 2003). Using two independent samples of justice-involved people in a residential treatment facility (n = 514), and a state prison (n = 95), results from Studies 1 and 2 provide general support for the reliability (internal consistency) and validity (discriminant, postdictive, and structural) of the PICTS-SF. Collectively, results suggest the PICTS-SF is acceptable for use with multiple subpopulations of individuals with offending histories, including those in administrative segregation—a population that is generally considered higher risk and is rarely included in psychometric research, even when tools are intended for justice-involved people or to assess constructs relevant to criminal conduct.
In Studies 1 and 2, we found evidence of the 35-item version of the PICTS-SF’s internal consistency reliability, using both alpha and omega estimates, similar to that found in previous studies (Batastini et al., 2019, 2020; Gaspar et al., 2019; Scanlon et al., 2022; Varghese et al., 2018). We also found evidence for discriminant validity with two measures of the similar but distinct construct of antisocial attitudes: the MCAA and CSS-M. Consistent with our hypotheses, the PICTS-SF scales were significantly, positively, and moderately correlated with the CSS-M total score, MCAA Attitudes toward Violence, and MCAA Antisocial Intent. Although also positive and significant, the correlations between the PICTS-SF scores and the MCAA Attitudes toward Entitlement and Attitudes toward Associates scales were small to moderate, slightly weaker than hypothesized. Of the three PICTS-SF scales, the MCAA Attitudes toward Entitlement scale was most strongly associated with the GCT scale, approaching a moderate correlation (r = .25); this finding is consistent with previous research suggesting entitlement has a generalized relationship with various dimensions of criminal thinking, as opposed to a strong relationship with any specific dimension (Mills et al., 2002; Walters, 1995). For the MCAA Attitudes toward Associates scale, the weaker correlation may be due to the scale’s specific focus on interpersonal relationships, a component of antisocial attitudes that is not captured by the PICTS-SF scales.
A CFA demonstrated the PICTS-SF GCT and RCT scales had acceptable model fit, while the PCT scale demonstrated poor-to-acceptable model fit. These factor structure findings, which are roughly consistent with the theoretical hierarchical structure of criminal thinking and prior factor analyses of the PICTS (Walters et al., 2011), provide preliminary evidence for the structural validity of the PICTS-SF GCT and RCT scales, but not the PCT scale. It should be noted that the standard errors of the items on the PCT factor are larger than those on the RCT in the second-order model, indicating responses to PCT items have more variability and are less precise. If similar patterns are observed in future research of the PICTS-SF’s PCT scale, it may be important to statistically and theoretically assess the reasons for increased variability in observed items that are designed to capture proactive criminal thinking.
The four items with the lowest factor loadings in Study 1 were removed (items 1, 4, 6, 12), producing a 31-item version of the PICTS-SF. Much like the 35-item measure, the 31-item version demonstrated acceptable internal consistency; however, the marginal improvements in model fit indices in Study 1, coupled with negative variances and many suggested modifications, indicate removal of these items is not appropriate. Because there is not an added benefit to using the 31-item version of the measure, we suggest the original 35-item PICTS-SF.
Cumulatively, the current findings provide preliminary evidence for the use of the 35-item PICTS-SF for some research and clinical purposes. Because the current study did not examine the PICTS-SF’s test–retest reliability to measure consistency in changes of criminal thinking over time, we recommend the 80-item version of the PICTS for assessing treatment change. In addition, until there is further testing of and evidence for the use the PICTS-SF, the PICTS is suggested for use in clinical assessments associated with high risk and significant consequences (i.e., criminal risk assessments). However, the PICTS-SF appears to have sufficient reliability and validity for cross-sectional research and clinical assessment of the construct of criminal thinking.
Limitations and Suggestions for Future Research
Although the current examination of the PICTS-SF provided important preliminary support for its use, continued research on the PICTS-SF psychometric properties is needed, especially given limitations of these studies. Aside from the notable benefit of shorter completion time and reduced respondent burden, data from the PICTS were not available to test whether the PICTS-SF provides similar content coverage as the full PICTS, which is a limitation. Another limitation is that the samples used in Study 1 and Study 2 were not sufficiently large to have separate test and validation samples within each study. Although Study 2 was designed to act as a pseudo-validation of Study 1’s findings, future studies should replicate the current, second order factor structure with a larger sample and also assess test–retest reliability. Finally, the high rates of missing demographic data in Study 1, the relatively small sample in Study 2, and the specific subpopulations used in these studies (i.e., people, mostly men, on probation or in prison segregation) do not permit conclusions about the samples’ representativeness of the larger population of men and women involved in the criminal justice system.
Continued evaluation of the PICTS-SF as a measure for research and clinical use is needed as there is not yet empirical support for the test–retest reliability of the measure, although the PICTS-SF has been used to test treatment change over time (Gaspar et al., 2019). The PICTS is often used in assessments and research to help inform risk and management decisions, so it is particularly important that the PICTS-SF’s validity is more rigorously tested before it is considered for use in any predictive capacity. Relatedly, the current finding on postdictive validity was conducted on one scale and was significant, though with a small effect size; future research can continue to expand the validity evidence for PICTS-SF scales (including and beyond the Historical scale).
Such validity testing may include traditional approaches (e.g., content, discriminant validities) or Borsboom and colleagues’ (2004) causal approach to testing “whether the attribute to be measured produces variations in measurement outcomes” (p. 1069). Consequential validity (i.e., implications of the measure’s use; Messick, 1995) with the PICTS-SF may be the most important area for future research. Furthermore, the consequences of the test’s use and results must be considered to ensure no groups (e.g., gender, race, age) are differentially impacted by the measure’s results (see Hubley & Zumbo, 2011).
Although beyond the scope of the current study, testing group differences (e.g., race, ethnicity) and potential biases through differential item functioning in the PICTS-SF is an important next step in gaining confidence in the measure’s valid and responsible use. Given the evidence for gender differences in offending trajectories and increased calls for gender-responsive treatment and assessments among justice-involved people (see Brennan et al., 2012; Covington, 2007), it is imperative that gender differences in responding to this measure of criminogenic risk are tested. The PICTS was published in 1995, at which time males comprised almost 90% of the correctional population in the U.S. (Gilliard & Beck, 1996). As the rates of incarcerated women continue to increase, it becomes increasingly obvious that the PICTS (and by extension the PICTS-SF) was developed and normed in a qualitatively different time in the U.S. criminal justice system. It is necessary to test that this measure sufficiently captures criminal thinking for women and other minority groups in the justice-involved population.
Conclusion
In conclusion, there is now empirical evidence to support the continued use of the PICTS-SF’s GCT total score and PCT and RCT composite scores as a measure of criminal thinking styles for clinical and research purposes; however, the results of these studies do not support the use of the PICTS-SF for some clinical purposes, such as measuring treatment change or predicting criminal risk. There is still much work to be done in the continued examination of the measure’s reliability, validity, and group differences in other samples. Psychologists in forensic and correctional psychology have been recently urged to consider not only the questions they seek to answer with the assessments they choose, but also the support for and implications of those assessments (Neal et al., 2019). It is important that the PICTS-SF, a briefer and therefore more convenient version of the widely used and accepted PICTS, is subject to those same considerations for use in research, assessment, and treatment with people involved in the criminal justice system.
Footnotes
Declaration of Conflicting Interests
The author(s) declared no potential conflicts of interest with respect to the research, authorship, and/or publication of this article.
Funding
The author(s) received no financial support for the research, authorship, and/or publication of this article.
Public Significance Statement
This psychometric evaluation of the Psychological Inventory of Criminal Thinking Styles—Short Form provides support for using this instrument to measure criminal thinking in research and clinical work with adults involved in the criminal justice system.