
Abstract
Are city governments capable of responding to the preferences of their constituents? Is the menu of policy options determined by forces beyond their direct control? We answer these questions using a comprehensive cross-sectional database linking voter preferences to local policy outcomes in more than 2,000 midsize cities and a new panel covering cities in two states. Overall, our analysis paints an encouraging picture of democracy in the city: we document substantial variation in local fiscal policy outcomes and provide evidence that voter preferences help explain why cities adopt different policies. As they become more Democratic, cities increase their spending across a number of service areas. In addition, voter sentiment shapes the other side of the ledger, determining the level and precise mix of revenues on which cities rely. In short, we show that cities respond both to competitive pressures and the needs and wants of their constituents.
Introduction
Although national and state elections often attract the greatest attention from the media and public, much of the policy making that directly affects voters on a daily basis takes place at the local level in the American political system. Cities, in particular, control a number of vital public functions—including law enforcement, fire protection, land use, and transportation—that affect the public health, safety, and quality of life in real and often dramatic ways. Many observers praise the decentralized U.S. federal system that delegates substantial political authority to the local level, arguing that making policy in a number of smaller jurisdictions provides constituents with the benefits of choice (Ostrom, Tiebout, and Warren 1961; Tiebout 1956), enhances oversight and accountability by bringing policy making closer to the people (Fisman and Gatti 2002), and creates “laboratories of democracy” that encourage experimentation and eventual diffusion of effective policies and best practices (Shipan and Volden 2006). 1
Despite the salience and importance of municipal public services, there remain outstanding questions about the quality of democratic representation in local government. Many leading theories of urban politics raise doubts about whether city officials have the tools to respond to the preferences of their constituents and suggest instead that the menu of available policy options is effectively determined by forces beyond their control. Indeed, cities are buffeted by both horizontal constraints—including competition from surrounding communities—and vertical checks from higher levels of government that may limit their capacity to effectively respond to public concerns (e.g., Peterson 1981; Tiebout 1956). In this article, we provide a broad assessment of democratic representation in America’s cities.
Our empirical analysis relies on two new sources of data that represent important improvements over what has previously been available to scholars. The first data set represents the most comprehensive and detailed database linking voter preferences to local policy outcomes covering more than 2,000 midsize cities and is constructed by aggregating precinct-level presidential results across nearly 40 states. Using a rich set of control variables, we carry out a detailed cross-sectional analysis of city policy responsiveness and document the extent to which constituent preferences drive policy outcomes. Unlike scholars who have relied on rough proxies of local voter preferences (e.g., Bouché and Volden 2011; Choi, Turner, and Volden 2002; Craw 2010; Hajnal and Trounstine 2010), we are able to use these precinct data to construct direct measures of local partisanship at the city level. This permits us to expand our analysis to a much larger number of jurisdictions and measure voter preferences much more precisely than has previously been the case (e.g., Palus 2010). Although our modeling strategy accounts for potential omitted variables in the cross-sectional design, we provide further evidence to support our initial findings by separately analyzing panel data covering cities in two states over a three-decade period, representing to our knowledge the first such longitudinal examination of city government responsiveness. The panel data allow us to examine how policies evolve as voter preferences change over time and to account for other difficult-to-measure, time-invariant city-level contextual factors.
Both sets of analyses paint a consistent and encouraging picture of local democracy. We document tremendous variation in local fiscal policy outcomes and provide evidence that voter preferences play an important role in explaining why cities adopt different policies. As they become more Democratic, cities increase their spending across a number of service areas; voter sentiment also shapes the other side of the ledger, determining the level and precise mix of revenues on which local governments rely. Cities in which voters support Democratic candidates at higher rates adopt more progressive forms of taxation, reducing their reliance on regressive sales taxes. They also pursue intergovernmental aid more aggressively, using these funds to supplement local revenue sources and increase the level of services. The fact that voter preferences affect the extent to which cities seek out intergovernmental grants provides an answer to the apparent puzzle of why local governments fail to respond to transfers from other levels of government by reducing their own revenues, as economic theory suggests they should—a puzzle known as the “flypaper effect” in the public finance literature.
Equally importantly, however, we find evidence that broader competitive and intergovernmental forces constrain local responsiveness. Although Democratic cities bring in more intergovernmental aid, we show that they appear to be limited in their ability to raise the local tax burden by increasing local tax receipts. We also find surprisingly limited variation in the amount of redistributive spending carried out by city governments. In short, the data suggest that cities are mindful of competitive pressures but can and often do successfully overcome external constraints to respond to the needs and wants of their constituents.
We begin by reviewing the relevant theoretical and empirical research. Many influential models of local politics conclude that external forces limit the ability of city officials to respond to their constituents’ preferences. Next, we describe the data sources we use to build our new data set on voter partisanship in American cities. We then we apply our new measures to document empirically the relationship between local partisanship and policy outcomes for a large number of midsize American cities. The conclusion describes the implications of our findings for American democracy.
Constraints and Representation in City Government
Since the 1970s, political parties have come to play an increasingly central role in American politics. National parties regularly stake out distinct platforms on the most salient issues of the day, particularly in the era of rising partisan polarization (Abramowitz 2010; Gerring 2001; Hacker and Pierson 2010; Jacobson 2003; McCarty, Poole, and Rosenthal 2006). Party affiliation among voters is a key predictor of voting behavior on Election Day (Campbell et al. 1960). It serves both as an important heuristic for sorting through complex policy positions (Popkin 1994) and as a social identity shaped by voters’ views and opinions (Green, Palmquist, and Shickler 2002).
Nevertheless, much—but not all—of the scholarship on local politics either overlooks or expressly dismisses the role of partisanship in local government.
2
In their classic book, Banfield and Wilson (1963) asserted that, in local elections, “the party as such seldom has any concrete program or platform” (p. 277). Writing about an earlier period of urban party machines, Sorauf (1980) concluded, The American [local party] machine has no membership base, and it has few, if any, ideological concerns. Its focus on the immediate needs of its constituents has driven the urban machine to look almost completely inward and to ignore the issues and ideologies of the political world beyond. It is provincially concerned with the city, and its politics are almost completely divorced from the issues that agitate our national politics. (p. 70)
In addition to claims that local issues are inherently nonpartisan, scholars also point to political and economic constraints that limit the discretion of local policy makers and can, thus, thwart partisan policy goals. Some are vertical, resulting from local governments’ subordinate legal status as “creatures of the state” (Frug 1979). This legal context sometimes places cities at the whim of state legislatures (Desmond 1955; Gamm and Kousser 2013). 3 Since the late 1970s, many cities have also faced binding state-imposed tax and expenditure limits (TELs) (Brooks and Phillips 2010; Mullins and Wallin 2004). These vertical limitations impose uniform policies on local governments and reduce their ability to respond to their constituents’ diverse tastes (see, for example, Vigdor 2004).
Partly in response to challenges in raising new local revenues, municipal governments have come to rely on intergovernmental aid for a substantial, albeit declining, share of their revenues (Sokolow 1998). Although transfers from higher-level government have helped cities adjust to fiscal scarcity, they have also had the indirect effect of centralizing control at the state and federal level because of their highly conditional nature. When cities accept state or federal money, they usually must agree to expend it only on preapproved purposes and, in many instances, “match” these funds with additional local spending (e.g., Advisory Commission on Intergovernmental Relations 1996; Derthick 1970), further reducing local discretion.
The process of competition among neighboring cities to attract and retain scarce resources creates a second set of horizontal constraints. Peterson (1981) described how jurisdictional competition among local agencies can effectively limit the discretion available to local officials, particularly on economic and redistributive issues. Competition, and the mere threat thereof, is often said to push all cities toward policy convergence regardless of their voters’ or leaders’ preferences. 4
These competitive pressures impose severe limits on the scope of local policy making, helping to explain the “lack of a distinctive partisan impact on local policy outcomes” (Peterson 1981, p. 174). In the context of fiscal policy, Peterson argued that competition among cities effectively precludes redistribution because wealthy taxpayers and business owners have a credible exit option they can use to avoid intolerably high local tax burdens. “The politics of redistribution at the local level,” Peterson wrote, is thus an arena where certain kinds of citizen needs and preferences seldom become demands; an arena where redistributive questions, even when posed as major political issues, are treated by a variety of strategies designed to forestall, delay, and preclude their implementation. (p. 182)
5
For all of these reasons, a number of scholars have concluded that municipal elected officials—and their constituents—exercise minimal influence over local fiscal policy. In their textbook on city government, for example, Judd and Swanstrom (2012) wrote, “City spending is driven by powerful forces that are largely beyond the control of local officials and voters” (p. 331). Despite a strong theoretical expectation of policy convergence, the influence of partisanship on local policy outcomes has been subject to only limited empirical investigation. Much of the scholarly work reports mixed findings. Early studies (Brazer 1959; Fried 1975) focus almost exclusively on apolitical determinants of local budgetary policy (more recently, see Minkoff 2012). By contrast, others report substantial variation in policy across cities, some of which appears to be explained by local political considerations (Clark and Ferguson 1983; Dahl 1961; DeLeon 1992; Hajnal and Trounstine 2010; Palus 2010; Stoker and Mossberger 1994; Stone and Sanders 1987).
The central challenge, however, is the absence of comparable measures of voter sentiment for a sufficiently large number of cities. National public opinion surveys include few, if any, respondents from any given city, making disaggregation of many surveys—one of the main approaches used in the state politics literature—impractical at the city level. Scholars usually turn to the next-best option: finding useful proxies that are correlated with local preferences. For example, Craw (2010) used racial and ethnic demographics as a proxy for political preferences. Lubell, Feiock, and Rameriz (2009) looked at enrollment in Florida’s commemorative license plate program to discern local voters’ taste for environmental protection. Others, including Bouché and Volden (2011), simply take local policy outcomes and treat them as the voters’ revealed preferences.
Most frequently, however, scholars use the results from the most recent presidential election aggregated at the level of county for the county in which each city is located (e.g., Choi, Turner, and Volden 2002; Craw 2010; Hajnal and Trounstine 2010; Minkoff 2012). As cities are rarely, if ever, perfect microcosms of their surrounding counties, this approach introduces a nonclassical measurement error on the main independent variable of interest, biasing the coefficients produced by the analysis (Fox 1997). In the supplemental appendix, we provide a more detailed discussion of this problem and quantify the degree of bias introduced with this approach. Although not the main focus of our exposition here, we believe that documenting the bias caused by the use of county-level proxies represents an important empirical and methodological contribution and refer interested readers to the supplemental appendix.
In sum, most published studies on municipal politics focus on a relatively small number of very populous—and, thus, heavily Democratic and unrepresentative—cities and rely on imprecise proxies to measure voter preferences, limiting the broader conclusions that can be drawn from them. 6 There is one exception, however. Since our study began to circulate, another noteworthy article by Tausanovitch and Warshaw (2014) has appeared that uses a simulation-based empirical strategy to examine policy responsiveness in city government, focusing primarily on environmental policies. The article uses multilevel regression with poststratification (MRP), a recently popularized statistical method used in the state politics literature (e.g., Lax and Phillips 2009; Park, Gelman, and Bafumi 2004), that offers an alternative approach to measuring local policy preferences. In general, our analysis of local fiscal policy echoes the broad findings of Tausanovitch and Warshaw, who documented similar levels of policy responsiveness in fiscal and other policy domains. 7
In addition to replicating this important result, our study makes several original contributions. First, we identify intergovernmental revenues as an important mechanism that allows city governments to successfully pursue budgetary priorities valued by their constituents. Second, we go beyond cross-sectional comparison—the only type of analysis possible with the simulation-based approach—to examine how policy evolves over time in response to changing constituent preferences. As we note below, our use of panel data represents an important improvement by allowing us to rule out alternative explanations, including residential sorting. Nevertheless, we view both approaches as complementary and believe that they have much to add to our understanding of local politics.
Policy Responsiveness in Municipal Government: New Evidence
Our analysis makes use of a new data set containing information on city-level partisanship, our central independent variable of interest, to assess policy responsiveness in American cities. We measure local partisanship by relying primarily on precinct-level results from the 2008 presidential election. Precinct data are taken from the Harvard Election Data Archive (Ansolabehere and Rodden 2011), which aggregates election results reported by various state and local agencies for the 2008 presidential election into standardized Census “voting tabulation districts” (VTDs). We combine these results with precinct-level and city-level Census block assignment files, which allow us to match each precinct to the city in which it is located (if any). For several states not included in the Harvard Election Data Archive, we utilize other information sources, resulting in a final data set that includes nearly every municipality in 38 states. The specific sources and our geospatial matching protocol are described in detail in the supplemental appendix. We have made the final data set of city-level presidential election results available on the authors’ websites. 8
Because precinct-level data covering a large number of states and counties are available in a consistent format only for the 2008 election, our initial analysis focuses on cross-sectional comparison. In the next section, we replicate our key findings by analyzing a subset of our cases for which panel data are available from other sources.
By assigning electoral precincts to the cities that contain them, we achieve a remarkable degree of geographic and demographic coverage, including dense central cities, suburbs, and rural villages from all regions in the country. As a result, the city-level presidential vote shares exhibit significant variance across cities—an important improvement over most existing studies, whose data feature a disproportionately Democratic skew as a consequence of focusing on the largest urban centers. Figure 1 reports the distribution of the independent variable, documenting substantial variation in support for Barack Obama among the approximately 2,600 cities in our sample. 9 Indeed, while cities are popularly perceived as being heavily Democratic enclaves, our data reveal a sizable share of Republican-dominated municipalities. In the 2008 election, for example, John McCain carried roughly 40% of the cities in our sample.

Distribution of the city-level presidential vote share from the 2008 presidential election.
Although we are interested in representation writ large, our analysis examines local fiscal policy because comparable measures on this dimension are available for a large number of municipalities. By focusing on the policy dimensions along which cities are thought to be most constrained, our empirical strategy, thus, stacks the deck in favor of the policy convergence hypothesis. Responsiveness on questions of spending and taxation, in other words, would provide strong evidence that cities are generally capable of translating the preferences of their constituents into differentiated policy outputs. To measure local government fiscal policies, we take advantage of a wide array of data from the 2007 Census of Governments, the release most temporarily proximate to the 2008 election. 10 The Census data include information on total spending, expenditures broken down by category of public services, and details about city revenue sources. If city government is responsive, we would expect that cities with more Democratic voters will, on average, spend more and derive their revenues from more progressive sources (e.g., property rather than sales taxes) 11 than cities with many Republicans. These expectations are grounded in research linking Democratic identification with support for larger government, higher redistributive spending, and more progressive forms of taxation (Bartels 2008; Petrocik 1996; Petrocik, Benoit, and Hansen 2003).
Our analysis focuses only on core operational expenditures—the provision of typical municipal services on a day-to-day basis. We exclude spending on capital projects, which likely reflect a number of unrelated factors and decisions made years earlier, along with spending by “enterprise” departments such as ports, airports, and energy utilities. We examined two different kinds of fiscal dependent variables: levels and relative priorities. The former calculates the dollars spent (or revenues raised) per person in a given municipality. In our data set, the average municipality spent US $971 per person in fiscal year 2007. The latter measures divide spending or revenue in each service category by the city total; rather than focusing on levels of taxation or expenditures, they assess how various services and sources are prioritized relative to others. Because we found no differences between cities on these compositional spending measures, we do not report the results using these dependent variables below. 12
Our sample includes midsize cities, with a population of at least 10,000 but no more than 500,000. We exclude small jurisdictions because these municipalities are likely to contract out for services from larger neighbors or take advantage of regional special-purpose agencies for the provision of major public-safety and related services (Burns 1994). Spending by such agencies would not be included in the Census finance statistics for the cities themselves, preventing us from drawing an accurate fiscal portrait of their budgets. We also exclude major urban centers because existing research suggests that these large “mega” cities—which tend to be overwhelmingly Democratic and, thus, do not vary on our key independent variable—follow different spending priorities and collect revenue in unique and idiosyncratic ways (see Judd and Swanstrom 2012, Chap. 12). Including cities with more than 500,000 does not substantively change the findings reported below, however.
Table 1 reports descriptive statistics for our sample using the 2009 American Community Survey and compares them with the broader population of U.S. cities. Not surprisingly, given our exclusion of small municipalities, the cities in our sample are larger than the average, although they show impressive diversity on all major social, economic, and geographic factors. More importantly, our sample includes more than 90% of all midsize American cities (2,616 in our sample out of 2,857 total) and is virtually indistinguishable from this broader group. Overall, the cities in our sample are home to nearly 110,000 million people, representing to our knowledge the most comprehensive collection of political and financial information about local governments that is available. The supplemental appendix includes a map showing the location of each city included in our analysis.
Comparison of Sample Means with Other U.S. Cities.
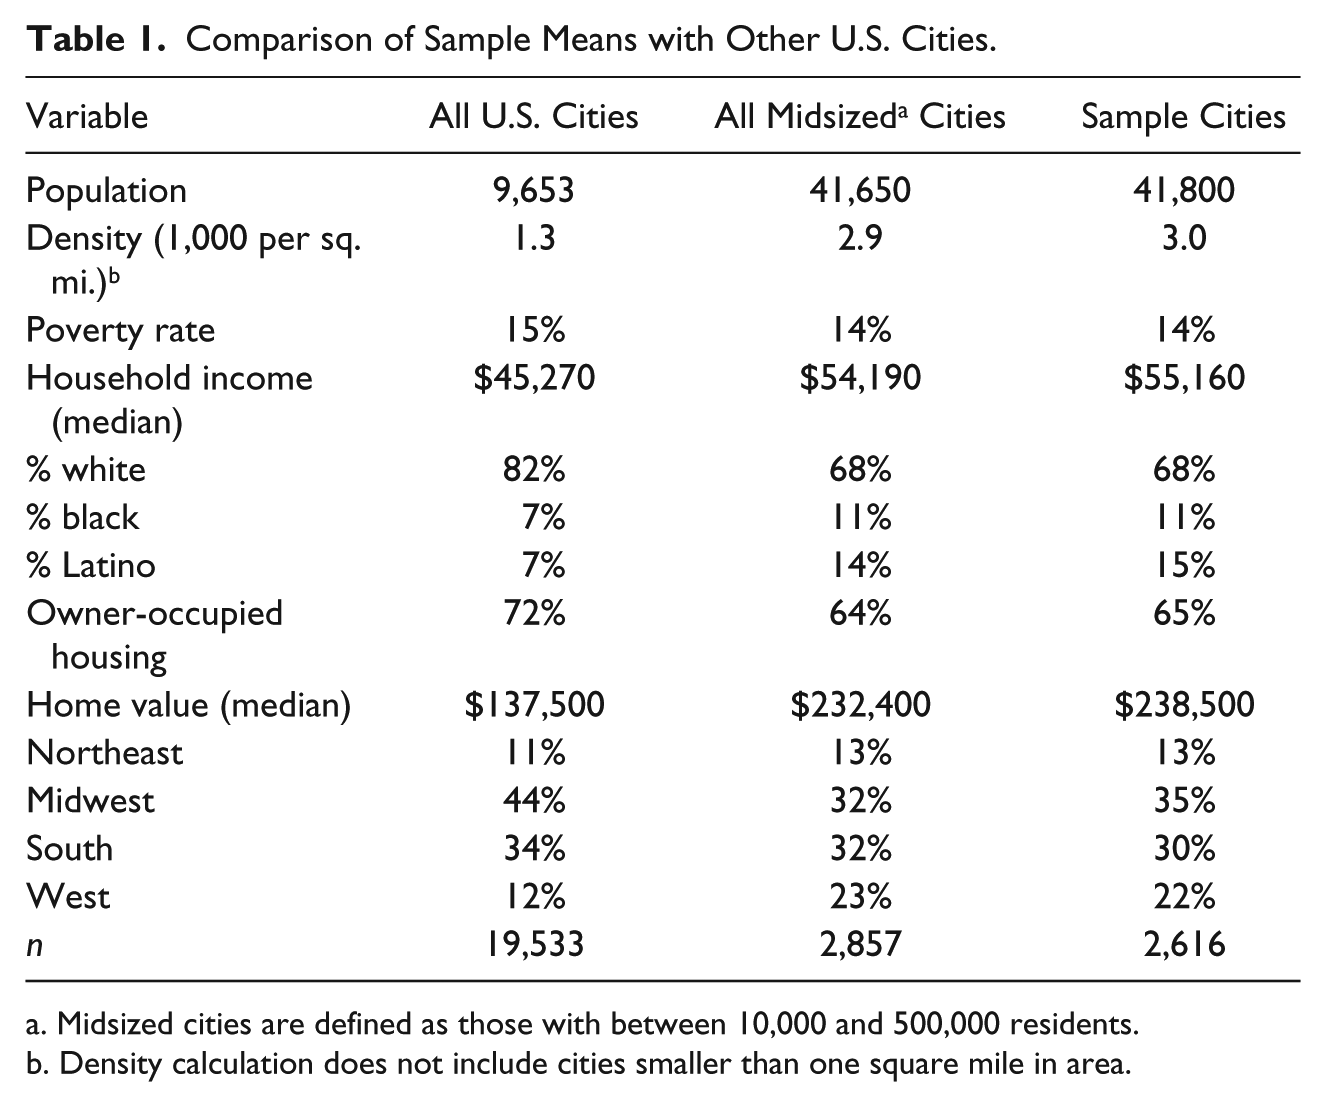
Midsized cities are defined as those with between 10,000 and 500,000 residents.
Density calculation does not include cities smaller than one square mile in area.
Because we measure voter attitudes through behavior in presidential elections, an important consideration is whether national partisan divisions are relevant for city policies. Perhaps local political debates take place along different dimensions than the liberal–conservative divide animating national politics, as some scholars have argued (e.g., Schleicher 2007). On this score, two questions from the 2012 Cooperative Congressional Election Study prove informative. Although both questions focus on state, rather than local, government, they directly tap voter attitudes toward the types of public finance issues we examine in our study. The first question asked voters how they would prefer to close a hypothetical deficit in the state budget, asking them to choose some mix of service reductions and tax increases, whereas the second offered the choice between raising income and sales taxes. As Figure 2 shows clearly, responses to these questions fell sharply along partisan lines. Self-identified Republicans, for example, preferred to close almost 75% of the deficit through service cuts, whereas Democrats indicated that the majority of the gap should be addressed through higher taxes. Republicans also overwhelmingly favored sales over income taxes, with the opposite true among Democrats. In the supplemental appendix, we show that national partisan affiliations predict voter attitudes on a number of other local policy issues, including support for charter schools, willingness to use public transit, and views about public employee compensation and collective bargaining rights. Local politics, in short, remains closely tethered to broad national divisions in the minds of many voters.
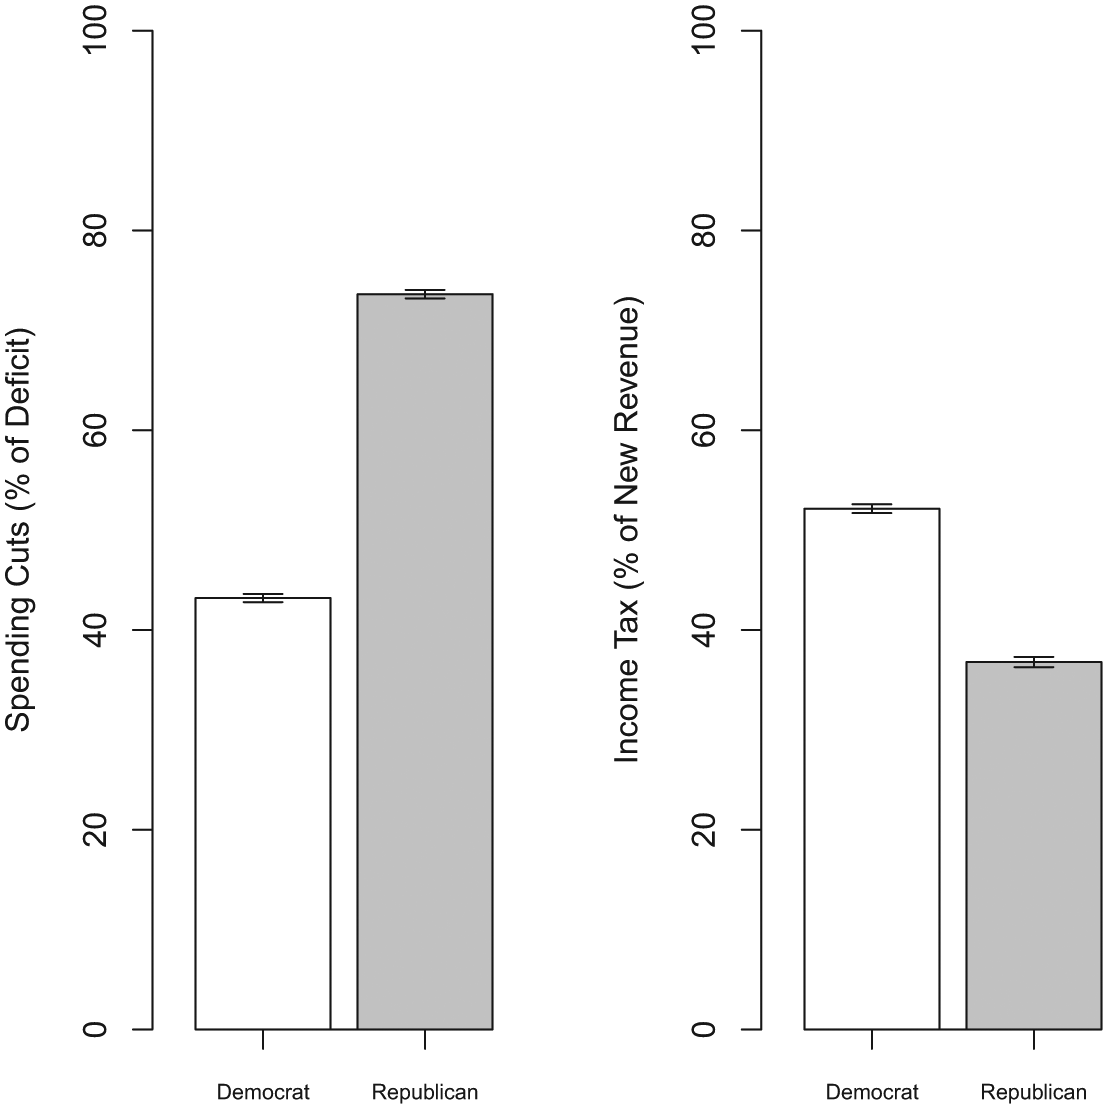
Partisan divisions over fiscal policies.
Cross-Sectional Results
To estimate the relationship between local voter partisanship and city policy outcomes, we account for a myriad of confounding variables that might produce a spurious correlation between our independent and dependent variables of interest. We therefore control for virtually every municipal demographic variable for which we could collect the necessary data. 13 These municipal characteristics include household income, housing values, poverty, unemployment, racial composition, urban status, density, commuting time, rates of home ownership, and local property and violent crime rates. 14 To account for possible economies of scale in service provision, we also control for the natural log of city population. Finally, all of our models include state fixed effects. 15 As legal “creatures of the state,” municipalities only possess the powers to tax and spend delegated to them by their state legislatures and constitutions, creating important constraints in terms of the fiscal policies available to municipal governments. 16 The inclusion of state fixed effects, thus, ensures that our models exploit only variation in municipal policies within states, after accounting for these constraints.
We estimate ordinary least squares (OLS) regressions to assess the relationship between Democratic vote share in each municipality and local spending and revenue decisions. To address heteroskedasticity, all models report Huber–White standard errors. The key question in our investigation is the extent to which city-level partisanship can explain variation in local fiscal policy. We first present results for spending before discussing the revenue models. In each case, we present the findings in several ways. In Tables 2 to 5, we report the β coefficients, which correspond to the predicted change in per-capita spending or revenue for each percentage-point increase in Obama vote share, as well as a measure of statistical uncertainty for the effect. In addition, we report the change we would observe by increasing pro-Obama votes from the average level observed in a city won by John McCain in 2008 to the average Obama vote margin among the cities he carried, corresponding to a roughly 25 percentage-point increase in the share of votes won by the Democrat. This should be interpreted as the expected effect of moving from a typical Republican city to an average Democratic city. 17 Finally, we show how this effect compares with the mean level of spending and revenue among all of the cities in our data set. To conserve space, our discussion and tables focus only on our key independent variable of interest. However, all models are estimated with the full battery of controls and state fixed effects, and the full results are presented in the supplemental appendix.
Impact of Democratic Support on City Spending (Per-Capita).
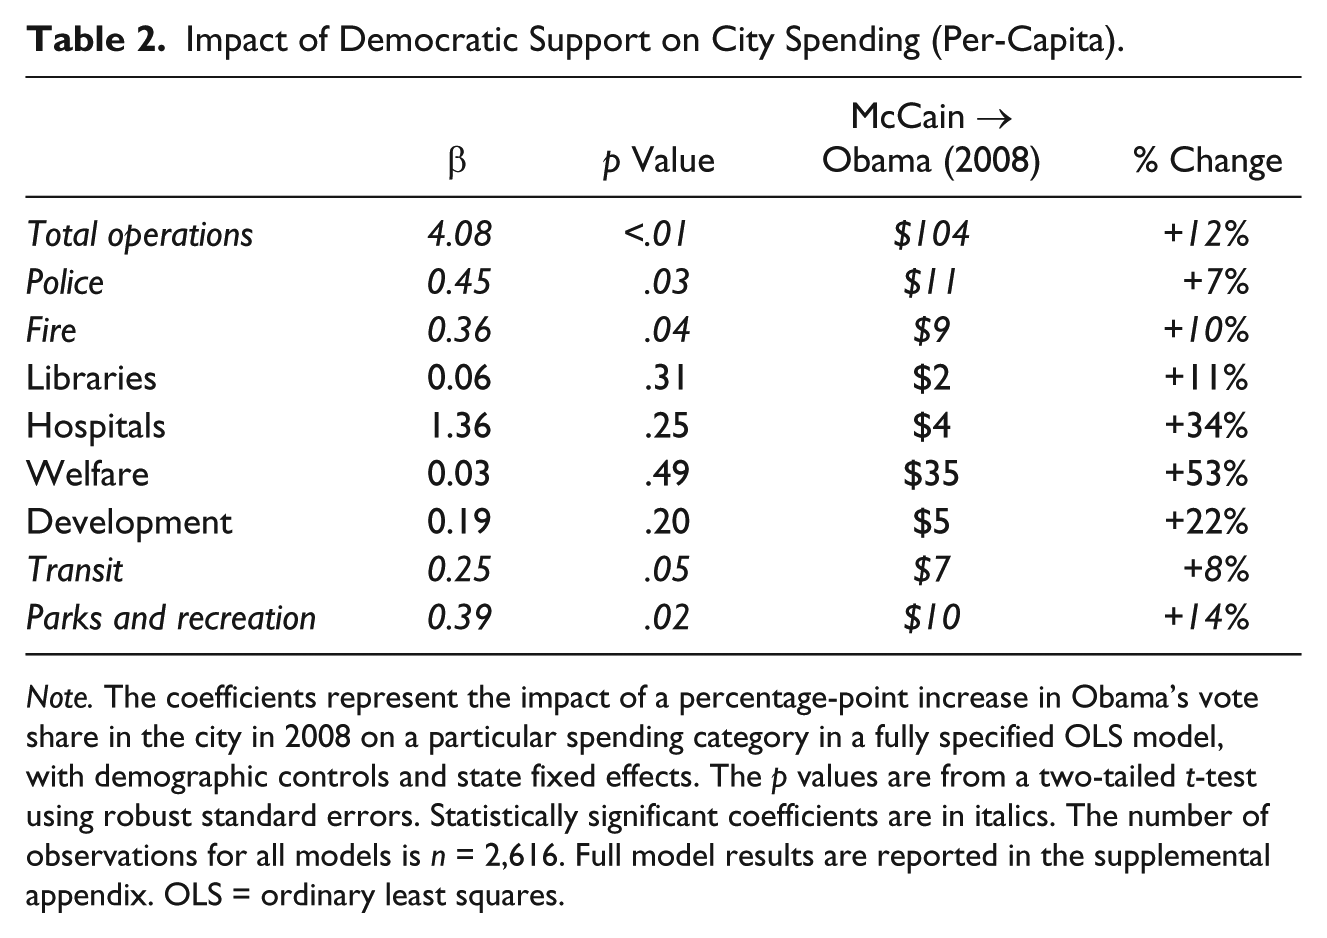
Note. The coefficients represent the impact of a percentage-point increase in Obama’s vote share in the city in 2008 on a particular spending category in a fully specified OLS model, with demographic controls and state fixed effects. The p values are from a two-tailed t-test using robust standard errors. Statistically significant coefficients are in italics. The number of observations for all models is n = 2,616. Full model results are reported in the supplemental appendix. OLS = ordinary least squares.
Impact of Democratic Support on City Revenues (per Capita).
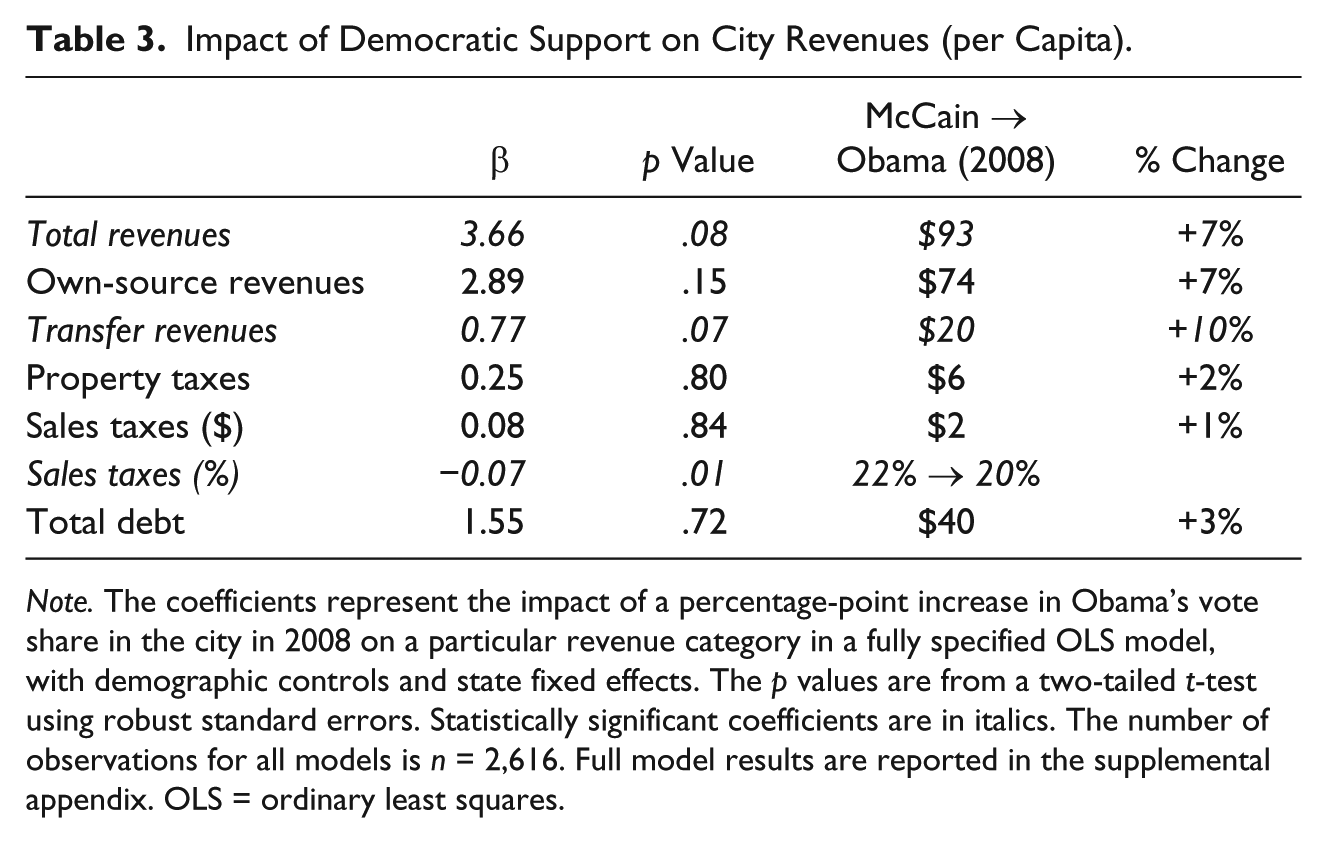
Note. The coefficients represent the impact of a percentage-point increase in Obama’s vote share in the city in 2008 on a particular revenue category in a fully specified OLS model, with demographic controls and state fixed effects. The p values are from a two-tailed t-test using robust standard errors. Statistically significant coefficients are in italics. The number of observations for all models is n = 2,616. Full model results are reported in the supplemental appendix. OLS = ordinary least squares.
Modeling Decision to Provide Services.
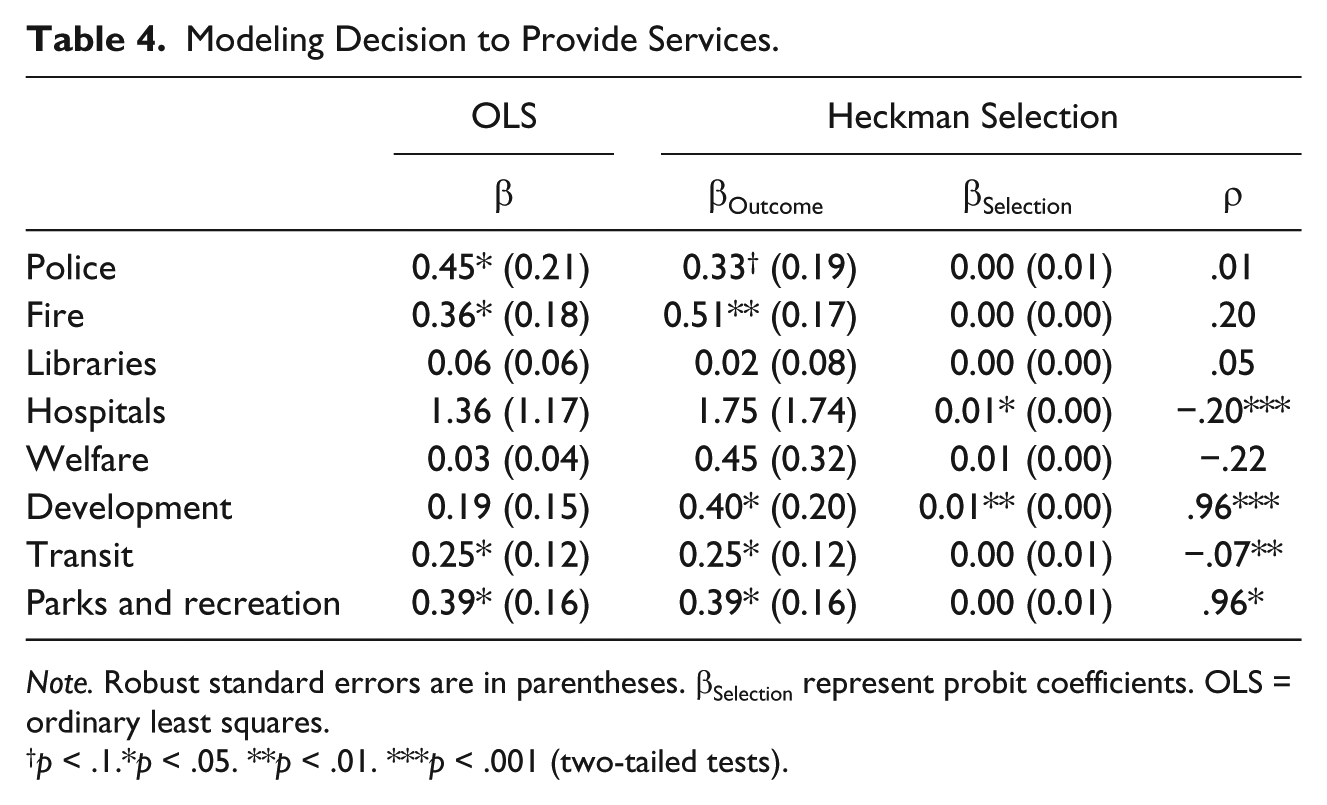
Note. Robust standard errors are in parentheses. βSelection represent probit coefficients. OLS = ordinary least squares.
p < .1.*p < .05. **p < .01. ***p < .001 (two-tailed tests).
Panel Results: Impact of Democratic Support on City Fiscal Policy (per Capita).
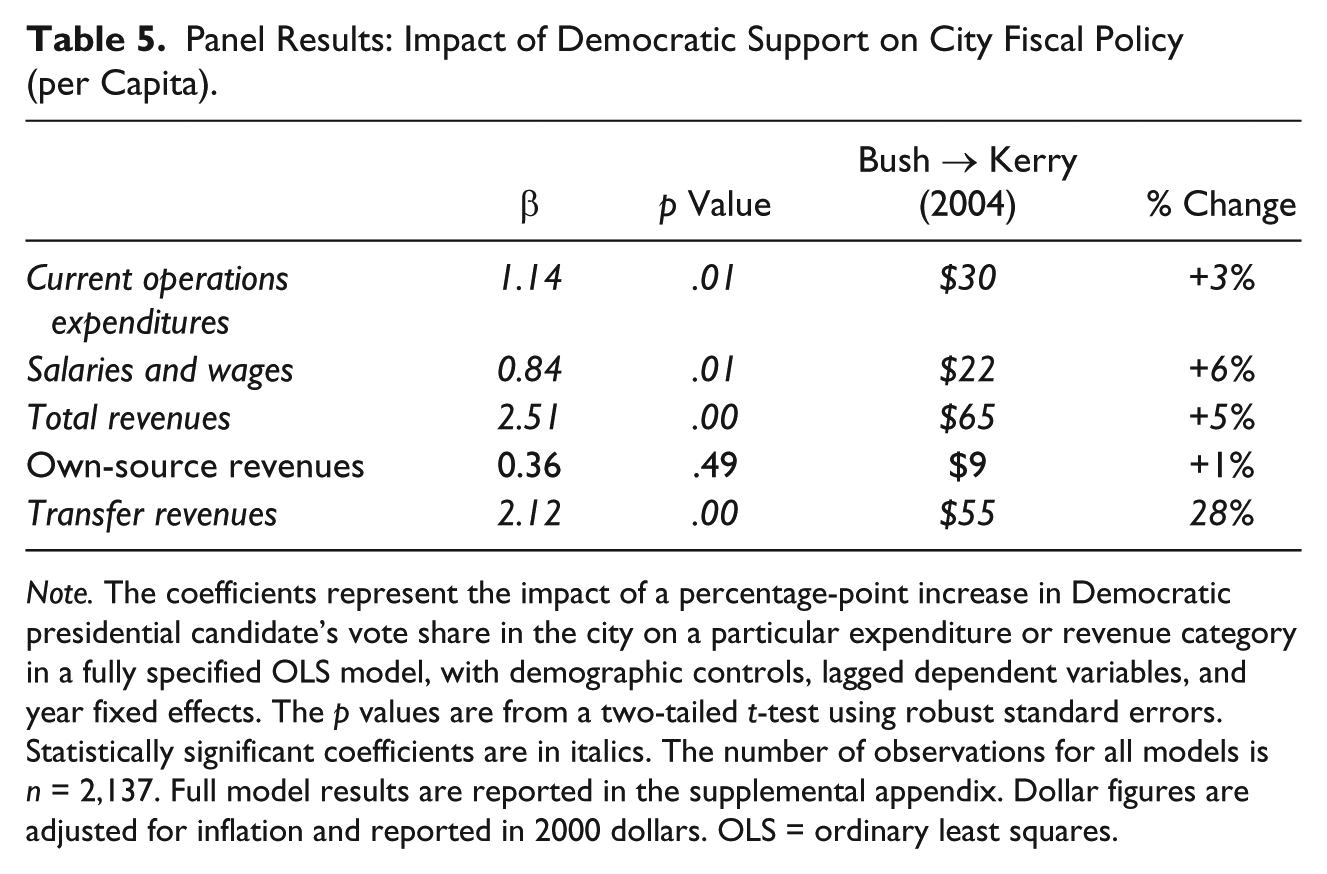
Note. The coefficients represent the impact of a percentage-point increase in Democratic presidential candidate’s vote share in the city on a particular expenditure or revenue category in a fully specified OLS model, with demographic controls, lagged dependent variables, and year fixed effects. The p values are from a two-tailed t-test using robust standard errors. Statistically significant coefficients are in italics. The number of observations for all models is n = 2,137. Full model results are reported in the supplemental appendix. Dollar figures are adjusted for inflation and reported in 2000 dollars. OLS = ordinary least squares.
Table 2 summarizes the results from our spending models, showing that Democratic cities spend substantially more in total and across a number of different service categories. Looking specifically at total operational expenditures, a one-point increase in the proportion of votes cast for Obama in 2008 corresponds to $4.08 more spending, on average, for each resident. This translates to a $104 difference between average McCain and Obama cities, or a roughly 12% increase. 18 Moreover, greater levels of Democratic support translate to higher spending across various service categories, although the effect is not significant at conventional levels for libraries, hospitals, or development.
Of particular interest is the relationship between partisanship and spending on welfare services. Overall, we find no evidence that greater support for Democratic candidates affects the level of welfare provided by city governments. Although the coefficient is positive, it is nowhere near statistical significance. In fact, a full 86% of the cities in our sample report zero welfare spending, a finding that is consistent with Peterson’s account of jurisdictional competition constraining local discretion on redistributive policy. Importantly, however, these constraints do not appear to carry over to other types of municipal services, with Democratic support significantly and substantively related to larger city government across the board and for specific types of services, including public-safety functions traditionally associated with the Republican Party, which has built a reputation of being tough on crime. 19
The consistent and sizable relationship between voter partisanship and local spending decisions poses an important puzzle: how do Democratic cities find sufficient revenue to pay for higher service levels? We found no evidence that Democratic cities take on greater long-term or short-term debt (see Table 3), which means that higher spending must be offset by greater revenues. 20 Cities may fill the gap by raising taxes, but it remains uncertain whether local governments have the necessary legal authority, particularly in states with constitutional or statutory tax limits, or the economic wherewithal to do so.
Table 3 reports weaker evidence that voter preferences affect the level of revenues raised through local taxes. Although a one-point increase in Obama vote share corresponds to a $3.66 increase in total per-capita receipts (p = .08), own-source revenues account for only three-fourths of this increase and the coefficient on own-source revenues is not statistically significant at conventional levels (although it comes close at p = .15). To close the gap, cities appear to turn to intergovernmental aid. Transfers from higher levels of government are 10% higher in cities carried by Obama than those won by his Republican opponent. We believe that this is due to higher demand for intergovernmental aid among Democratic cities rather than greater supply. Although many aid programs, including the federal Community Development Block Grants, provide disproportionate funds to larger, urban areas, which tend to be more Democratic, it is important to emphasize that we find the positive relationship with Democratic vote share after controlling for the demographic determinants of grant eligibility. We also find no evidence of political targeting of aid to Democratic cities. Because Republicans controlled the federal government in 2006, when federal aid for the 2007 fiscal year was appropriated, it is highly implausible that national policy makers would have favored Democratic municipal governments. In addition, we see no statistically significant differences in the portion of intergovernmental revenues provided by state governments between cities located in Democratic-controlled, Republican-controlled, and divided-government states. 21
In short, Democratic support at the municipal level is associated with more grant receipts from higher levels of government, resulting in substantially higher aid and, as a result, total revenues. These results are consistent with Craw (2010), who contended that local political dynamics affect the willingness of city officials to engage in efforts to secure intergovernmental grants or agree to the conditions attached to them. More broadly, the findings provide empirical support for the argument that grantee characteristics and willingness to pursue aid—rather than the conditions attached to the money or the willingness of grantors to provide it—are a central but understudied part of the fiscal federalism story in the U.S. context (see, for example, Choi, Turner, and Volden 2002; Knight 2002; Stein 1981; Volden 2007).
In addition to helping determine revenue levels, the results show that local voter partisanship also shapes the precise revenue mix on which local governments rely and how the overall funding burden is spread among different income subgroups. When we look at the percentage of local revenues raised through sales taxes—one of the most regressive form of taxation—we find a clear negative relationship between Democratic vote share and reliance on this revenue source. Overall, sales tax dollars represented about 22% of local revenues in McCain cities, compared with 20% in those won by Obama. Although the effect does not appear to be overwhelming, it is substantively important, corresponding to a roughly $24 less in sales tax revenues raised per person. 22
Selection and Censoring
One concern with the function-specific expenditure results presented above is that they do not account for potential censoring and selection problems. For example, some municipalities may report zero spending on certain categories of services either because they are statutorily prohibited from offering them or because these services are already provided by other regional jurisdictions. This creates the risk of selection bias in the estimation (Heckman 1979). A related worry is that the question of whether to provide a service may be driven by different factors than the decision about actual service levels; constituent preferences may affect one decision but not the other. Neither scenario would be captured accurately by a naive OLS specification.
To address these concerns, we estimated a separate Heckman selection model for each category of expenditures, modeling the decision to provide the service separately from the level of spending dedicated to it. To identify the model, we include the proportion of municipal governments in each respective county reporting more than zero spending on each category of services as an instrument in the selection stage. Table 4 reports the results. The first column of the table lists the naive OLS coefficients on Democratic vote share, which can be compared directly with the β coefficients from the outcome stage of the Heckman model in the second column. The third column reports the Democratic vote share effect in the selection stage—predicting whether a municipality provides a service at all. 23 The final column reports the ρ coefficient. A significant ρ indicates the presence of selection bias in the OLS estimates.
Overall, there are few substantively important differences between the OLS and Heckman results. Both suggest that constituent preferences play an important role in explaining variation in service provision by municipal governments. When accounting for selection bias, the analysis shows that Democratic votes share also has a significant association with development spending, in contrast to the null findings from the OLS model. However, partisanship is significant in the selection stage only for hospital and development spending, suggesting that constituent preferences play a much more important role in explaining how much of a given service city governments provide but not the initial decision of whether to offer such a service in the first place.
Panel Results
The analysis above provides compelling evidence of policy responsiveness in city government. Controlling for a large number of social, economic, and demographic factors, Democratic cities spend more across the board, bring in more revenue, and attract higher levels of intergovernmental aid than municipalities that support Republican political candidates. Given the exhaustive list of covariates included in our models, it is hard to think of other potential factors that could confound the relationship between voter partisanship and local policy outcomes. Nevertheless, omitted variable bias remains a serious concern with any observational, cross-sectional analysis. A second concern is that a purely cross-sectional analysis strategy does not allow us to distinguish between two possible mechanisms that may result in the policy responsiveness we document. Although we argue that local governments most likely alter their policy offerings to accommodate changes in what local voters want, it is also possible that voters may choose to make residential decisions on the basis of local public services. Over time, such sorting behavior would result in a close match between what citizens desire and what their local governments provide (Tiebout 1956). Homophily in residential choices is difficult to rule out with cross-sectional data, including the analysis presented in Tausanovitch and Warshaw (2014).
For this reason, we sought to replicate our initial findings using panel data. This allows us to both account for unobserved city-level heterogeneity that may contribute to policy differences between jurisdictions and examine how policy evolves over time in response to changes in constituent preferences. The lack of available election results for previous elections at the local government level, however, means that our panel analysis necessarily focuses on a smaller subset of cities than the cross-sectional results.
Although few agencies report election results at the city level—and even fewer have done so over an extended period of time—we successfully located historical election reports for cities in two states: California and Wisconsin. The California data were coded from archived copies of the Statement of the Vote, the official report released after each election by the Secretary of State. 24 A regularly published supplemental appendix to the Statement of the Vote includes vote totals from presidential elections aggregated at the city level. For Wisconsin, the data are limited to the Milwaukee metropolitan area and were initially collected from precinct-level returns by Clayton Nall (forthcoming). 25
To include the widest range of available covariates possible, we include all presidential elections held between 1980 and 2004. Fewer social and demographics were collected by the Census prior to 1980, limiting our ability to extend our analysis past this period. For our dependent variables, we use the Census Bureau’s historical database on individual government finances, a special retabulation of all available government finance statistics that makes the data comparable over time. The historical data run only through 2004; due to coding differences between the historical database and the Census of Governments, we were unable to combine the two sources to include the 2008 election.
All of our variables were transformed in a variety of ways to make a time-series analysis possible. First, all city finance measures were adjusted for inflation using the state and local government implicit price deflator (Bureau of Economic Analysis Series A829RD3). 26 Although this adjustment should make spending and revenue in one year comparable with the same measures in another, our panel models also include year fixed effects to account for broad shocks to government finances and economic cycles that may hit all local governments in the same fiscal year. Second, because each presidential election features different candidates and, thus, precludes direct comparison, we standardized the election results across time by subtracting the share of the national popular vote won by the Democratic candidate in each election cycle from the city-level figures. 27 Finally, these political variables and all demographic covariates from the Census were linearly interpolated to calculate the relevant levels for years matching the finance statistics. These finance data are available for all of the cities in our sample only twice each decade, in years ending with the numbers 2 and 7 (e.g., every five years from 1982 to 2002).
To account for unobserved heterogeneity and temporal dynamics, we estimate all panel models with lagged dependent variables, year fixed effects, and robust standard errors. For our first observation, in 1982, we are able to include financial data from 1977 for the lagged terms. We have also estimated a number of alternative specifications that address unobserved heterogeneity in different ways, including city fixed effects and first-difference models; the results we present below do not change substantively depending on the method used.
Before turning to the findings, we want to highlight three other important considerations. First, the historical finance statistics do not separate out operational and other types of expenditures (i.e., capital spending) for individual categories of public services. For this reason, our analysis focuses on overall operational expenditures and total spending on salaries and wages, the only two direct measures of operational spending available in the data. 28 Second, we are forced to drop some of the demographic and social controls included in our cross-sectional analysis because these variables are not available for earlier years. Fortunately, our panel models still include a rich set of controls 29 and many of the dropped variables are unlikely to change quickly over time, meaning that they should be captured in the lagged dependent variable terms included in our model.
Third, and perhaps most importantly, our period of study takes place after the passage of Proposition 13, a constitutional amendment, in California in 1978. The measure cut and permanently froze local property tax rates, limited how quickly local governments could reassess properties to reflect changing market prices, and imposed strict voter-approval requirements—in many cases, with super-majority thresholds—for increasing all other types of local taxes. Many observers blame Proposition 13 for imposing a “fiscal straightjacket” on local governments, greatly diminishing their ability to increase revenues in response to new needs and demands (e.g., Chapman 1998; Erie, Kogan, and MacKenzie 2011; Shires 1999). The passage of Proposition 13 makes California cities, which represent 90% of the 428 municipalities in our panel data, a particularly difficult context in which to expect substantial fiscal policy responsiveness. This state context should be kept in mind in interpreting the substantive magnitude of the panel results and may help explain why these effects are somewhat smaller than those found in the cross-sectional analysis. 30
Table 5 reports the findings from the panel models. Similar to the cross-sectional results, we again find a statistically significant and substantively meaningful relationship between local partisanship and fiscal policy outcomes. As cities grow more Democratic over time, they increase their operational spending and the revenues available to pay for it. Increasing the Democratic vote share from the average in a city carried by George W. Bush in 2004 to the average in the municipalities won by his opponent, John Kerry, corresponds to a roughly 3% increase in total operational expenditures and a 6% increase in spending on salaries and wages. Cities carried by Kerry also raised, on average, 5% more in total revenues than their Republican counterparts. Consistent with the limitations imposed by Proposition 13, we find that the rise in revenues is driven almost completely by increases in intergovernmental aid—which is 28% higher in a typical Gore city compared with an average Bush City, holding all else constant. 31 By contrast, own-source revenues do not appear to be affected by changing local partisanship. The historical data, which allow us to examine how local policy outputs change over time in response to shifting voter preferences, provide strong evidence that the relationship between voter partisanship and fiscal policy is indeed a causal one and that the ballot box is the likely mechanism that explains it.
Conclusion
Overall, our results provide the most convincing evidence to date of policy responsiveness in city governments. Both cross-sectional and panel analyses show that as cities become more Democratic, they spend more on service provision across a broad array of programs and adjust their revenues to meet these new demands. On the revenue side, we show that support for Democratic candidates appears to affect how aggressively cities pursue aid from state and federal governments.
These results provide a possible answer to the well-known puzzle of the “flypaper effect” of intergovernmental grants. Economic theory suggests that intergovernmental transfers should not increase overall spending among recipient agencies. Recipients should instead use grant moneys as a substitute for local revenues, allowing them to reduce local taxes while maintaining existing service levels. Yet, empirical research consistently finds that intergovernmental transfers stimulate local spending, an outcome at odds with the predictions from economic models. One explanation suggested by our findings is that grant funding is endogenous: Cities choose to apply for aid when their residents demand greater spending and legal or competitive constraints leave them unable to raise the money to meet these demands locally (see also Brooks and Phillips 2010; Knight 2002). The logic behind this argument is most clearly demonstrated in the recent decisions by states with Republican legislatures and governors to not expand Medicaid coverage under President Obama’s health care reforms, forgoing federal grants that would have paid nearly all of the resulting costs. We find patterns consistent with similar dynamics at play at the local level for a much broader range of state and federal programs, suggesting that the preferences of local voters may shape not only the policies within their jurisdictions but also how cities interact with other levels of government in the American federal system.
In the coming years, cities and other local government will likely make a number of policy choices with important national and, in some cases, global ramifications. For example, local governments will need to decide how to prioritize investment in public transportation programs relative to spending on the maintenance and expansion of local road networks and highways. The outcome of these decisions will shape emissions of greenhouses gases and the health of our environment. Similarly, local planning policies and infrastructure investments will determine whether future population growth and development takes place near existing transportation and employment centers or in more distant and less densely populated areas. Growing concerns over the affordability of public employee pensions and retiree health care benefits will force many local governments to weigh cutting benefits for new and existing workers or finding additional revenue to pay for these commitments. Worries about the international competitiveness of America’s workforce will also encourage a number of local governments to experiment with education reforms, including the weakening of teacher tenure laws, increasing reliance on value-added test scores, adoption of mayoral control, and the creation of alternative schooling options such as charter schools. As local governments continue to grapple with these and other salient questions, our findings suggest that voter preferences will likely play an important role in shaping the trajectory of local policy.
Although our data and research design represent an important advance over existing studies, we conclude by highlighting a major limitation of our work. First, our reliance on presidential vote shares to gauge local partisanship means that we are unable to place both voter preferences and local government policies on a common scale. Although this is not a problem for demonstrating policy responsiveness, it does preclude us from drawing more specific and normative conclusions about whether local policies actually match those supported by the majority of local voters, a more strict representational criterion of policy congruence (see Erikson, Wright, and McIver 1993; Lax and Phillips 2012; Matsusaka 2010). It is possible, for example, that cities are too responsive to changes in local opinion, resulting in the same kind of “leapfrog” representation that has been documented both in Congress (Bafumi and Herron 2010) and in state legislatures (Lax and Phillips 2012). Without measuring preferences and policy on the same scale, we also cannot examine how local political institutions—such as direct democracy, appointed city managers, the absence of partisan labels on the ballot, and the timing of local elections—moderate the responsiveness of city governments to voter demands (Matsusaka 2001 provides a more detailed discussion of this problem). Examining how local institutions and other contextual factors—such as the level of jurisdictional competition faced by municipal government—shape the capacity and willingness of local governments to accommodate and respond to the priorities of their constituents should be an important focus of future work.
Supplemental Material
UAR568027_Supplemental_Appendix_CLN – Supplemental material for Pushing the City Limits
Supplemental material, UAR568027_Supplemental_Appendix_CLN for Pushing the City Limits by Katherine Levine Einstein and Vladimir Kogan in Urban Affairs Review
Footnotes
Declaration of Conflicting Interests
The author(s) declared no potential conflicts of interest with respect to the research, authorship, and/or publication of this article.
Funding
The author(s) received no financial support for the research, authorship, and/or publication of this article.
Notes
Author Biographies
References
Supplementary Material
Please find the following supplemental material available below.
For Open Access articles published under a Creative Commons License, all supplemental material carries the same license as the article it is associated with.
For non-Open Access articles published, all supplemental material carries a non-exclusive license, and permission requests for re-use of supplemental material or any part of supplemental material shall be sent directly to the copyright owner as specified in the copyright notice associated with the article.