



Abstract
This research examines the impact of neighborhood ethnoracial composition on the likelihood that neighborhoods that could gentrify do gentrify over time. Drawing on findings from the gentrification and residential preference literatures, we hypothesize that the percentage of Black and Latino residents in neighborhoods in 1980 is associated with the probability of gentrification, conditional on the racial composition of neighborhoods in 2010. We test these hypotheses with analyses of census data for tracts in the central cities of Chicago and New York in 1980 to 2010. We find that the percentage of Black residents in 1980 was negatively associated with gentrified White and positively associated with gentrified Black neighborhoods, and that percent Latino in 1980 was positively associated with gentrified Latino neighborhoods. Finally, we found strong evidence that gentrification in these cities was much more likely to occur in neighborhoods close to the central business district.
Although American cities have grappled with problems of crime, poverty, and dilapidated housing for well over a century (e.g., Riis 1890), by most accounts, the decades of the 1960s and 1970s were especially troubled urban times. During this period, the combination of vanishing manufacturing sector jobs (Kasarda 1989; W. J. Wilson 1996), racial conflict (Hirsch 1982; Sugrue 1996), and high rates of suburbanization (Jackson 1985; Teaford 2008) left many American cities in dire straits. For example, the 1970s was the only decade in the past two centuries in which New York City lost population (authors’ calculation from U.S. Census data). New York faced bankruptcy in 1975 (and was famously refused a federal bailout by President Ford), joining a long list of cities experiencing severe fiscal crises (T. N. Clark and Ferguson 1983). Meanwhile, the “Second City” was facing challenges of its own. During the 1970s, Chicago suffered from a shrinking population (an 11% reduction from 1970 to 1980) and rising unemployment, poverty, and crime. Matters became so desperate that in the spring of 1981 Chicago’s Mayor Jane Byrne took the dramatic (and to critics, cynical) step of moving into the notorious Cabrini-Green public housing project located in the city’s Near North Side neighborhood (Newsweek 1981).
Hence, the 1970s marked the modern low point for American cities in general, and Chicago and New York in particular. Given the violence, poverty, and economic decline in cities throughout the country, and the concomitant rise in telecommunication technologies and suburbanization, there was speculation that the age of cities was over (Sassen 2000). However, although neighborhoods have always undergone cyclical processes of decline and reinvestment (Lees 2000), the late 1970s and early 1980s witnessed the beginnings of a more widespread increase in the population change, reinvestment, and redevelopment commonly associated with gentrification. 1
Some prior research has attempted to understand why certain poor neighborhoods gentrify and others do not. This research has found that neighborhood characteristics such as degree of disinvestment and age and type of housing stock are significant predictors of gentrification (Betancur 2002; Galster et al. 2003; Hammel 1999; Hammel and Wyly 1996; Heidkamp and Lucas 2006; Ley 1996; Smith 1979b, 1996; Wyly and Hammel 1998). In addition, research has found that proximity to desirable locations, such as, the central business district (CBD), is related to the likelihood that a neighborhood will gentrify (Hammel and Wyly 1996; Heidkamp and Lucas 2006; Ley 1996; Pattillo 2007; Smith 1996).
Despite the theoretical and empirical contributions of this research, scholars have not paid sufficient attention to the role of neighborhood racial and ethnic composition as a predictor of gentrification. Among the handful of quantitative studies attempting to explain gentrification processes, the role of neighborhood ethnoracial composition has been underdeveloped (Lees 2000; but see Hwang and Sampson 2014). Yet there are sound reasons to think that such composition would be a profoundly important factor. A large literature on neighborhood preferences consistently finds that Whites report unwillingness to move into neighborhoods with even a small African-American population (Bobo and Zubrinsky 1996; Farley et al. 1978; Farley et al. 1994; Krysan and Bader 2007; Timberlake 2000; Zubrinsky and Bobo 1996). In addition to its obvious effects on the likelihood that a largely Black or Latino neighborhood would be gentrified by Whites, White avoidance likely reduces the appeal of Black neighborhoods to real estate developers seeking to maximize returns on scarce investment resources. Moreover, research has stressed the importance of historically Black neighborhoods as targets for gentrification by African-Americans (Hyra 2008; Pattillo 2007). Less well developed is the literature on Latino gentrification (Anderson and Sternberg 2012); however, there is nothing about these general observations regarding neighborhood ethnoracial composition that would preclude gentrification in predominantly Latino neighborhoods.
On the other hand, some research has shown that indeed, some neighborhoods—or at least fractions of neighborhoods—that have historically been densely populated by African-Americans are experiencing an influx of White gentrifiers. Examples include parts of Harlem in New York (Freeman 2006), Portland (Sullivan 2006), and the Shaw/U Street corridor in Washington, D.C. (Hyra 2015; see also Gale 1987; Henig and Gale 1987). Hence, the literature is inconclusive on the ways in which the ethnoracial context of neighborhoods is related to their gentrification trajectories. This, we believe, represents an ongoing and significant gap in the literature on urban change.
In this article, 2 we use U.S. Census data from 1980 to 2000 and 2008–2012 American Community Survey data to test the hypothesis that neighborhood ethnoracial composition is related to the probability that neighborhoods in Chicago and New York gentrified, while controlling for other previously recognized factors, such as population and housing characteristics and proximity to the CBD and fixed rail mass transit stations. Our analyses make several key contributions to the literature on gentrification. First, we provide one of the few quantitative analyses of gentrification in Chicago and New York, about which much scholarly attention has been paid. 3 Like Hwang and Sampson (2014), we supplement qualitative studies of gentrification in Chicago (e.g., Hyra 2008; Lloyd 2006; Pattillo 2007); however, our research extends these authors’ analyses by beginning at an earlier time point (1980 vs. 1995) when Chicago was at the nadir of the urban crisis of the late 1970s. In addition, we add the comparison case of New York, about which a number of qualitative studies have also been carried out, including those by Mele (2000), Taylor (2002), Dávila (2004), Freeman (2006), and Hyra (2008). The present study, then, represents one of the few quantitative and comparative studies of gentrification processes, using the most recent census data available. Our findings serve both to replicate and extend those of Hwang and Sampson (2014), as well as provide an additional methodological approach to supplement the qualitative research on gentrification in these cities.
Theoretical Background
When it emerged, socioeconomic upgrading in the inner city was somewhat unexpected by sociologists, urban planners, and historians. The improvement of rundown neighborhoods ran counter to previous urban theories, such as the Chicago School’s invasion and succession model of neighborhood change (Park and Burgess 1925). Recent scholars credit Glass (1964) with coining the term gentrification to describe the middle-class upgrading of working-class neighborhoods in London. In subsequent literature, Smith (1996, p. 32) built on Glass’s initial usage, defining gentrification as “[T]he process . . . by which poor and working-class neighborhoods in the inner city are refurbished via an influx of private capital and middle-class homebuyers and renters.” Lees, Slater, and Wyly (2008, p. xv) offered a more concise definition of gentrification as “the transformation of a working-class or vacant area of the central city into middle-class residential and/or commercial use.”
Thus, at its core, gentrification is the process by which poor inner city neighborhoods become middle-class or affluent through population change, either in the socioeconomic profile of the residents themselves, or more frequently, through the in-migration of affluent residents. There is a vibrant literature emphasizing the cultural, artistic, or aesthetic aspects of gentrification (Lloyd 2006, 2011; Zukin 1987, 1998, 2010); however, in this article, we are concerned exclusively with understanding the socioeconomic transformation of urban neighborhoods, rather than whether or not that transformation is preceded or followed by cultural or aesthetic change. The central empirical question we ask is as follows: Given that a large number of relatively poor neighborhoods in Chicago in New York could have gentrified from 1980 to 2010, what was the role of neighborhood ethnoracial composition in predicting which ones did gentrify, and how much did that role vary by the racial composition of neighborhoods in 2010? 4
Supply-Side Explanations
Smith’s rent gap theory stresses the importance of the activities of place entrepreneurs in seeking to maximize the exchange value of land (Smith 1979a, 1979b, 1996). In this framework, a rent gap exists when there is a notable disparity between actual rent, or the “claim made by landowners on users of their land,” and potential rent, or the amount that could be claimed under the land’s “highest and best use” (Smith 1996, p. 62). The rent gap develops through the rational devalorization and deterioration of a location (Smith 1996). However, areas with the largest rent gap or the most disinvestment do not necessarily gentrify. According to Smith (1996, p. 69), “too much goes into the immediate causes of gentrification in a particular neighborhood for it to be possible to correlate level of decline with propensity to gentrify.”
Nevertheless, Hammel and Wyly (Hammel and Wyly 1996; Wyly and Hammel 1998) and Heidkamp and Lucas (2006) applied rent gap theory to their analyses of gentrification. The work of Hammel and Wyly in particular has made significant contributions in the measurement of gentrification by combining neighborhood field surveys with U.S. Census data. This two-pronged approach enabled the measurement of demographic as well as aesthetic neighborhood change characteristics. In their four focal cities, Hammel and Wyly found the gentrifying neighborhoods to be sufficiently similar to each other to represent a coherent empirical movement of change in the inner city. Heidkamp and Lucas (2006) furthered this work by specifically measuring the effects of the existence of an amenity, a revitalized urban waterfront, on the location of the gentrification frontier. This work used a similar qualitative and quantitative approach as Hammel and Wyly, but by focusing on the waterfront as an amenity in only one city, Heidkamp and Lucas (2006) emphasized the particular “localized nature of gentrification” (p. 122).
Demand-Side Explanations
Ley (1980) countered Smith’s supply-side argument by emphasizing demand-side “consumption styles.” According to Ley, gentrification is the result of advanced capitalism and a postindustrial society, characterized by the decline of unskilled labor and a shift toward the service sector, an increased role of government, and an emphasis on individuality and creativity (Ley 1980). From this perspective, consumers choose locations for gentrification because these neighborhoods have desirable features and amenities and correspond with their lifestyle aspirations. In contrast to Smith’s (1996) theory, consumer demand, rather than the size of the rent gap, dictates the location of gentrification. According to Ley (1996), Smith’s (1996) specification that reinvestment will not necessarily occur where the rent gap is largest nullifies the latter theory altogether.
Ley (1996) tested a number of attributes of gentrified neighborhoods found in previous literature. According to Ley (1996), gentrifying neighborhoods are located near established middle/upper middle-class areas, the CBD, and areas with “distinctive urban services” or an environmental amenity such as a waterfront. Furthermore, the presence of arts and artists, distinctive architecture, and less conventional households correspond with the incidence of gentrification. Corresponding with the focus on consumer demand, Ley (1996) found the expression of a particular lifestyle to be the guiding factor in the location of gentrification. In Ley’s (1996, p. 166) words, “an inner-city location is selected by a middle-class household because it advances practices, interests, and beliefs which are held dear in daily life.”
Ley’s (1980, 1996) recognition of artists as an important force in the gentrification process is consistent with Florida’s (2012) discussion of the creative class as a new powerful social group. Florida found that members of this group, which includes artists, gays, and lesbians, as well as workers in high-tech fields, often choose their housing location because of lifestyle opportunities, rather than job market opportunities. Thus, Florida also perceived changes that take place in the urban environment as the result of lifestyle tastes and demands. Similarly, Zukin (1998) emphasized how gentrifiers’ housing decisions led to changes in “urban consumption” (p. 831). Gentrifiers initiated a self-reinforcing cycle where the initial move into a rundown neighborhood eventually changed the business environment in the neighborhood as well. Gentrifiers’ occupations as teachers, lawyers, managers, writers, and artists provided the “material base” in inner cities for “new cultural production and consumption” (Zukin 1998, p. 831). Thus, these changes established the foundation for later cohorts of urban in-movers of higher-class statuses and less avant-garde lifestyles, eventually resulting in the displacement of both pregentrification residents and some early gentrifiers.
Finally, Lloyd (2006) built upon the theoretical bases established by Ley (1996), Florida (2012), and Zukin (1998) in his examination of the Wicker Park neighborhood in Chicago. In his analysis, Lloyd (2006) connected gentrifiers’ behaviors to the history of Bohemian movements. Thus, the lifestyle aspirations of the Wicker Park gentrifiers resulted not only from changes in the economy and labor market. These “neo-Bohemians” also engaged in historic emulation, which in the postindustrial era was expressed through conspicuous residential consumption. Here, gentrification was associated with a desire for the authenticity provided by the urban environment as opposed to the alienation and monotony of the suburbs (Beauregard 2003; Lloyd 2006; Zukin 1998, 2010).
In some recent literature on gentrification, the debates between the supply-side and demand-side theories have receded (Hamnett 1991; Lees 1994, 2000). According to Hamnett (1991), the argument between these perspectives persisted because it echoed the classic sociological debate between structure and agency. Importantly, Hamnett (1991) maintained that these theoretical explanations of gentrification were partial and that supply- and demand-side perspectives are “complementary rather than competing” (p. 175). We concur with this assessment, and stress the complementary nature of the supply and demand sides. To begin with, elementary economic theory suggests that developers respond to demand-side signals. That is, it would not be an effective business practice for developers to invest time and money in upgrading a neighborhood without verifying the demand for their product. Moreover, the very concept of a “rent gap” implies that there is latent, unrealized demand for a particular parcel of land. On the demand side, it is likely that individual gentrifiers or later in-movers respond to supply-side-initiated development, such as petit bourgeois concerns like coffee shops 5 and boutiques, as well as larger-scale condominium or chain store developments (Sullivan 2006).
Neighborhood Ethnoracial Composition and Neighborhood Preferences
Whether argued from a supply-side, demand-side, or complementary perspective, most studies of gentrification have not focused explicitly on the role of neighborhood ethnoracial composition. 6 We believe this stems from at least two factors. At the theoretical level, Glass’s (1964) original formulation of the concept of gentrification occurred in the East End of London, a conglomeration of working-class neighborhoods that were at that time populated predominantly by Whites. Hence, at its inception, the concept of gentrification was silent on ethnoracial factors. At the empirical level, many studies of gentrification have selected already-gentrified neighborhoods, and then discussed the processes that led to their transformation (e.g., Lloyd 2006; Mele 2000; Pattillo 2007; Smith 1996). This “selection on the dependent variable,” we believe, has led scholars to underestimate the importance of neighborhood ethnoracial composition.
Neighborhood ethnoracial composition should matter in the first instance because relatively affluent White movers tend to avoid neighborhoods with substantial concentrations of African-Americans of any class background, but most especially poor African-Americans. A large literature has documented the resistance of Whites to living in neighborhoods with more than a token percentage of Black residents (Bobo and Zubrinsky 1996; Farley et al. 1978; Farley et al. 1994; Krysan and Bader 2007; Krysan et al. 2009; Krysan, Farley, and Couper 2008; Timberlake 2000; Zubrinsky and Bobo 1996). Whether this avoidance stems from in-group preference, out-group animosity, or assumptions about levels of crime or social and physical disorder, the fact remains that Whites show little willingness to move into largely Black neighborhoods. Hence, if one way neighborhoods gentrify is via the replacement of poor residents with affluent ones, it is unlikely that this would happen via the migration of affluent Whites into neighborhoods with high proportions of poor Black residents, especially in highly racially segregated cities, such as Chicago (Anderson and Sternberg 2012; Massey and Denton 1993; Smith 1996). 7 Indeed, Hwang and Sampson (2014) showed that the percentage of Black residents in 1995 was negatively associated with the gentrification stage of neighborhoods in Chicago.
Because of the traumatic history of deliberate destruction and displacement that resulted from postwar urban renewal and slum clearance programs (Hirsch 1982), inner city African-American communities often fear present-day gentrification or urban upgrading will destroy their current communities (Boyd 2008; Pattillo 2003). For example, Pattillo (2007, p. 301) quoted the response of a resident from a predominantly African-American neighborhood in Chicago to the prospect of having White neighbors, “Honey, naturally they [Whites] want to get back here.” This quote exemplifies the concern these communities and their residents have that changes in the urban environment will ultimately come at their expense. However, on a whole, these anxieties have been unwarranted. According to Pattillo (2007), in 1990, the above resident’s neighborhood was 1.0% White, and by 2000, it increased to 1.2%.
On the supply side, it is reasonable to assume that, for the same reasons, private developers would shy away from investing scarce capital in poor Black neighborhoods for consumption by affluent Whites. Indeed, prior research on the effects of neighborhood ethnoracial composition on commercial investment patterns suggests that private capital may avoid largely Black neighborhoods (Immergluck 1999), although it is unclear whether this lower level of investment stems from developers’ assumptions about the tastes of White residents for living in largely Black neighborhoods or other factors. More formally, we hypothesize as follows:
A second way in which neighborhood ethnoracial composition might be related to the probability of gentrification comes from research on the burgeoning phenomenon of “Black gentrification,” or the gentrification of predominantly Black neighborhoods by Black middle-class gentrifiers. For example, recent research has profiled the Black gentrification of the neighborhoods on the South Side of Chicago (Anderson and Sternberg 2012; Boyd 2000; Hyra 2008; Pattillo 2003, 2007) and Harlem in New York City (Freeman 2006; Hyra 2008; Smith 1996). The trend of Black movement into poor communities has also been documented in work on HOPE VI redevelopments. According to Goetz (2011), about one in five HOPE VI neighborhoods experienced Black gentrification, including Chicago’s Bronzeville neighborhood, following the demolition of the Robert Taylor Homes public housing project.
As indicated by Pattillo (2007), the Black middle-class maintains a “deep sense of racial responsibility,” which distinguishes the activities of Black gentrifiers (p. 301). As a result, this process is not solely about capital, but also about “racial uplift” (Boyd 2000; Moore 2009). In addition, Harlem and Bronzeville are conceivably the most historic and recognized Black neighborhoods in the United States (Hyra 2008). The celebrated role of these particular neighborhoods makes them uniquely desirable to middle-class African-Americans. Hyra (2008) stated, “Harlem and Bronzeville are not just geographic communities: they are symbols of the Black experience in urban America” (p. 7). Similarly, Moore (2009), in her ethnography of a Philadelphia neighborhood, reported that population turnover is not a central component of Black gentrification. Rather, middle-class in-movers are motivated by a social justice agenda and desire to live with low-income residents. These considerations lead us to the following hypothesis:
Although the literature on the role of Latinos in gentrification is less well developed, a growing body of research suggests that gentrification is more likely to occur in neighborhoods with relatively high concentrations of Latinos. For example, Hwang and Sampson (2014) found that “gentrification trajectories” in Chicago were muted as the proportion of Latinos increased. However, qualitative information on the ethnoracial composition of neighborhoods such as Pilsen (Anderson and Sternberg 2012), Wicker Park (Lloyd 2006), East Harlem (Dávila 2004), and the Lower East Side (Mele 2000), suggests that White gentrification occurs not just when there is a low percentage of Black residents, but when the percentage of Latino residents is relatively high. Finally, we suspect that a process similar to Black gentrification would obtain for Latinos; that is, that neighborhoods gentrified primarily by Latinos would be those with relatively high concentrations of Latino residents in 1980. In sum, we hypothesize as follows:
Data, Measures, and Methods
Data
We test our hypotheses with U.S. Census data from the National Change Database (NCDB), a concatenation of summary files from the last five U.S. Censuses, and American Community Survey (ACS) data from 2008 to 2012. The chief advantage of the NCDB for our purposes is that neighborhood boundaries in 1980 are matched to consistent 2010 boundaries (as are the 2008–2012 ACS), ensuring that changes in neighborhoods are not due to shifting tract boundaries, but rather to real population changes over time. The units of analysis are the 2,963 census tracts in the central cities of Chicago and New York (the five boroughs). 8 Our final sample size consisted of 2,894 tracts, 792 in Chicago and 2,102 in New York. Due to data suppression 9 in 1980 and 2010, 69 tracts were removed from the analysis (four in Chicago and 65 in New York). We verified that the majority of these tracts were located in parks, cemeteries, and other mostly unpopulated locations (the tracts shaded in light gray in Figures 1 and 2).
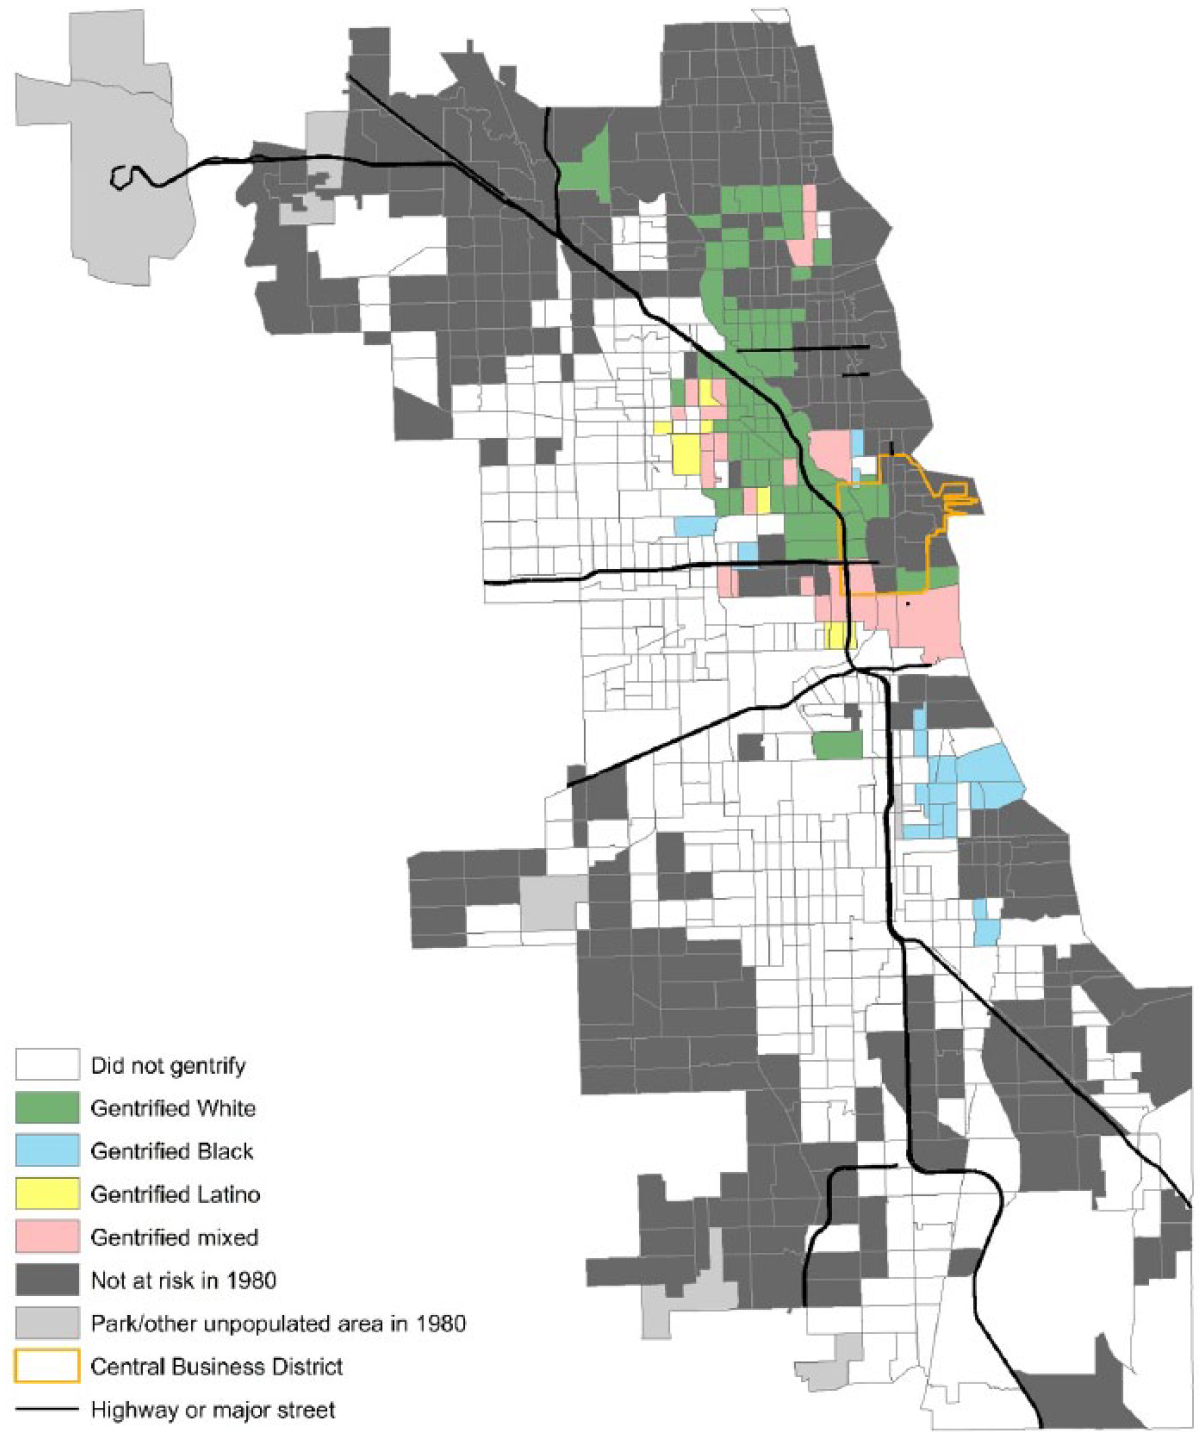
Gentrification outcomes in Chicago, 1980 to 2010.

Gentrification outcomes in New York City, 1980 to 2010.
Measures
Dependent variable
To construct the dependent variable, we first generated neighborhood socioeconomic status (SES) scales in 1980 and 2010 for both Chicago and New York. The scale comprised four items at the tract level: (1) percentage of residents not in poverty, (2) percentage over age 25 with greater than a high school degree, (3) percentage employed in professional or technical occupations, and (4) average family income. 10 Each scale loaded on a single common factor (eigenvalues = 2.75 for Chicago and 2.86 for New York in 1980, and 3.18 for Chicago and 3.06 for New York in 2010), and the standardized Cronbach’s αs were .84 for Chicago and .86 for New York in 1980, and .91 for Chicago and .89 for New York in 2010. We then summed the Chicago and New York scales to form the overall neighborhood SES scale for the two cities combined in each decade.
Next, we divided the 1980 and 2010 neighborhood SES scales into quintiles. If a tract was in one of the lowest three quintiles of the neighborhood SES scale in 1980, it was considered to be “at risk” of gentrification. 11 If the tract increased by at least two quintiles from 1980 to 2010, we considered this tract to have undergone (or to be undergoing continuing) gentrification. 12 We made an additional adjustment to this indicator of gentrification—if a tract lost more than 50% of its population from 1980 to 2010, then it was considered not to have gentrified. This prevents tracts from being coded as gentrified by becoming less poor or having higher average incomes simply by losing most or all of its poor population, without replacement by more affluent residents. 13
Our resulting measure captures two key elements in the operationalization of gentrification: First, neighborhoods at risk of gentrification must have low levels of population SES in 1980. Although wealthy neighborhoods can get even wealthier over time, we do not believe this sort of neighborhood change captures conventional scholarly understandings of gentrification. Second, neighborhoods must increase substantially in population SES over time. We argue that other indicators commonly used to identify gentrified neighborhoods are epiphenomenal to change in population SES. Hence, we do not measure, for example, the presence of boutique stores, art galleries, or cafés, or even changes in housing value because we believe these to be outcomes or manifestations of underlying population change. Of course, the presence of such amenities may trigger further investment and population inflow over time, but we argue that the most important transformation of neighborhoods that are or become gentrified is the change from having predominantly low-SES residents to having a much higher concentration of higher-SES residents. 14
A summary of neighborhood transitions as captured by our quintile measure is shown in Table 1. The tracts in the shaded rows were at risk of gentrification in 1980 (n = 1,738). The tracts in the bolded polygon increased substantially in population SES by 2010, and therefore were coded as gentrified by 2010 (n = 285). These findings highlight the importance of the empirical question we ask in this article: Given that gentrification (as operationalized here) is a fairly rare phenomenon—only about 16% of neighborhoods that could have gentrified in 1980 actually did gentrify by 2010—what were the features of gentrified neighborhoods that led to that outcome?
Neighborhood SES Transition Matrix: Chicago and New York Central Cities, 1980 to 2010.
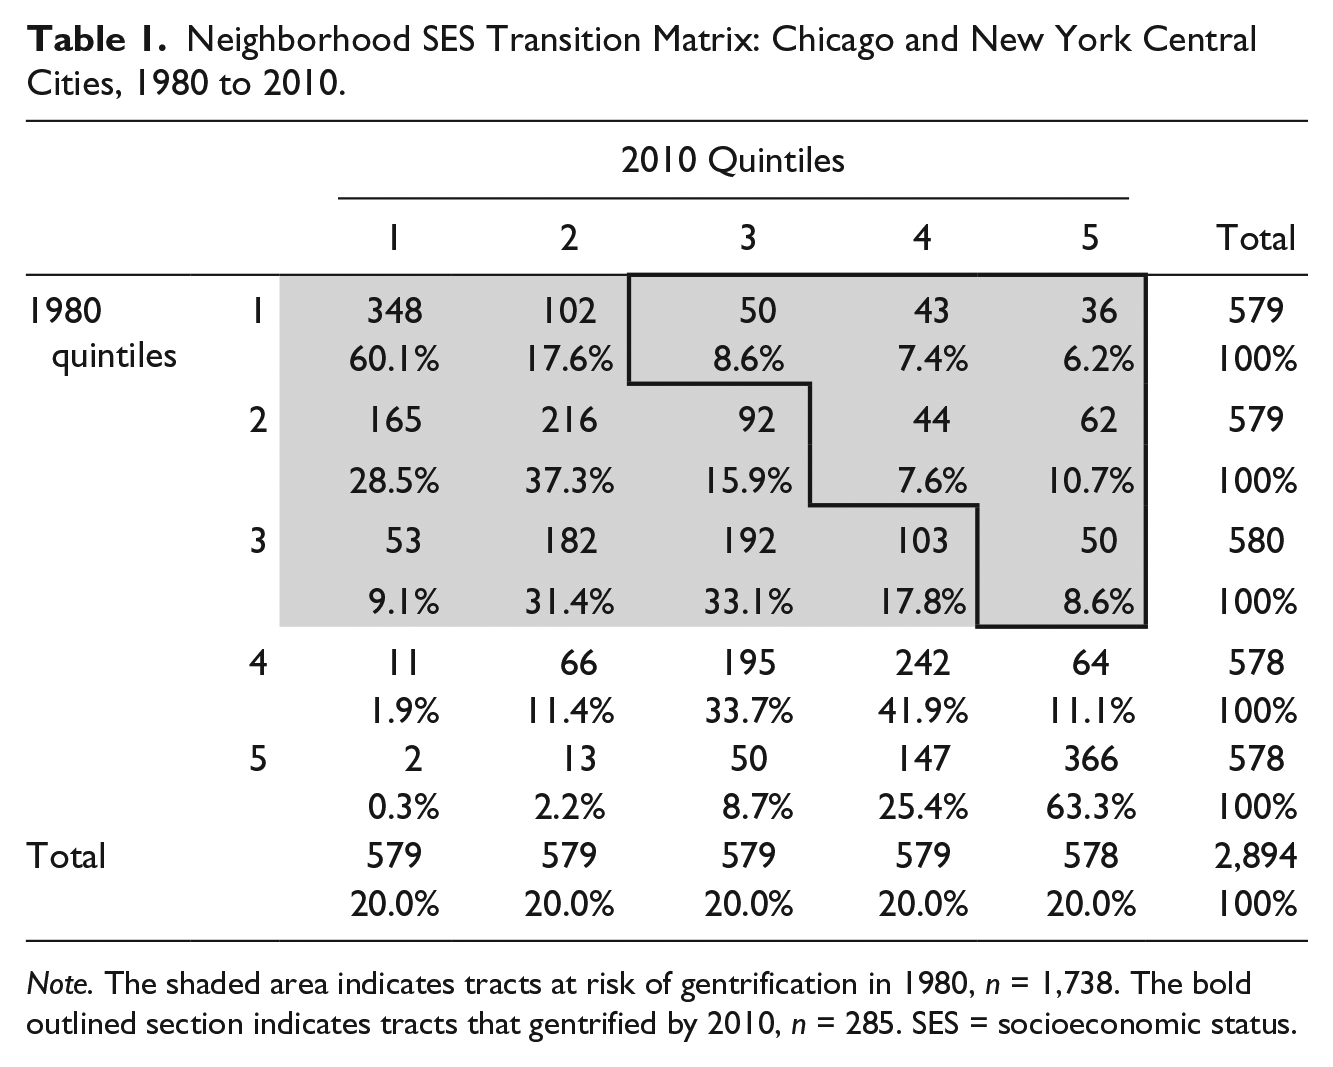
Note. The shaded area indicates tracts at risk of gentrification in 1980, n = 1,738. The bold outlined section indicates tracts that gentrified by 2010, n = 285. SES = socioeconomic status.
We added further complexity to the gentrification measure by accounting for the 2010 ethnoracial composition of gentrified neighborhoods. We coded our eventual five-category dependent variable 0 if a census tract at risk of gentrifying in 1980 did not gentrify by 2010; 1, 2, or 3 if it gentrified by 2010 and featured a majority of non-Latino White, non-Latino Black, and Latino residents, respectively; and 4 if it gentrified but did not have a majority of any of these ethnoracial groups. We refer to these latter four gentrification types as “gentrified White,” “gentrified Black,” “gentrified Latino,” and “gentrified mixed,” respectively. 15
Focal independent variables
The primary independent variables of interest are the percentages of non-Latino Black and Latino residents in 1980. As discussed above, we predict that the percentage of African-Americans in a neighborhood significantly reduces its desirability to potential White gentrifiers and increases its desirability to Black gentrifiers, and therefore ought to be associated with the gentrified White and gentrified Black outcomes, respectively. We further expect that the percentage of Latino residents is positively associated with gentrification in both predominantly White and predominantly Latino neighborhoods in 2010.
Control variables
In keeping with previous research, we also include a number of control variables that previous literature recognizes as having significant effects on gentrification. The first set of control variables account for the population characteristics of census tracts in 1980. We first control for the population of each tract in 1980, expressed in hundreds of residents. Numerous researchers emphasize the importance of population age in promoting or constraining gentrification (Hammel and Wyly 1996; Heidkamp and Lucas 2006; Ley 1996). For instance, Ley (1996) argued for the positive effect of population between the ages of 25 and 45. Thus, we control for the percentage of the population who are children (under the age of 18) and elderly (over 65). Both of these characteristics should depress the likelihood that a neighborhood gentrifies. Finally, we control for the percentage of the population who lived in the same house in 1980 as they did during the previous year, indicating a less transient population, and therefore a less volatile neighborhood context.
Several housing characteristics have been considered important for gentrification outcomes in previous literature. The percentage of single-family homes, apartment buildings, and older structures are three frequently noted housing stock characteristics (Betancur 2002; Galster et al. 2003; Ley 1996). Accordingly, we include the percentage of detached single-family homes, expecting a negative relationship; the percentage of buildings with five or more units, expecting a positive relationship; and the percentage of housing stock built before 1950 (the cutoff year for the census), expecting a positive relationship. As discussed earlier, for an area to gentrify, it must be low-SES, but it also must have housing available for purchase and upgrading. According to Smith’s (1996) rent gap theory, more vacant buildings indicate the beginning stages of the cycle of disinvestment that ultimately leads to gentrification. For this reason, we include the percentage of vacant housing in the tract.
Finally, scholars have emphasized the significance of proximity to urban amenities. The literature frequently identifies close proximity to the CBD as affecting the location of gentrification (Hammel and Wyly 1996; Hwang and Sampson 2014; Ley 1996; Lloyd 2006; Smith 1996). Hence, we used ArcGIS to code the distance in miles from each tract centroid to the centroid of the combined CBD tracts in 1980, derived from the Census Bureau’s 1982 Census of Retail Trade (U.S. Census Bureau 1982). The literature also discusses the significance of other generally desirable features that are geographically distinct (Hammel and Wyly 1996; Heidkamp and Lucas 2006; Hwang and Sampson 2014; Ley 1996; Smith 1996). Thus, we also control for the presence of a Chicago Transit Authority (CTA) elevated train (“El”) stop or a New York Metropolitan Transit Authority (MTA) subway stop.
Methods
Our analysis proceeds in five steps. First, in Figures 1 and 2 and in Table 2, we present the spatial location of gentrification in Chicago and New York and provide some illustrative examples of gentrified White, Black, Latino, and mixed neighborhoods in the two cities. Next, in Figure 3, we present the relative percent change from 1980 to 2010 in the means of the components of the neighborhood SES scale, by gentrification outcome. We show that, compared with the two types of nongentrified neighborhoods (those not at risk and those at risk but which did not gentrify), gentrified neighborhoods experienced dramatic changes in the components of the neighborhood SES scale. Third, in Table 3, we present means of the independent variables by gentrification outcome. We show that these bivariate relationships generally follow the predicted patterns noted above. Fourth, in Table 4, we present results from multinomial logistic regressions of the gentrification outcome in 2010 on 1980 tract characteristics. These models are ideal because they enable us to compare the relationships between the independent variables and the likelihood that neighborhoods experienced one of the four types of gentrification taken individually, compared with the base outcome, nongentrification. Finally, in Figures 4 and 5, we graph the relationships between percent Black or Latino in 1980 on the probability of each gentrification type occurring by 2010.
Ethnoracial and Socioeconomic Change in Eight Gentrified Neighborhoods, 1980 to 2010.

Note. Data from 1980 to 2000 decennial census and the 2008–2010 American Community Survey. See the text for street boundaries of each tract.
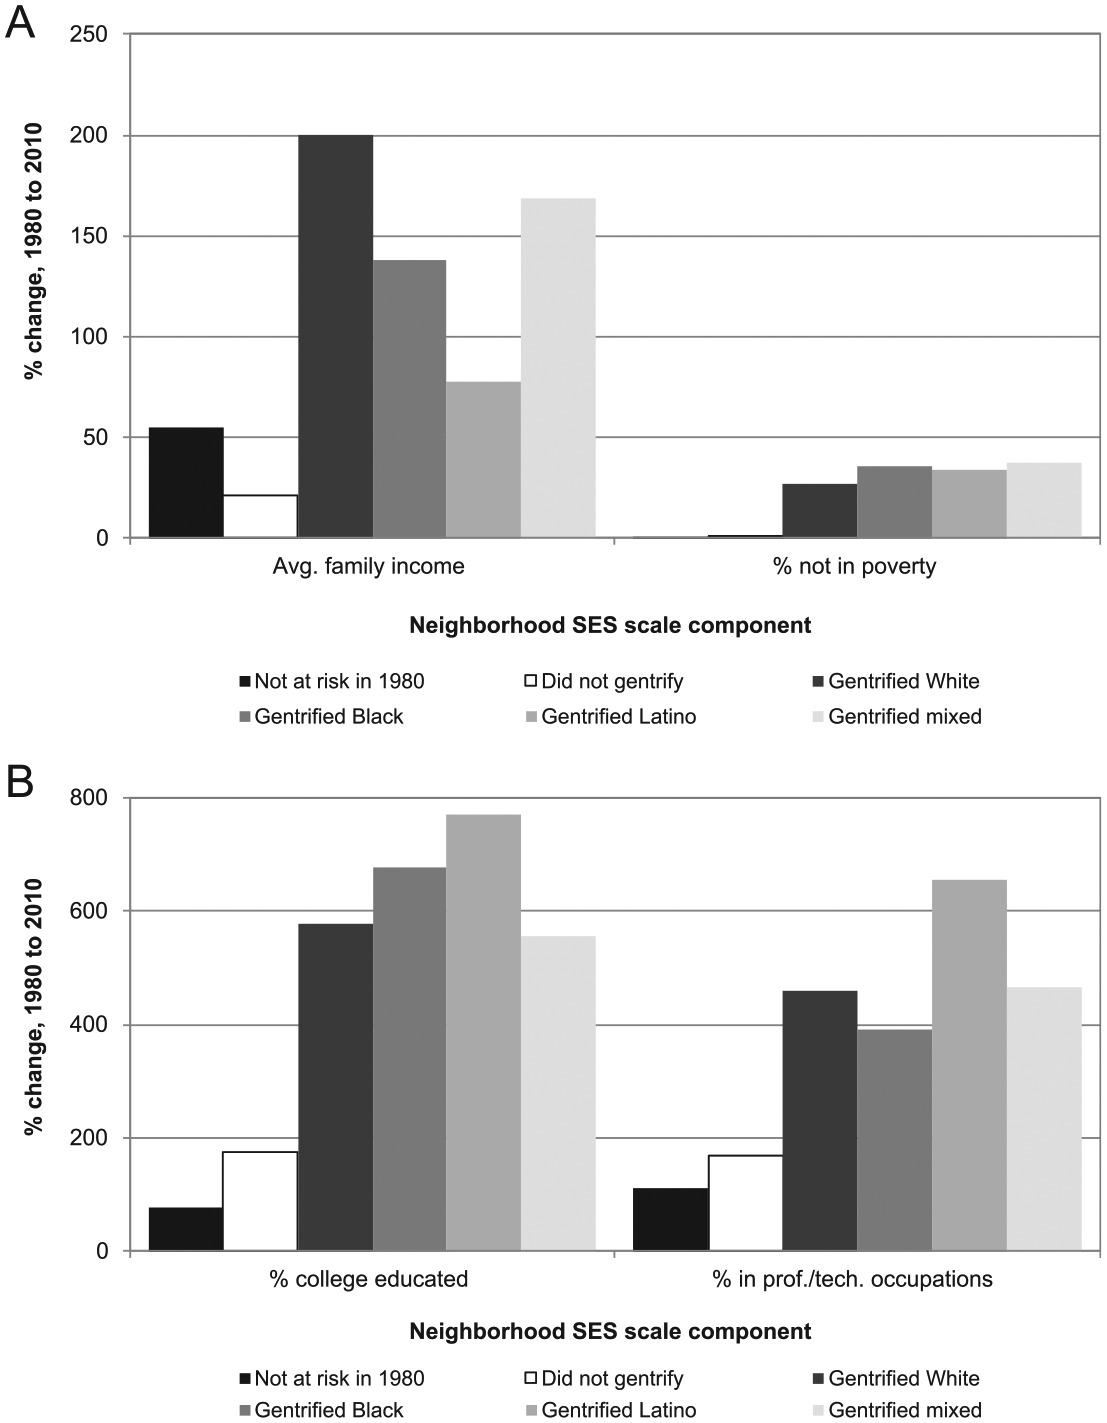
Percent change in the four components of the neighborhood SES Scale, by gentrification outcome: (A) family income and percent not in poverty; (B) percent college educated and in professional or technical occupations.
Means of the Independent Variables in 1980, by Gentrification Outcome.

Note. CBD = central business district; CTA = Chicago Transit Authority; MTA = Metropolitan Transit Authority.
Gentrified White, Black, and Latino refer to neighborhoods that gentrified from 1980 to 2010 and had a majority of residents from the relevant ethnoracial group. Gentrified mixed refers to gentrified tracts where no one ethnoracial group was in the majority.
Distance from each tract centroid to the centroid of the combined CBD tracts. CBD tracts derived from the Census Bureau’s 1982 Census of Retail Trade (U.S. Census Bureau 1982).
Coefficient and Standard Error Estimates (in Parentheses) from Multinomial Logistic Regressions of Gentrification Outcomes in 2010 on 1980 Tract Characteristics.
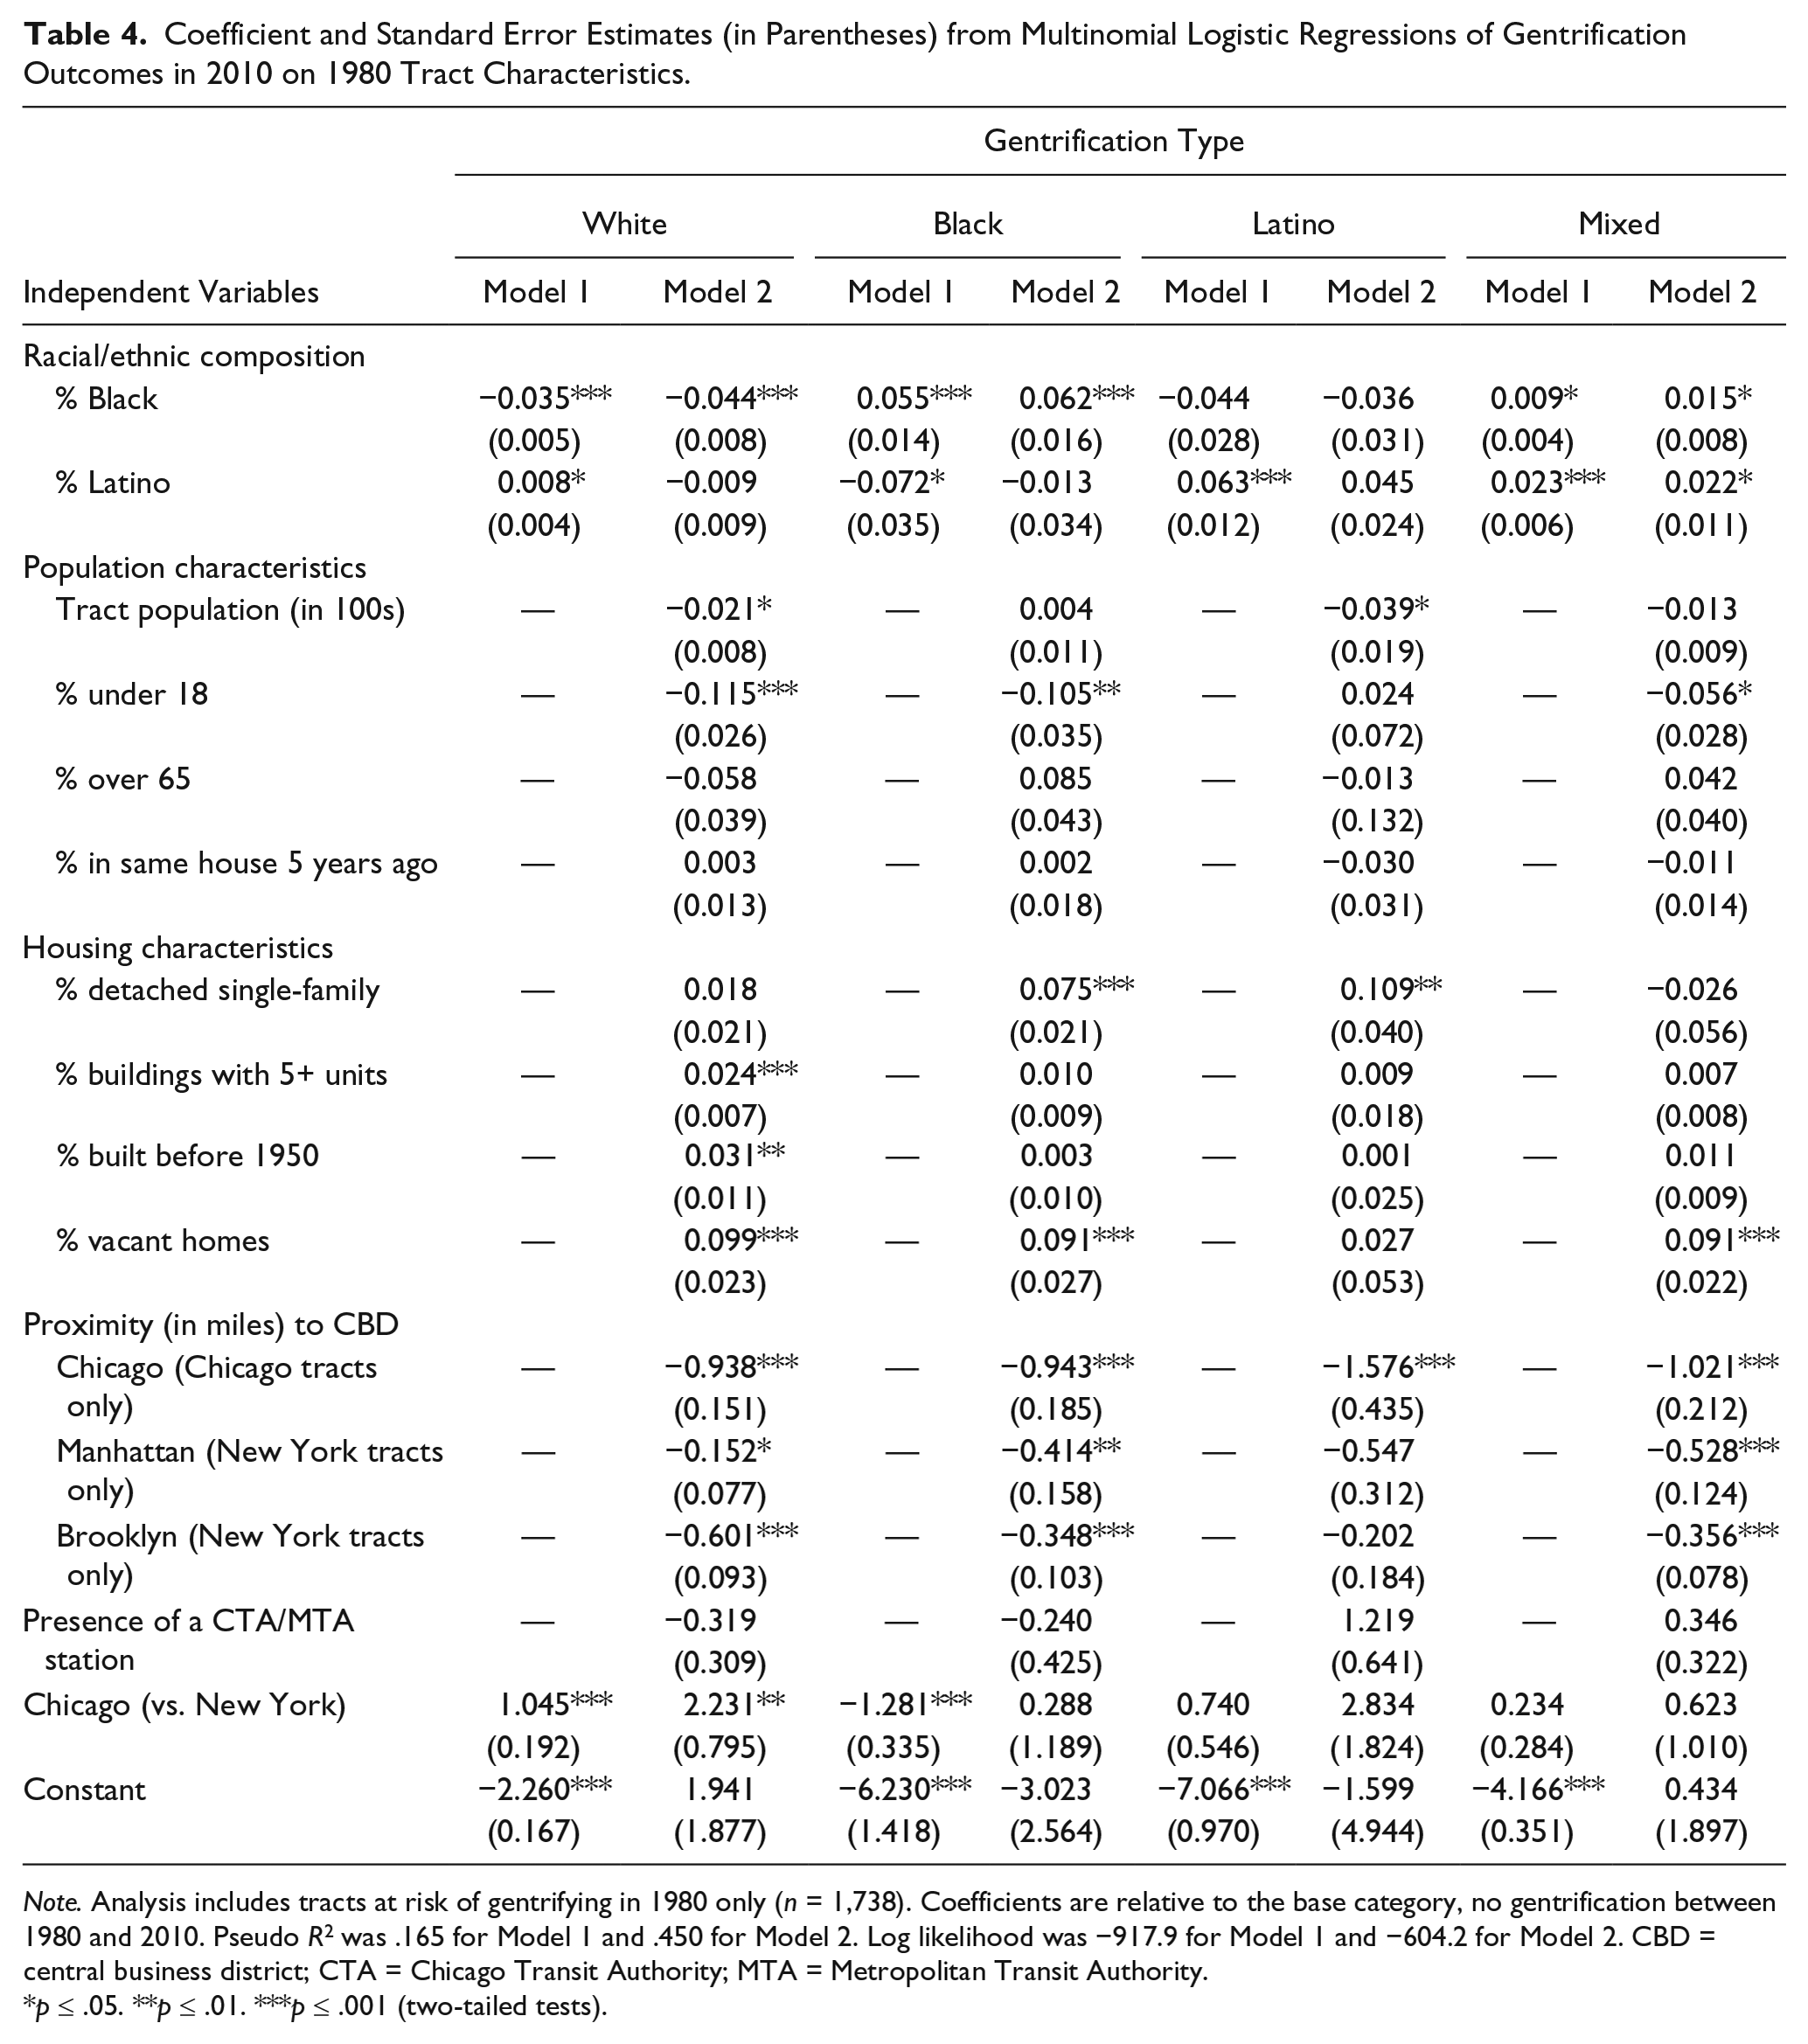
Note. Analysis includes tracts at risk of gentrifying in 1980 only (n = 1,738). Coefficients are relative to the base category, no gentrification between 1980 and 2010. Pseudo R2 was .165 for Model 1 and .450 for Model 2. Log likelihood was −917.9 for Model 1 and −604.2 for Model 2. CBD = central business district; CTA = Chicago Transit Authority; MTA = Metropolitan Transit Authority.
p ≤ .05. **p ≤ .01. ***p ≤ .001 (two-tailed tests).
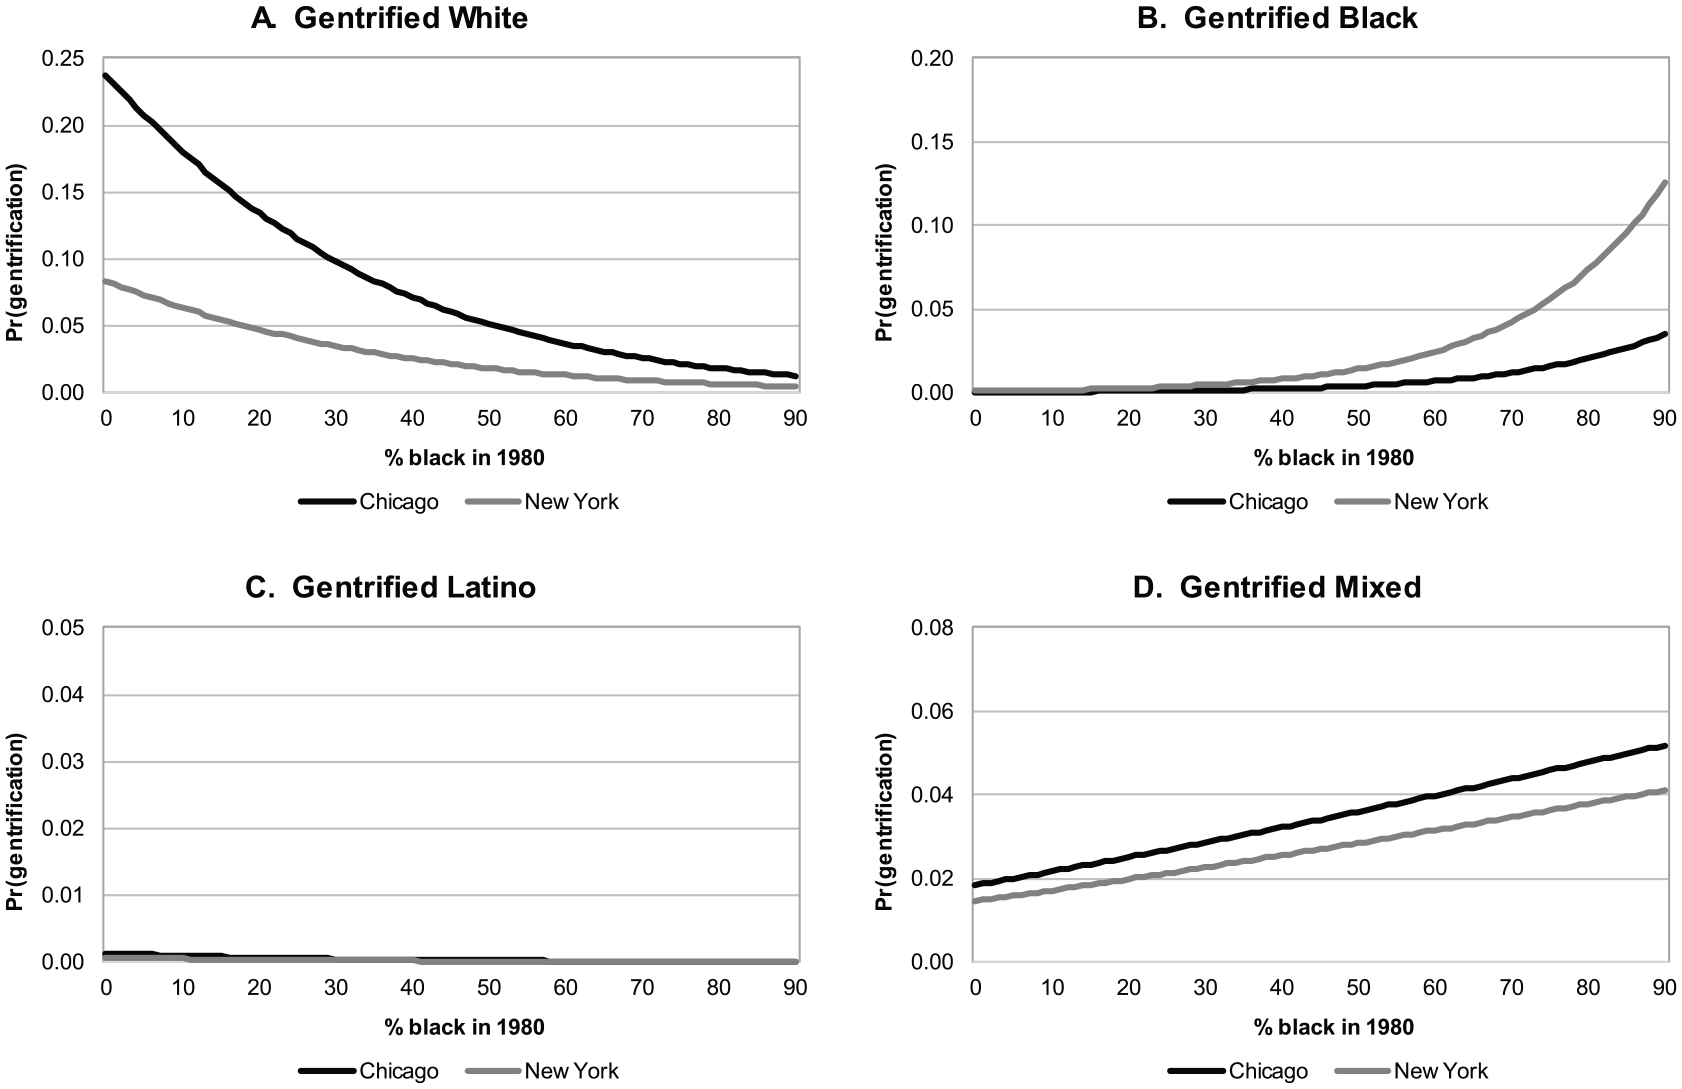
Relationship between % Black in 1980 and the probability of gentrification by 2010, by gentrification outcome and city.
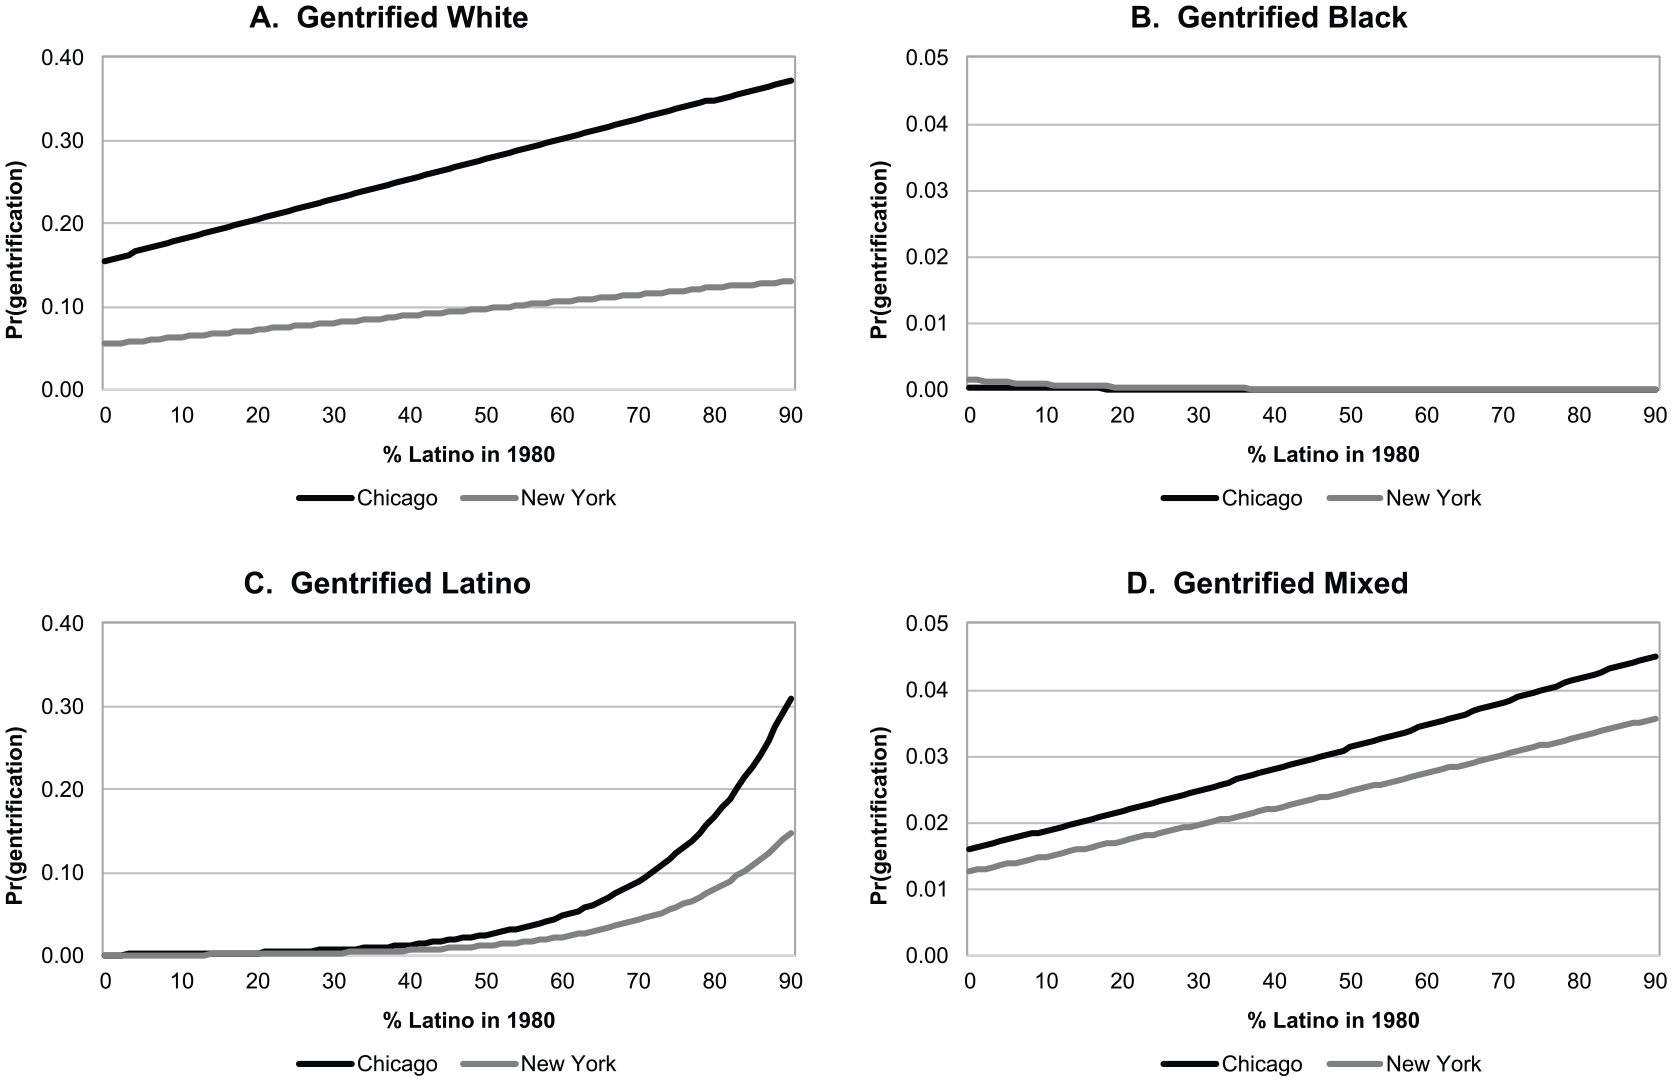
Relationship between % Latino in 1980 and the probability of gentrification by 2010, by gentrification outcome and city.
Findings
Spatial Location of Gentrification
Figures 1 and 2 show the spatial distribution of gentrification outcomes in Chicago and in the five boroughs of New York. In Chicago, note that neighborhoods on the periphery of the city to the North, East, and South were, by and large, not at risk of gentrifying in 1980. Furthermore, the majority of neighborhoods in the interior did not gentrify. Gentrified White neighborhoods were predominantly located on the city’s North Side, close to the CBD (outlined in orange), while gentrified Black neighborhoods were located on the South and to a lesser degree West Sides, amid the historical and contemporary concentration of the African-American population. Gentrified Latino neighborhoods tended to occur near the heavily Latino community areas of Pilsen and Logan Square, just southwest and northwest of the CBD, respectively. Finally, mixed gentrification occurred on the Near South Side (also near Pilsen) and northwest of the CBD near gentrified Latino neighborhoods.
The maps from New York evince a variety of patterns, though we note that in Brooklyn, gentrified White neighborhoods were most prevalent in the Williamsburg and Greenpoint neighborhoods between the Williamsburg Bridge and Newtown Creek to the north, and in the Park Slope and Gowanus neighborhoods to the northwest of Prospect Park (the large gray polygon to the south-southeast of the Brooklyn CBD), while gentrified Black neighborhoods were concentrated east of the CBD. In Manhattan, gentrified White neighborhoods were located on the edges of lower Manhattan in the East Village neighborhood and in the Hell’s Kitchen neighborhood to the west of the Midtown CBD. Gentrified Black neighborhoods occurred, not surprisingly, in the historically Black central Harlem neighborhood uptown from Central Park. In Queens, some White and mixed gentrification was to be found in the Astoria neighborhood between the Queensboro and Triborough Bridges. Finally, we observed little gentrification in the Bronx or Staten Island, the latter of which largely because so few neighborhoods were at risk of gentrifying in 1980.
To provide some examples of the way in which gentrification unfolded in Chicago and New York, Table 2 presents change over time (1980 to 2010) in the ethnoracial and socioeconomic composition of four neighborhoods coded as gentrified in each city. In Chicago, our exemplar of a gentrified White neighborhood is tract 2403, located in the northeast quadrant of Wicker Park on the city’s North Side. 16 In 1980, this neighborhood was about half White and half Latino. By 2010, it was over 88% White and 6% Latino (no Black residents were counted in any of the four censuses). In terms of socioeconomic composition, in 1980, this neighborhood ranked 633 out of 792 tracts in terms of family income, with a 2010 inflation-adjusted average of about $40,000. By 2010, the average family income was nearly $258,000, making this the 15th-wealthiest neighborhood in the city. The percentage of residents over age 25 with a college degree soared from 2.7% in 1980 to 81.0% in 2010, and the percentage of employed residents with a professional or technical occupation increased from 6.2% to 66.2% during the period.
On the city’s heavily Black South Side lies tract 8364 in the Oakland community area. 17 Once home to the Chicago Housing Authority’s Ida B. Wells, Madden Park, and Clarence Darrow Homes, Oakland has been at the center of Black gentrification in Chicago since 1990 (Pattillo 2007). In 1980, this neighborhood was over 98% Black and increased to 99.4% Black in 1990. By 2010, the percentage Black had declined to 90% and featured an influx of small White (2%) and Latino (6%) populations. The inflation-adjusted average family income was just over $22,000 in 1980, and rose rapidly in the 1990s and 2000s to its 2010 level of about $71,000. The percentage of residents with a college degree or more increased tenfold from 1980 to 2010 (from 3.2% to 33.3%), and the percentage of residents with a professional or technical occupation increased over threefold (from 11.4% to 37.6%).
Just to the northwest of Wicker Park lies tract 2214 in Chicago’s Logan Square community area. 18 This tract, coded as gentrified Latino in our data, experienced a near halving of its White population in the 1980s and 1990s (from 35% to 18%), which then rebounded to 27% by 2010. The Black population increased slowly, from 0% in 1980 to 4.6% in 2010. Meanwhile, the neighborhood experienced an increasing Latino population in the 1980s and 1990s before settling back to its 2010 level of 66%. This neighborhood experienced modest gains in family income (from an inflation-adjusted average of $42,000 in 1980 to about $62,000 in 2010) and rapid increases in its percentages of college-educated and professional workers.
Finally, some five miles to the southeast of Logan Square lies the small section of the Lower West Side community area known as Tri-Taylor, just west of the University of Illinois–Chicago campus. 19 This tract exemplifies a gentrified mixed neighborhood, in that it comprised 38% White, 18% Black, 20% Latino, and 21% Asian residents in 2010 (the latter percentage not shown in Table 2). Like the Logan Square tract analyzed above, this neighborhood experienced relatively modest increases in average family income, but rapid upgrading in terms of education and occupational status.
In New York City, we focus on four neighborhoods in Brooklyn to illustrate processes of gentrification. Tract 135 in Park Slope, 20 coded in our data as gentrified White, was 46% Latino, 22% Black, and 32% White in 1980. By 2010, it was two-thirds White, 14% Black, and just 11% Latino. In terms of income, this tract was in the 29th percentile in the five boroughs of New York in 1980, with an inflation-adjusted average family income of about $40,000. By 2010, it was in the top five percent of all tracts in New York City, with average family incomes exceeding $216,000. Concomitant with this increased income, the percentage of residents over age 25 with a college degree or better more than quadrupled, from 18% in 1980 to 78% in 2010. Similarly, the percentage of employed residents with a professional or technical occupation nearly tripled, from 25% to 70% during the period.
About three miles to the northeast of Park Slope lies the Bedford-Stuyvesant community, and specifically tract 383 in the Stuyvesant Heights neighborhood. 21 Referred to by a New York Times reporter as “Brooklyn’s Little Harlem” (A. E. Clark 1961), Bedford-Stuyvesant has been the focal point of African-American culture in Brooklyn since the 1930s. 22 In 1980, tract 383 was over 96% Black, with token percentages of White and Latino residents. By 2010, the Latino population had increased to about 12%, while the Black population declined to about 83%. This tract experienced a more than doubling of its average family income from 1980 to 2010, taking it from the 20th to the 59th percentile in New York City. Although 2010 rates of college-educated and professional workers were substantially lower than in the Park Slope neighborhood, these figures increased more than sevenfold and fourfold, respectively, during the period.
Our example of a gentrified Latino neighborhood in New York is in the Bushwick South community area, tract 285.01. 23 Located on the border of the Bushwick and Bedford-Stuyvesant communities, this tract began the 1980s with a 72% Latino population, which declined slightly over time to 69% by 2010. During the period, the White population increased from 5% to 23% and the Black population declined from 23% to 8%. Average family income in this tract more than quintupled from 1980 to 2010, resulting in a move from the first to the 79th percentile in income for the city as a whole. In 1980, no residents over age 25 were recorded as having a college degree or better. This figure increased to 21% by 2010, and the percentage of employed residents with a professional or technical degree more than quintupled during the period, from about 6% to about 34%.
Finally, nestled between Fort Greene to the west and Bedford-Stuyvesant to the east lies the Clinton Hill neighborhood, and more specifically tract 191. 24 In 1980, this tract was about two-fifths Black and two-fifths Latino; by 2010, it was just over one-fourth White and Black and over one-third Latino, making it a clear example of a gentrified mixed neighborhood in our coding scheme. Average family income, adjusted for inflation, increased from $34,000 (the 17th percentile in New York) to $79,000 (65th percentile) during the period, while the percentage with a college degree or more increased more than twelvefold and the percentage with a professional or technical degree more than tripled.
Descriptive Statistics
Dependent variable
Figure 3 presents average changes from 1980 and 2010 in the component items of the neighborhood SES scale, broken down by gentrification outcome. Because the scales of relative percent change are so different for average family income and poverty versus percent college educated and in professional and technical occupations, we show the first two in Figure 3A and the latter two in Figure 3B. The black and white bars show average changes for neighborhoods that were not at risk of gentrification in 1980 and were at risk of gentrification but did not gentrify, respectively. The gray bars represent average relative percent changes from 1980 to 2010 in the neighborhood SES dimensions for the four types of gentrification.
Note that the two types of nongentrified tracts were similar to each other in terms of their percent increases in the four components. For instance, nongentrified tracts experienced almost no change in their average poverty rates from 1980 to 2010 (the right-hand side of Figure 3A). These increases pale in comparison with those in the four types of gentrified neighborhoods, with each type experiencing at least 30% increases in the percentage of residents not in poverty. Similarly, Figure 3B shows dramatic increases in the percentage of residents with a college degree or professional or technical occupation, while there were much more modest increases in the two types of nongentrified neighborhoods. These examples underscore the point that neighborhoods not at risk of gentrification and those that were at risk but did not gentrify experienced similarly small changes over time, dramatically lower than neighborhoods that did gentrify.
Independent variables
Table 3 presents means of the independent variables for the same six sets of neighborhoods. On average, neighborhoods not at risk of gentrifying were 74% White in 1980. Neighborhoods that were at risk but did not gentrify were about 38% White, 36% Black, and 24% Latino, on average. By contrast, the average gentrified White neighborhood was about 56% White and more importantly, 33% Latino and only 8% Black in 1980. The average gentrified Black neighborhood was fully 92% Black in 1980 and the average gentrified Latino neighborhood was 69% Latino. These findings lend prima facie support for our hypotheses about the influence of neighborhood ethnoracial composition on gentrification in Chicago and New York.
Among the control variables, gentrified neighborhoods featured older and more vacant housing stock, with lower percentages of detached single-family houses and higher percentages of apartment buildings than at-risk but nongentrified neighborhoods. Gentrified neighborhoods as a group were also closer to the CBDs of Chicago, Manhattan, and Brooklyn than both types of nongentrified neighborhoods. Among the set of gentrified neighborhoods, those coded gentrified Black were substantially larger than other types of gentrified neighborhoods, and featured a more stable population in 1980. Gentrified Black neighborhoods also featured a lower percentage of older homes and a higher vacancy rate. To gauge the independent relationships between gentrification and ethnoracial composition and neighborhood-level controls, we now turn to our multiple regression findings.
Regression Findings
Table 4 presents coefficient and standard error estimates (in parentheses below each coefficient 25 ) from multinomial logistic regressions of the five-category dependent variable on the tract percentages of non-Latino Blacks and Latinos in 1980 and the control variables shown in Table 3. The figures in the “White” columns relate to the contrast between White gentrification and no gentrification, the figures in the “Black” columns relate to the contrast between Black gentrification and no gentrification, and so on.
The coefficients in Model 1 generally support our hypotheses, in that the percentage of Blacks in 1980 was negatively associated with neighborhoods’ probability of being gentrified White and positively associated with being gentrified Black in 2010. Furthermore, the Latino Model 1 shows that the percentage of Latinos in a neighborhood in 1980 was positively associated with gentrified Latino neighborhoods, as predicted by Hypothesis 3. In addition, we find a negative relationship between percent Latino and neighborhoods’ probability of being gentrified Black. We also found a positive relationship between percent Latino and the likelihood of a gentrified mixed neighborhood. Finally, we found small positive associations between percent Latino and gentrified White neighborhoods, and between percent Black and gentrified mixed neighborhoods.
Because logistic regression coefficients are in the nonintuitive log odds metric, we converted the coefficients into probabilities for hypothetical neighborhoods ranging from 0 to 90% Black and 0 to 90% Latino, and present the resulting curves in Figures 4 and 5. 26 The model predicts that a Chicago neighborhood with no Black residents in 1980 would have about a .24 probability of being gentrified White in 2010 (the black curve in Figure 4A). This probability steadily declines to nearly 0 for a neighborhood with 90% Black residents. In New York (the gray curve in Figure 4A), the same pattern occurs, though the probability of being a gentrified White neighborhood overall is lower (note the significant positive “Chicago” coefficient in the “White” Model 1 in Table 4). For gentrified Black neighborhoods (Figure 4B), the opposite relationship obtains. Such gentrification was extremely rare in neighborhoods that had fewer than 50% Black residents in 1980. For neighborhoods at risk of gentrification with 90% Black residents in 1980, the predicted probabilities of being gentrified Black by 2010 were about .13 in New York and .04 in Chicago. Gentrified Latino and mixed outcomes were rare in both cities, although the probability of being a gentrified mixed neighborhood was significantly related to percent Black in 1980 (Figure 4D).
Figure 5 shows the results of equivalent analyses for the percentage of Latino residents in Chicago and New York neighborhoods in 1980. Note that the predicted probability of being a gentrified White neighborhood in 2010 in Chicago increased rapidly as the percentage of Latinos rose, ranging from about .16 for a neighborhood with no Latinos in 1980 to about .37 for a neighborhood with 90% Latinos (Figure 5A). Again, the overall probability of being a gentrified White neighborhood was higher in Chicago than New York, although the equivalent curve for New York also demonstrated an upward-sloping pattern. Our results for gentrified Latino neighborhoods showed a strong relationship to the percentage of Latinos in 1980, especially after the 50% threshold. In Chicago, a neighborhood at risk of gentrification in 1980 with no Latinos in 1980 had essentially no chance of being gentrified Latino in 2010. However, this predicted probability increases to .30 for a neighborhood with 90% Latinos (and 10% Blacks). As with Latino and mixed gentrification in Figure 4, we found scant evidence of a relationship between Black and mixed gentrification as a function of percent Latino in 1980 in Figure 5, although there was a positive relationship between percent Latino and gentrified mixed neighborhoods shown in Figure 5D.
In Model 2 of Table 4, we control for the possible spuriousness of the association between percent Black and Latino and the four types of gentrification outcomes. Specifically, we control for population and housing characteristics, as well as measures of tract proximity to the CBD and the presence of a CTA/MTA stop. In terms of the population characteristics, we found that White gentrification was more likely in smaller tracts with fewer children, the latter of which was also true of gentrified Black neighborhoods. Housing characteristics associated with gentrified White neighborhoods included a higher percentage of apartments, structures built before 1950, and vacant homes. This latter variable was also positively related to gentrified Black and mixed neighborhoods. Black gentrification also occurred more frequently in neighborhoods with more single-family homes, also related to the probability that a neighborhood would be gentrified Latino.
The most consistent pattern of findings involved proximity to the CBDs of Chicago, Manhattan, and Brooklyn. For all groups and in both cities, the probability of being a gentrified White, Black, and mixed neighborhood increased as distance to the CBD declines (represented by the negative coefficients in Table 4). Put in more intuitive terms, imagine two Chicago tracts at risk of gentrification in 1980, both of which were 10% Black, 10% Latino, and at the Chicago mean for all other predictors of gentrification except for their distance to the CBD. Suppose that the centroid of one tract was the average distance to the CBD (6.1 miles) and the other was one standard deviation closer (2.8 miles closer, or 3.3 miles from the CBD). Our findings indicate that the more distant tract would have a .025 probability of gentrifying by any of the four groups, while the equivalent probability for the closer one would be .296, or about twelve times greater. In New York, two otherwise equivalent tracts except for their distance to the Manhattan or Brooklyn CBDs would have less than a 1% chance of gentrifying at the mean distance. A tract that was one standard deviation closer would have about a 3% chance of gentrifying in Manhattan and an 8% chance of gentrifying in Brooklyn. The reason for the discrepancy between Chicago and New York is that in the New York simulations, a tract one standard deviation closer to the Manhattan CBD would still be, according to the simulation, the average distance away from the Brooklyn CBD, or 7.2 miles. If we extend the simulation to a tract simultaneously one standard deviation closer to the Manhattan and Brooklyn CBDs, the probability of gentrification increases to .18.
Conclusions
In this article, we used census data for Chicago and New York to test the hypothesis that the racial composition of neighborhoods in 1980 was significantly related to the probability that they gentrified by 2010. More specifically, we hypothesized that the percentage of Black residents in a neighborhood in 1980 was negatively associated with the probability of being gentrified White and positively associated with the probability of being gentrified Black in 2010. We also hypothesized that the percentage of Latino residents in a neighborhood in 1980 was positively associated with the probability of being gentrified White and Latino by 2010. This analysis builds upon studies of gentrification in Chicago (Anderson and Sternberg 2012; Hwang and Sampson 2014; Hyra 2008; Lloyd 2006; Pattillo 2007) and the New York neighborhoods of Harlem (Freeman 2006; Hyra 2008; Taylor 2002) and the Lower East Side (Mele 2000) and in Brooklyn (DeSena and Shortell 2013). By explicitly considering neighborhood ethnoracial composition in an analysis of neighborhood change, we take account of the large body of neighborhood preference literature that consistently finds Whites unwilling to move into neighborhoods with even a small African-American population (Bobo and Zubrinsky 1996; Farley et al. 1978; Farley et al. 1994; Krysan and Bader 2007; Timberlake 2000).
Our analysis measured the impact of percentage non-Latino Black residents in 1980 on the likelihood that a poor census tract would increase in SES between 1980 and 2010, controlling for previously established predictors of gentrification, such as population and housing characteristics and proximity to the CBD and public transportation (Betancur 2002; Galster et al. 2003; Hammel and Wyly 1996; Heidkamp and Lucas 2006; Hwang and Sampson 2014; Ley 1996; Pattillo 2007; Smith 1996; Wyly and Hammel 1998, 1999). From these analyses, we conclude that gentrified White neighborhoods were more likely to occur near to the CBD and in neighborhoods that had very low percentages of African-American residents, in contrast to oft-cited fears of “Negro removal redux.” 27
We remain cautious about generalizing our findings to other cities. The extent of segregated gentrification we found in Chicago and New York may indeed be a result that is particular to these cities’ entrenched histories of racial segregation. As “hypersegregated” cities (Massey and Denton 1993), the neighborhood change taking place in Chicago and New York may occur along racial lines in ways that are distinct from other cities that feature less segregation, newer built environments, or smaller African-American and Latino populations. Future research should test these findings in other cities to see whether these trends of segregated gentrification continue in Chicago, New York, and elsewhere. Importantly, these findings maintain the importance of race and ethnicity in the inner city, both confirming and challenging previous research and assumptions about gentrification. Contrary to popular assumptions, gentrification is not turning all Black inner city neighborhoods White, at least in Chicago and New York. Rather, in this instance, some poor White, Black, and Latino neighborhoods experience increases in SES separately. This strongly suggests that, as with much else in the contemporary United States, processes of gentrification occur along highly segregated lines.
Footnotes
Acknowledgements
The authors thank Japonica Brown-Saracino for helpful feedback; Amy Baumann Grau, Aaron Howell, and especially Amanda Staight for research assistance; and Steve Carlton-Ford, Paula Dubeck, Derek Hyra, Jennifer Malat, Daniel Sullivan, and three Urban Affairs Review reviewers for comments on earlier drafts of this manuscript.
Declaration of Conflicting Interests
The author(s) declared no potential conflicts of interest with respect to the research, authorship, and/or publication of this article.
Funding
The author(s) disclosed receipt of the following financial support for the research, authorship, and/or publication of this article: This research was supported by the University Research Council and the Charles Phelps Taft Research Center at the University of Cincinnati.