



Abstract
An understudied outcome of foreclosure crises is how their aftershocks affect partisan elections. Two hypotheses are that partisan shifts may occur in neighborhoods with concentrated foreclosures because of (1) declines in turnout among liberal leaning voters or (2) swells of anti-incumbency among all voters. This research explores these hypotheses in Maricopa County, Arizona, by using econometric modeling to uncover associations among neighborhood foreclosures, voter turnout, and changes in the Republican vote share between the 2006 and the 2010 Arizona gubernatorial and U.S. Senate elections. Our results show evidence of (1) anti-incumbent voting behavior and more liberal shifts among neighborhoods harder hit by foreclosures and (2) conservative shifts in neighborhoods experiencing African-American and Latinx population growth. These findings are suggestive of a link between neighborhood housing market distress and neighborhood partisan shifts, which in aggregate may shape state and national policymaking and future neighborhood conditions.
Introduction
A diverse body of scholarship reveals how the foreclosure crisis and subsequent Great Recession affected people and neighborhoods in the U.S. Poorer neighborhoods and communities of color, particularly segregated African-American and Latinx communities that experienced sudden “greenlining” after decades of redlining, were more affected by foreclosures (e.g., Anacker, Carr, and Pradhan 2012; Hernandez 2009; Lichtenstein and Weber 2014; Rugh and Massey 2010; Wyly et al. 2009). Concentrated foreclosures had multiplier effects on neighborhood quality of life, including declining property values and local public services and increasing crime (e.g., Ellen, Lacoe and Sharygin 2013; Immergluck and Smith 2006a, 2006b; Katz, Wallace, and Hedberg 2013; Kingsley, Smith, and Price 2009; Kobie and Lee 2011).
Less understood is whether and how the recent downturn affected political outcomes. Research has shown that the Great Recession was fundamentally a housing issue, not simply an economic or financial crisis, and had its roots in local policy decisions about how, where, and for whom housing was built (Glasgow, Lewis, and Neiman 2012; Schafran 2013). The scholarly community also has few doubts as to the important role of state and national policy in the production of foreclosure (Immergluck 2011). But did voters feel similarly? Did living in a high foreclosure neighborhood impact voting in state and national elections? or To put it broadly, is housing an overlooked factor in explaining electoral behavior?
In this article, we explore the link between housing distress and electoral politics by examining the connection between foreclosures and the 2006 and the 2010 Arizona gubernatorial and U.S. Senate elections in Maricopa County, Arizona—a fast-growing Sunbelt region hard hit by the recent recession. We use econometric methods to investigate two mechanisms that may link housing downturns to neighborhood political shifts—a decline in turnout among liberal leaning voters and a rise in anti-incumbency among all voters. Although there is no clear evidence linking a decline in liberal voter turnout to foreclosures, our results show strong evidence of anti-incumbent voting behavior in neighborhoods harder hit by foreclosures. These findings suggest that there is a relationship between neighborhood housing distress and neighborhood partisan shifts, which is in line with some, but not all, of the recent literature on the relationship between the foreclosure crisis and voting patterns (Healy and Lenz 2017; Raymond 2017; Zonta, Edelman, and McArthur 2016). Our neighborhood-level approach also reveals the potential of applying the geographic sensibilities of urban studies to questions that have traditionally fallen within the purview of political science.
In the following sections, we first review the limited literature that directly examines the link between foreclosures and voting patterns. We then describe potential linkages between foreclosures and partisan voting behavior, drawing on literature from a wide variety of fields, and show how we generated testable hypotheses regarding voter turnout and anti-incumbency. We then describe our case study site, hypotheses, and methodology and explore the links among neighborhood foreclosure rates, voter turnout, and the change in the Republican vote share between the 2006 and the 2010 Arizona gubernatorial and U.S. Senate elections in Maricopa County.
We conclude by examining the implications of this research, including the possibility of a housing distress political feedback loop. We outline a research agenda to further explore relationships between housing and electoral politics in the United States, including the need to focus on a potential transitive link between housing crises and electoral change, such as through neighborhood demographic shifts.
The Underexamined Link Between Housing and Voting
Research on the effects of the housing crisis on partisan voting behavior has only recently begun. So far, the findings are inconclusive. National polling data on the political attitudes of the foreclosed show no evidence that they disproportionately express particular partisan leanings; rather, the foreclosed exhibit a mix of “disenfranchisement and disillusionment,” whereby they seem less likely to vote and believe in the possibility of electoral politics (Martin and Niedt 2015). This finding dovetails with research on the effects of foreclosure on voter turnout, which shows depressed turnout among the foreclosed and in neighborhoods hard hit by foreclosure (Estrada-Correa and Johnson 2012; Hall, Yoder, and Karandikar 2017).
A few studies suggest that housing distress may influence partisan voting behavior (Healy and Lenz 2017; Raymond 2017; Zonta, Edelman, and McArthur 2016). For instance, midwestern and rustbelt counties with a higher percentage of underwater homes (i.e., owing more than a home is worth) were more likely to express increased voter support for the Republican presidential candidate from 2012 to 2016 (Raymond 2017; Zonta, Edelman, and McArthur 2016). California zip codes with greater increases in delinquency rates for consumer loans, including mortgages, from 2006 to 2008 were more likely to express increased voter support for the Democratic presidential candidate from 2004 to 2008 (Healy and Lenz 2017). Yet, the evidence is not unanimous. U.S. counties that had higher foreclosure rates in between presidential and legislative elections during the 2000s and 2010s were no more or less likely to vote for incumbents (Hall, Yoder, and Karandikar 2017).
A key challenge in understanding links between housing crises and partisan voting behavior is that the above-cited research remains the exception, not the rule, in both urban studies and political science, especially when it comes to partisanship. Housing scholars in the field of urban studies generally focus more on the political economy of housing or housing policy than on elections; when these scholars examine the ballot box, they tend to focus on housing-specific issues (e.g., Calavita 1992; Gay 2017; Gerber and Phillips 2003; Nelson, Uwasu, and Polasky 2007; Nguyen 2007). 1 Mainstream political science literature is largely silent on how housing might affect voting behavior beyond its distributive component. A scan of four leading texts on polarization and partisanship yields barely a mention of housing (Green, Palmquist, and Schickler 2002; Lewis-Beck et al. 2011; McCarty, Poole, and Rosenthal 2008; Nivola and Brady 2008). Housing is entirely missing from the index of The Oxford Handbook of American Elections and Political Behavior (Leighley 2010). Housing is incidental in half of the few recent political science studies on foreclosures and voting behavior reviewed above, as these scholars’ main interest is on the relationship between the economy and elections (Hall, Yoder, and Karandikar 2017; Healy and Lenz 2017).
Knowledge on how housing crises might affect partisan voting behavior within neighborhoods is especially scant, as most of the recent literature on foreclosures and elections focuses on counties or individuals. Foreclosures do not just befall or spare individual potential voters; they also affect the communities in which voters live (e.g., Ellen, Lacoe, and Sharygin 2013; Immergluck and Smith 2006a, 2006b; Katz, Wallace, and Hedberg 2013; Kingsley, Smith, and Price 2009; Kobie and Lee 2011). Foreclosures are relatively rare events even in hard-hit regions in the throes of a severe recession, but it is reasonable to suppose that their influence multiplies beyond those they directly affect when they concentrate in particular neighborhoods and not others.
In the absence of clear guidance from either housing or politics scholars on the relationship between housing downturns and partisan voting behavior, we broadened our search to include the urban studies literatures on the effects of the recent recession and homeowners’ civic engagement and the political science literature on voting behavior. These literatures point to two possible mechanisms that may link housing downturns to partisan voting behavior, which also are mentioned in Healy and Lenz (2017) and Hall, Yoder, and Karandikar (2017). The first is a link between foreclosures and declines in turnout among more liberal leaning voters. The second is a link between foreclosures and swells of anti-incumbency among all voters. These two mechanisms form the basis for our hypotheses, which we describe and consider in the subsequent sections.
Declines in Turnout Among Liberal Leaning Voters
One way that neighborhood foreclosures may relate to partisan shifts is by depressing voter turnout. Demographic characteristics are strongly linked with partisan preferences (Pew Research Center 2015). The relationship between race and ethnicity and partisan preference is of particular interest in this research given the extreme racial inequality in the experience of foreclosure, as previously discussed. African-Americans and Latinxs, traditionally more liberal or left-leaning demographic groups, experienced the foreclosure crisis more intensely than non-Latinx Whites, a traditionally more conservative leaning demographic group (Pew Research Center 2015; for example, Anacker, Carr, and Pradhan 2012; Lichtenstein and Weber 2014; Wyly et al. 2009). Thus neighborhood foreclosures may lead to conservative shifts by reducing turnout among African-American and Latinx voters.
Declines in voter turnout among African-Americans and Latinxs may stem from three separate outcomes from foreclosures—(1) declines in homeownership, (2) heightened economic adversity, and (3) higher residential mobility. First, neighborhood foreclosures may usher in a conservative shift by reducing the number of more liberal leaning homeowners within the neighborhood. This shift may happen as more liberal-leaning homeowners leave the neighborhood after undergoing foreclosure and fewer liberal-leaning homeowners move into the neighborhood. There is broad consensus that homeownership in the United States is associated with higher rates of voting (e.g., DiPasquale and Glaeser 1999; Fischel 2005; Manturuk, Lindblad, and Quercia 2009; McCabe 2013; Zavisca and Gerber 2016). Homeowners participate in politics to a greater extent than renters because of their need to protect what is, for most of them, their most valuable financial asset—their own home (Fischel 2005). Homeowners also have more of an incentive to vote to preserve and enhance their neighborhood quality of life, because they stay put for longer than renters (Cox 1982; Ihrke and Faber 2012). Thus when neighborhoods with concentrated foreclosures experience a decrease in their proportion of more liberal-leaning homeowners, their liberal voter turnout may also decrease.
Second, economic adversity in the wake of foreclosures may reduce turnout among more liberal voters and lead to a conservative shift. Economic adversity was common within neighborhoods with concentrated foreclosures. Families who underwent foreclosure typically experienced a “perfect storm” of economic disasters such as job loss, illness, and divorce (Bowdler, Quercia, and Smith 2010; Kingsley et al. 2009; Saegert, Fields, and Libman 2009; Pfeiffer et al. 2017). Data from the National Suburban Survey found that homeowners experiencing foreclosure between the fall of 2007 and 2010 were more likely to experience unemployment (Niedt and Martin 2013); unemployment also was more commonly experienced by African-Americans and Latinxs than non-Latinx Whites during this period (U.S. Census Bureau 2010a). Homeowners who were able to short sell or hold on to their homes but were underwater (owed more on their mortgage than their home was worth) also experienced economic adversity (White 2010). Economic adversity, in turn, is associated with lower voter turnout (Rosenstone 1982). Thus neighborhoods with more foreclosures may have more concentrated economic adversity, lower voter turnout among liberal-leaning African-Americans and Latinxs, and therefore a more conservative lean in election outcomes.
Third, higher residential mobility in the wake of foreclosures also may reduce voter turnout among more liberal-leaning African-Americans and Latinxs and lead to a conservative shift within neighborhoods. Neighborhoods with concentrated foreclosures had higher residential mobility, particularly those where investors bought and converted former foreclosures to rentals, as renters are more likely to move (Ihrke and Faber 2012). People who have recently moved are less likely to vote (Estrada-Correa and Johnson 2012; Gay 2012; Squire, Wolfinger, and Glass 1987). The logistics of registering to vote—one among many “to-dos” for people in the process of moving—deter recent movers from voting (Squire, Wolfinger, and Glass 1987). The impact on the electorate falls disproportionately on young adults, who move at the highest rates and also are traditionally more liberal leaning (Pew Research Center 2015; Squire, Wolfinger, and Glass 1987).
Furthermore, foreclosures force involuntary moves on homeowners, which may compound a household’s stress and barriers to voting (Estrada-Correa and Johnson 2012; Hall, Yoder, and Karandikar 2017; Martin and Niedt 2015). For example, people who experienced foreclosure were less likely to vote in Ohio in the 2000s and 2010s, with stronger effects occurring when foreclosures happened close to election day (Hall, Yoder, and Karandikar 2017). Voters in California zip codes with higher foreclosure rates were less likely to participate in the 2008 presidential election (Estrada-Correa and Johnson 2012), which suggests that the impacts of foreclosure on voting behavior fall not just on the relatively small number of people who experience it directly but also those who live in neighborhoods where foreclosures are spatially concentrated. It follows that neighborhoods with more foreclosures may have higher residential mobility, lower voter turnout, and a more conservative lean to election outcomes if movers are disproportionately more liberal leaning.
Overall, this diverse body of research on the link between voter turnout and homeownership, economic adversity, and residential mobility suggests that housing downturns could lead to a net loss among more liberal leaning voters and a conservative shift within the hardest hit communities. This conservative shift, under this explanation, occurs because more liberal leaning votes are lost through African-Americans and Latinxs transitioning out of homeownership and experiencing economic stress than are gained when African-Americans and Latinxs move locally and become renters, because newcomers and renters and economically stressed people have low rates of voting.
Rise in Anti-Incumbency Among All Voters
Another way that neighborhood foreclosures may relate to partisan shifts is by sowing voters’ discontent with political incumbents who support the status quo and fueling support for political challengers who vow to change the status quo. A recurrent theme in the political science literature is that economic shocks may influence voters to reject incumbents. Bartels (2013) cautioned against a “romantic” notion of democracy, that is, that voters rationally choose from among a set of competing policy programs and select the one that best aligns with societal interests, or at least their interests. Instead, voters punish or reward incumbents based on the performance of the economy in a pattern that largely transcends ideology. This tendency is particularly strong in a two-party system such as the United States, where aside from (usually marginal) third-party candidates or cases where seats are open, voters’ choices are limited to supporting the status quo (the incumbent) or voting for change (the challenger; Blendon and Benson 2010).
Bartels demonstrates the link between economic growth and support for incumbency across national contexts, and in a separate analysis uses only the two factors of incumbency and income growth to account for fully 75% of the variation in U.S. presidential election results dating back to World War II. Seen through this lens, the rightward lurch exemplified by the Tea Party wave in the 2010 election—a movement captured in our empirical results—was to many political scientists entirely predictable, despite the befuddlement it evoked from many media commentators (Blendon and Benson 2010).
Whether a relationship between nationwide economic growth and anti-incumbency translates to anti-incumbency in the wake of neighborhood foreclosures is unclear but at least plausible. For instance, Bisgaard, Sønderskov, and Dinesen (2016) used disaggregated survey data to demonstrate that Danish residents’ perceptions of the state of the national economy are strongly related to the level of unemployment that exists within close proximity (80 meters) to their residence. A body of literature on homeowners’ civic engagement finds that dissatisfied homeowners are more likely to vote than either satisfied homeowners or renters (Holian 2011; Manturuk, Lindblad, and Quercia 2009). Homeowners are particularly more likely to vote in disadvantaged neighborhoods, as they may feel more of a need to politically engage to protect their investment (Manturuk, Lindblad, and Quercia 2009). Concentrated foreclosures are associated with declining property values, increasing crime, and a growing incidence of underwater mortgages (e.g., Ellen, Lacoe, and Sharygin 2013; Immergluck and Smith 2006a, 2006b; Joint Center for Housing Studies 2011; Katz, Wallace, and Hedberg 2013; Kingsley et al. 2009; Kobie and Lee 2011). These conditions are a recipe for higher homeowner discontent and potential anti-incumbent support. Furthermore, newcomers to the community (e.g., renters moving into former foreclosures converted to rentals by investors) may have aligned their voting behaviors with longtime residents in the community to fit in if they overcame barriers to voting after a move. This phenomenon, which has been empirically demonstrated in the United Kingdom (MacAllister et al. 2001), could increase the effect of existing anti-incumbent sentiment in the neighborhood at the polls.
Evidence of a link between the recent housing downturn and anti-incumbency is building, especially in the literature devoted to examining the electoral impacts of foreclosure, as was previously discussed (Healy and Lenz 2017; Raymond 2017; Zonta, Edelman, and McArthur 2016). Another recent study shows that congressional districts where voters felt more positively about their lives were more likely to re-elect incumbents than districts where voters felt less positively about their lives in the 2010 U.S. House of Representatives elections (Park and Peterson 2019). These findings suggest that concentrated foreclosures may be associated with (1) conservative shifts in neighborhoods when liberals are incumbents or open seats are contested after having been vacated by a liberal officeholder or (2) liberal shifts in neighborhoods when conservatives are incumbents or open seats are contested after having been vacated by a conservative officeholder.
The 2006 and 2010 Arizona Gubernatorial and U.S. Senate Elections in Maricopa County, Arizona
Maricopa County, Arizona, is an ideal place to investigate whether neighborhood foreclosures are associated with neighborhood partisan shifts in state and national elections, and if so, whether declines in turnout among liberal-leaning voters or anti-incumbency play a role. Maricopa County is a large, fast growing region in the U.S. Sunbelt, defined by its largely automobile-dependent and suburban form. Untrammeled growth in single-family detached homes and increases in homeownership during the early to mid 2000s, sometimes on the backs of risky and subprime loans, contributed to the region becoming one of the epicenters of the foreclosure crisis (Glasgow, Lewis, and Neiman 2012; Ross 2011; Schafran 2013). Maricopa County’s single-family detached housing stock grew about 30% from 2000 to 2006, with some of the most rapid growth occurring in its outlying “boomburbs,” including Chandler, Gilbert, Glendale, Mesa, and Peoria (Lang and LeFurgy 2007; U.S. Census Bureau 2000, 2006). The county’s homeownership rate increased from 67% to 68% during this period (U.S. Census Bureau 2000, 2006). However, increases in homeownership were short-lived, as foreclosures flooded Maricopa County’s real estate market during the late 2000s and the early 2010s. Foreclosures increased dramatically between 2007 and 2008 and peaked in 2009 and 2010, when banks were foreclosing on about 50,000 homes a year. Foreclosures decelerated rapidly between 2011 and 2012. Overall, about 220,000 homes were foreclosed on in the county from 2004 through mid-2014 (Information Market 2014). The county’s homeownership rate plummeted from 68% to 64% from 2006 to 2010 alone (U.S. Census Bureau 2000, 2006, 2010b).
Maricopa County is also a microcosm of the political polarization of the United States. The county is home to most of the population of Arizona, the state with the nation’s greatest “racial generation gap,” or demographic gulf between a hyperdiverse, liberal-leaning young population and an overwhelmingly White, conservative-leaning elderly population (Pastor, Scoggins, and Treuhaft 2017). About 41% of Maricopa County residents identified as people of color in 2010, a one-percentage point increase from 2006 (U.S. Census Bureau 2006, 2010b). Maricopa County’s non-Latinx White population dropped from 60% to 59% from 2006 to 2010 (U.S. Census Bureau 2006, 2010b). The proportion of Maricopa County voters registered Republican (conservative) was 43% and 38% during the 2006 and 2010 general elections respectively. The proportion of voters registered Democrat (liberal) was 30% and 29% respectively, with the balance registered under third parties or as independents (Arizona Secretary of State 2017).
We focus on the 2006 and 2010 Arizona gubernatorial and U.S. Senate elections in this research. The 2010 gubernatorial election is of particular interest as it was one of many across the country that cemented the power of the emergent Tea Party, an insurgent political movement that largely unfolded within the long-established Republican Party and sought to upend its priorities. Tea Party politicians value freedom from government regulation and reject social welfare programs and policies that might expand the reach of government, like universal health care. In January 2009, Jan Brewer, a Tea Party Republican who was serving as Arizona Secretary of State at the time, succeeded Democratic Governor Janet Napolitano (who handily beat her Republican opponent Len Munsil in 2006), after President Obama appointed Napolitano as Secretary of the Department of Homeland Security. In April 2010, Brewer infamously signed into law SB 1070, which allowed law enforcement to ask for the papers of detainees suspected of being in the country illegally. In November 2010, Brewer beat a formidable Democratic candidate with deep political roots, Terry Goddard, who was the Arizona Attorney General, to earn the right to serve a full-term as governor.
The 2006 and 2010 Senate elections were less dramatic. These elections resulted in victories by a comfortable margin for two Republican incumbents over their Democratic challengers. In 2006, incumbent Republican Jon Kyl beat Democrat Jim Pederson, a real estate developer. In 2010, incumbent Republican John McCain beat Democrat Rodney Glassman, a Tucson City Councilman.
Overall, these races present an excellent opportunity to explore whether anti-incumbency is a mechanism linking housing distress to partisan shifts. Conservatives were incumbents in both of the studied races in 2010, which was in the wake of the worst foreclosure crisis in the United States since the 1930s. A liberal shift in voting might signal a rise in anti-incumbency in neighborhoods harder hit by foreclosures.
Hypotheses
Three hypotheses on the links among neighborhood foreclosure rates, voter turnout, and partisan shifts emerged from our review of the urban studies and political science literatures. These hypotheses form the basis for our analysis of the 2006 and 2010 Arizona gubernatorial and U.S. Senate elections in Maricopa County. Hypotheses 1 and 2 relate to the theory that declines in turnout among liberal-leaning voters in the wake of foreclosures are associated with a conservative electoral shift. Hypothesis 3 relates to the theory that foreclosures are associated with a decline in electoral support for incumbents.
Data and Method
This research uses a unique data set on foreclosures, voting outcomes, and neighborhood conditions to explore the relationships among neighborhood foreclosures, voter turnout, and partisan shifts in the Maricopa County 2006 and 2010 Arizona gubernatorial and U.S. Senate races. We use descriptive statistics and ordinary least squares (OLS) regression to investigate whether declines in turnout among more liberal voters or a rise in anti-incumbency among all voters were associated with partisan shifts in neighborhoods harder hit by foreclosure.
Three sources of data inform this research. The first is property-level data on deeds of trust or real estate transactions in Maricopa County for the 22 months preceding the 2010 general election—January 2009 through October 2010 (Information Market 2014). Data were obtained from Information Market, a company respected by the local real estate industry that aggregates publicly available information from the Maricopa County Recorder. This source tells us when and where foreclosures occurred. A property was counted as undergoing foreclosure if one of the following transactions was filed with the county: trustee’s deed (the most common), deed in lieu of foreclosure, sheriff’s deed, treasurer’s deed, or completion of forfeiture. About 102,000 homes in Maricopa County underwent foreclosure during the studied period. Property addresses of homes that underwent foreclosure were geocoded to 2010 census tracts, the definition of neighborhoods used in this research. We then divided the number of foreclosures by the number of homes within each neighborhood (see description of the U.S. Census data source below) and multiplied by 1,000 to arrive at our primary independent or explanatory variable, the foreclosure rate per 1,000 homes for the January 2009 through October 2010 period.
The second data source is precinct-level voting returns for the November 2006 and November 2010 Maricopa County general elections, obtained from the Maricopa County Recorder (2006, 2010). The voting data contain information on the candidates, their political affiliations, number of votes cast per candidate, and voter registration. There were 1,142 precincts in Maricopa County during the 2006 and 2010 general elections. There was an average of 1,397 registered voters per precinct in 2006 and 1,623 registered voters per precinct in 2010.
Some precinct boundaries changed from 2006 to 2010. We used geographic information systems (GIS) to calculate the percent of area for 2006 precincts found within the boundaries of the 2010 precincts. We then multiplied this percentage by the 2006 voting outcomes to more accurately represent changes in voting outcomes over time. A downside to our approach is that it assumes that a precinct’s 2006 voting outcomes were evenly distributed across its area, when in fact there may have been clusters of particular kinds of voting behavior within the precinct. However, the percent of area approach is a standard way to deal with problems of geographic boundary changes over time.
We then linked precinct boundaries to 2010 census tract boundaries using a crosswalk developed by the Missouri Census Data Center (MCDC; 2017). We used the 2010 population as a weight for determining the proportion of the precinct contained within each tract. MCDC relies on the U.S. Census’s voting tabulation district (VTD) category in linking precincts to tracts. VTDs should match exactly with county precincts; however, administrative errors happen when counties transmit information on their precincts to the Census Bureau. The Arizona Independent Redistricting Commission (2011a) found that 32% of Maricopa County’s precincts had issues with incorrect labeling or area. The Commission developed a key matching VTDs to precincts, which we used to correct errors in our analysis (Arizona Independent Redistricting Commission 2011b).
We created two variables from the finalized voting returns dataset. The first variable measures the change in the Republican vote share in a given neighborhood for the Arizona gubernatorial and U.S. Senate races from 2006 to 2010—our main dependent or outcome variable. This variable was calculated by dividing the number of votes cast for the Republican in the race in the neighborhood by the number of votes cast for either the Republican or Democratic candidate in the race in the neighborhood. This value represents the Republican candidate’s share of the vote relative to the Democratic candidate for each race in the neighborhood, a value that in principle could range from 0% to 100%. We disregarded votes cast for third-party candidates. Next, we subtracted the Republican candidate’s vote share in 2006 from their vote share in 2010 to determine the change in the Republican vote share in the neighborhood from 2006 to 2010. The formula is
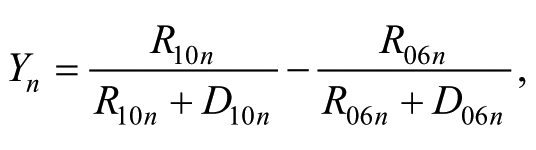
where Y is the change in the Republican vote share in neighborhood n, R10 is the votes cast for the Republican candidate in 2010, D10 is the votes cast for the Democratic candidate in 2010, R06 is the votes cast for the Republican candidate in 2006, and D06 is the votes cast for the Democratic candidate in 2006.
The second variable created from the voting returns dataset was the change in voter turnout from 2006 to 2010, an independent variable that may intervene in the relationship between neighborhood foreclosures and voting outcomes. We first calculated the voter turnout for each race within the neighborhood by dividing the total number of votes cast for the race, including for third-party or write-in candidates, by the number of registered voters, whether registered as Republicans, Democrats, or neither. We then subtracted the voter turnout for the race in 2006 from the voter turnout for the race in 2010 to arrive at the change in voter turnout from 2006 to 2010.
The final data sources used in this research are the 2000 and 2010 U.S. Census and the 2008 to 2012 American Community Survey five-year estimates (U.S. Census Bureau 2000, 2010b, 2012). We used linear interpolation to arrive at 2006 values for variables derived from this data. We created our final independent variable, the change in the percent African-American or Latinx in the neighborhood from 2006 to 2010 (expressed in terms of percentage points), from this data set. We also included a handful of control variables associated with voting behavior, including the neighborhood’s percent of seniors (aged 65 years and older), non-Latinx Whites, adults aged 25 years and older with at least a bachelor’s degree, homeowners, vacant homes, and families in poverty. There are two limitations to this data. First, linear interpolation is an imperfect way of estimating conditions in the middle of two points in time, as it assumes a smooth progression from the earlier to later period, which may not reflect reality. Second, readers should keep in mind that our measure of the percent of vacant homes includes seasonal vacancies, which are common in Maricopa County’s many “snowbird” communities where people from colder U.S. states and Canada (mainly non-Latinx Whites) come to spend the winter. Margins of error for the neighborhood-level estimates for seasonal vacancies from the American Community Survey were too large to warrant inclusion in our analysis.
After joining the three data sets together, we explored our three hypotheses through (1) descriptive statistics such as means and bivariate correlations and (2) OLS regression modeling. The basic OLS model is specified as follows:

where Y is the dependent variable in neighborhood n, β0 is the intercept, β1n is the effect of the explanatory variable, X2n is a matrix of the control variables with effects captured in a β2n vector, and en is the error term. OLS regression was an appropriate specification for our analysis, given the relatively normal distribution of the main dependent variable, the change in the Republican vote share, and the relatively consistent linear relationships between this variable and our continuous explanatory and control variables. Diagnostics performed after running the models revealed no overt issues with omitted variables or outliers and a relatively strong model fit.
Results appear in 12 models. The first eight models show whether declines in turnout among more liberal leaning voters, particularly African-Americans and Latinxs, in the wake of foreclosures were associated with a conservative electoral shift. First, we assess (1) whether foreclosures were associated with declines in voter turnout and (2) whether these declines were correlated with declines in the African-American or Latinx population (Hypothesis 1). Then we examine whether declines in voter turnout and African-Americans or Latinxs were associated with an increase in the Republican vote share (Hypothesis 2). The next two models show whether foreclosures were associated with declines in electoral support for incumbents, which is signaled by a decrease in the Republican vote share (Hypothesis 3). The final two models consider the relative importance of the two theories by examining their independent contribution to the change in the Republican vote share, controlling for variables associated with the other theory.
It is important to note that we only indirectly investigate Hypotheses 1 and 2, as the change in neighborhood voter turnout and change in percent African-American or Latinx variables do not directly measure changes in neighborhood African-American or Latinx voter registration or turnout. However, indirectly examining whether a decline in turnout among more liberal-leaning voters, like African-Americans and Latinxs, is associated with a conservative shift using these variables is appropriate given that (1) our study is one of the first to explore this theory, (2) these variables should be associated if this theory holds truth, and (3) data on voter registration and turnout by race and ethnicity for Maricopa County are not publicly accessible. Investigating Hypotheses 1 and 2 through measures that more directly capture changes in voter registration and turnout by race and ethnicity, such as probabilistically linking surnames appearing on registered voter lists to race and ethnicity categories, or a survey of registered voters, is an important direction for further research.
Three additional notes are in order. First, our final models include a control variable for place type: location in the central city (City of Phoenix), a newer suburb (majority of housing built 1970 or later), or an older suburb (the residual) to account for geographic variation in voting outcomes and foreclosures. We discovered the importance of this variable in examining the fit of our initial models; place type was an originally omitted variable that subsequently helped to improve model fit. We also discovered a nonlinear relationship between a neighborhood’s percent of non-Latinx Whites and voting outcomes, which we accounted for by transforming that variable into a quadratic. Finally, we initially considered controlling for the effect of governmental efforts to counteract the contagion effect of foreclosures in the hardest hit neighborhoods. However, in light of evidence from a program evaluation of the most ambitious effort, the federal government’s Neighborhood Stabilization Program II (NSP II), which sought to improve upon its predecessor NSP I, we decided not to. The analysis of 6,300 properties in 19 counties yielded no consistent evidence of positive effects of NSP II expenditures on home values or sale prices (Spader et al. 2015).
The Relationship Between the Foreclosure Crisis and Neighborhood Partisan Shifts in Maricopa County
This section explores the association between foreclosures and neighborhood partisan shifts in Maricopa County’s Arizona gubernatorial and U.S. Senate elections. We first describe our dependent and explanatory variables and examine their correlations. We then consider support for our hypotheses on the association between neighborhood foreclosures and partisan shifts through econometric modeling.
Descriptive Relationships
The Republican vote share in Maricopa County far exceeded the Democratic vote share in all of the races except for the 2006 Arizona gubernatorial race. Incumbent Republican Senator John Kyl defeated Democrat challenger Jim Pederson 57% to 43% in 2006. Incumbent Republican Senator John McCain defeated Democrat challenger Rodney Glassman by a whopping 65% to 35% in 2010. Recently appointed Republican Governor Jan Brewer defeated Democratic challenger Terry Goddard 57% to 43% in 2010. However, Republican Len Musil lost to Democrat Janet Napolitano 38% to 62% in 2006.
Table 1 shows average neighborhood Republican vote shares for the Arizona gubernatorial and U.S. Senate races in 2006 and 2010. The typical neighborhood leaned strongly conservative for the 2010 U.S. Senate race, somewhat conservative for the 2006 U.S. Senate and 2010 Arizona gubernatorial races, and strongly liberal for the 2006 Arizona gubernatorial race, which follows the countywide results. The typical neighborhood experienced a large increase in the Republican vote share for the Arizona gubernatorial race from 2006 to 2010 (16 percentage points) and a moderate increase for the U.S. Senate race from 2006 to 2010 (seven percentage points).
Descriptive Statistics (n = 902).

Voter turnout declined in Maricopa County from 2006 to 2010. On average, 57% and 56% of neighborhood voters participated in the 2006 Arizona gubernatorial and U.S. Senate elections respectively; only about 50% of voters participated in the 2010 Arizona gubernatorial and U.S. Senate elections, which amounts to about a six-percentage point decline in voter turnout during this period (see Table 1).
Maricopa County foreclosure rates per 1,000 homes from January 2009 to October 2010 exhibited two distinct geographic patterns. First, foreclosures were widespread; most communities in the county were affected at least to some extent. The typical neighborhood had 67 homes per 1,000 undergo foreclosure during this period. Second, foreclosures were more heavily concentrated in particular communities. Higher foreclosure rates were found in west Phoenix, which is lower-income and more heavily Latinx, and north Phoenix, which is higher income and more heavily White.
Maricopa County, like many urbanized counties in the United States, is slowly becoming majority minority. The typical neighborhood had a combined African-American and Latinx population of 31% in 2006 and 34% in 2010. The typical neighborhood experienced a two-percentage point increase in the African-American and Latinx population between 2006 and 2010.
We next examined the bivariate correlations among our outcome variables, the change in the Republican vote share for the Arizona gubernatorial and U.S. Senate elections, and explanatory variables—neighborhood foreclosure rate, change in voter turnout, and change in the percent African-American or Latinx (see Table 2). These preliminary findings support our hypothesis that foreclosures are associated with anti-incumbent behavior, or a liberal electoral shift (Hypothesis 3). The neighborhood foreclosure rate was moderately negatively correlated with the change in the Republican vote share in the Arizona gubernatorial and U.S. Senate elections (−0.35 and −0.37 respectively), meaning that neighborhoods with higher foreclosure rates tended to have more liberal shifts over time.
Bivariate Correlations (n = 902).

Source. Maricopa County Recorder (2006, 2010); Information Market (2014); U.S. Census Bureau (2000, 2010b, 2012).
p < .10. *p < .05. **p < .01.
The findings offer partial support for our hypotheses that declines in turnout among more liberal-leaning voters, such as African-Americans or Latinxs, are associated with conservative electoral shifts (Hypothesis 1 and 2). The change in voter turnout and the African-American and Latinx population had weaker, though still statistically significant, negative correlations with the change in the Republican vote share in the Arizona gubernatorial and U.S. Senate elections (from −.20 to −.22 and −.14 to −.16 respectively). Alternatively stated, neighborhoods with greater decreases in voter turnout or African-Americans or Latinxs had more conservative shifts over time. These findings align with Hypothesis 2. However, the neighborhood foreclosure rate was not statistically associated with the change in voter turnout or percent African-American or Latinx, which does not align with Hypothesis 1.
Modeling Results
Table 3 explores the associations among the neighborhood foreclosure rate, the change in voter turnout, the percent African-American or Latinx, and the Republican vote share, controlling for related neighborhood characteristics. Estimates of the effects of the controls are omitted for the sake of brevity but available upon request.
Hypothesis Testing (n = 902).

Source. Maricopa County Recorder (2006, 2010); Information Market (2014); U.S. Census Bureau (2000, 2010b, 2012).
Note. Neighborhood characteristics controlled include percent of seniors, non-Latinx Whites (squared), adults aged 25 and older with at least a bachelor’s degree, homeowners, vacant homes, and families in poverty and place type (central city, older suburb, or newer suburb).
p < .10. *p < .05. **p < .01.
Our results strongly support Hypothesis 3, which predicts that neighborhood foreclosures may be associated with partisan shifts by sowing voters’ discontent with political incumbents who support the status quo and fueling support for political challengers who vow to change the status quo. Republicans were incumbents in both the 2010 Arizona gubernatorial and U.S. Senate elections. Thus a negative association between the neighborhood foreclosure rate and the change in the Republican vote share would signal a liberal shift in these places and support the hypothesis that foreclosures are correlated with anti-incumbent sentiment. We see evidence of this pattern in our results (see the “Anti-Incumbency [Hypothesis 3]” models). The neighborhood foreclosure rate was negatively associated with the change in the Republican vote share in both races. An increase of one standard deviation in the neighborhood foreclosure rate (+52 foreclosures per 1,000 homes) was associated with about a one-percentage point decline in the Republican vote share from 2006 to 2010. This association held even after controlling for the other explanatory variables (see the “Combined” model).
We find mixed support for Hypotheses 1 and 2, which predict that neighborhood foreclosures may be associated with conservative shifts by depressing turnout among more liberal-leaning voters such as African-Americans or Latinxs. Neighborhoods that had higher foreclosure rates had slightly lower voter turnouts, after controlling for their African-American or Latinx population change, which aligns with Hypothesis 1 (see “Decline in Liberal Voters [Hypothesis 1]” models). An increase of one standard deviation in the neighborhood foreclosure rate was associated with a close to one-percentage percent decline in voter turnout from 2006 to 2010, though this effect was stronger for the Arizona gubernatorial race than the U.S. Senate race. However, neighborhoods that experienced greater declines in their percent African-American or Latinx had higher voter turnout, which does not align with Hypothesis 1. Stated differently, neighborhoods that experienced greater increases in their percent African-American or Latinx had lower voter turnout. An increase of one standard deviation in the change in the percent African-American or Latinx (+3 percentage points) was associated with about a one-percentage point decline in voter turnout from 2006 to 2010.
Furthermore, our results do not support Hypothesis 2, that declines in turnout among liberal-leaning voters, such as African-Americans and Latinxs, are associated with a conservative electoral shift (see “Decline in Liberal Voters [Hypothesis 2]” models). Neighborhoods that had greater declines in voter turnout had more of a liberal electoral shift in the U.S. Senate race. Neighborhoods that had greater declines in their percent African-American or Latinx had more of a liberal electoral shift in both races, though this correlation was stronger in the Arizona gubernatorial race. Stated differently, neighborhoods that experienced greater increases in their percent African-American or Latinx had more of a conservative electoral shift in the Arizona gubernatorial race. A one standard deviation increase in the percent African-American or Latinx was associated with a one-percentage point increase in the Republican vote share from 2006 to 2010. This effect held after all explanatory variables were controlled (see “Combined” model).
Overall, the results suggest that two partisan shifts might have occurred during the foreclosure crisis in Maricopa County: (1) an anti-incumbent shift in neighborhoods hard hit by foreclosure and (2) a conservative shift in neighborhoods with growing African-American and Latinx populations.
Conclusion: Partisan Shifts, Electoral Results, and a Housing Distress Political Feedback Loop?
Our research provides evidence of a link between neighborhood housing distress and neighborhood partisan shifts. Neighborhoods harder hit by foreclosures between the 2006 and 2010 Arizona gubernatorial and U.S. Senate elections in Maricopa County, Arizona, were more likely to exhibit anti-incumbent behavior and a liberal shift in voting, after controlling for a range of associated factors. This finding adds nuance to existing debates within (1) political science on the drivers of anti-incumbency and (2) urban studies on the outcomes of the recent foreclosure crisis and homeowners’ civic engagement. We show that voters’ experiences in highly leveraged owner-occupied neighborhoods during recessions may be correlated with partisan shifts at the polls, which helps to build understanding of the complex social and environmental factors that contribute to anti-incumbency in state and national elections.
The lack of evidence for changes in the overall electoral outcomes in Maricopa County does not diminish the significance of the voting shifts we were able to document. 2 When combined with recent work from political scientists and housing scholars (Healy and Lenz 2017; Raymond 2017; Zonta, Edelman, and McArthur 2016), our findings suggest that housing and housing-related economic issues may be overlooked factors in explaining voting behavior. Neighborhood conditions, like concentrated foreclosures, may relate to state and national election voting patterns.
Far more research is needed on the link between housing and urban development and electoral politics. If housing distress affects voting and, in some cases, elections, do voting changes ultimately influence state and local housing and development policy? Does a housing distress political feedback loop dynamically link a neighborhood’s current housing distress to its future housing distress through state and national partisan shifts? (see Figure 1). Evidence addressing this question is even thinner than evidence addressing the question of whether foreclosures affect voting behavior. More research is needed to determine whether and how partisan shifts ultimately impact state and national housing policy and local planning, which may prolong or shorten the effects of neighborhood housing crises or shape neighborhoods’ vulnerability to future housing crises.
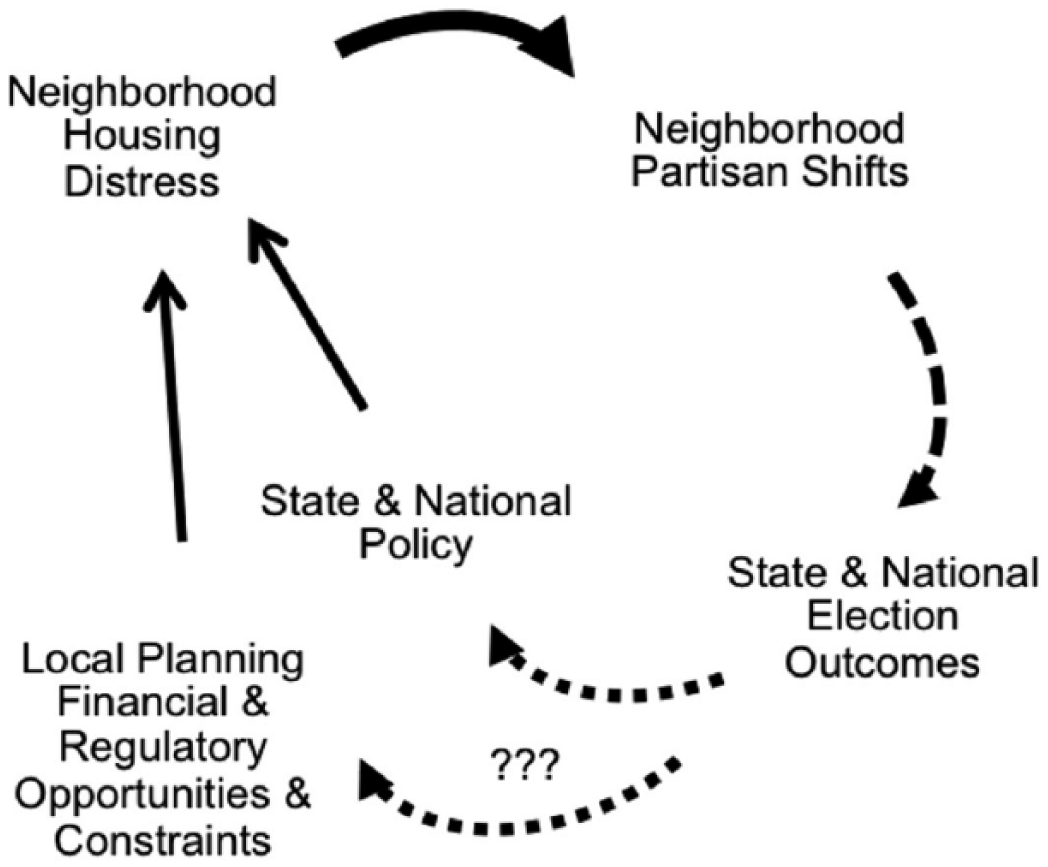
A housing distress political feedback loop?
The line of inquiry that we have pursued in this article is in its infancy. Yet, one implication of cases where anti-incumbent voting behavior fails to sway state and national elections, as occurred in Maricopa County, or fails to occur, as observed by Hall, Yoder, and Karandikar (2017), is a systematic lack of attention paid by incumbents to the concerns of voters living in neighborhoods hard hit by foreclosure, given their apparent lack of incentive to do so in order to get reelected. Effective solutions to the challenges faced by neighborhoods hard hit by foreclosure have largely failed to bubble up via the electoral process (Martin and Niedt 2015). Advocates for people confronting quality-of-life degradation in such areas may have to focus their attention elsewhere—on nonpartisan local politics or civil society rather than on partisan-driven state or national politics.
Our research also shows evidence of a partisan shift other than anti-incumbency that might have occurred in Maricopa County during the foreclosure crisis: a conservative shift in neighborhoods experiencing African-American or Latinx population growth. This conservative shift may have had a larger effect on election outcomes than housing distress–related anti-incumbency, given the large countywide margin of victory experienced by the 2010 Republican Arizona gubernatorial and U.S. Senate candidates (close to 13 and 31 points over their Democratic challengers respectively). The political science literature provides some evidence that growing racial and ethnic diversity may lead to electoral moves to the right. Hopkins (2012) found that the migration of people of color to Baton Rouge and Houston following Hurricane Katrina was linked to a rightward shift in attitudes among White residents of the receiving communities. Other research in political science also shows a relationship among race, demographic change, and a shift to more conservative attitudes (Craig and Richeson 2014; Hopkins 2010; Newman, Shah, and Collingwood 2018; Zingher 2018). 3
Growing racial and ethnic diversity in the Maricopa County neighborhoods trending to the right during the late 2000s may or may not be related to foreclosures. Possible explanations include (1) African-American and Latinx homeowners fleeing impacted neighborhoods, (2) new African-American and Latinx renters seeking out single-family rental conversions, or (3) African-Americans and Latinxs’ higher birth rates or migration to the Phoenix region (Pfeiffer and Lucio 2015; Rex 2011). Exploring potential multiplier effects of housing distress on neighborhood voting behavior, including a shift to the right in neighborhoods experiencing growing racial and ethnic diversity during a foreclosure crisis, is an important task for future scholarship in this area.
Research in the United States has all too often maintained separate scholarly realms between those who study electoral politics and voting behavior and those who study housing. This article pushes forward research into this poorly understood link. In a country where both partisanship and housing crises seem to be deepening, further conversation between the political science and urban studies fields is paramount.
Footnotes
Acknowledgements
We wish to thank Ryan Frazier of the School of Geographical Sciences and Urban Planning at Arizona State University for teaching us how to remedy issues with boundary changes using geographic information systems. We also are grateful to Michael Orr, formerly of Arizona State University’s Center for Real Estate Theory and Practice, for helping us to access and understand data on Maricopa County foreclosures. Thanks to Dan Hopkins, Matt Barreto, Raphael Sonenshein, Thad Kousser, and especially Tyler Reny for helping us parse the political science literature on racial and ethnic change and partisan shifts. Finally, we want to acknowledge the helpful feedback given by audience members at the Emerging Housing Market Trends and Interactions session at the 2017 Association of Collegiate Schools of Planning conference and two anonymous reviewers.
Declaration of Conflicting Interests
The author(s) declared no potential conflicts of interest with respect to the research, authorship, and/or publication of this article.
Funding
The author(s) received no financial support for the research, authorship, and/or publication of this article.