
Abstract
The decades-long resistance to federally imposed school desegregation entered a new phase at the turn of the new century. At that time, federal courts stopped pushing racial balance as a remedy for past segregation and adopted in its place a color-blind approach to evaluating school district assignment plans. Using data that span 1998 to 2016 from North Carolina, one of the first states to come under this color-blind dictum, we examine the ways in which households and policymakers took actions that had the effect of reducing the amount of interracial contact in K-12 schools within counties. We divide these reductions in interracial contact into portions due to the private school and charter school sectors, the existence of multiple school districts, and racial disparities between schools within districts and sectors. For most counties, the last of these proves to be the biggest, though in some counties private schools, charter schools, or multiple districts played a deciding role. In addition, we decompose segregation in the state's 11 metropolitan areas, finding that more than half can be attributed to racial disparities inside school districts. We also measure segregation by economic status, finding that it, like racial segregation, increased in the largest urban counties, but elsewhere changed little over the period.
Introduction
For several decades after the Supreme Court's decision in the 1954 Brown case, federal courts closely monitored local districts, especially those in the South, to force them to racially balance their schools. The courts eventually stopped doing so in the late 1990s, first, by declaring most Southern districts previously under court order to be “unitary” and therefore no longer in need of close oversight. Then, the federal courts, led by the Fourth Circuit Court of Appeals (the circuit covering North Carolina) and eventually the Supreme Court, enunciated what amounted to a color-blind attitude to school desegregation. This attitude found ultimate expression in the 2007 decision in Parents Involved, which disallowed voluntary desegregation plans built around assigning individual students according to their race. 1 As a result of these rulings, school districts previously under orders to eliminate vestiges of the old, segregated order were now free to stand by even as existing patterns of residential segregation, the expansion of charter schools, and the use of private schools might lead to the resegregation of their schools.
Although residential segregation—one of the most important correlates of school segregation—has been declining broadly in urban areas (Cutler, Glaeser, and Vigdor 1999; Frankenberg 2013), there has been no concomitant decline in school segregation. Indeed, most recent research on national trends in school segregation suggests that it has remained steady or increased, depending on how segregation is measured. 2
For many reasons, only two of which we highlight here, school segregation is cause for serious concern. The first reason relates to one of the fundamental public purposes of education, mainly to prepare students to function as adults in a pluralistic democratic society (Blum and Burkholder 2021). To the extent that students are educated in schools with students similar to themselves, they lose the opportunity to broaden their understanding of and ability to interact in constructive and kind ways with other groups within the same community. A second reason relates to fairness. When schools are racially or racially and economically segregated, some schools—in most cases those serving greater shares of White students who have historically been more socioeconomically advantaged than most non-White students—are likely to attract more resources and to provide higher-quality education than other schools. The additional resources may come in the form of more experienced teachers, higher-quality school principals, lower turnover of teachers, or a more involved parent community (see, e.g., Clotfelter, Ladd, and Clifton 2021a; Clotfelter et al. 2021b; Goldhaber, Quince, and Theobald 2017). In addition, to the extent that non-White students come from more economically disadvantaged families than White students, even equal school resources across schools will not translate into equal educational opportunity for students in schools with disproportionately high proportions of non-White students. Such schools may need more resources than other schools to address the needs that some students bring to the schoolhouse door. In sum, racial segregation enables differential quality of schooling for students of different races within the same community. For these and other reasons, research on the extent of, and contributors to, the segregation of schools is both timely and policy relevant.
We have two major aims in this paper. The first is to document changes in school segregation during the period 1998–2016 in a single Southern state, North Carolina. This period covers the initial years of the shift to color-blind jurisprudence as well as the growth of charter schools and school voucher programs. North Carolina is of interest because it is a large and diverse state and one of its largest districts was among the first to be relieved of court pressure to integrate its schools. In addition, it has witnessed a significant influx of immigrants, earning it attention as a “New Destination” state. Between 1990 and 2010, while the foreign-born population in the U.S. doubled, it increased sixfold in North Carolina (Portes and Rumbaut 2014, Table 9). Using enrolment data for public and private schools, we measure changes in school segregation following the shift in judicial attitude. We also compare levels of segregation across counties with markedly different demographic makeups and recent histories. By focusing on one large state with multiple and varied urban and regional areas, we are able to examine the patterns of school segregation in some detail, citing specific examples to illustrate broader patterns. As a part of our analysis, we examine the experience of rural as well as urban communities. While most studies of school segregation focus on districts in metropolitan areas, to our knowledge only Logan and Burdick-Will (2017) have looked specifically at school segregation in rural communities. 3
Our second aim is to quantify the relative contributions to segregation of various mechanisms such as charter schools, private schools, and multiple districts, all of which could well contribute to segregation, but are likely to do so to different degrees in different communities across the state. We are able to describe the separate contributions of these various mechanisms using a straightforward algebraic decomposition of one of the standard measures of racial imbalance—the Coleman index—within each relevant school community. For North Carolina, the relevant community is the county because most counties are coterminous with school districts. Owing to the large size of many of the state's 100 counties, North Carolina is less subject to the school segregation within metropolitan areas that emerges as a result of the multiplicity of small school districts in many other parts of the country, but is not completely immune. In addition, the state has experienced a rapidly growing charter school sector, especially after the initial cap of 100 charter schools was removed in 2011. Recent research suggests that charter schools may be aggravating racial segregation (Frankenberg, Siegel-Hawley, and Wang 2011; Ladd, Clotfelter, and Holbein 2017; Logan and Burdick-Will 2016; Mickelson et al. 2018; Monarrez, Kisida and Chingos 2019b) as well as segregation by economic background (Marcotte and Dalane 2019). As one component of our decomposition, we also measure, albeit imperfectly, the role of private school enrolment, a role that has not been explored in studies that rely entirely on data for public schools. 4 Given the fact that many private schools served as a way for White students to avoid racial integration in earlier periods of court enforced segregation, it seems useful to understand their contribution to racial segregation in the period of color-blind jurisprudence and, in recent years, after the introduction of NC Opportunity Scholarship for low-income students in 2013 (Egalite, Stallings, and Porter 2020).
The next two sections of the paper set the stage by briefly explaining the relevant policy levers that may affect segregation and by summarizing the state's enrolment patterns. The Measuring Segregation section describes our basic measure of interracial contact and segregation and presents some descriptive statistics for the state. In the Instruments for Undoing Desegregation section, we decompose this basic measure to highlight the role played by charter schools, private schools, and racial disparities between and within established school districts. In the Segregation in Metropolitan Areas section, we apply this decomposition to metropolitan areas in the state. In the Other Racial/Ethnic Groupings section, we compare separate indices measuring segregation between Black and Hispanic students and between White, Black, and Hispanic students and each group's corresponding set of all other students. The Conclusions and Policy Implications section of the paper summarizes the findings and discusses some of the policy implications.
Policy Instruments
Public policies have the potential to influence the racial segregation of schools directly or indirectly in at least four ways: through their effects on student assignments to public schools, consolidation (or deconsolidation) of public school districts, charter schools, and private schools. North Carolina offers examples of all four instruments.
Student Assignments to Schools
One of the basic responsibilities of local school boards is to establish rules by which students may choose or be assigned to schools. Indeed, it was the racially discriminatory exercise of this responsibility that caused federal courts to oversee local school boards after the Brown decision in 1954. Although federal courts ordered and enforced student assignment plans that achieved astonishing degrees of interracial contact in public schools during the 1970s and 1980s, the federal courts began to back-pedal from active intervention in the student assignment decisions of school boards starting in the late 1990s. Beginning in the new millennium, federal courts in the Fourth Circuit handed down several decisions that prohibited any student assignment based on race, even if a part of a plan designed to foster racially balanced schools. One of the key decisions struck down the proactive racial balancing policies of busing and magnet schools practiced by Charlotte-Mecklenburg, one of the two largest school districts in North Carolina.
That decision along with others freed up local school boards once again to make their own decisions about school assignment policies, as long as they did not consider students’ race in making assignments. Such policies differed significantly across districts, the effects of which we document below. Most striking was the decision by Charlotte-Mecklenburg to return to a student assignment plan that embraced neighborhood schools, in a context in which the neighborhoods themselves were highly segregated. 5 In contrast, Wake County, which is now the largest county in the state, and home to the state's capital of Raleigh, sought to avoid the return to racially segregated schools. Its school board skirted the new legal environment that prohibited school boards from using race in student assignments by assigning students so as to balance schools according to economic disadvantage and student achievement (Grant 2009; Kahlenberg 2012). However, rapid population growth and the need for frequent revisions of school assignments led voters to elect a new school board that scaled back the policy in 2010 (Carlson et al. 2019).
In addition to residential segregation and local population growth, a number of other factors are likely to account for the degree of racial segregation across traditional public schools (TPS) that we document below. These include local decisions to allow various degrees of public school choice in the form of transfer policies, magnet schools or year-round schools, and the influence of other forms of parental choice such as charter schools and private schools on the mix of students within the TPS. In their decisions both about the design of school attendance zones and about how much flexibility to offer parents to select out of their assigned zones, school boards must weigh their instincts to foster racial integration, whatever those might be, against the fear that efforts to promote racially integrated TPS may induce some parents to opt out of TPS in favor of more segregated schools. Indeed, parents’ preferences for a variety of non-academic factors may readily lead to the segregation of students by race (and family income) in public schools (e.g., Bifulco, Ladd, and Ross 2009; Macartney and Singleton 2018).
In general, we would expect rural districts to be more constrained than dense urban areas by the need to have school assignment policies that minimize the costs of transporting students across long distances. In those areas, concentrations of employment opportunities, including those for newly arriving Hispanic immigrants, are likely to be significant contributors to the racial and ethnic segregation of their schools.
District Consolidation (or Deconsolidation)
The empirical studies of American school segregation clearly document that racial disparities between neighboring school districts can be a major source of school segregation. However, like other states in the South and West, North Carolina presents a counterexample to the jurisdictional balkanization that characterizes the urban areas of the North and Midwest, largely because of North Carolina's longstanding policy to consolidate school districts. From 167 separate school districts in the 1960s, the state—sometimes via direct intervention by the legislature itself—had by 1998 managed to trim the number of districts to 117. By 2016 the number had fallen to 115, most of which are county-wide. For a state with a population of 10 million, this is a remarkably small number. Compare, for example, New Jersey, with a smaller population, which had 602 districts in 2014 (Michael Maciag, 2016). Owing to this preponderance of county-wide districts, North Carolina has far less of the sharp racial disparities prevalent in balkanized urban areas in other states. 6
There has recently been a push, however, to reverse this pro-consolidation policy in several Southern states, including North Carolina, a trend that political scientists Johnson and King (2018) attribute to “efforts to resegregate public education” by newly emerged Republican majorities in state legislatures. 7 In North Carolina, community leaders in large districts, notably Charlotte-Mecklenburg and Wake County, have called on the state legislature to allow such large county districts to be divided once again. 8 Although the legislative study committee established by the legislature to examine the question of deconsolidation issued no recommendation, its report did nothing to quell the push for deconsolidation. 9
Charter Schools
A third set of policies with likely effects on segregation are those related to charter schools. In North Carolina, the State Board of Education is the sole authorizer of charter schools with local districts having no say in the approval, location, or operation of charter schools. First authorized by the state legislature in 1996, these schools increased in number, soon reaching the initial legislated maximum of 100. That cap was lifted in 2011, and the number quickly rose, topping 170 by 2018. 10
Skeptics of charter schools have long feared that, as schools of choice, charter schools would become a vehicle for segregation. That fear spurred much of the opposition to charter schools when the state legislature debated and passed its originating charter school legislation, although many legislators believed charter schools would be less detrimental to the traditional education system than the alternative of vouchers. To guard against their potential segregating effects, North Carolina put into its original enabling legislation in 1996 not only a prohibition against demonstrably discriminatory practices but also an admonition that charter schools “shall reasonably reflect” the racial and ethnic composition of their surrounding areas. The state legislature watered down this language in 2013, however, requiring only that charter schools “shall make efforts for the population of the school to reasonably reflect” the surrounding area (Ladd, Clotfelter, and Holbein 2017, p. 538). 11 This watering down accompanied the state's removal of the cap on the total number of charter schools allowed to operate. Coincident with these changes and the growth of charter schools was an increase in the number of charter schools with 80% or more White or non-White enrolments (Ladd, Clotfelter, and Holbein 2017, p. 543). Although some researchers in other states have argued that charter schools might decrease segregation by providing opportunities for disadvantaged students to move from their heavily segregated neighborhood schools to less segregated charter schools (Cohodes and Parham 2021), two empirical studies of charter schools in North Carolina have documented that they increase segregation in this state, largely because of the segregating enhancing decisions of White parents (Bifulco and Ladd 2007; Ladd and Turaeva 2020).
Most recently, worries that charter schools might aggravate segregation were surely aroused by a bill debated and passed by the state legislature in 2018 that gave permission to four predominantly White towns within Mecklenburg County to open charter schools catering to their own residents. 12
Private Schools
A fourth state policy with the potential to influence school segregation is government support for private schools. As of 2015, 19 states, including North Carolina, had set up programs to give tax breaks or vouchers to students attending private schools using public funds (Southern Education Foundation 2016, p. 2). The North Carolina Opportunity Scholarship Act, enacted in 2013, provides state-funded tuition scholarships up to $4,200 for first-time private school students from moderate and low-income families. 13 (In 2017, the maximum family income to be eligible was $45,510.) 14 There have also been proposals at the federal level to subsidize private school attendance (Southern Education Foundation 2016, p. 2). Considering the prominent role private schools have historically played in efforts of White families to avoid desegregated schools (Clotfelter 1976, 2004), one might reasonably be concerned that such subsidies for private schooling could aggravate racial segregation. Thus, we are interested in tracking recent enrolment trends in North Carolina private schools, whether or not that enrolment is currently funded by vouchers.
Demographic Context
We use publicly available data for all K-12 students. Enrolment in public schools comes from the Common Core of Data (CCD). For private schools, we use the Private School Universe and the state of North Carolina's own survey of private schools. 15 Our data span the years 1997/1998 and 2015/2016 (hereafter simply 1998 and 2016).
North Carolina's K-12 enrolment is large, rapidly growing, and diverse. As shown in the first three columns of Table 1, enrolment in public and private schools increased over this period from 1.3 million in 1998 to 1.6 million in 2016, a rate of little more than 1% a year. The number of Hispanic students increased at a much faster rate, however, with their share rising over the period from 3% to 16%. Among its 100 counties are highly urbanized counties as well as rural counties containing only a few traffic lights. Unlike rural counties in most of the country, which are predominantly White (Burdick-Will and Logan 2017, p. 215), rural counties in North Carolina represent a wide range of racial compositions, with Black students disproportionally represented in the northeastern part of the state and underrepresented in the mountains to the west. The state's two most populous counties, Mecklenburg and Wake (home to Charlotte and Raleigh, respectively) accounted for more than a fifth of all students in 2016, and the five largest counties accounted for more than a third. We divided the state's remaining counties between urban and rural, based on each county's share of residents living in urban areas in 2000. 16 We report statistics for all of these remaining counties, and then again counting only those with at least 4% non-White enrolment in 1998. 17 As a group, rural counties showed the slowest growth in enrolments over this period.
Distribution of North Carolina K-12 Students by School Type and County or County Group, 1998, 2006, and 2016.
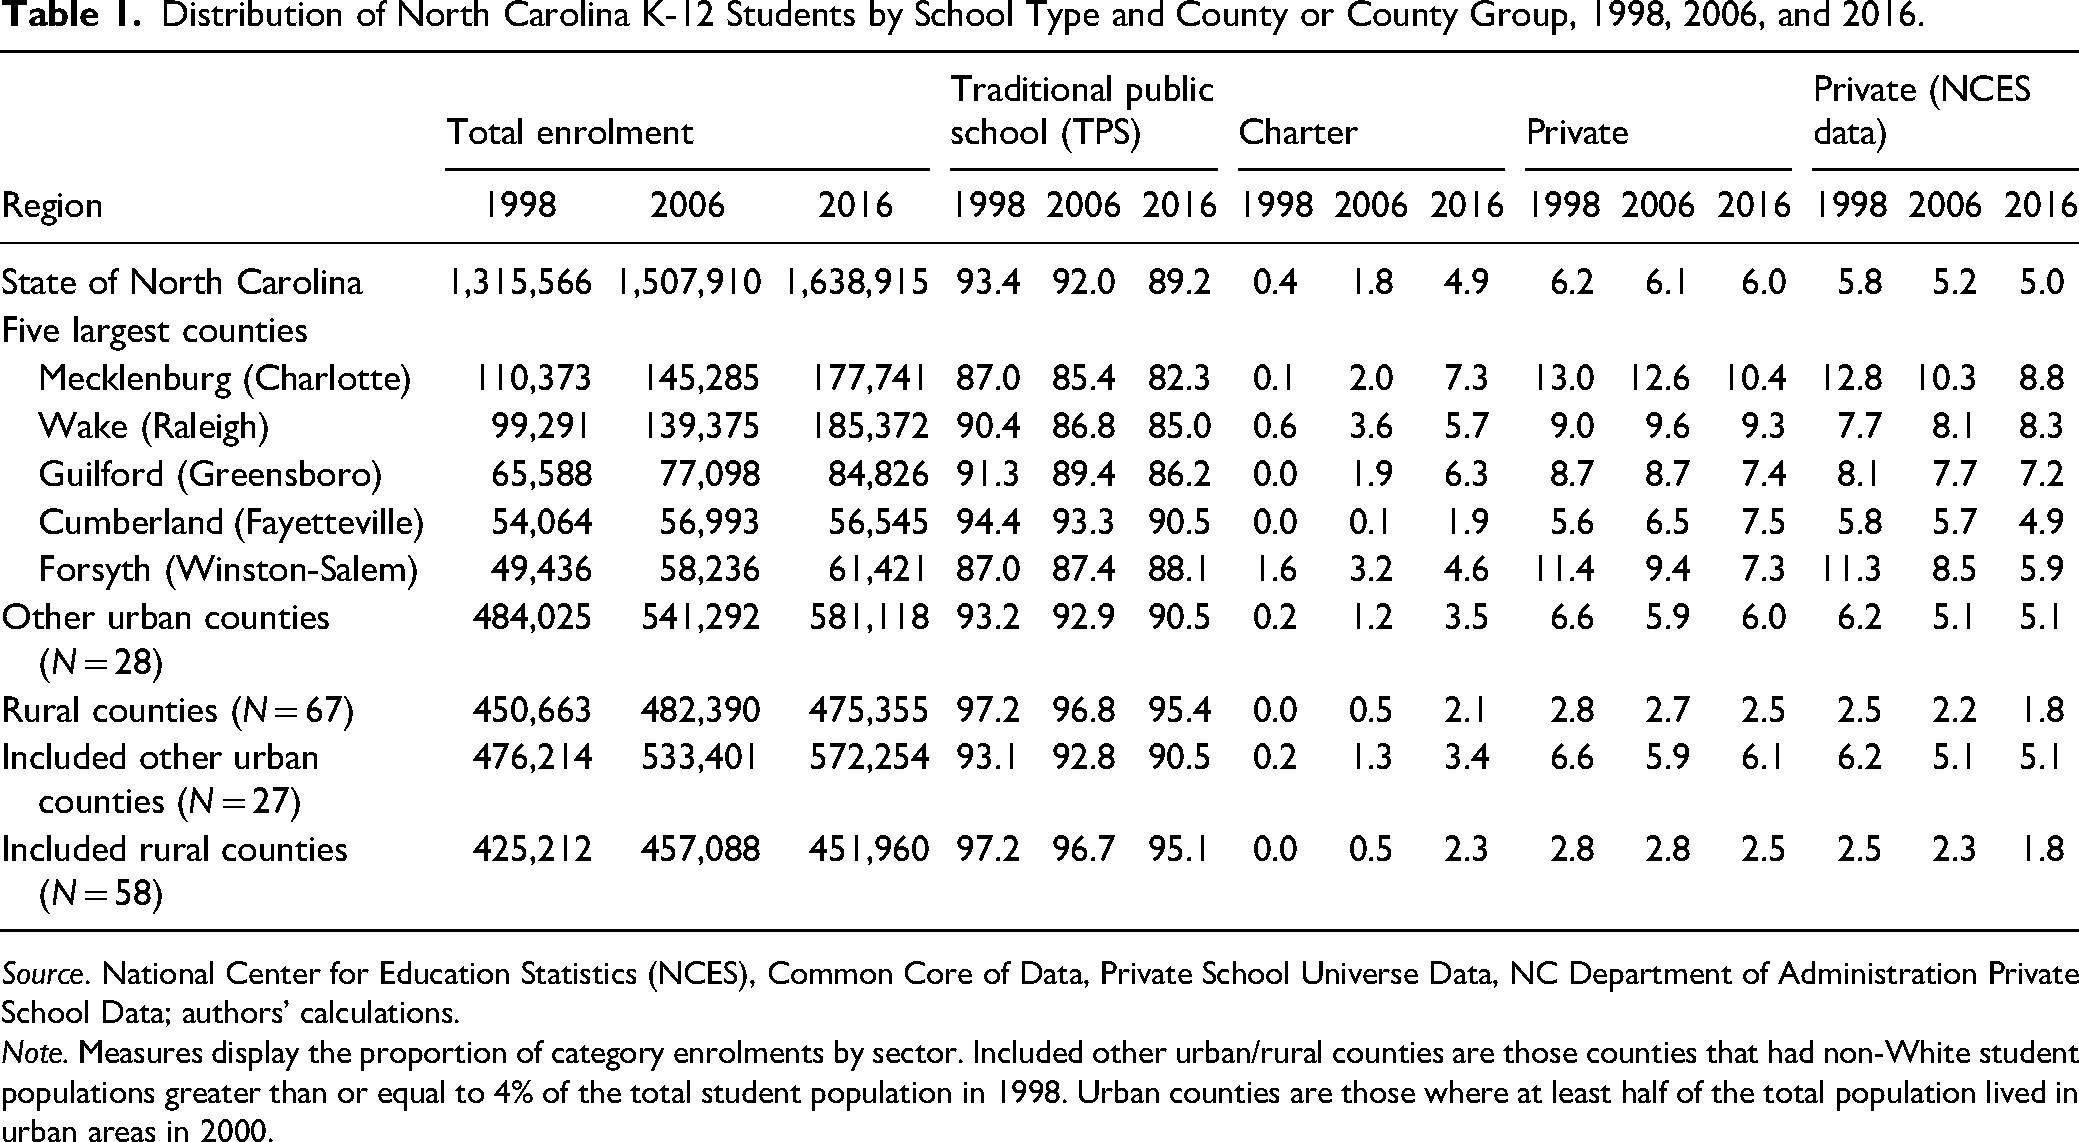
Source. National Center for Education Statistics (NCES), Common Core of Data, Private School Universe Data, NC Department of Administration Private School Data; authors’ calculations.
Note. Measures display the proportion of category enrolments by sector. Included other urban/rural counties are those counties that had non-White student populations greater than or equal to 4% of the total student population in 1998. Urban counties are those where at least half of the total population lived in urban areas in 2000.
The remainder of the table documents enrolment changes in charter schools and private schools. Enrolment in charter schools increased markedly, their share increasing across the board and rising as a share of all students in the state from 0.4% to 4.9%. Meanwhile, the share of students enrolled in a private school barely changed, falling from 6.2% to 6.0% over the period. In calculating these percentages, we use data on private school enrolment published by the state rather than the NCES Private School Universe because the latter has a history of missing schools, resulting in undercounts. For the three years we investigate, the NCES data underestimate the share of students enrolled in private schools by 0.4, 0.9, and 1.0 percentage point(s), respectively. Despite this tendency, the NCES Private School Universe remains the only source of data that includes the racial composition of private schools. 18 Thus, we use the NCES data in the present paper, reasoning that using imperfect data on private schools in a study of racial segregation is far better than ignoring private schools altogether.
Three demographic facts are important for understanding the patterns and trends in the schools of North Carolina: substantial racial and ethnic diversity, rapid growth in the number of Hispanic students, and steady but uneven urbanization. In 2016, slightly more than half of North Carolina's K-12 students were White and not Hispanic (hereafter, simply White). Non-Hispanic Black (hereafter, simply Black) students made up 29% of total enrolment, Hispanic students 16%, and Asian and Native American students together made up about 4.5% of the total. 19 Over the 18-year period between 1998 and 2016, the marked decline in the share of White students was mirrored by an almost identical increase in the share of Hispanic students. While the absolute number of White students declined by 3% over the period, the number of Hispanic students increased sevenfold. Asian students remained a small portion of North Carolina's rural and small urban communities, but their numbers grew rapidly in the state's largest urban areas. There are relatively few Native Americans in the state, but their shares were significant in several of the state's counties. 20
To illustrate how the racial/ethnic diversity arrays itself geographically, the maps in Figure 1 show the concentration of Black and Hispanic students by county in 1998 and 2016. The figure's two maps on the left show for 1998 and 2016 the concentration of Black students, with counties divided into three groups. These two maps show that Black students were concentrated in the middle and eastern sections of the state. In contrast to the stability of these racial patterns, the story was altogether different for Hispanic students. The rapid growth in their numbers was the result of an influx of immigrants into the state, attracted by job openings in industries such as meat processing, construction, landscaping, and personal services. 21 This influx increased Hispanic shares in most counties, and their numbers in every county. This growth was especially concentrated in a handful of destination counties, where the concentration of Hispanic students skyrocketed. 22 The two maps for Hispanic students in Figure 1, using different percentage categories from those used for Black students, show the astonishing demographic transformation of the state's schools between 1998 and 2016. In 1998, the Hispanic share of all K-12 students exceeded 5% in fewer than 10 of the state's 100 counties; by 2016, that was true in more than 90% of the counties.
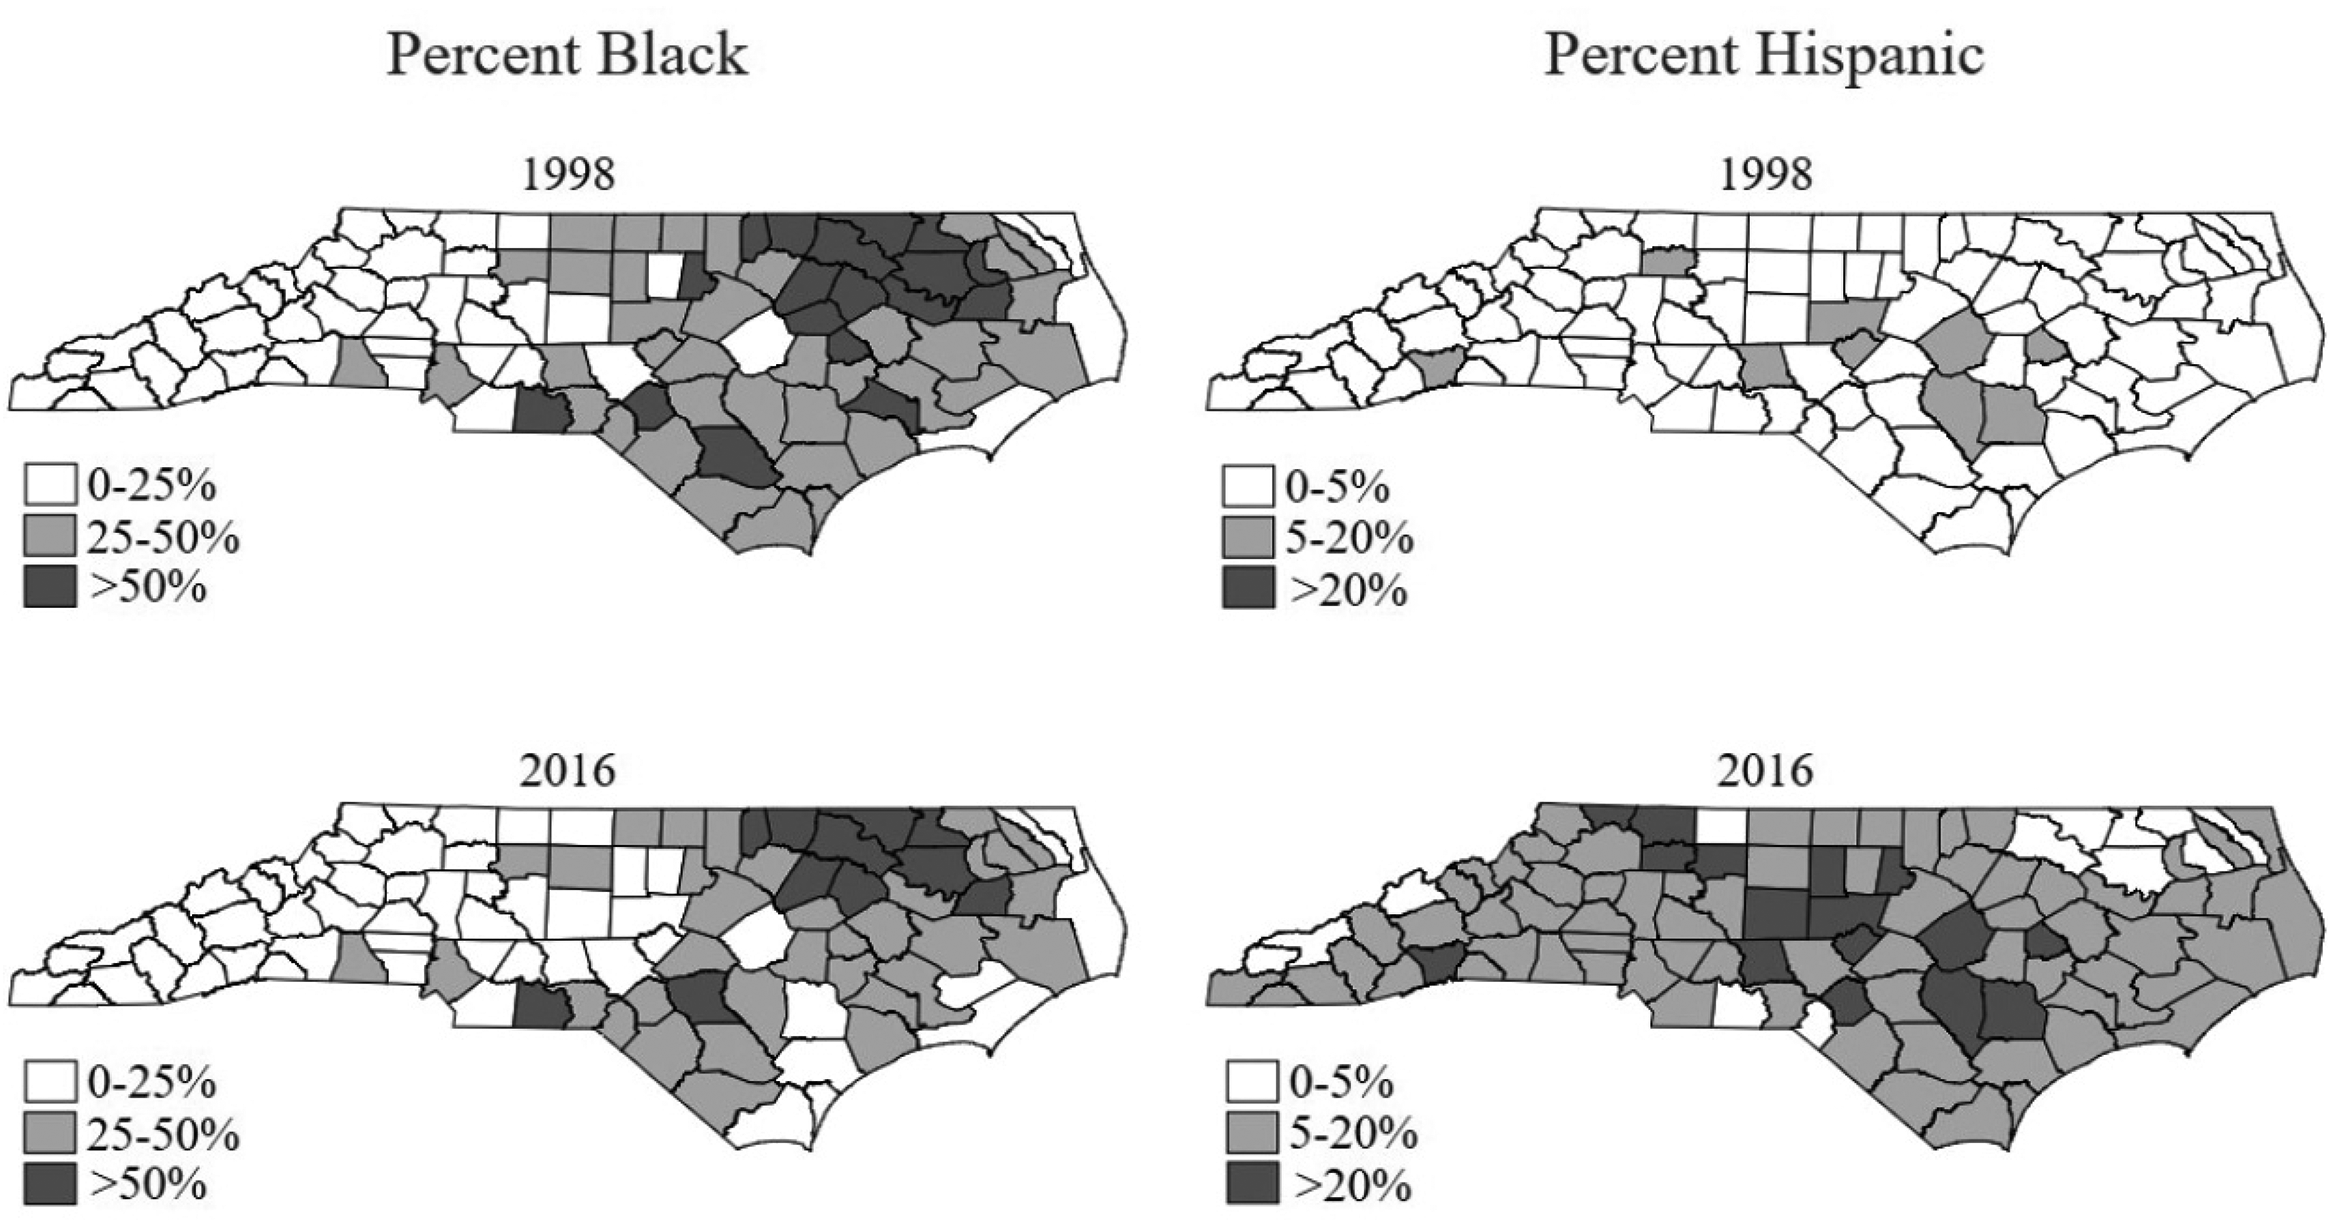
Counties in North Carolina by Percent Black or Hispanic, 2006 & 2016.
Measuring Segregation
Basic to our analysis is the concept of segregation—the uneven distribution of students by racial/ethnic group across schools in an area (in our case, a county). The index most commonly used by social scientists is the dissimilarity index, defined as:
Although we include measures based on this index in this paper, we devote more attention to a lesser known index, which is better suited for documenting how various aspects of the contemporary educational scene create segregation by reducing interracial exposure. This index, devised in the 1950s and later employed by James Coleman (Coleman, Kelley, and Moore 1975), measures the proportional gap between actual and the maximum possible extent of interracial contact between two groups of students, where interracial contact is measured by the average exposure rate of White to non-White students.
24
Where students are classified as White or non-White, this average exposure rate (
The Coleman index of segregation is then the proportional gap between the maximum (
We also calculate a multi-group measure of imbalance, the Theil entropy index (Theil and Finizza 1971). To calculate it, students in each county are classified according to four racial/ethnic groups (g). The index is:


As a measure of segregation, the Coleman index has two attractive features. First, as we explain below, it allows researchers to identify and separately measure the contributions to overall segregation of different segregative instruments, such as private schools. We discuss this decomposition below. The second attractive feature of the Coleman index is that it makes explicit the ironclad dependence of interracial contact on two things: a county's racial mix of students and the segregation of its schools. Given the racial mix of its students, segregating students is the only way a county can reduce the average interracial contact of students across schools. To visualize this dependence, Figure 2 shows bars for every county. The light-colored portion of every bar corresponds to the actual average exposure rate of White to non-White students, and the entire bar corresponds to the non-White share in the county. The difference between these two proportions, shown by the black portion of each bar, shows the extent to which segregation has reduced exposure from its maximum (which would have occurred if schools had been racially balanced). The segregation index is equal to the proportional reduction—the black portion as a share of the entire bar.
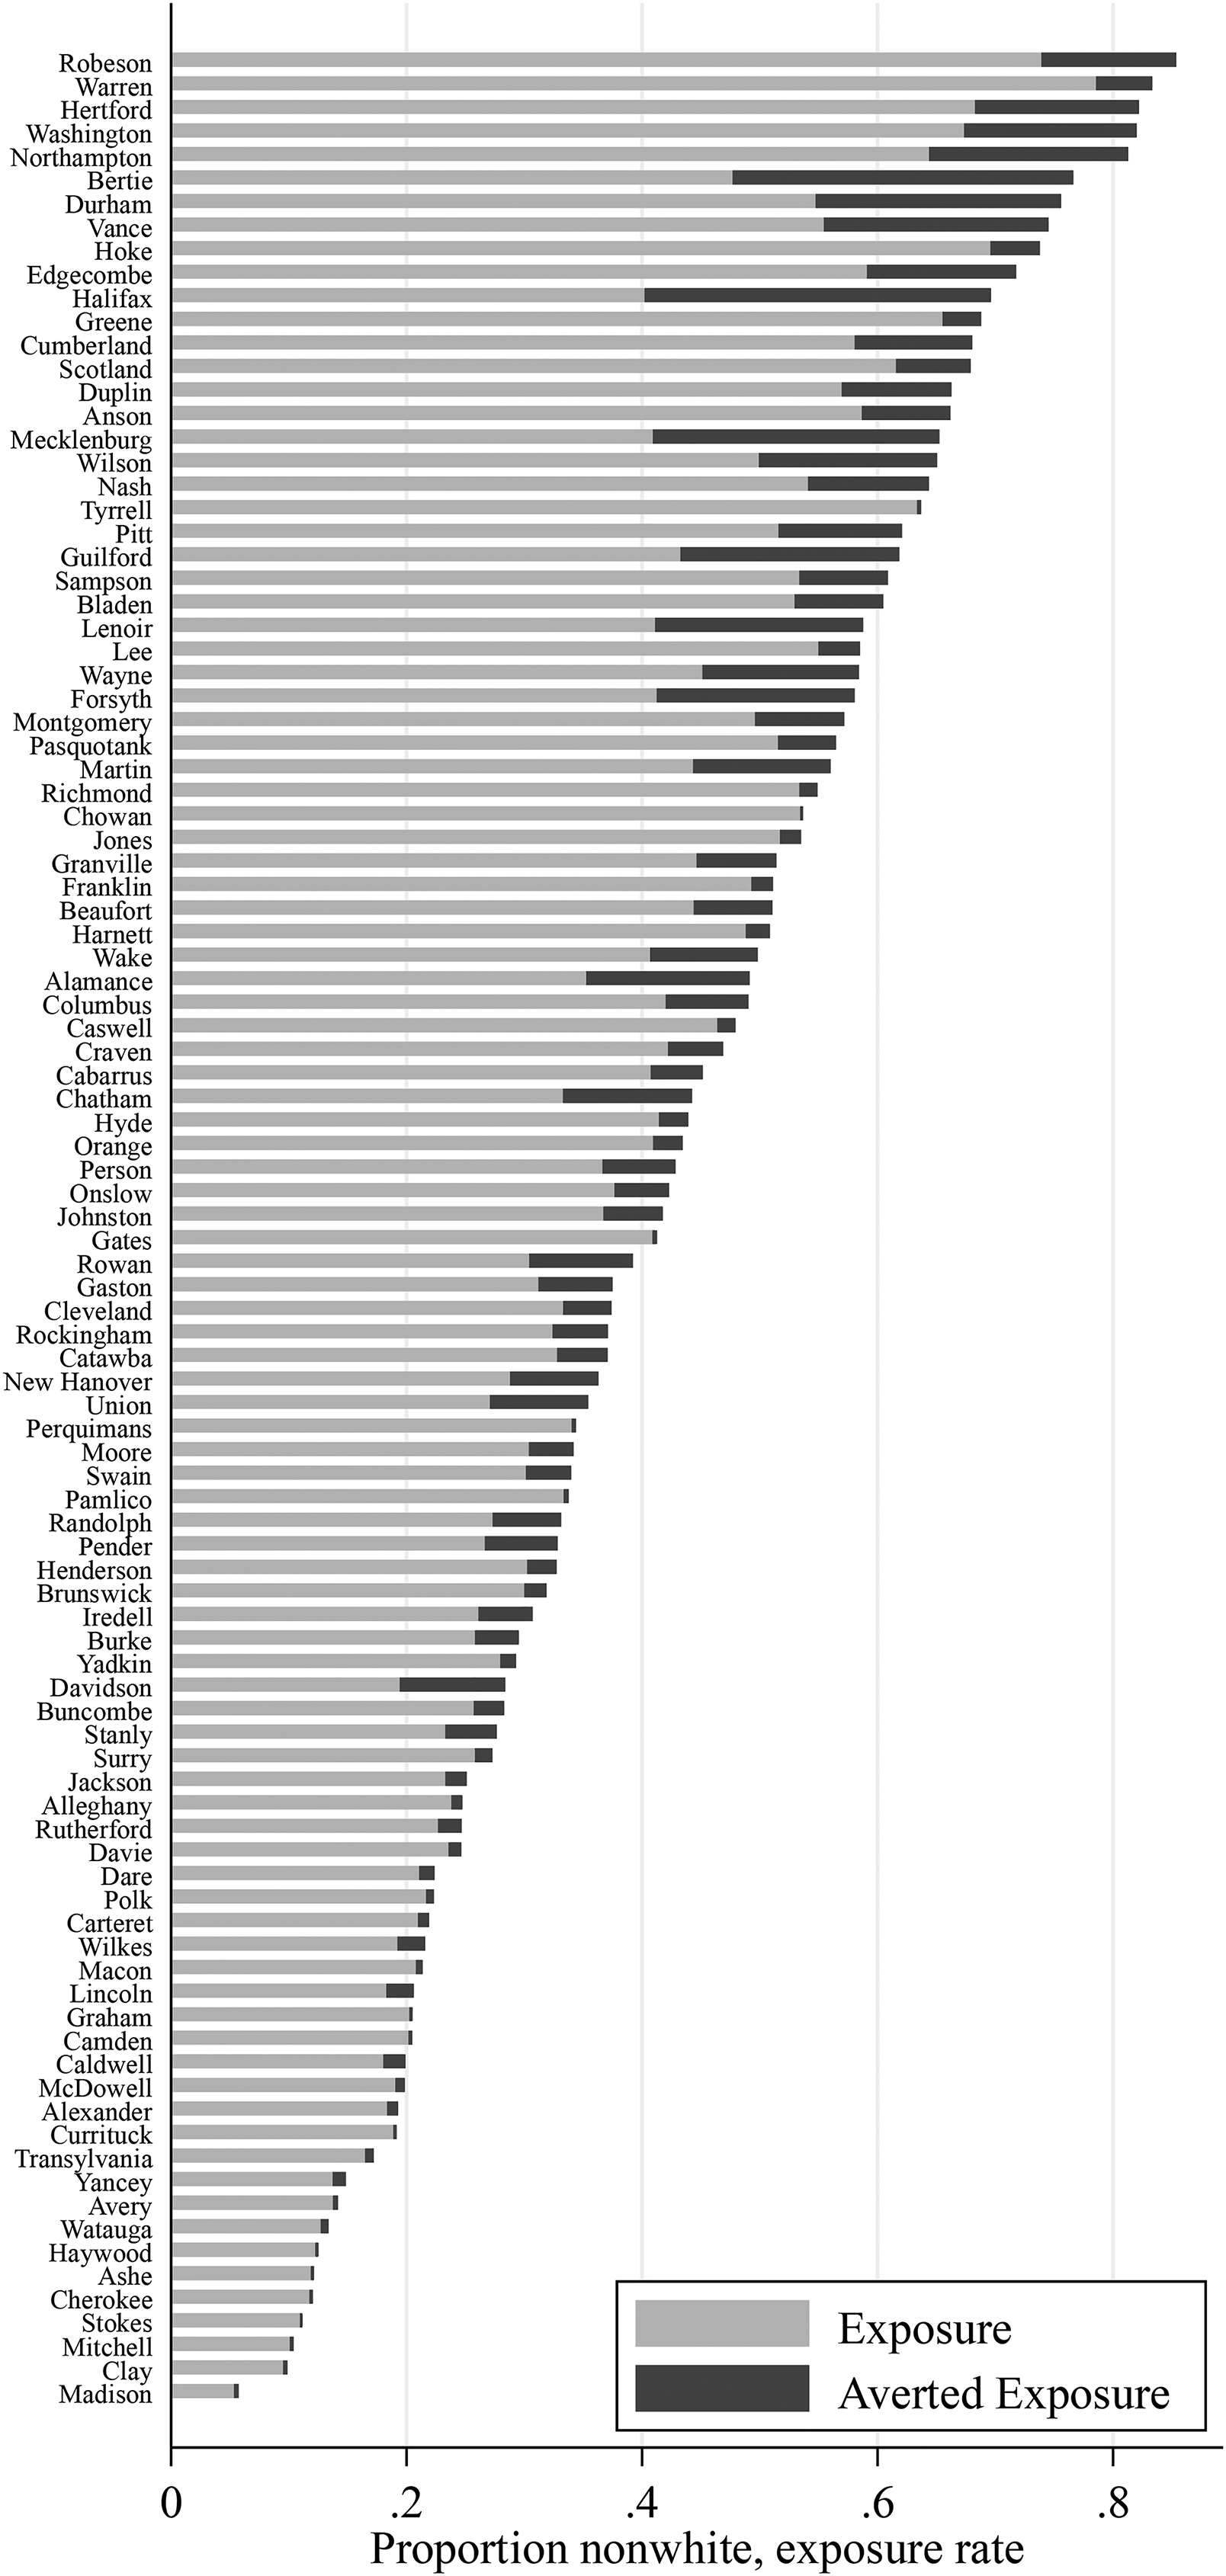
Proportion non-White and actual exposure of White to non-White students, NC counties, 2016.
At the top of the figure are the counties with the highest non-White shares of students. More than a third of the counties had non-White majorities. These were the counties where segregation tended to reduce by the biggest proportions White students’ exposure to non-White students. Three of the counties with the biggest reductions were Bertie, Halifax, and Mecklenburg. As we describe below, each of these counties featured a different institutional path to reducing interracial contact. By contrast, counties in the bottom third of the figure, where non-White students make up much smaller shares, the segregation gaps tend to be considerably smaller, in both absolute and relative terms. Indeed, it is an established feature of indices of segregation, including the dissimilarity index, to be unreliable or biased when the minority group's share is very small. 28 We therefore omit from our analysis counties that had non-White shares less than 0.04 (i.e., 4%) in 1998.
Table 2 summarizes, in its first three columns, our calculations of school segregation in the state's K-12 schools using Coleman's index. For the state as a whole, the enrolment-weighted-average White/non-White segregation increased from 0.16 in 1998 to 0.19 in 2006 and then remained constant through 2016. This jump in segregation between 1998 and 2006 was driven entirely by urban counties, most notably by Mecklenburg, Forsyth, and Wake. Among them, the biggest increase, from 0.21 to 0.38, occurred in Mecklenburg County. Once the celebrated symbol of cross-town busing for racial balance, the district drastically altered its approach to student assignment after the Fourth Circuit Court of Appeals released it from previous desegregation orders. In addition, Wake County (home to Raleigh) saw its index increase from 0.09 to 0.15, reflecting that district's easing of a policy of balancing schools by socioeconomic status, and Forsyth (home to Winston-Salem) saw its index rise from 0.21 to 0.32. In contrast to the largest urban counties, rural counties on average experienced almost no change in White/non-White segregation. Rural counties also registered slightly smaller levels of segregation than did urban counties, though this difference could arise due to a mechanical bias in measuring segregation. 29
Segregation in North Carolina Schools, Selected Counties and Divisions: Alternative Measures.

Source. National Center for Education Statistics, Common Core of Data, Private School Universe; authors’ calculations.
Note. Segregation indices for the state and county groups are weighted averages of county statistics, where weights are county enrolments. Urban counties are those where at least half of the population lived in urban areas in 2000. State measures include counties that had non-White student populations greater than or equal to 4% of the total student population in 1998.
(a) White/non-White Coleman index. See text, equation (2).
(b) See text, equation (1).
(c) See text.
(d) See text.
TPS is traditional public schools. All public include charter schools and TPS. All schools include public and private schools.
*Comparable data on free lunch eligibility in 2016 not available. See text.
For comparison, Table 2 also presents calculations based on three other imbalance measures of school segregation: the dissimilarity index, the entropy index, and a measure of economic segregation. Like the Coleman index, the dissimilarity index indicates imbalance between White and non-White students; it closely mirrors the patterns traced by the Coleman index, albeit with higher numeric values. For the 90 counties included in the analysis, the correlation between it and the Coleman index is 0.93. The multi-group entropy index is also highly correlated with the Coleman measure (r = 0.93).
Table 2’s next trio of columns traces changes in economic segregation. We use the dissimilarity index to compare enrolment patterns for public school students eligible for free lunch (available only through 2014) to the enrolment patterns for all other students. 30 As virtually no free lunch data were available for charter schools before 2014, we calculated indices for the three years just for TPS. These indices display a pattern of changes that largely mirrors the changes in White/non-White dissimilarity. Both measures showed sharp increases from 1998 to 2014 in Mecklenburg and Forsyth, the two counties that got rid of their racial balance desegregation plans. In addition, both measures indicate declines in segregation in the smaller urban counties and the rural counties. The only noticeable difference was in Wake; whereas its White/non-White segregation increased, economic segregation was level over the period, a likely result of that county's effort to balance schools by socioeconomic status. Taken together, these patterns of economic segregation echo the findings of Owens, Reardon, and Jencks (2016), who report increases in economic segregation between 1998 and 2012 in the nation's largest school districts. In the remainder of the state, however, our measure of economic segregation remained steady or declined.
For 2014, we calculated a separate set of dissimilarity indices including charter schools, for which free lunch data were available for that year. This addition of charter schools increased the calculated degree of economic segregation across the board, suggesting that charter schools are associated not only with greater racial segregation, but also higher levels of economic segregation. To round out our comparisons, we also calculated one more set of dissimilarity indices for 2014, this one including private schools as well as public schools of both types. Lacking any data on free lunch eligibility for private schools, we made the simplifying assumption that private schools enrolled no free lunch students at all, an assumption that is inaccurate, of course, to the extent that private schools enrol low-income students. As might be expected, adding private schools in this manner led to yet higher calculated economic segregation.
With the exception of two large urban counties that threw off the constraints of past desegregation suits, the trend in segregation across the state was rather flat, if not declining—but certainly not sharply increasing. In the nearly 60 rural counties, the average degree of school segregation was lower at the end of our period than it had been at the beginning, no matter which measure is used. And across most of the urban counties in the state, segregation stayed more or less the same over the period. Stasis, not dramatic change, best describes this period.
Instruments for Undoing Desegregation
The counties in North Carolina provide illuminating examples of four different institutional mechanisms through which the increases in interracial contact achieved through federal desegregation orders are being silently undone, albeit incompletely, with each mechanism reducing interracial contact by creating racial disparities across the schools in a given geographic unit, such as a county. As we described in the Policy Instruments section, these four institutional drivers of segregation are private schools, charter schools, balkanized school districts, and differences between schools within public school districts and within the charter school or private school sectors. 31
As a way of quantifying the importance of each of these four institutional mechanisms, we take advantage of the easy divisibility of the Coleman segregation index to identify the racial disparities attributable to each of these mechanisms. We do this by dividing the gap between the maximum possible exposure rate of White to non-White students (
Table 3 presents this decomposition for several counties that illustrate contrasting institutional infrastructures that increase segregation by creating racial disparities between schools. In the first group of counties—all of them in the state's northeast corner—private schools served as the principal mechanism for achieving its 2016 level of segregation. In Bertie County, a small rural county where 74% of all students were Black, its two, nearly all-White private schools enrolled more than 40% of all the county's White students. Judging only on the basis of public school enrolments, its schools would appear to be nearly entirely integrated, with a Coleman segregation index of 0.04. However, counting its two predominantly White private schools renders a starkly different verdict, a Coleman index of 0.38. 33 As illustrated in Figure 2, White students in Bertie would have had the sixth highest share of non-White students in their schools if all schools there had been racially balanced; however, as a result of segregation, White students in that county had an average exposure rate that was middling, compared to all of the counties in the state. The biggest factor in that county's segregation was private schools. Our decomposition reveals that 0.36 of this total segregation index can be attributed to the difference in the racial composition of those two private schools and the racial composition of the county's public schools.
Noteworthy Examples of Four Segregation-Serving Instruments, 2016.
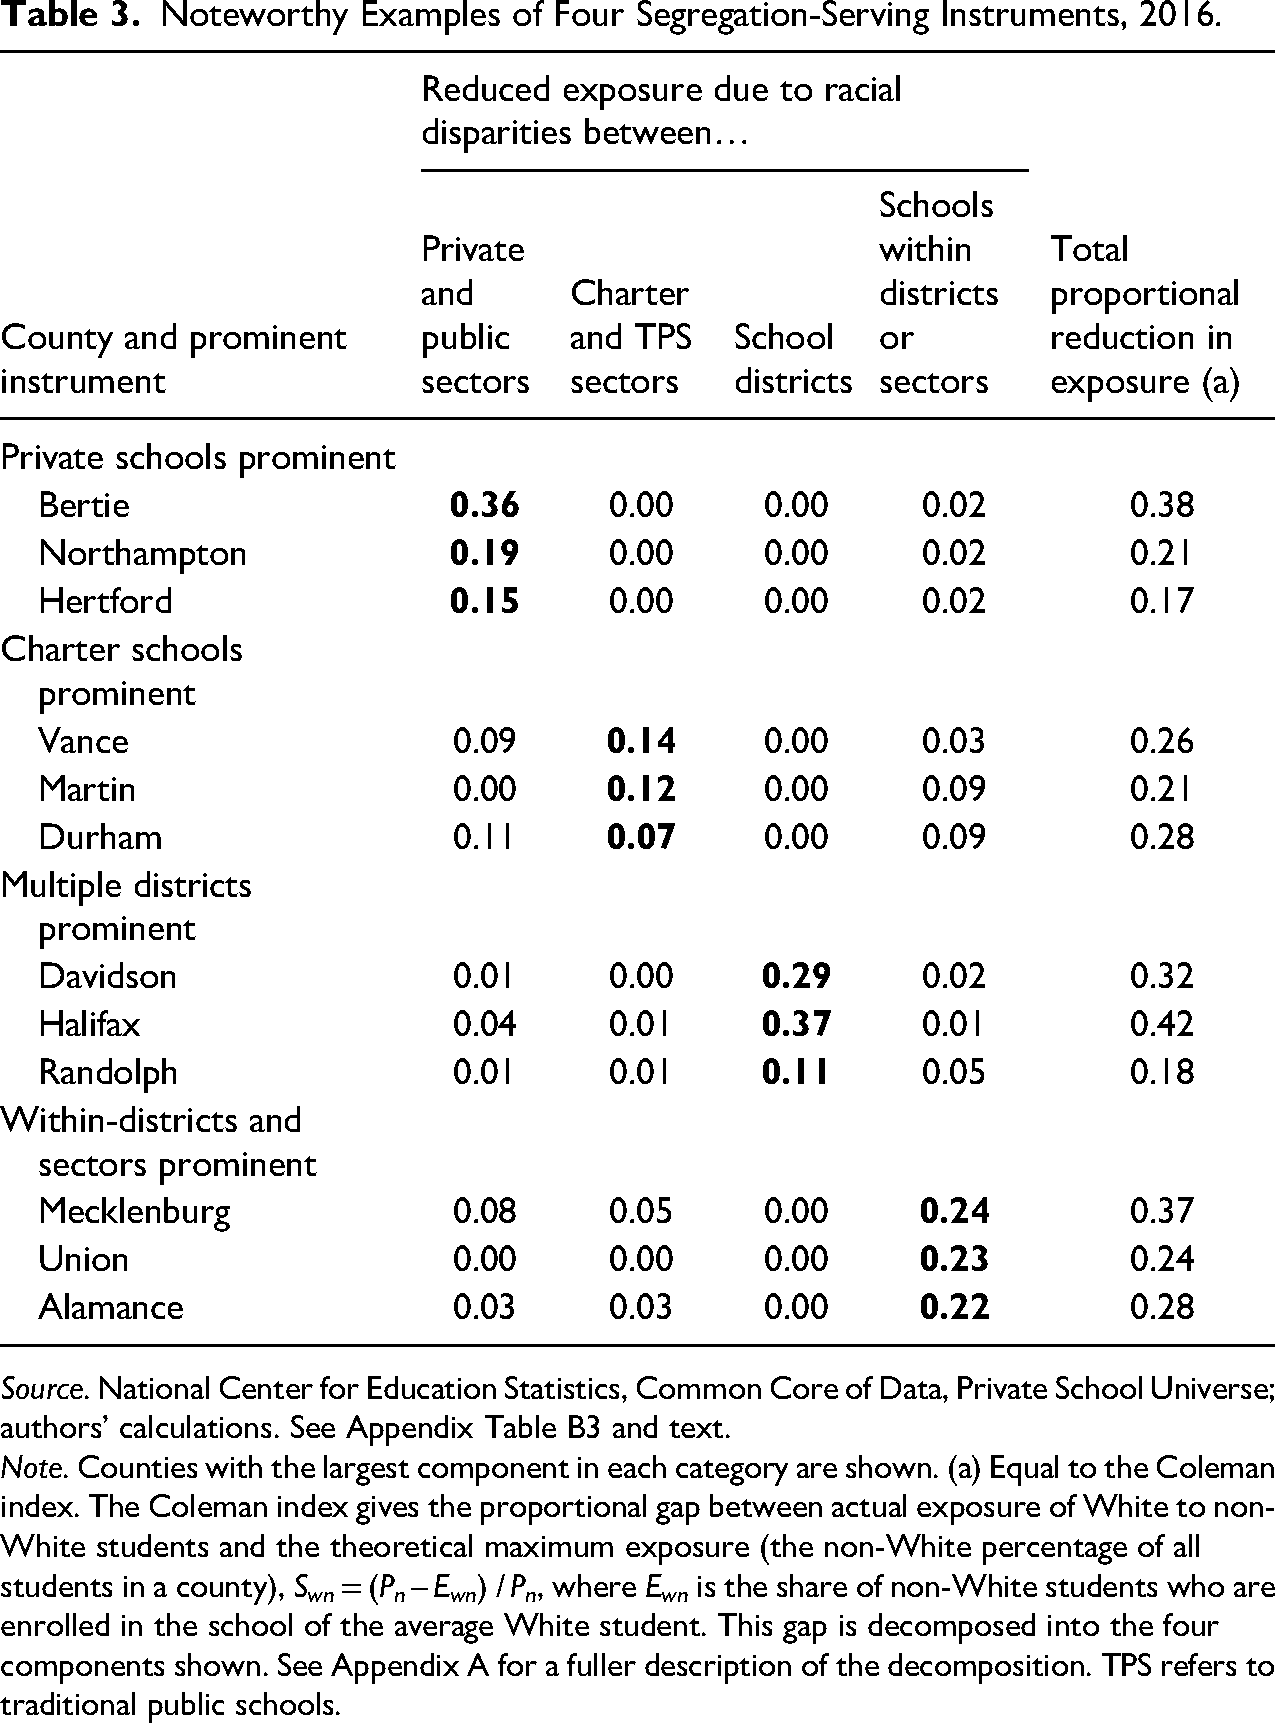
Source. National Center for Education Statistics, Common Core of Data, Private School Universe; authors’ calculations. See Appendix Table B3 and text.
Note. Counties with the largest component in each category are shown. (a) Equal to the Coleman index. The Coleman index gives the proportional gap between actual exposure of White to non-White students and the theoretical maximum exposure (the non-White percentage of all students in a county), Swn = (Pn – Ewn) / Pn, where Ewn is the share of non-White students who are enrolled in the school of the average White student. This gap is decomposed into the four components shown. See Appendix A for a fuller description of the decomposition. TPS refers to traditional public schools.
Similar situations occurred in nearby Northampton and Hertford Counties. In Northampton, two private schools enrolled 23% of all the county's White students; otherwise, the county's public schools were racially quite evenly balanced among themselves. In that county, the racial gap between private and public schools accounted for 0.19 of the county's overall 0.21 segregation. In Hertford, where 77% of students were Black, the county's one private school once again enrolled nearly a quarter of all White students. The public–private gap in Hertford accounted for 0.15 of the county's 0.17 overall segregation.
As a methodological aside, our calculations make clear a shortcoming of the many studies of school segregation that do not include private school enrolments. As a way of assessing how big a difference it makes to include data on private schools in the overall measure of segregation, we calculated dissimilarity indices by county for 2016 using only data for public schools. The result was an average segregation rate for the state of 0.17 rather than 0.19. 34 In a word, private schools remain a principal instrument for segregation, so it is clearly useful to have enrolment data on them.
The second important instrument for segregating White from non-White students was charter schools, and in several counties, they played a major role. In Vance County, where 60% of students were Black, 26% White, and 13% Hispanic, two charter schools enrolled a total of 23% of all White students, and its two private schools enrolled another 13%. Of the county's overall 0.26 segregation index, therefore, the racial distinctiveness of charter schools accounted for more than half (0.14), and private schools accounted for an additional 0.09. Charter schools also became the principal avenue for school segregation in rural northeast Martin County, where 48% of students were Black, 44% were White, and 7% were Hispanic. More than a quarter of White students were in the county's two charter schools, leaving them 84% White. The county's remaining White students were spread relatively evenly across the county's other 10 TPS. As in Vance County, the racial disparity between the two predominantly White charter schools and the county's other public schools accounted for 0.11 of the county's total 0.21 segregation. A third county, featuring both charter schools and private schools as significant contributors to segregation, was urbanized Durham County, where charter schools accounted for 0.07 and private schools for another 0.11 of the county's total 0.27 index of segregation.
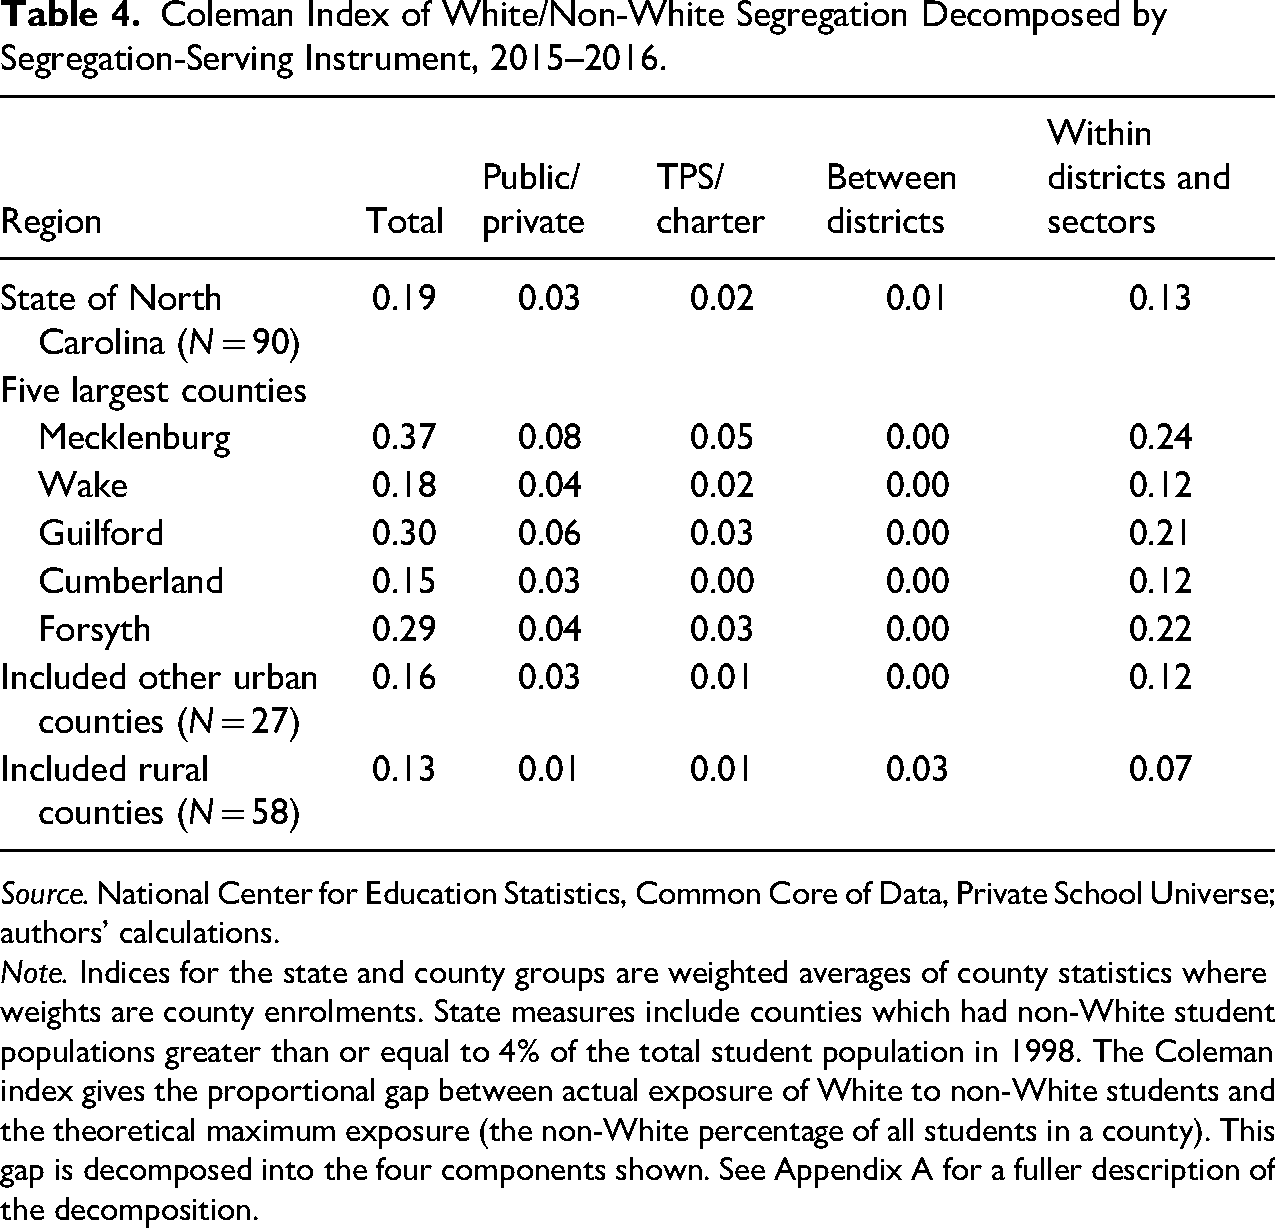
A third mechanism that played a part in producing segregation in a few counties was the one most commonly observed in the racially balkanized metropolitan areas of the U.S. Northeast and Midwest: disparities between school districts within a county. Despite North Carolina's decades-long push to consolidate its school districts, the few counties where racially distinct city districts remain show the power of this kind of legacy. Two North Carolina counties stand out as prime examples on this account. 35 One is Davidson, a county in the state's piedmont, which is home to two city districts and a larger, mostly rural and White county district. Of that county's overall segregation index of 0.32, the racial disparities among these three separate districts accounted for the bulk (0.29). Another county whose high degree of segregation arises from independent and racially disparate districts is Halifax. Its Roanoke Rapids city district enrolled more than 90% of the county's White students, leaving the county district and diminutive Weldon city district as nearly all-Black. A third example shown in Table 4 is Randolph, where a significant divergence in racial mix between its Asheboro city district and the county district accounted for 0.11 of the county's overall segregation index of 0.18.
Coleman Index of White/Non-White Segregation Decomposed by Segregation-Serving Instrument, 2015–2016.
Source. National Center for Education Statistics, Common Core of Data, Private School Universe; authors’ calculations.
Note. Indices for the state and county groups are weighted averages of county statistics where weights are county enrolments. State measures include counties which had non-White student populations greater than or equal to 4% of the total student population in 1998. The Coleman index gives the proportional gap between actual exposure of White to non-White students and the theoretical maximum exposure (the non-White percentage of all students in a county). This gap is decomposed into the four components shown. See Appendix A for a fuller description of the decomposition.
By far the biggest contributor to segregation in North Carolina's counties was differences among individual schools within public school districts and within the charter and private school sectors. This component of segregation was largest in Mecklenburg, Union, and Alamance. The Charlotte-Mecklenburg Schools, with more than 100 TPS serving students spread out over a land area of 524 square miles, had switched its method of student assignment in the fall of 2002, after the Fourth Circuit Court of Appeals had freed it in 1999 from its previous mandate to maintain a modicum of racial balance. 36 White/non-White segregation across TPS in the district increased from 0.20 in 2001 to 0.33 in 2006 (Clotfelter, Ladd, and Vigdor 2008, Table 2, p. 68). Close behind was Union County, home of many suburbs of nearby Charlotte, and Alamance, an urbanized piedmont county that has experienced a rapid increase in Hispanic enrolments.
To show patterns in the importance of these four components of school segregation, Table 4 presents weighted averages based on 2016 segregation in the same format as other summary tables. For the state as a whole, differences in racial composition within districts and sectors explain the bulk of total segregation, accounting for 0.13 of the total 0.19 overall index. Racial disparities associated with private schools, charter schools and separate districts accounted for 0.03, 0.02, and 0.01, respectively. The first two instruments were more important in urban than rural counties, but the third had its biggest impact in a handful of rural counties. Among the five largest counties, Mecklenburg led in the importance to its segregation of private schools and charter schools. (As noted elsewhere, Mecklenburg had 25 charter schools in 2016, providing plenty of latitude for racial disparities to arise.) Finally, the table reveals that neither private schools nor charter schools played a large role in creating segregation in the state's rural counties overall.
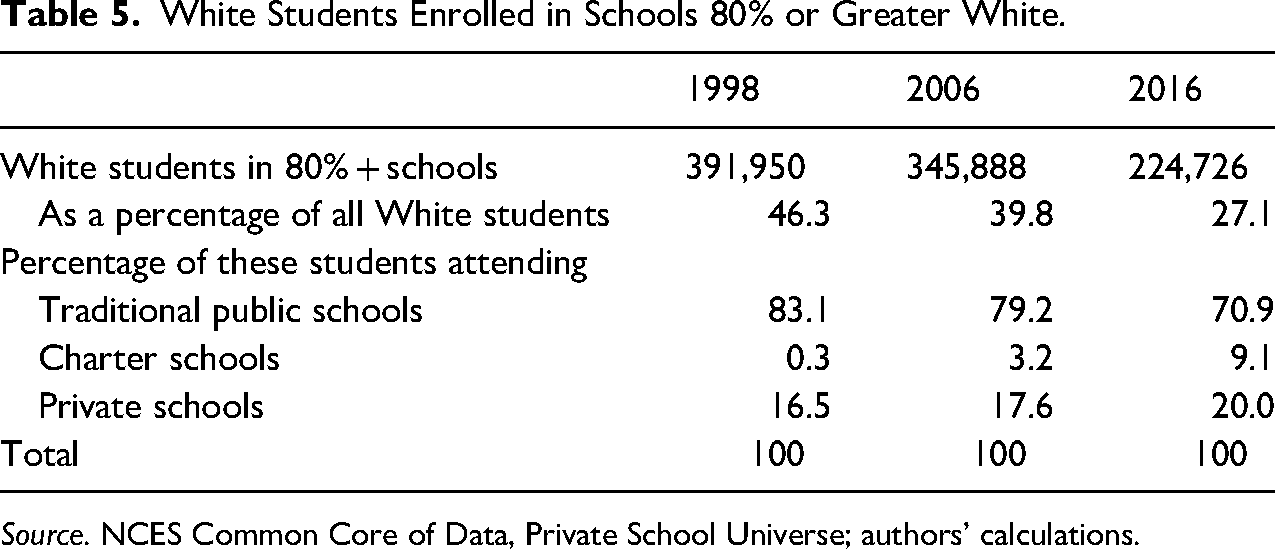
Another way of seeing the role of charter schools and private schools in facilitating segregation is to examine their importance in providing predominately White school environments. Owing to the steady increase in the share of non-White students in the state, predominantly White schools have become increasingly uncommon. As shown in Table 5, the percentage of White students in the state who attended a school with 80% or more White students declined over time, from 46% in 1998 to 27% in 2016. In 1998, charter schools accounted for virtually none of the students attending predominantly White schools, but by 2016 charter schools were home to 9% of such students. The share of White students in predominantly White schools who went to private schools also increased from 17% to 20%. Over this period, therefore, charter schools, and to a lesser extent private schools, assumed a bigger role in providing an avenue for White students to remain in largely White schools.
White Students Enrolled in Schools 80% or Greater White.
Source. NCES Common Core of Data, Private School Universe; authors’ calculations.
Segregation in Metropolitan Areas
As most of the focus of American research and policy interest related to school desegregation has focused on metropolitan areas, we apply the same decomposition used above to school segregation for North Carolina's metropolitan areas. If these metro areas tracked the experience of most metro areas in the United States, we would expect to see that the bulk of segregation would arise as much or more from racial disparities between school districts as within them (Clotfelter 2004). Such between-district disparities are especially significant in Northeastern and Midwestern metropolitan areas. As shown in Clotfelter (2004) and subsequent studies, as desegregation efforts reduced racial imbalances within school districts, White families gravitated toward predominantly White suburban districts, thus undoing some of the aggregate impact of desegregation efforts. In states where school districts tend to cover large areas, such as North Carolina, there is less scope for this kind of between-district segregation.
To compare segregation levels in North Carolina to those in metropolitan areas elsewhere and to assess how important between-district disparities are in North Carolina, we examine metropolitan-level school segregation in the state's metropolitan areas that consist of more than one county. We apply the same White/non-White measure of segregation as before, but to the schools in the portion of the entire metropolitan area located within the state, not just those in a single county. Overall metropolitan area segregation will be higher in areas where the composition of counties within the area differ one from another more than where they are similar. We employ the same method as above to decompose total White/non-White segregation into four additive parts.
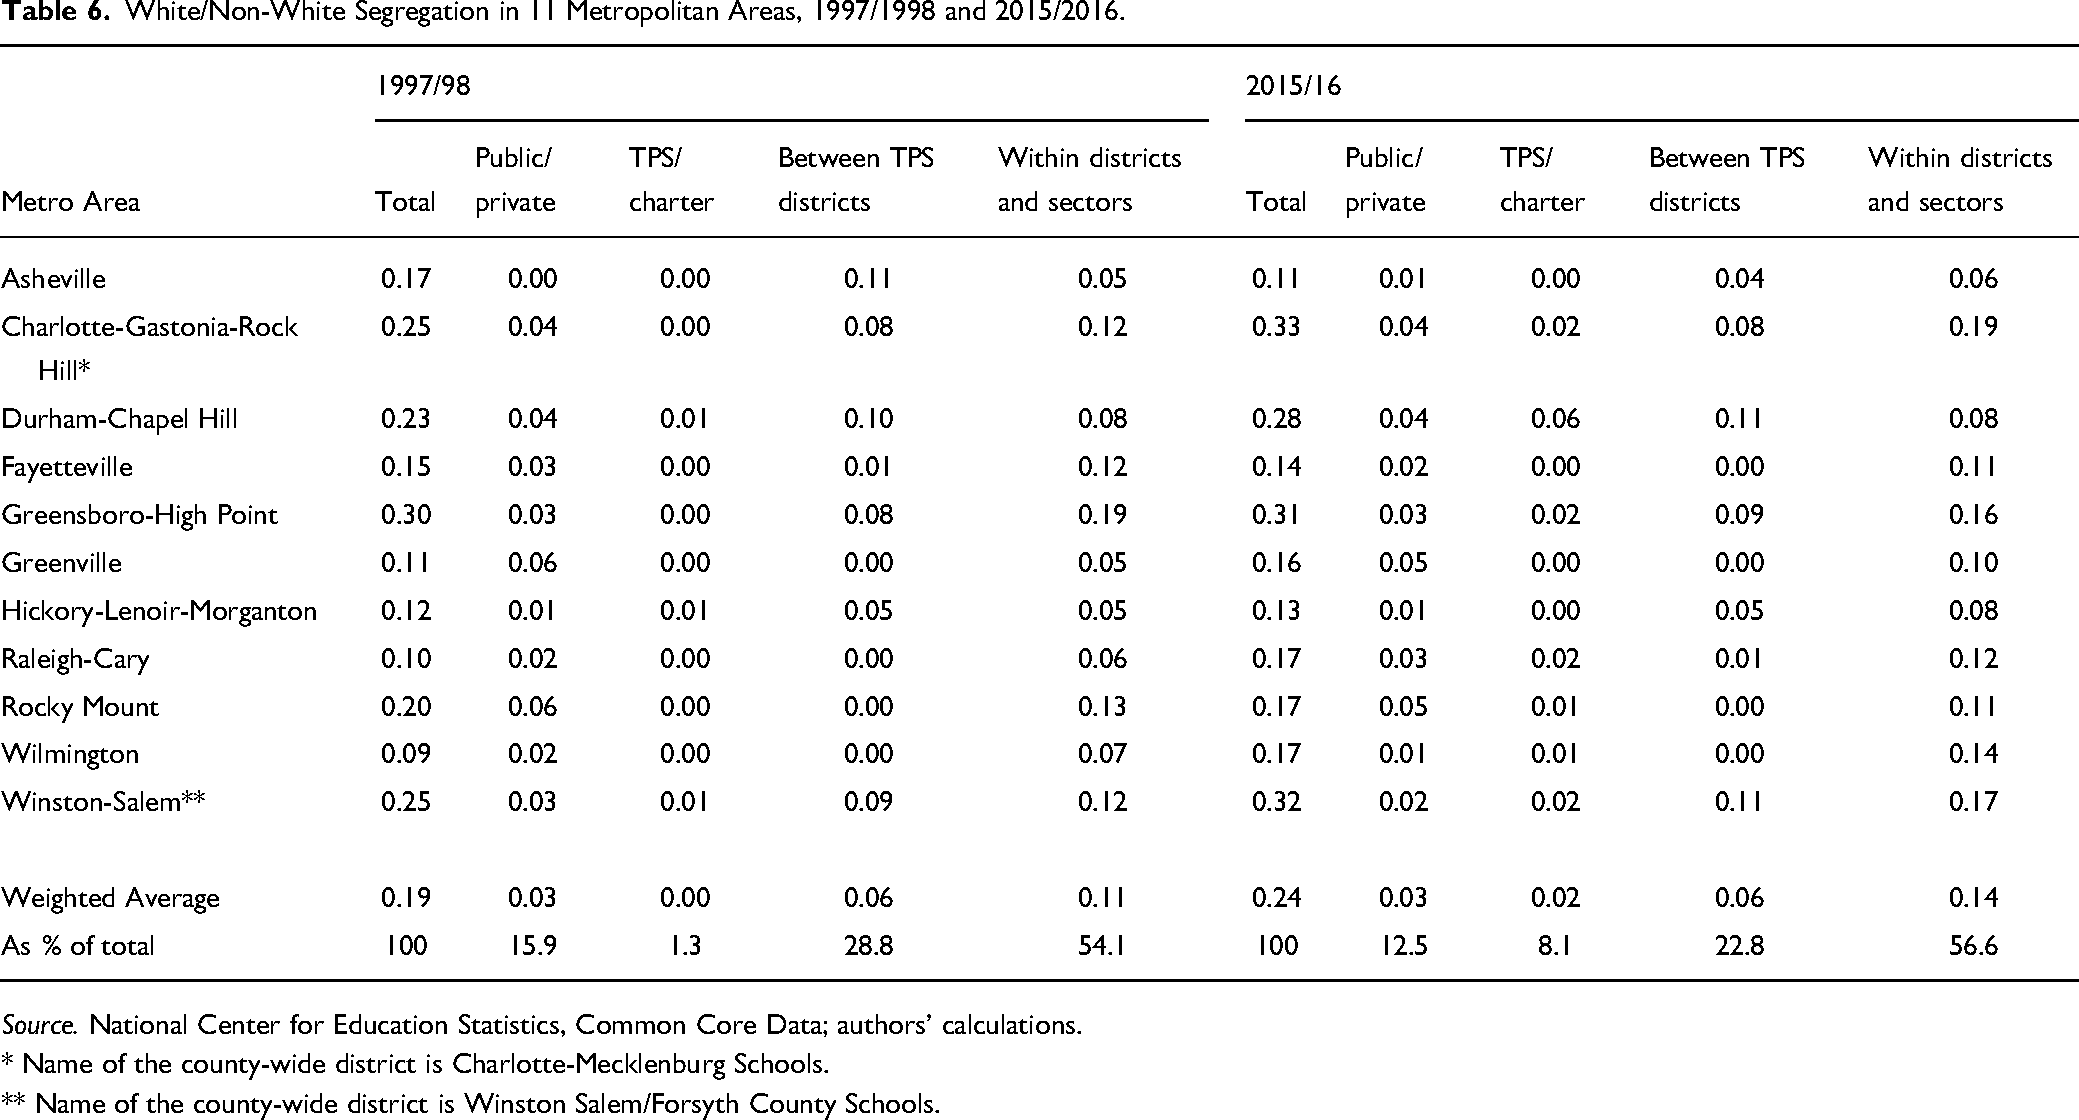
Table 6 shows the resulting calculations for the state's 11 metropolitan areas. In 2016, the most segregated metropolitan areas were Charlotte (with a White/non-White segregation index of 0.33), Winston-Salem (0.32), Greensboro (0.31), and Durham (0.28). These had also been the most segregated metro areas in 1998. These measured segregation indices for North Carolina areas are well below some of those in the rest of the country. As documented in Clotfelter (2004), calculations for the year 2000 using the same Coleman segregation index revealed that the metro areas with the highest White/non-White segregation indices were in Detroit (0.63), Monroe, LA (0.59), Cleveland (0.59), Birmingham (0.58), and Gary-Hammond (0.58) (Clotfelter 2004, p. 62). In 2000, the average among smaller metropolitan areas, a better reference group for North Carolina's metro areas, was 0.265, a value well above the average of North Carolina areas in 1998 and also above, but by less, the 0.24 average in 2016 (Clotfelter 2004, p. 73).
White/Non-White Segregation in 11 Metropolitan Areas, 1997/1998 and 2015/2016.
Source. National Center for Education Statistics, Common Core Data; authors’ calculations.
* Name of the county-wide district is Charlotte-Mecklenburg Schools.
** Name of the county-wide district is Winston Salem/Forsyth County Schools.
Between 1998 and 2016, segregation increased in eight of the 11 metro areas, notably in Charlotte (0.25–0.33) and Winston-Salem (0.25–0.32). The increases in these two areas were primarily the result of higher within-district segregation—the component of segregation most closely linked to the federal courts’ rejection of efforts to achieve racial balance after 2000. In contrast, Durham's increase from 0.23 to 0.28 was due entirely to charter schools. However, Durham was exceptional. Along with Greensboro, it shared the distinction that within-district (and sector) segregation was not the primary source of metropolitan school segregation. Across the 11 metropolitan areas in 2016, within-district disparities explain more than half of overall segregation (0.14), followed by the between-district disparities (0.06). Racial disparities introduced by private schools (0.03) and charter schools (0.02) account for the rest. Added together, the disparities associated with private schools and charter schools in 2016 accounted for sizable degrees of segregation in several areas, notably Durham (0.10), Charlotte (0.06), and Rocky Mount (0.06). Regarding the increase in average metropolitan-level segregation between 1998 and 2016 for all 11 metro areas, 0.19–0.24, part was due to charter schools and part was due to increased segregation within districts.
Other Racial/Ethnic Groupings
To this point, we have based our measures of racial/ethnic segregation exclusively on the White/non-White patterns across schools, for two reasons. First, since previous researchers have often employed this definition of racial segregation, using it here makes comparisons to previous findings, such as the ones discussed in the previous section, straightforward. Second, we believe that among the possible two-way divisions that could be employed, that between Whites and non-White remains the most illuminating single one, for it sets apart the racial group that has historically had the most political and economic power to influence the school assignment of its children.
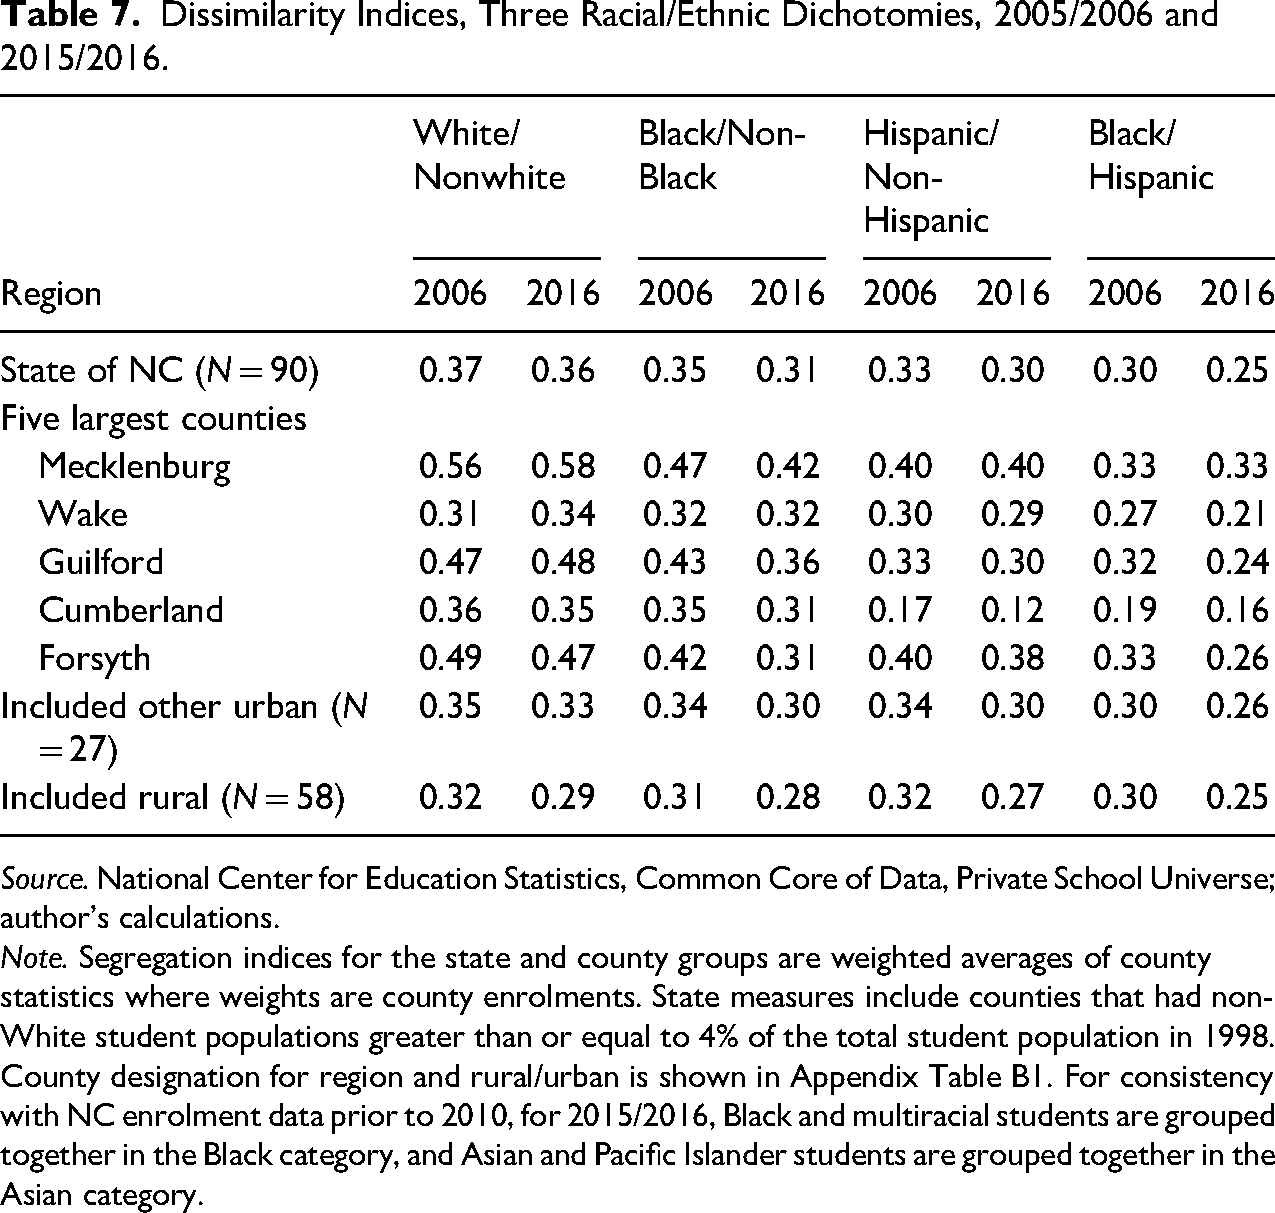
However, in keeping with a number of previous studies, we also calculated analogous segregation indices, using the dissimilarity index, based on analogous ethno-racial dichotomies, namely, Black/non-Black, Hispanic/non-Hispanic, and Black/Hispanic. 37 The numerous differences between the histories of African Americans and Latinos in the United States and in North Carolina provide compelling reasons to examine separately segregation as it relates to these two groups, as we do in Table 7. The first pair of columns simply repeats the values for White/non-White dissimilarity, shown in Table 2, the next two pairs of columns show the corresponding indices for the other two dichotomies, and the last column presents indices based on contact between Black and Hispanic students.
Dissimilarity Indices, Three Racial/Ethnic Dichotomies, 2005/2006 and 2015/2016.
Source. National Center for Education Statistics, Common Core of Data, Private School Universe; author's calculations.
Note. Segregation indices for the state and county groups are weighted averages of county statistics where weights are county enrolments. State measures include counties that had non-White student populations greater than or equal to 4% of the total student population in 1998. County designation for region and rural/urban is shown in Appendix Table B1. For consistency with NC enrolment data prior to 2010, for 2015/2016, Black and multiracial students are grouped together in the Black category, and Asian and Pacific Islander students are grouped together in the Asian category.
These comparisons show that White students are more segregated from non-White students than are any other pair of racial/ethnic groups. This inequality holds true for every county or group shown in 2016 and for all but Wake and rural counties in 2006. The magnitudes of the difference are in most cases small, but the consistency of this finding is striking. A second generalization is that, especially in the five largest counties, Black students are now more segregated from students in other racial groups than are Hispanic students from others. Finally, the general decline in segregation between Hispanic and other students over this decade was not limited to urban areas in that we see a similar decline in this measure for rural areas. These differences may suggest that, despite their recent emergence as a sizable ethnic group, Hispanic assimilation has been rapid. We note, though, other related research (Clotfelter et al. 2021b documents that Hispanic students in North Carolina are more segregated within schools than are Black students. Hence, the differences shown here between Black and Hispanic segregation across schools clearly do not represent the full story.
Conclusions and Policy Implications
Racial/ethnic segregation in schools is a subject of perennial interest and importance. Segregated schools undermine social cohesion and are often associated with racial disparities in access to school resources. Our aims in this paper are to describe patterns and trends of racial segregation in North Carolina and to distinguish the mechanisms that contributed to demographic imbalance across schools within the state's counties.
Using data on K-12 enrolments in public and private schools, we measure racial segregation in North Carolina in 1998, 2006, and 2016. As a state to study, North Carolina offers several advantages. It is large and its population is diverse, with this diversity manifesting itself with geographical starkness across counties that range from entirely rural to highly urbanized. Our measure of segregation is an index that reflects the degree of racial imbalance in the schools located within a geographical area (Coleman, Kelley, and Moore 1975). For most of our calculations, we define the relevant geographic area as a county, which corresponds to a school district in 89 of the state's 100 counties. Thus, we are measuring the degree to which the racial composition of individual schools within a county differs from that of the county's overall racial mix. In order to compare segregation rates in North Carolina to those in other parts of the U.S., we also report segregation indices using the state's 13 metropolitan areas as the relevant geographic unit. Finally, we supplement our racial segregation measures with those based on the economic status of students. We do not examine segregation that may occur within schools.
The beginning and ending years of our study were determined by data availability. We chose the additional year 2006, which was close to the midpoint of the period, in order to explore potential effects of changes in federal court pressure on local districts while avoiding confounding effects related to the start of the Great Recession in 2007. During the full period a large influx of immigrant and first-generation Hispanic students enrolled in schools across the state, boosting the Hispanic share from 3% in 1998 to 16% in 2016 and helping to increase the non-White share from 35% to 49% (Appendix Table B1). In addition, the full period was one in which the state legislature embraced and expanded the state's array of charter schools and promoted the use of vouchers for private schools. Over the period, the share of students attending charter schools rose from less than 1% to nearly 5%. Unlike charter schools in most of the country (Logan and Burdick-Will 2017, p. 214), those in North Carolina were not just a big city phenomenon; they also cropped up in small towns and rural counties. Over time the state relaxed the original requirement that its charter schools be racially representative of their locales, allowing them in more than a few instances to become the racially distinct schools that critics originally feared they would become.
We find that racial segregation rose in North Carolina between 1998 and 2006, largely reflecting the removal of federal court pressure for districts to racially balance their schools, after which it remained level or declined slightly in the following decade. The increase was mainly confined to urban areas, where segregation increased on average by more than a third. 38 In contrast, economic imbalance fell between 1998 and 2006, and then increased over the ensuing decade, perhaps reflecting the effects of the Great Recession. Viewing the degree of racial segregation across the state's counties highlights one unmistakable pattern: segregation tends to be higher in urban counties and those with higher shares of non-White students.
Within each county, we decompose segregation into four additive components. While we find that the primary instrument for generating the observed segregation in a few counties was the availability of charter schools, private schools, or the existence of multiple districts within the county, the most consequential contributor to segregation in most counties was disparities across individual schools within districts or sectors. This pattern aligns with previous theoretical work on how parental preferences may generate segregated schools. Nonetheless, given this finding, it might behoove policymakers to publish information on the racial disparities across schools within districts with the hope of changing the behavior of local school boards, legislators, or voters. Indeed, one advocacy group in North Carolina recently made such a suggestion. 39 The proposed legislation would require the calculation for each school in a county of a “disproportionality index,” showing how far that school diverged from the county's overall racial composition, and that the calculations be included in the school-level accountability reports now issued each year by the state. To facilitate the interpretation of the ratings, the proposed legislation suggests arbitrary cutoffs for grouping schools on the basis of this index, ranging from Proportional (less than 10) to Highly Disproportional (50 or more). 40
To illustrate how this approach might work in practice, we have calculated the index for an illustrative county, Chatham, a racially diverse county that has seen a rapid increase in Hispanic enrolment. Table 8 shows the enrolments by race and ethnicity of all the public schools (including charter schools) in the county. Across the county's 20 public schools, this index ranged from a low of 3, for SAGE Academy, whose racial and ethnic mix almost exactly matched the county's, to a high of 50, for the overwhelmingly Hispanic Virginia Cross Elementary School. We have noted the rating that each school would receive based on the proposed rating system. To date, there is no research to suggest how a policy such as this might affect the actions of key decision makers, including parents, but it seems a worthy topic of future research. We note that this basic approach is fully consistent with current national discussions about promoting equity in education by shifting the focus away from levels of outcomes to differences across schools in educational opportunities (including, as here, those related to racial and ethnic segregation).
Applying a “Disproportionality Score” to Public Schools in Chatham County, NC, 2016.
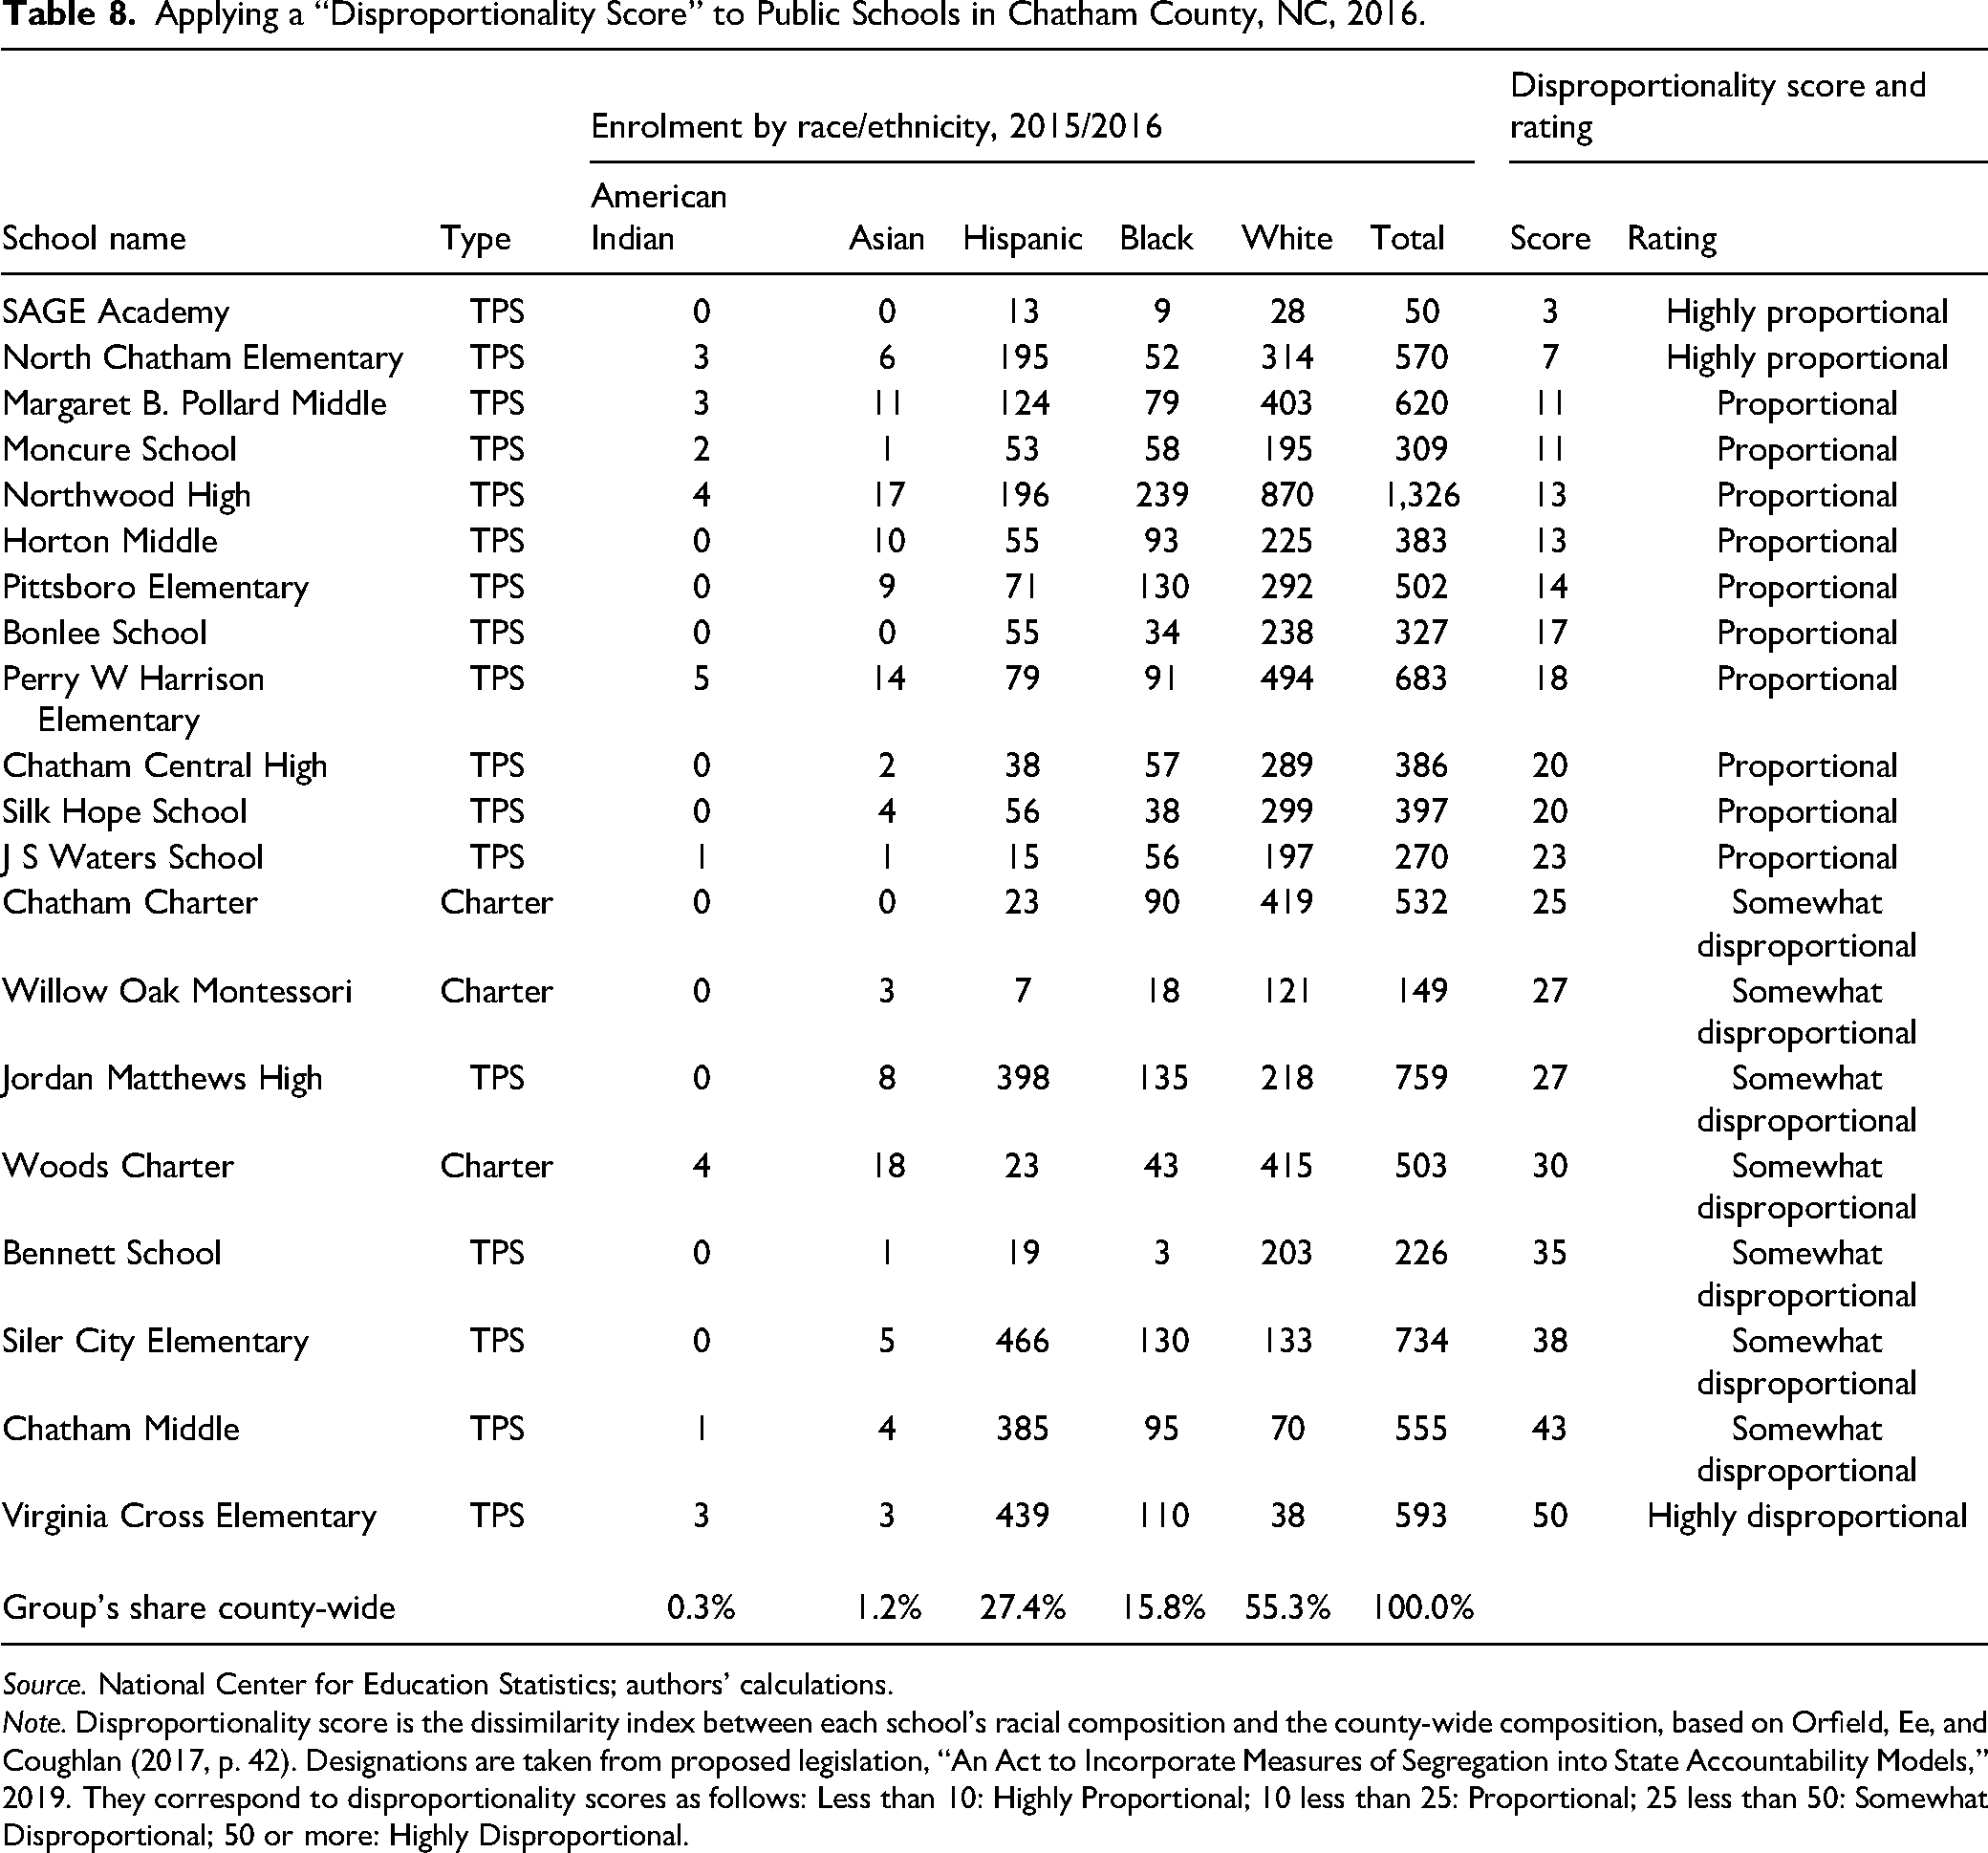
Source. National Center for Education Statistics; authors’ calculations.
Note. Disproportionality score is the dissimilarity index between each school's racial composition and the county-wide composition, based on Orfield, Ee, and Coughlan (2017, p. 42). Designations are taken from proposed legislation, “An Act to Incorporate Measures of Segregation into State Accountability Models,” 2019. They correspond to disproportionality scores as follows: Less than 10: Highly Proportional; 10 less than 25: Proportional; 25 less than 50: Somewhat Disproportional; 50 or more: Highly Disproportional.
Regarding segregation in the state's 13 metropolitan areas, we find that segregation increased in nine. By way of comparison to other metropolitan areas in the country, those in North Carolina registered a lower average level of segregation in 1998 (0.20) than for comparably sized metropolitan areas in the U.S. in 2000 (0.265; Clotfelter 2004, p. 73). The feature that accounts for the state's lower levels of metropolitan segregation is the large size of most of its districts. In the few areas where counties are split into multiple districts, segregation tends to be higher.
One hopeful point on which to conclude is to keep in mind the potential benefits of having the large county-wide school districts that characterize North Carolina and many other states in the South and West. Instead of balkanized districts, which are common in the North and Midwest, the chief threats to integrated schools in states like North Carolina will be charter schools, private schools, and efforts to reverse the long trend toward district consolidation.
Supplemental Material
sj-docx-1-uar-10.1177_10780874211049510 - Supplemental material for School Segregation in the Era of Color-Blind Jurisprudence and School Choice
Supplemental material, sj-docx-1-uar-10.1177_10780874211049510 for School Segregation in the Era of Color-Blind Jurisprudence and School Choice by Charles T. Clotfelter, Steven W. Hemelt, Helen F. Ladd and Mavzuna R. Turaeva in Urban Affairs Review
Supplemental Material
sj-xlsx-1-uar-10.1177_10780874211049510 - Supplemental material for School Segregation in the Era of Color-Blind Jurisprudence and School Choice
Supplemental material, sj-xlsx-1-uar-10.1177_10780874211049510 for School Segregation in the Era of Color-Blind Jurisprudence and School Choice by Charles T. Clotfelter, Steven W. Hemelt, Helen F. Ladd and Mavzuna R. Turaeva in Urban Affairs Review
Footnotes
Acknowledgments
We are grateful to Calen Clifton for excellent research assistance and to Dave Marcotte, Ann Owens, Tim Sass, and participants at the 2019 CALDER conference for helpful comments. This research was supported by the National Center for the Analysis of Longitudinal Data in Education Research (CALDER), which is funded by a consortium of foundations. For more information about CALDER funders, see ![]() . All opinions expressed in this paper are those of the authors and do not necessarily reflect the views of any institution.
. All opinions expressed in this paper are those of the authors and do not necessarily reflect the views of any institution.
Supplemental Material
Supplemental material for this article is available online.
Notes
Author Biographies
References
Supplementary Material
Please find the following supplemental material available below.
For Open Access articles published under a Creative Commons License, all supplemental material carries the same license as the article it is associated with.
For non-Open Access articles published, all supplemental material carries a non-exclusive license, and permission requests for re-use of supplemental material or any part of supplemental material shall be sent directly to the copyright owner as specified in the copyright notice associated with the article.