
Abstract
This research turns the spotlight to the deregulation of once publicly funded affordable housing. Through a microsimulation that follows the conversion from affordable to market-rate units on Roosevelt Island New York, we estimate the expected demographic changes each year between 1976 and 2070. The simulation combines information from the American Community Survey, the island's masterplan, the privatization agreements, and interviews with residents, to produce interactive graphs at three urban scales: the neighborhood, the project, and the building. We found that while the households of market-rate units are gradually becoming younger and more affluent, the households of affordable units are becoming older and more impoverished. Despite an individual agreement for each building, the demographic changes are similar, and that, those changes will affect low-income buildings first. Moreover, upon expiration, 30 percent of the existing protected tenants will be over 65 and at risk of being displaced. The simulation is available at http://ridigitaltwin.pythonanywhere.com/.
Introduction
Unlike urban renewal projects, which necessarily draw public attention as the demolition of buildings rips through the urban fabric (Anderson 1964; Gans 1965a), deregulation of once publicly funded housing projects occurs quietly and behind closed doors. Nonetheless, the cumulative demographic change it engenders in terms of displacement and gentrification is almost as dramatic as that caused by the urban renewal projects of the 1960s (Yavo-Ayalon 2022b). To better understand this process, this research suggests a microsimulation that traces the deregulation of Roosevelt Island, New York, and offers a plausible estimation of what the future might hold for the island's population. By doing so we join the efforts of researchers engaged in attempting to define, measure, and model gentrification and displacement (Benenson and Torrens 2004; Boeing 2017; Chapple, Waddell and Loukaitou-sideris 2017; Eckerd, Kim and Campbell 2019; Nelson and Ayers 2018; Levine et al. 2022). Our unique contribution stems from focusing on the demographic change resulting from the deregulation of once publicly funded affordable housing, namely the Mitchell Lama Program (ML). 1
New York City's is one of the most progressive cities in the US in its commitment to the development and rehabilitation of affordable housing (Schwartz 1999, 839), going back to the Tenement House Act of 1879, which predates any federal interventions in the matter (Elmedni 2018; NYU Furman Center 2022). Despite this long-standing contribution to the shaping of national housing policies, NYC is amid an affordable-housing crisis (Stringer 2018), which was further intensified during COVID-19 and its high toll on low-income renting families (Dougherty 2021). Whereas the US Department of Housing and Urban Development (HUD) defines affordable housing as housing that a household can obtain for no more than 30 percent of its income (HUD 2018), New Yorkers are estimated to spend much more. 2 As the federal funding for existing affordable housing continues to dwindle (Elmedni 2018, 3; Kleit and Page 2015), the deregulation of once publicly funded affordable housing has been the main tool for preserving and maintaining the existing stock (He 2016). However, these processes are also gradually and quietly creating urban migration patterns that are changing the demographic profile of cities with a cumulative change that we cannot fully estimate at this stage.
Our research focuses on gentrification and displacement that may result from this deregulation of assisted housing and suggests new tools to quantify and predict them. Gentrification and displacement are demographic movements that have been recognized and debated in the literature since the1960s (Glass 1964; Grier and Grier 1978). Hackworth and Smith (2001) introduced “wave thinking” to contemplate these phenomena and identified three waves of gentrification, updated to four (Lees, Slater and Wyly 2008) or five (Aalbers 2018) in current literature. Within this discourse, the concept of a “tipping point” (Grodzins 1958), or the point at which the population decides to move in or out, will serve us here as a useful concept.
Roosevelt Island, located in the East River adjacent to Manhattan's Upper East Side, was chosen as a case study because it combines ML-funded projects that have expired with more recent market-led developments. Figure 1 shows the location of the island and its demographics. The development of the island was the first mixed-race, mixed-income community development project, and one of the only to be publicly funded (Freemark 2011; Yavo-Ayalon 2022a). It consisted entirely of affordable units with tenants protected under ML Housing Program. Some two decades later, newer market-rate buildings were developed consisting of 20–40 percent affordable units and incentivized by the Low-Income Housing Tax Credit (LIHTC) program (Aurand et al. 2018). In parallel to the new developments, the original ML affordability plans have expired and most of the buildings are being converted to market-rates (RIOC 2020). As the affordability plans inch closer to their expiration dates, we seek to clarify the future of the remaining protected tenants and whether this process will lead to demographic shifts.

Roosevelt Island’s location in NYC, part of Community District 8.
To answer these questions, we developed a data-based microsimulation that draws its basic assumptions from urban historical research. Microsimulation enables the creation and analysis of computerized agents and their assignment to specific environments (Batty 2005). Our microsimulation traces this process of development and deregulation up to the present and offers a plausible probabilistic outcome for the future. It generates yearly values for the period 1976–2070, based on a combination of data from the American Community Survey (ACS), Roosevelt Island's master plan, the new plans for the preservation of affordable housing and withdrawal from the Mitchell-Lama Program (The “Affordability Plan”), and resident interviews. Through this simulation, we describe, analyze, and suggest one possible scenario of demographic change on the island. To isolate one parameter of residential gentrification and discuss it thoroughly, the simulation is based on a specific subsidy and its deregulation process, and on one building and the duplications of its roles. We emphasize that this is an experimental proof of concept based on a specific subsidy and its deregulation process. We also argue, however, that it is an important initial step toward harnessing advanced technological power for visualizing and simulating complex demographic movements.
The research contribution is threefold: (1) a theoretical contribution to the state of the art in the analysis of expiring use and rental deregulation by placing it within the discourse of gentrification and displacement waves, (2) a methodological contribution using a microsimulation focusing on a case study with real-world data to understand and predict this process and, (3) a practical contribution by proposing its use as a tool for urban management.
Following this introduction, the theoretical background explores the theoretical discourse on waves of gentrification and displacement in relation to expiring use and rental deregulation and specifically focusing on the expiration of ML Housing Program. It also introduces the concept of the “tipping point.” Then, the methods section reviews the logic of the simulation, and the results section depicts the historical processes of deregulation by moving along with the simulation timeline on three urban scales: the neighborhood scale, the housing project scale, and the individual building scale. In the discussion, we consider the strengths and the limitations of this simulation as an urban management tool, as well as the future research it facilitates.
Theoretical Background
Linking the Expirations of Affordable Housing Plans to Gentrification and Displacement
Understanding the role of the deregulation of affordable housing within the discourse of displacement and gentrification requires a long-term observation of neighborhood dynamics. It is a multigenerational cycle that precedes the life cycle of tenants in which the physical environment may improve or deteriorate, and the population may move in or out of the neighborhood (Marcuse 1986; Slater 2009). To assist in such an observation, this background section contemplates the waves of displacement and gentrification that have stemmed from the policies that created affordable housing in NYC, showing how policies and government assistance to housing have evolved based on the lessons learned from displacement and gentrification.
Beginning with the Housing Act of 1937 and the creation of the US Housing Authority, which were intended to eliminate the economic and social liability of slums (Schwartz 2015), the first cycle of such demographic movement is associated with Robert Moses's slum-clearance projects of the 1950s, which displaced millions of low-income people of color from inner-city slums to public housing elsewhere (Altshuler and Luberoff 2004; Dreier, Mollenkopf and Swanstrom 2001; Judd 1979; Anderson 1964; Gans 1965b; Teaford 2000). At the same time, the provision of public-funded affordable housing led to racially segregated neighborhoods with high concentrations of poverty and crime (Hendrickson et al. 2011, 154). Gradually, low-income people of color seeking a way out of these deteriorating neighborhoods found their way into high-income white residential areas. This, in turn, led to a “white flight,” as high-income, higher-educated residents began leaving American cities for the suburbs (Wilson and Toub 2006). In this cycle, displacement of low-income residents led to the gentrification of inner cities, while forcing these residents into the outskirts of the city and causing their high-income residents to move away.
In light of these outcomes, a second generation of affordable public housing projects placed an emphasis on community development (Halpern 1995; Kelly 1976). This meant not only providing housing units but also thinking about the well-being and social benefits of the residents (Bratt 1989). In the 1970s, federal, state, and local governments financed the development of millions of units of affordable rental housing. Many of these units were financed with multiple subsidies, each with its own oversight, financing terms, and affordability restrictions (Reina and Begley 2014). Historically, one of the most successful affordable housing initiatives was the Mitchell-Lama program, under which 292 housing developments totaling more than 149,000 units of affordable housing were built in New York City between 1928 and 1978. Under the terms of the ML programs, in return for public subsidies, cooperative maintenance charges, and rental apartment rent increases were strictly controlled to ensure their long-term affordability (Thompson 2006).
This phase corresponds with (Hackworth and Smith 2001, 466) second wave of state-led gentrification. Although community development grants aimed to overcome the social disparities created by the first generation of affordable housing, they also marked the beginning of the federal withdrawal from urban policymaking in the US (Hirsch and Mohl 1993, 21). By the late 1970s, with the dismantling of federal aid programs, deindustrialization, increasing poverty, and the flight to the suburbs, most large cities encountered severe fiscal problems, including NYC, which was on the verge of bankruptcy. To contend with this crisis, the age of the Entrepreneurial City came to be (Harvey 1989; Molotch 1976), as municipalities rebuilt their economic strength through diverse mechanisms of market forces. This process accelerated in the 1980s. In the current US system, private investments are the primary tool for creating affordable housing, to which the public sector provides financial and regulatory incentives (Fainstein 2001; Sutton et al. 2008, 38).
In 1985, Mayor Koch introduced the Ten-Year Plan for Housing, which consisted of more than 100 programs with different. This plan lasted 15 years and extended into Dinkins's and Giuliani's administrations (Elmedni 2018, 2); however, the city's emergence as a world city, the inflation of the real estate market, and the art-led gentrification of SoHo and the Lower East Side induced homelessness, eviction, and the displacement of low-income residents (Davidson 2009).
The third wave of gentrification was characterized by municipalities and states incentivizing private investments to revitalize underdeveloped areas. During this wave, which was associated with the city's recovery from the recession of the 1990s and the globalization of the real estate sector, larger developers got involved in the process (Hackworth and Smith 2001, 466). The improvement of urban environments enhanced this wave of gentrification, as millennials and retiring baby boomers started moving back into city centers (Ehrenhalt 2012, 32). This renewed interest in the urban lifestyle (Zukin 1995), and the creative city (Florida 2005; 2017), once again revealed the double-edged sword of gentrification: On the one hand, it may contribute to the revitalization of impoverished and deteriorated urban neighborhoods (Hamnett 1984; Lees, Slater and Wyly 2008) and improve the physical environment, services, maintenance, housing, and infrastructure through individual actions or state-sponsored investments (Bridge and Butler 2011; Davidson and Lees 2009). On the other hand, it may lead to residential and racial segregation (Powell and Spencer 2002) stemming from the increasing cost of living in the neighborhood and ultimately displace its low-income residents. This cycle of gentrification and displacement occurred in parallel to Mayor Bloomberg's New Housing Marketplace Plan (2003–2014), which relied primarily on partnerships between the private sector, nonprofits, and public agencies and advanced the 80/20 rule, according to which at least 20 percent of all new units must be affordable (He 2016; Stabrowski 2015).
Under Mayor de Blasio's Housing New York: A Five, Ten-Year Plan (Glen 2012) for the creation and/or preservation of 300,000 affordable housing units (Elmedni 2018, 1), the main affordable housing program is the LIHTC program, which incentivizes developers to build housing units that target residents earning 50–60 percent of the Area Median Income (AMI).
Lees, Slater and Wyly (2008) conceptualized a fourth wave of gentrification that is specific to the US. This wave is characterized by the financialization of housing (Aalbers 2018, 5), and deregulation-led or market-led housing, in which it is largely the private real estate sector that initiates the development of the housing stock.
The financialization of housing is also related to the expiration of the ML Housing programs. Developers are allowed to “buyout” at the end of the contract, which usually lasts 20 years (Geberer 2005; Thompson 2006). Deregulation gives the owner the option of charging market rates for the apartments after they are vacated, and since many of the neighborhoods containing ML buildings have witnessed a dramatic increase in real estate prices, opting out has become even more attractive (Geberer 2005). However, pursuing a buyout can lead to an immediate and sharp increase in rent and maintenance fees, making the buildings unaffordable to many or most of the residents (Thompson 2006, 5).
Aalbers (2018) identifies a fifth wave related to the global financial crisis of 2008, in which the public sector also plays an important role, alongside the finance industry, in developing housing that is now reinforced by global investments. The financialization of housing that was typical of the US is now spreading to other parts of the world, leading to housing-price inflation and a crisis of affordability around the world. As cities are becoming very expensive, increasingly larger social groups are being excluded from housing in inner city locations, resulting in indirect displacement.
Whether gentrification is caused by demographic forces such as artists and alternative households in movements that create increased demand for urban lifestyle and an abundance of job opportunities or is induced by capitalist interests through a combination of private forces and public policy, the question remains whether it must lead to displacement (Chapple 2017, 86). Some argue that gentrification may accrue without displacement or whitewash it by rationalizing that when gentrification has led to displacement, it has provided an opportunity for the displaced to find less gentrified areas with better housing for lower rent (Freeman 2005; Freeman and Braconi 2004; Hamnett 2003; Vigdor, Massey and Rivlin 2002). Opposing scholars stress that the exclusion of low-income households is an inherent part of gentrification (Davidson and Lees 2009; Newman and Wyly 2006; Slater 2009). And still, others maintain that, although displacement may be a defining characteristic and outcome of gentrification, it can also occur in the absence of gentrification (Zuk et al. 2018, 35). Paul Romer seminal analysis added the idea of a counter-gentrification movement that modern cities are expected to experience in the age of digitization. Millennials will live in small apartments in cities as opposed to the gentrification experienced by baby boomers in the 1970s and 1980s. He highlights that displacement is going to be the next challenge.
Whether displacement is or is not an inherent aspect of gentrification, we sought, through observation of the interplay between these two demographic movements, to gain insight into the decision-making of the households that take part in them. To this end, we employed the concept of the “tipping point” and adapted it to the decision-making of low-income households.
The Tipping Point as an Important Moment in the Life Cycles of Gentrification and Displacement
Originally introduced in the context of “white flight,” the tipping point was regarded as the threshold at which white, high-income residents decided to leave a neighborhood when low-income residents of color started to move in (Grodzins 1958). In this sense, the tipping point on the neighborhood scale leads to a collective exodus due to neighborhood perceptions; it is related primarily to race, and the literature attempts to identify the phase in which people make a decision. Schwirian (1983), for example, argued that the decision of residents to move out was affected by the desire to live next door to people who are similar to them and by the fear of declining property values.
The concept of the tipping point is highly contested, since its definition is on the one hand primarily cultural, referring to a limit of neighborhood tolerance for mixed housing, without clearly marking this limit. Critiques have argued that no single, uniform tipping point can be identified (Giles, Cataldo and Gatlin 1975) and that the assumption that mixed neighborhoods are unstable is altogether wrong (Ottensmann 1995). On the other hand, Smith (1979a, 1979b) suggested economic reasoning for gentrification emphasized the mobility of capital and investments, over the mobility of people. In this context, he proposed the “rent gap theory”, according to which a gap between the current rental income of a property and the potentially achievable rental income will attract investors to invest in the neighborhood (Levine and Aharon-Gutman 2022; Mendes 2018). Other researchers have sought quantitative expressions, arguing that an area will reach its tipping point when the low-income minority exceeds 25–30 percent of the total population (Stinchcombe, McDill and Walker 1969).
Despite this debate, we found the tipping point to be a term that is helpful in describing an important moment in the life cycle of gentrification and displacement. Whereas most researchers use the concept of the tipping point to refer to the moving out of high-income residents, we use it to understand the decision-making of low-income residents. For them, this is not always a voluntary decision, as “they may technically ‘choose’ to move out, but the likelihood that they had any real alternative is very small” (Newman and Owen 1982, 137).
In this context, we also note Marcuse's argument that the mere presence of middle-class residents is sufficient to cause the exclusionary displacement of low-income households through the loss of affordable housing inventory (Marcuse 1986, 206). This dynamic is intensified by an increase in rent or cost of living, to a point where existing residents can no longer afford to live in the neighborhood (Davidson and Lees 2009; Eckerd, Kim and Campbell 2019; Marcuse 1986). Marcuse also emphasizes displacement pressures such as the loss of friends and community as changes that make neighborhoods less livable for their long-term residents (Marcuse 1986; Shaw and Hagemans 2015a). Zuk et al. (2018) created a parametrical matrix to measure displacement, including in their mapping project displacement pressures, such as increased rent and cost of living, loss of social network, or loss of cultural significance. On this basis, we believe that a majority of market-rate housing can create a tipping effect, not only due to the loss of affordable housing inventory but also due to the loss of friends and community which is an inherent part of the process. As more units convert to market rate, the socioeconomic profile of the newcomers, in terms of income and age distributions, changes accordingly, creating a new community.
Therefore, in our simulation, the concept of the tipping point is used to refer to the point at which the numbers of market-rate units exceed the number of affordable units, meaning that the number of high-income newcomers exceeds that of the lower-income exiting tenants. We argue that, from this moment on, displacement pressures such as increased rent and cost of living, loss of social network, and loss of cultural significance begin to accrue and accumulate.
The loss of privately owned, publicly subsidized rental properties, spurred a significant body of scholarship, showing that the process might lead to mortgage foreclosures, crises when financial investors shift their interests, and inherent instability of pricing once the affordability requirements expire (Aalbers and Christophers 2014; Fraser, Oakley and Bazuin 2012). In addition, some have highlighted the fact that deregulation usually harms those citizens who are most in need (Galvez and Wagner 2011; Marcuse 1986; Martin 2011; Wyly et al. 2009), and that it threatens democratic processes (Imbroscio 2016; Miraftab 2016).
Lens and Reina (2016, p. 718) pointed to a lack of research about properties leaving the subsidized housing stock and its effects on neighborhood opportunity. They used census tract-level data focused on the expiration of project-based Section 8 and LIHTC units to learn how subsidy expirations affect neighborhood opportunities for low-income households. DeFilippis and Wyly (2008) studied Project-based subsidized housing, and recipients of Housing Choice Vouchers in relation to gentrification segregation and integration. They identified upward social mobility processes for Project-based subsidized housing Ellen, Madar and Weselcouch (2015), conducted an analysis of subsidized properties in New York City and found that properties, where the owner opted out of a subsidy contract, were in higher cost and higher amenity neighborhoods than those where new and existing subsidized units were located. This means that there is an increasing concentration of subsidized units in lower opportunity neighborhoods in NYC. Reina and Begley (2014) focused on the expiration ML program and explored why property owners choose to opt out. They found that properties located in neighborhoods with high property value growth, those with for-profit owners, and those past the affordability restrictions on all subsidies, are more likely to opt out.
The scale and scope of the affordability crisis facing the residents of ML programs in NYC came to the fore in the comptroller's 2004 policy report Affordable No More and its 2006 update. Both reports document the loss of more than 36,000 units of ML housing (24 percent of the units developed) and the then future prospect of more than 40,000 units scheduled to retire their mortgages by 2015 (Thompson 2006, p. 5). This article builds on and adds to this rich literature by turning the focus on housing subsidies that have expired or will soon be expired on Roosevelt Island and by focusing on the household decision-making process.
Roosevelt Island's Publicly Funded Affordable Housing
The unique set of sociopolitical conditions that prevailed in the 1970s gave rise to an experimental masterplan for Roosevelt Island, an affordable housing project based on the philosophy of community development sponsored by the US Department of HUD and New York State's Urban Development Corporation. Planned by Johnson and Burgee, one of the city's most renowned architecture firms, the masterplan envisioned waterfront development with affordable housing for people of different income levels and age groups. The plan included two residential areas: Northtown and Southtown, separated by five parks and a town center composed of retail and office space. To build a community, the plan envisioned a mixture of middle and low-income residents, with a large proportion of multi-bedroom apartments for families with children, in addition to apartments for singles and the elderly (Johnson and Burgee 1969, 15).
To create a desirable social mix, the application assigned a specific income and age distribution to each building and referenced an estimation regarding the racial mix (Logue 1972; Table 4, Page III-13).
Several renowned architecture firms developed the four residential WIRE buildings of Northtown: Westview, Island House, Rivercross, and Eastwood (now Roosevelt Landings). These buildings were constructed in the late 1970s and provided affordable housing under the ML programs. However, due to financial difficulties, this plan never proceeded beyond the first stage, and from the late 1990s onward the new residential buildings were developed through various tax exemptions for developers.
ML affordable housing plans are limited in the number of years for which they provide protection for low-income tenants; and when the tax exemptions and other incentives expire, private investors seek to increase their profit. Today, many of the buildings that were built as affordable housing in the 1960s and 1970s are now undergoing deregulation (He 2016; Teresa 2019; Thompson 2006), including the affordable WIRE buildings. Beginning in 2006, each building has had its own plan for exiting the ML program according to its original ownership structure (rental or co-op) and income level. Gradually, the units in each building are being converted from affordable rentals to market-rate.
As of March 2020, 27 percent of the 2,141 original WIRE units have been converted to market-rate units (RIOC 2020). The process has progressed according to the discrete legal statement that “…rents will convert to market rate upon vacancy” (RIOC 2020, 1). Assuming that protected tenants, or low-income households who bought their apartments at insider prices, will not voluntarily choose to leave them, “upon vacancy” means either after they die or are forced to leave. Although existing tenants are usually protected by a new affordability plan for the next 30 years, the 30-year expiration date hangs over their heads as an accruing displacement pressure (to use Marcuse's terminology). This process of deregulation lies at the core of our simulation, which has enabled us to characterize and analyze the process and to identify its tipping point.
The Simulation Rationale and Basic Assumptions
Conducted at the disciplinary juncture of the social sciences, urban planning, and computerized models, this study employs urban historical research as a basis for microsimulation. Microsimulation facilitates the creation of computerized agents that are capable of decision-making; their assignment to specific environments; and an analysis of the relationship between changes in the environment and the agents’ reactions (Batty 2005). Although Reina and Begley (2014) focus on the owner's decision to opt-out of the ML program, we chose the microsimulation technique to emphasize the ability of the household to make choices and to address the connection between household logic and the changes in the social structure of the island.
As US affordable housing projects usually receive multiple subsidies from various sources, and as each type of subsidy carries its own terms, assessing the risk of affordability expiration requires detailed data on the specific types of subsidies it received. To compensate for this missing data, and to incorporate complexity into the model, we conducted urban research that focused on the historical and current urban development and the affordable housing planning policies that shaped it. This research was buttressed by fieldwork on Roosevelt Island, including participant observations and in-depth interviews with residents, policy makers, and real-estate agents. This preliminary study lays the foundation for building the simulation, with the aim of developing as nuanced a model as possible and reducing biases.
Aware of the complexity of affordable housing finance, we highlight that this is an experimental proof of concept based on a specific subsidy and its deregulation process. It helps show that even though our findings regarding the scope of displacement are estimations, such simulations are necessary and plausible should the right data become available.
The simulation was performed for each year between 1976 and 2070 (inclusive). It was written primarily in Python using Jupyter Notebook and Pandas as an operational and analytical library. The flowchart in Figure 2 provides details regarding the simulation inputs and outputs, which are explained further in the supplemental Technical Appendix.
The simulation combines information about the built environment and the agents, as changes to the built environment trigger decision-making by the agents. Below are the simulation's definitions and basic assumptions:
The Built Environment
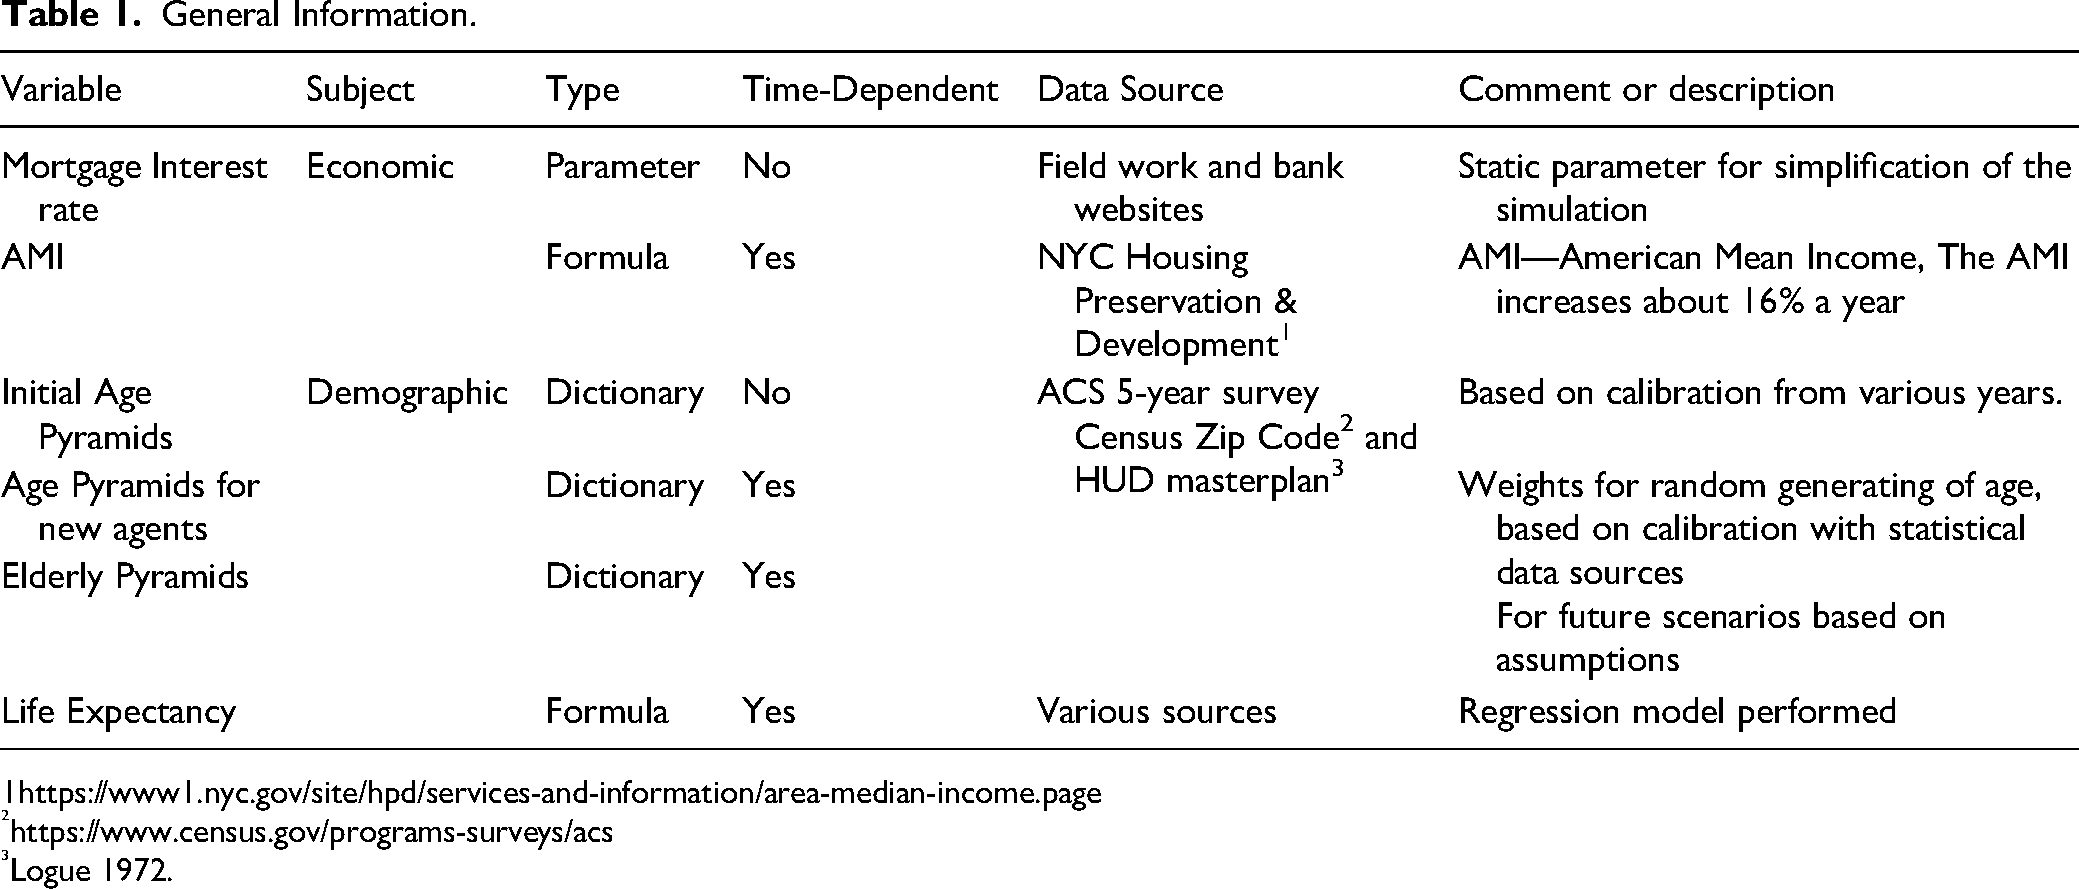
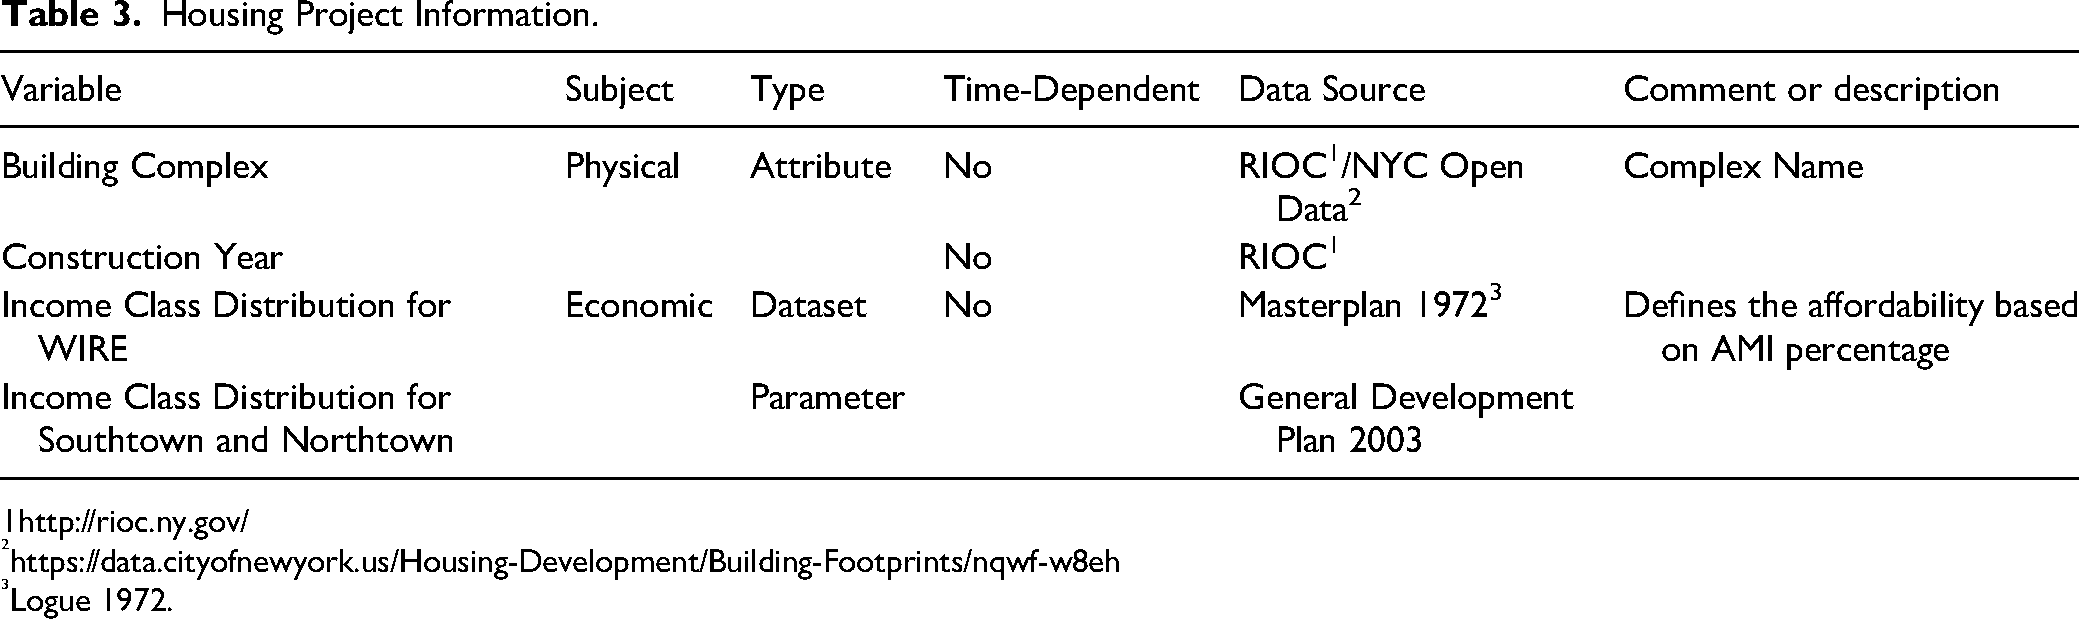
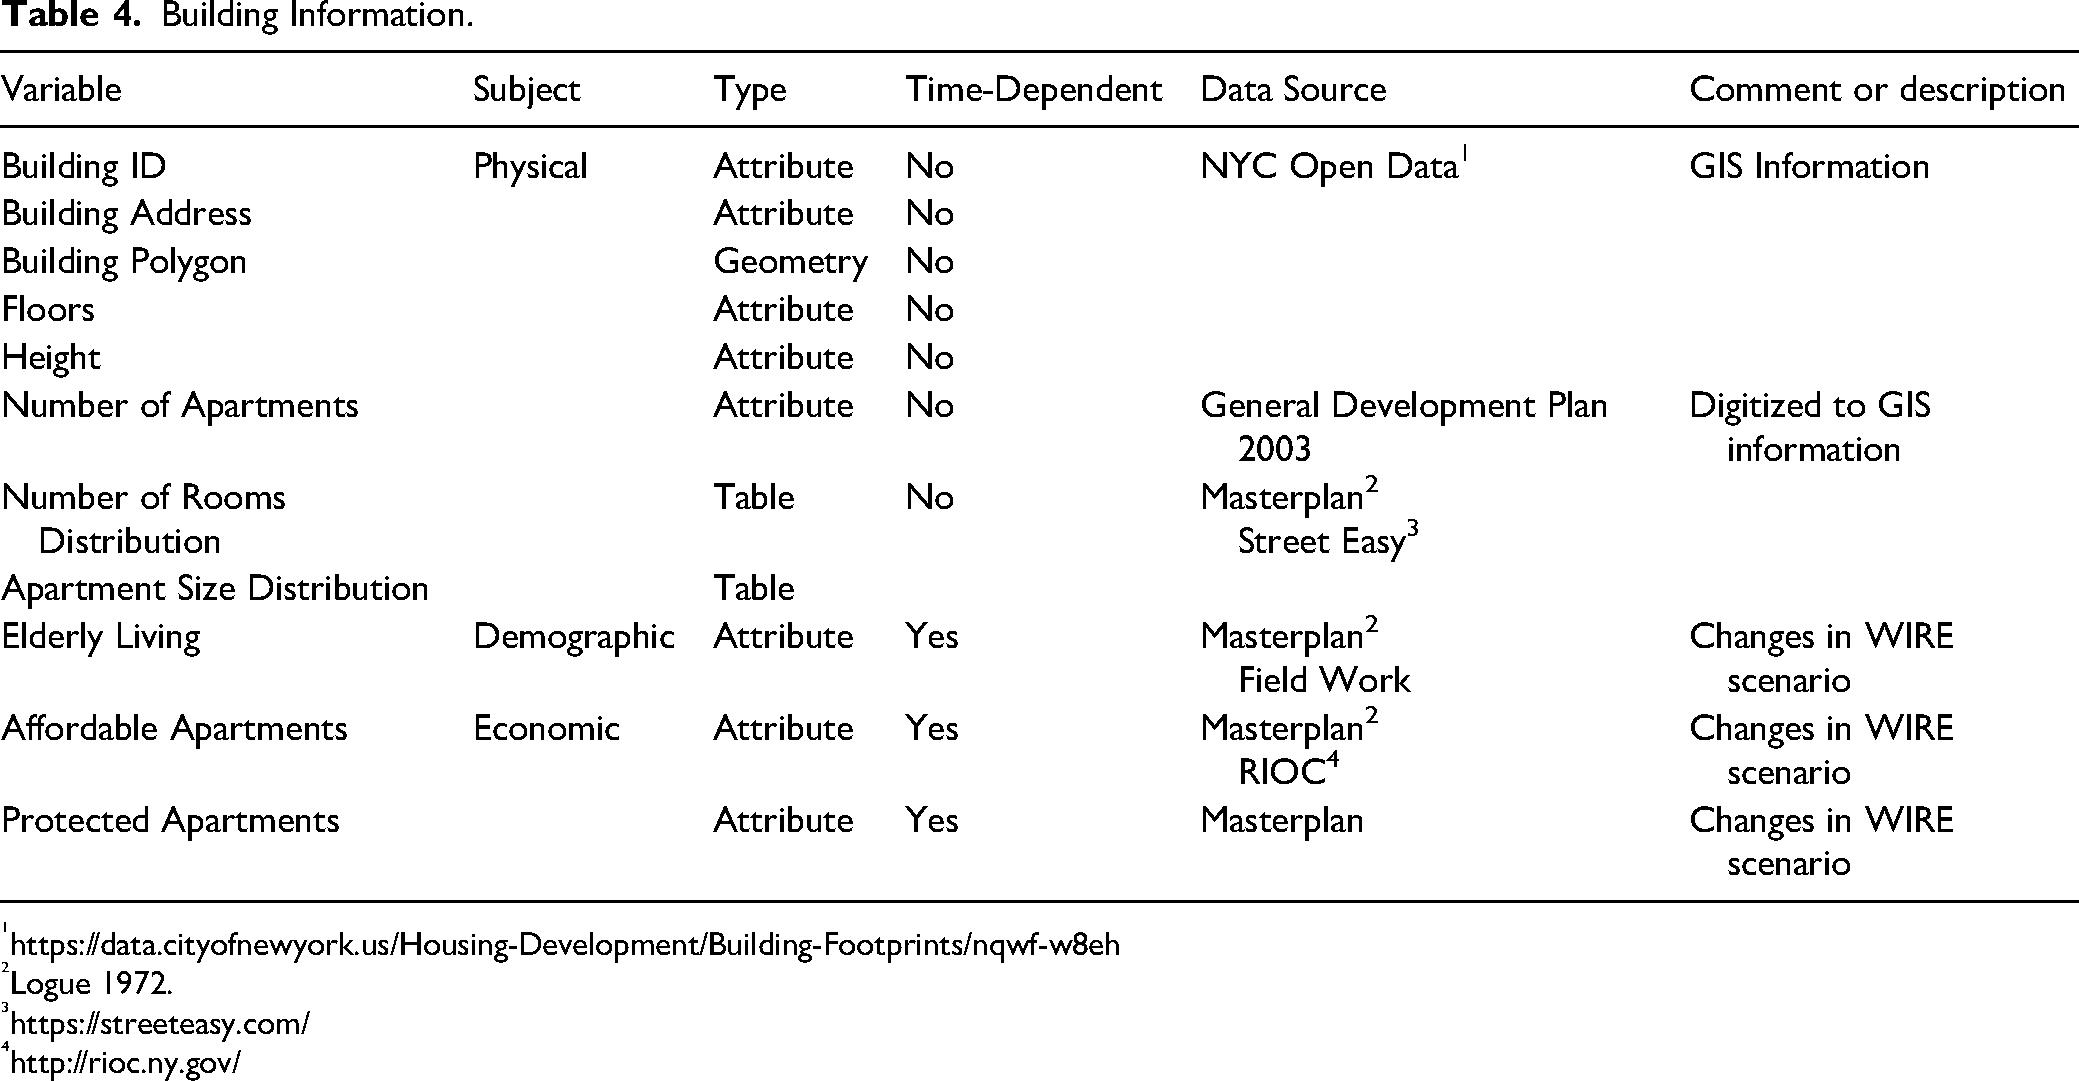
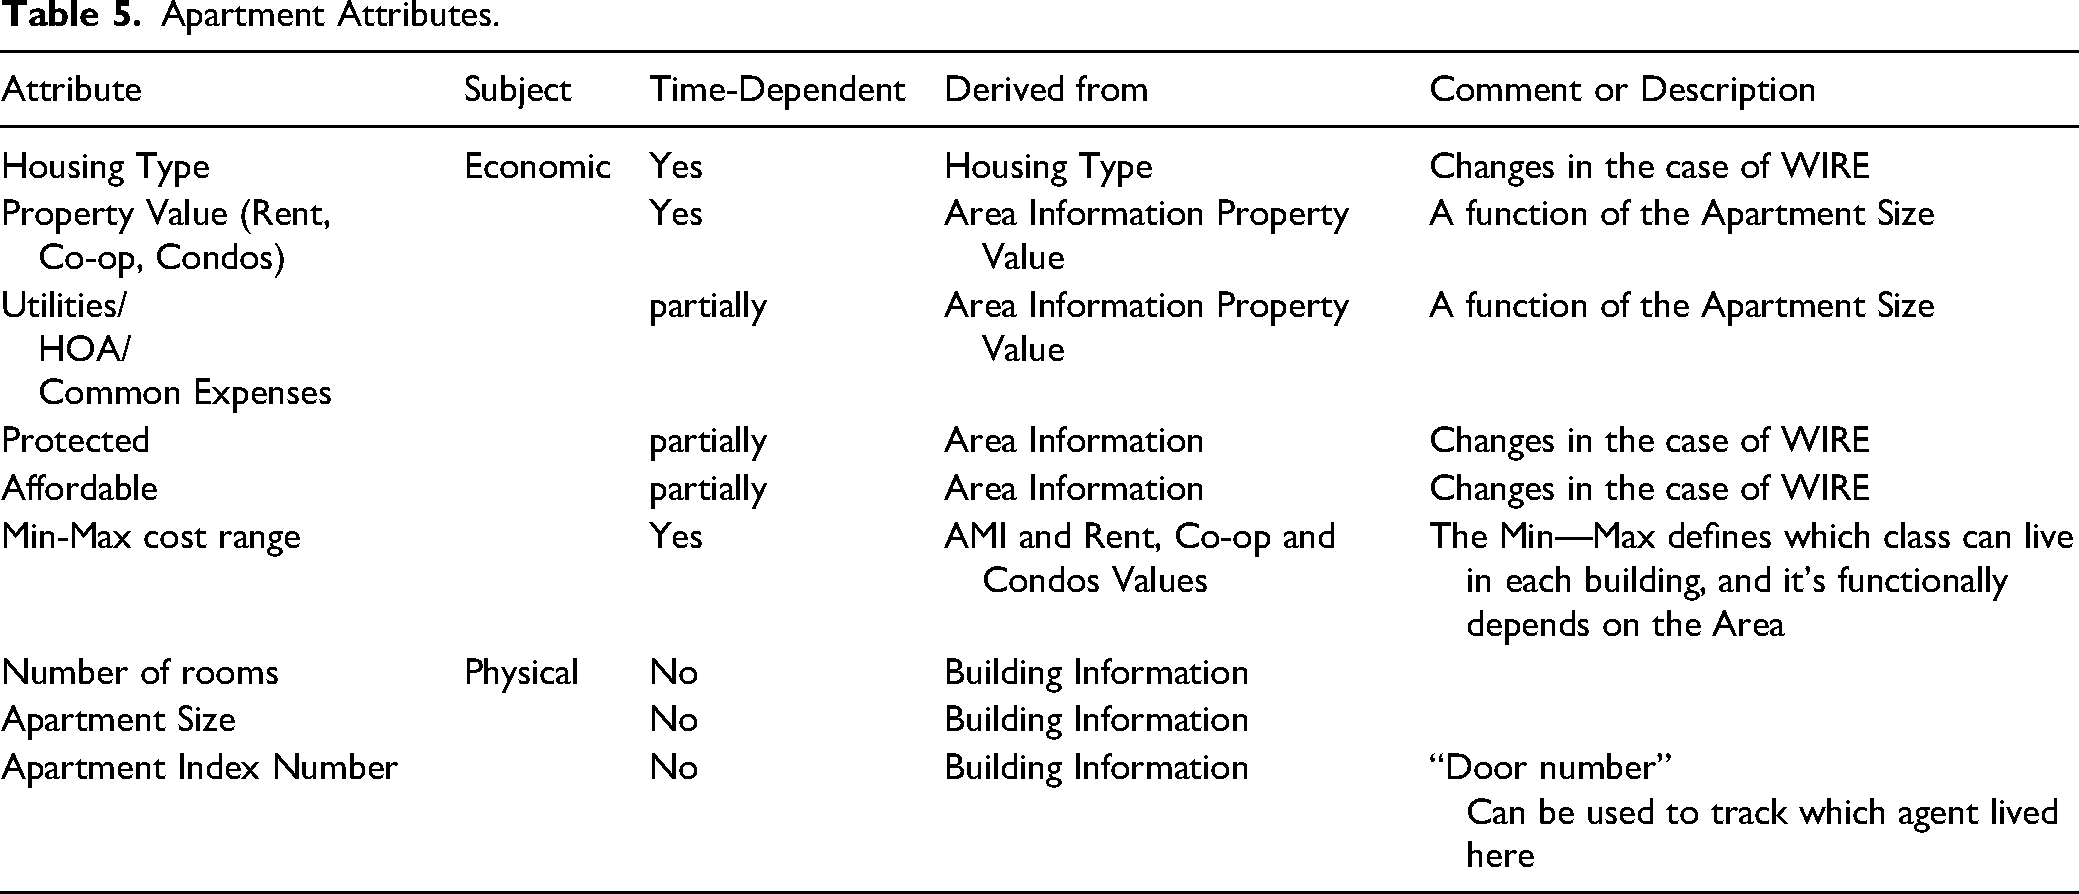
1.1 The built environment includes all the residential buildings on the island. The basic unit of analysis is the individual apartment. Apartments are then aggregated into buildings and the buildings into housing projects. All the housing projects together make up the built environment of the island. 1.2 Apartments’ attributes include size, cost, and ownership structure (condominium co-ops or rental); the attributes of cost and ownership structure may change over time. 1.3 An apartment's attributes dictate the type of agent that can enter. For more information on the built environment data sets and basic assumptions, see the article's Technical Appendix, Tables 1 through 6.
The Agents
2.1. The simulation creates syntactic agents based on the ACS aggregated to RI's zip code and assigns them to buildings based on the original income level that was designated for each building in the 1972 application to HUD. 2.2. Agents are two-person households; this was decided upon in order to simplify NYC's ratio between (AMI tenants) and family size.
3
To this end, the island's total 2020 population of 12,440 was divided by the number of existing units: 5,217. 2.3. The three types of agents were defined according to their eligibility for affordable housing: (a) tenants eligible for affordable housing in the original WIRE buildings, which are protected by the 1976 Mitchell Lama Affordability Program (hereinafter, protected tenants); (b) tenants entitled to the LIHTC programs (in the buildings that were built after 1989), according to AMI; and (c) market-rate tenants. 2.4. Protected households’ expenses include utility fees and rent. 2.5. Market-rate tenants’ expenses change along with the changes in the market in the area. They include rental and condo prices sourced from real estate websites such as StreetEasy and City Realty. To determine the annual increase, we performed a linear regression regarding other expenses such as common charges ($1.2 per square foot) and utility fees (based on a rough estimation of $3,000 per year
4
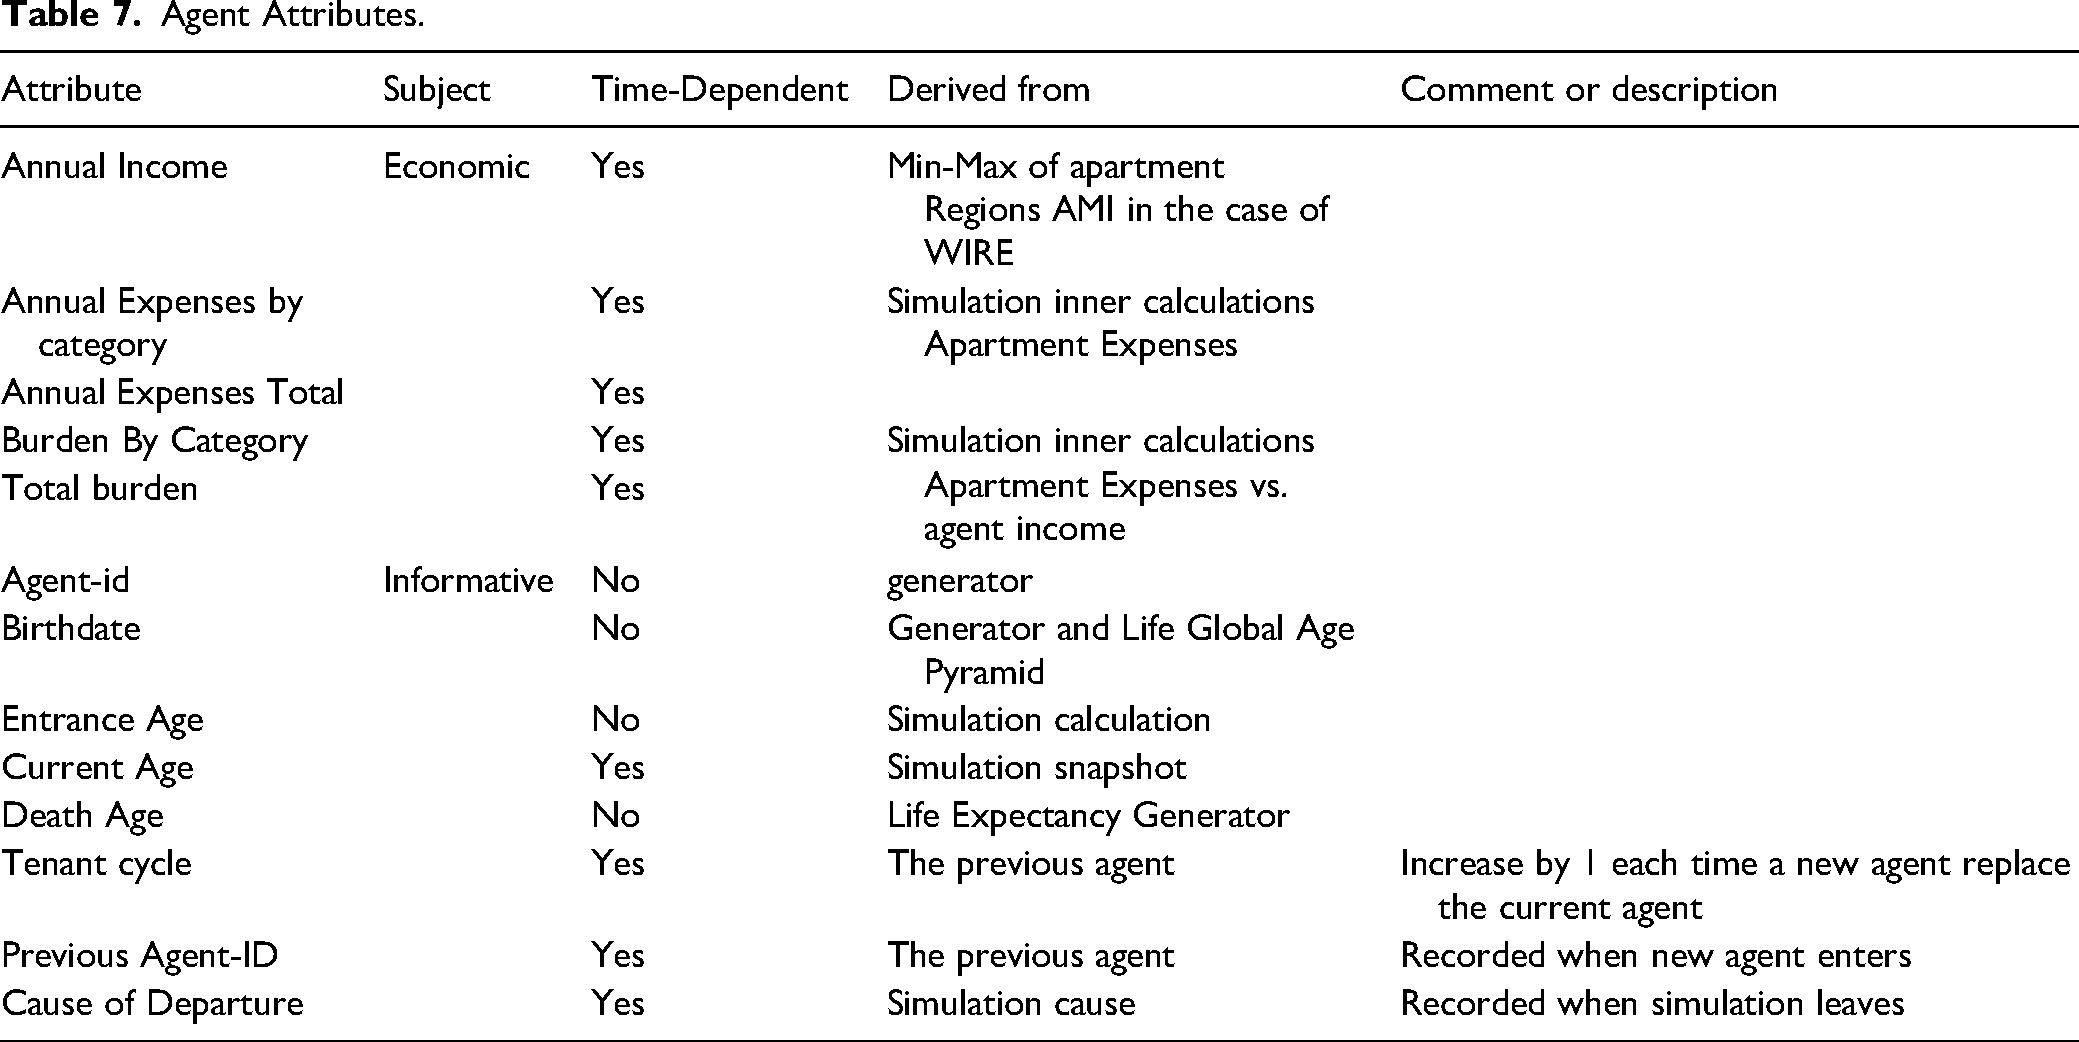
). 2.6. The agent's age is based on the Manhattan dataset for life expectancy, which indicates a linear increase since the 1900s. To generate a more realistic death rate for agents, we used a polynomial formula and added a variance of ±15 years. 2.7. The agent's income is based on the ACS, distributed among buildings according to the income range specified in the 1972 application. For more information on agents’ data sets and basic assumptions, see Technical Appendix, Table 7. 2.8 The race of agents was not factored into the simulation due to a lack of data at the level of the individual building. We regard this as a major limitation of the simulation, as racial shifts are an important factor in displacement and gentrification discourse, and we hope to include it in our future research.
The Changes to the Built Environment that Trigger Agent Decision-Making:
3.1. When a new building was added, agents decided to move into apartments according to the affordability plan, their age, and their income level (Figures 2.2, 2.5, and 2.6). 3.2. When a WIRE building signs a deregulation agreement, tenants can choose to buy in (to purchase their apartment for 65 percent of the market rate), to buy out (receive compensation for their share), to remain as protected tenants, to move out, or (if they exceed their life expectancy) to die. This happens only once during the simulation, according to the year of deregulation of each building. In our simulation, if the agent's income allows it to buy in, it will do so. If not, it will remain as a protected tenant. We also based the agents’ decision at deregulation on past Rivercross sales based on StreetEasy data. Based on these figures and on interviews, we can say that 2 percent of the protected tenants decided to buy out. 3.3. When an apartment is being converted to market rate, its rent value is determined by StreetEasy data regarding past sales in the area. We based the conversion rate of apartments on RIOC Performance Measure Reports for the years 2013–2020. 3.4. When a rental apartment is vacated, a new household can decide to move in if the rent does not exceed 30 percent of its annual income. This assumption is based on the rule of thumb of NYC landlords, who typically require prospective tenants to show documentation that their annual income is at least 40 times the monthly rent. 3.5 When a co-op or condo apartment is vacated, a new household can decide to move in if it can afford the mortgage down payment and monthly repayment, and if their maximum debt-to-income ratio is no less than 43 percent. 3.6 The income required by a new household in a co-op or condo apartment is based on the ratio of the market price in the area to the threshold for mortgage down payment and monthly repayment. For the sake of the simulation, we assumed a 25 percent down payment, a 30-year loan, and a fixed interest rate of 4.38 percent.
5
3.7. If the rent burden exceeds 30 percent of the household income, the agent will have to move out. Burden pressure is the sum of all the expenses of the agent divided by his income (this includes utilities and annual rent). 3.8. When an agent exceeds its life expectancy it dies, and the apartment becomes vacant.
For more information on agent data sets and basic assumptions, see the Technical Appendix, Table 8.
Using the simulation, we were able to produce a probabilistic population model that depicts the historical demographic changes on Roosevelt Island from 1976 through the present day and forecasts the pattern of demographic change for the half century. This provided us with insight into the island's future sociological profile and helped identify the tipping point as a specific point in time.
Research Results: Using the Simulation to Reflect Probabilistic Demographic Change on Different Urban Scales
The simulation produced interactive timeline graphs that trace the rate of conversion from affordable units (blue line) to market-rate units (red line). It also produced sunburst charts analyzing the expected demographic changes for each year. To highlight the logic of the simulation, we emphasize five specific moments in time: (1) the simulation's starting point, when the original WIRE buildings were built; (2) the year of deregulation for each building; (3) the present, as a validation point to which we can compare the simulation's progress to the RIOC report from 2020; (4) the tipping point, at which the proportion of affordable units to market-rate units flips (reflecting that from that point on, the building will have more market-rate apartments than affordable ones), which, based on the literature, we view not only as a numerical change but also as a moment of increased displacement pressure stemming from increases in rent and living expenses and a loss of social network and sense of place; and (5) the expiration date, 30 years after deregulation.
The Island Scale: A Younger and Wealthier Population
Following the simulation trajectory on the island scale enables us to recount its history, to verify the accuracy of the simulation up to 2020, and to contemplate future scenarios. The conversion-rate-timeline graph in Figure 3 reflects the island's development process, which started with the four WIRE buildings in 1976 (3.1). At this stage of the Community Development phase, the housing that was built consisted entirely of affordable units for different income levels. At the time, the island's population was largely younger than the age of 65 and had middle-moderate or low income, and 5 percent of the households were occupied by the elderly (aged 65–85). Figure 3.2 refers to the beginning of the second phase of market-led development: Manhattan Park was built in 1989 as a five-building complex of luxury rental apartment with 20 percent affordable units (80/20 plan). This addition changed the supply of apartments on the island to 70 percent affordable units for diverse age groups and income brackets, and 30 percent market-rate units primarily for middle-income under-65 households. In 2004, a three-building complex kicked off the development of Southtown (Figure 3.3), and this process continued in 2007 with another three-building complex; both operated according to a 60/40 affordability plan. At about the same time, at the northern end of the island, the former asylum re-opened as The Octagon, a luxury apartment complex with an 80/20 affordability plan. These three housing projects (Figure 3.4) tipped the balance between affordable and market-rate units. The sunburst chart for 2009 offers a demographic snapshot of this tipping point, showing that affordable housing still encompasses a diversity of income levels and age groups, with a gradually aging population. The market-rate units were occupied by middle-to-upper income households from the younger age groups through a process that occurred between 2016 and 2019, with the addition of two new buildings to Southtown. Overall, then, we can say that Roosevelt Island was largely affordable for the first two decades, but with the addition of Southtown at the beginning of the new millennium, the population began to shift. The tipping point, which was reached in 2009, also marked the onset of displacement pressure accrual.
Our validation point yielded results similar to those of the 2020 ACS and RIOC reports. This was also our point of departure for digitizing and parametrizing the history, and for proceeding to prediction. When we use the simulation to take a glimpse into the future, we see that by 2040, 70 percent of the units on the island will have been converted to market rate (Figure 3.6), and that by 2060, the market-rate-to-affordable ratio will be 80:20 (Figure 3.7). The demographic sunburst charts show a process of change from a diversity of age groups and income levels to much greater homogeneity. This is reflected more explicitly in the future income level, which shifts to 85 percent high income, 15 percent middle income, and no low income. The age distribution shows that from a community of relatively young (aged 18–44) households, Roosevelt Island is gradually becoming a community with a majority of older (aged 44–85) households. The age groups remain somewhat diverse, but while the majority of market-rate apartments are occupied by younger households (aged 18–65), the majority of affordable units are occupied by over-65 households.
Stated simply, the residents of the market-rate units are gradually becoming younger and wealthier, whereas the residents of affordable units are becoming older and poorer. Moreover, as the island already reached its tipping point in 2009, we can assume that at this point, 13 years into this conversion process, the displacement pressures are peaking. For a clearer and more in-depth view of these pressures, and to understand their origins and their anticipated demographic impact, we offer the following more granular assessment at the housing project scale.
The Housing Project Scale: Deregulation Will Affect Low-Income Projects First
A closer look at the four WIRE buildings is facilitated by Figure 4, Graph 4a, which presents the conversion rate of each of the buildings relative to the others, reflecting a clear and common trend away from 100 percent affordable units toward an increasing percentage of market-rate units. This assessment is enhanced by Figure 4b, which displays the cumulative demographic changes in the four buildings and predicts that, by 2032, the number of market-rate apartments in the WIRE complex will exceed that of affordable apartments, signifying the tipping point for the complex (Figure 4.5). By 2040, 65 percent of the units will have been converted to market-rate, and by 2060 this figure will increase to 85 percent.
There will also be constant change in the socioeconomic profile, with the market-rate units being occupied by younger age groups with higher income, and the affordable units being occupied by older age groups with moderate-to-low income. The percentage of elderly residents over the age of 85 will continue to increase in both unit types, and new households of 18–44-year-olds will be added to the market rate units in constantly increasing numbers. This trend will continue to increase until 2070 when the affordable housing units will house only elderly households with residents aged 65 and older. Another trend highlighted by this graph is the reduction in low-income households; by 2040, only 3 percent of the low-income households in the WIRE buildings will remain; by 2050, the remaining 1 percent of low-income residents will be over the age of 85; and by 2060, the low-income residents will have completely disappeared.
Returning to the comparison among the four buildings in Graph 4a, we learn more about the rate of conversion of each of the buildings relative to others. Specifically, we note that although the buildings were constructed at the same time, the year of deregulation was different for each, resulting in chronological gaps between their tipping points. This compression clearly shows that in Roosevelt Landings, the low-income housing will reach its tipping point as early as 2022, and the others will gradually follow. However, because Roosevelt Landings has almost the same number of units as the other three buildings combined and a larger number of low-income residents, its flip—though the first among the buildings—will tip the percentage of affordable housing within the project as a whole.
The Building Scale: Individual Deregulation Agreements and Similar Demographic Changes
The main limitation of most computerized, data-driven maps and simulations is that they produce information at the census-tract level, which tends to flatten the differences in small-scale urban development. The ability to observe urban changes on the scale of the individual building is a unique contribution of our simulation that facilitates a deeper understanding of demographic changes.
Roosevelt Landings began with 1,003 affordable rental units (including 400 low-income units, 300 of which were for elderly low-income residents, and 600 moderate-income units). This building was the first to exit the ML program in 2006 (Figure 5.2), and since then its ownership has changed hands several times. 6 The latest sale commenced in 2019, when the new owner committed to maintaining 67 percent affordable housing units. 7 Our validation line (Figure 5.3) shows that by 2020, 43 percent of the units were converted to market rate. Figure 5.4 indicates that the tipping point for Roosevelt Landings will be reached in 2022. Moving forward in time (Figure 5.5) reveals an affordability expiration date of 2036, or 30 years after the project exited the ML Program.
The corresponding sunburst chart shows that at the beginning of the process, the affordable units were occupied by representatives of all four age groups, with a majority of moderate and low-income residents over the age of 65. The market-rate units housed a majority of higher-income households under the age of 65. As the number of affordable units decreases, the socioeconomic ratio of the households in each unit type remains the same. The tipping point in 2022 precedes the expiration date by seven years, meaning that from that year on, residents will experience growing displacement pressures. Upon expiration, 75 percent of the units will convert to market rate and continue to house an increasing percentage of younger age groups and upper-income brackets. At this stage, 35 percent of the building's residents will still be protected tenants at risk of displacement, with 69 percent over the age of 65 and 23 percent over the age of 85. Fourteen percent of them will be low-income.
Island House was built as a rental building designated for households with upper-middle income. In 2012, the buildings exited the ML program under a 30-year affordability plan. The new plan changed the ownership structure to a combination of condominiums and cooperative ownership, ensuring that at least 65 percent of the units would be sold as affordable co-ops or remain affordable rentals. Our validation line (Figure 6.3) shows that in 2020, 18 percent of the units converted to market rate. The tipping point (Figure 6.4) will be reached in 2035 (Figure 6.5), and the expiration date is planned for 2042. At that point, 63 percent of the units will be converted to market-rate.
The corresponding sunburst chart for the beginning of the process reflects a similar age composition in both the affordable and the market-rate units: a majority of under-65 households, with middle-to-moderate income households in the affordable units and upper-income households in the market-rate units. Upon expiration, 37 percent of residents will still be protected tenants at risk of displacement, and most will be middle-income households over the age of 65.
Rivercross was built as an affordable co-op for upper-income households that are protected under the ML affordability plan. It embarked upon deregulation in 2014 (Figure 7.2), and by 2020 15 percent of its units had been converted to market rate. Rivercross will reach its tipping point (Figure 7.3) in 2036, and 2044 will mark the 30th anniversary of its deregulation. At that point, Rivercross will consist of 64 percent market-rate units and 36 percent affordable units.
The sunburst chart shows that at the beginning of the process, the affordable units housed three age groups with middle-to-moderate income and the market-rate units were occupied by under-65 households, primarily with middle-to-upper income. During deregulation, the affordable units will come to house an over 65-year-old population with middle to moderate income, whereas the market-rate units will continue to house an under 65, high-income population. For Rivercross tenants who bought-in before deregulation, the good news is that since they are shareholders, there is no expiration date. However, our simulation, which traces the tipping point, shows that beginning in 2036, 46 percent of original tenants who still occupy their apartments will start to experience displacement pressures. As maintenance fees and cost of living continue to increase alongside the cumulative loss of social networks and cultural significance, these displacement pressures will be further accentuated by the fact that only 34 percent will remain by 2044, and that 65 percent of them will be over the age of 65 and 17 percent will be over 85.
Westview started as a rental building for low-to-moderate income households and was privatized in 2018. The alternative affordability plan stipulates that for the next 30 years, at least 55 percent of the units will be either affordable cooperative apartments with limited prices or affordable rental units. Our validation line (Figure 8.3) shows that, in 2020, all the units should have still been affordable, with 77 percent of the households consisting of middle-income older residents. In the case of Westview, the tipping point and the affordability expiration date are expected to occur at approximately the same time, in 2049 (Figures 8.4 and 8.5). As in the case of other buildings, throughout this process, the market-rate units will house younger households with higher income, and the affordable units will consist of middle-to-moderate income residents from older age groups. Westview, however, is unique in that, at expiration, the building will still consist of 50 percent affordable units, with 55 percent of these units housing over-65 households and 11 percent of them housing over-85 households with middle income.
Discussion: Toward an Urban Management Tool for Predicting Demographic Change
This study defined, measured, and modeled the demographic changes on Roosevelt Island by considering the interplay between gentrification and displacement. In this way, it contextualized the deregulation of affordable housing within a discourse of gentrification and displacement. Our microsimulation, which traces the deregulation process and offers a plausible prediction of what the future might hold for the island, defined the nature of this demographic shift.
We showed that although the buildings will not be immediately demolished, they will be undermined by deregulation plans. The quiet and gradual process we have described makes no change to the physical structure of the city; it does, however, bring about an immense change in social structure.
The present study makes an important theoretical contribution by illuminating the deregulation process and contextualizing it within the discourse of gentrification and displacement. Using this additional theoretical layer, we developed terminology for observing displacement and gentrification as a multigenerational cycle. Within this cycle, deregulation is a slow and gradual force that may result in massive demographic shifts. The tipping point marks the moment at which the number of market-rate units exceeds the number of affordable units. From this moment on, displacement pressures begin to accrue, as the long-term protected tenants are exceeded in number by the newcomers, adding to the loss of friends and community (Davidson and Lees 2009; Eckerd, Kim and Campbell 2019; Marcuse 1986).
On the methodological level, this study contributes to the growing field of digitization, parametrization, and modeling of displacement and gentrification. The development of our simulation was inspired by the efforts of leading scholars in the field and addressed limitations they noted. For example, both Boeing's (2017) simulation of gentrification and Eckerd, Kim and Campbell (2019) simulation of displacement constructed an abstract environment and used fictitious data. Their work encouraged us to base our simulation on a real case study, including the cultural and social aspects of the specific location. Moreover, Chapple, Waddell and Loukaitou-sideris (2017) extensive displacement project highlights that one of the study's main limitations is the fact that it is based on data from the census tract level, which tends to flatten nuances. Their observation challenged us to develop a simulation that descends to the scale of the individual building. On this basis, the simulation's methodological contribution lies in its ability to empirically predict a demographic change based on real socioeconomic data in the context of a specific place, to the level of the individual building.
Limitations
These contributions also highlight the limitations of our simulation; to become a real predictive tool, it needs to follow each project's specific subsidies and affordability plan and be based on building-level data which is frequently confidential. To isolate one parameter and discuss it thoroughly, the simulation is based on a specific subsidy and its deregulation process, and on one building and the duplications of its roles. Furthermore, we focused only on the residential built environment. This intent decision enabled us to investigate the impact of deregulation on gentrification and displacement. The downside is that by doing so, we disregard some complex interdynamics and mechanics of gentrification and displacement. We highlight here that urban processes, especially demographic shifts, are rarely a “but for” issue. There is usually more than one reason for those slow and long-lasting processes, and they cannot solely be attributed to deregulation. The demographic shifts we simulated are also related to city-scale processes, such as mayor Bloomberg's 2007 plan to diversify and decentralize NYC, and the establishment of Cornell Tech as an academic anchor (Addie 2019), and more. We acknowledge this limitation and hope that future research will enable us to add complexity and control over the impacts of other changes in the built environment. This experimental proof of concept can pave the way for more complex simulations in the future. For example, further research is needed to have better, nuanced simulations that control other channels of gentrification and displacement such as policy interventions, changes in job markets and industries, and even fundamental shifts in individual households’ preferences or lifestyle. Future simulations should also address more thoroughly the race of agents which is a major issue in gentrification. One source that might help in identifying the racial mix of the population at the individual building level is the HMDA data (Home Mortgage Disclosure Act).
Another challenge we encountered was acquiring reliable data regarding the level of the individual building. To meet this challenge, we used census data and divide it into buildings, and based our assumptions on deregulation agreements and on interviews with policy-makers. We believe that this limitation can be resolved by policy makers’ and urban officials’ greater access to more granulated data.
Another limitation of the study is its use of only one future scenario—that of “business as usual.” Its continued development as a data-driven tool should proceed in a manner that enables practitioners to input different starting points and different assumptions, and thereby to explore different scenarios.
Significance
The significance of such simulations is its capacity to evolve into a data-driven tool to predict urban demographic changes. Each figure in the results section may be viewed as a dashboard with visual data which, through the simulation, is inextricably linked to social data. 8
Ultimately this tool can enable urban management to better control expected demographic changes, in order to balance the interplay between gentrification and displacement and to produce policies that prevent the displacement of weak social groups. Moreover, the use of this kind of simulation by residents themselves can provide them with the knowledge they need to protect their standing and prepare for the future.
The fact that the simulation highlights the elderly and the low-income socioeconomic profile of those who will be forced to leave, and the fact that the percentage of the over-85 elderly population continues to increase in both market-rate and affordable units, is indicative of global trends of increasing life expectancy and the aging of the population, specifically in cities (WHO Report on Ageing). This calls for future research to focus on the elderly population and the way it is impacted by these deregulation processes.
The present study characterizes deregulation as a force that quietly and gradually engenders massive social change. In contrast to urban renewal, it is not a new structure that emerges out of the ruins but rather a new social structure. In a manner similar to how the lessons from urban renewal led to visionary community development policies, revealing the social effects of this quiet process of deregulation should also result in some lessons. Although the private market's integration into the urban field allowed these projects to exist in the 1990s, their expiration date leaves responsibility for the protected tenants in the hands of the private market. To reduce inequality the challenge of cities today is to find the right balance between private and public initiatives. This is the task of planners at the present time: to predict and identify tipping points and to evaluate their planning accordingly.
Conclusions
In this study, we asked how the demographics of a neighborhood might change as a result of the deregulation of affordable housing, and we developed a microsimulation to answer this question. Empirically, the simulation predicts a demographic change based on real socioeconomic data in the context of a specific place, down to the level of the individual building. We conclude by framing this process within the discourse of gentrification and displacement and offering an account of the unique pace and implications of deregulation on Roosevelt Island.
The simulation indicated that on the scale of the island as a whole, we are witnessing a major shift from 100 percent affordable units to 80 percent market-rate units and 20 percent affordable. This change is somewhat reflective of the shift in affordable housing policies from the community development of the 1970s to the market-led of the new millennium, as reflected in Mayor Bloomberg's policy of 80/20 developments. The demographic implications of this shift are that the island's population is becoming younger and wealthier. The socioeconomic profile of households is changing, with the market-rate units housing younger age groups with high income and the affordable units housing older residents with low-to-moderate income. Roosevelt Island, then, is in the midst of gentrification, and the simulation shows a continuum of this trend.
Although some researchers argue that gentrification can occur without displacement (Hamnett and Whitelegg 2007; Shaw and Hagemans 2015b) and that existing communities may experience advancement during gentrification (Card, Mas and Rothstein 2008), we saw that on Roosevelt Island, the percentage of the over-85 elderly population continues to increase among the residents of both unit types, with younger (18–44) households moving into the market-rate units alone, and at an increasing rate. Put simply, while the residents of the market-rate units are gradually becoming younger and wealthier, the residents of affordable units are becoming older and poorer, indicating mounting inequality and polarization. Moreover, by identifying the tipping point of the island, the simulation clearly highlighted and quantified an abstract phenomenon we learned about during the interviews: the fact that the island's low-income residents have already begun experiencing displacement pressures.
The simulation focused on the socioeconomic profile of those who will be forced to leave on expiration day—from the WIRE buildings in particular—down to the scale of the individual building. On the scale of the WIRE project, the simulation indicated that the changes will first affect the low-income building. Indeed, as early as 2036, the remaining 35 percent of protected tenants at Roosevelt Landings will be forced to leave, with 69 percent over the age of 65 and 23 percent over the age of 85. Fourteen percent of this population will consist of low-income households (Figure 5.5). Observing the population of each building individually revealed similar outcomes but a bit further along in time. Island House will follow in 2042 when the remaining 37 percent of protected tenants will be compelled to leave. Most of this group will be over 65, with 11–17 percent over the age of 85. Rivercross will follow, and, lastly, Westview. These findings highlight the fact that on the expiration date, each of the buildings will still house a fair number of protected tenants, consisting largely of the low-income elderly. Acknowledging the limitations of our simulation, which merely scratches the surface of the complexity of affordable housing, we stress that it also serves as proof of concept that this kind of simulation is needed and plausible.
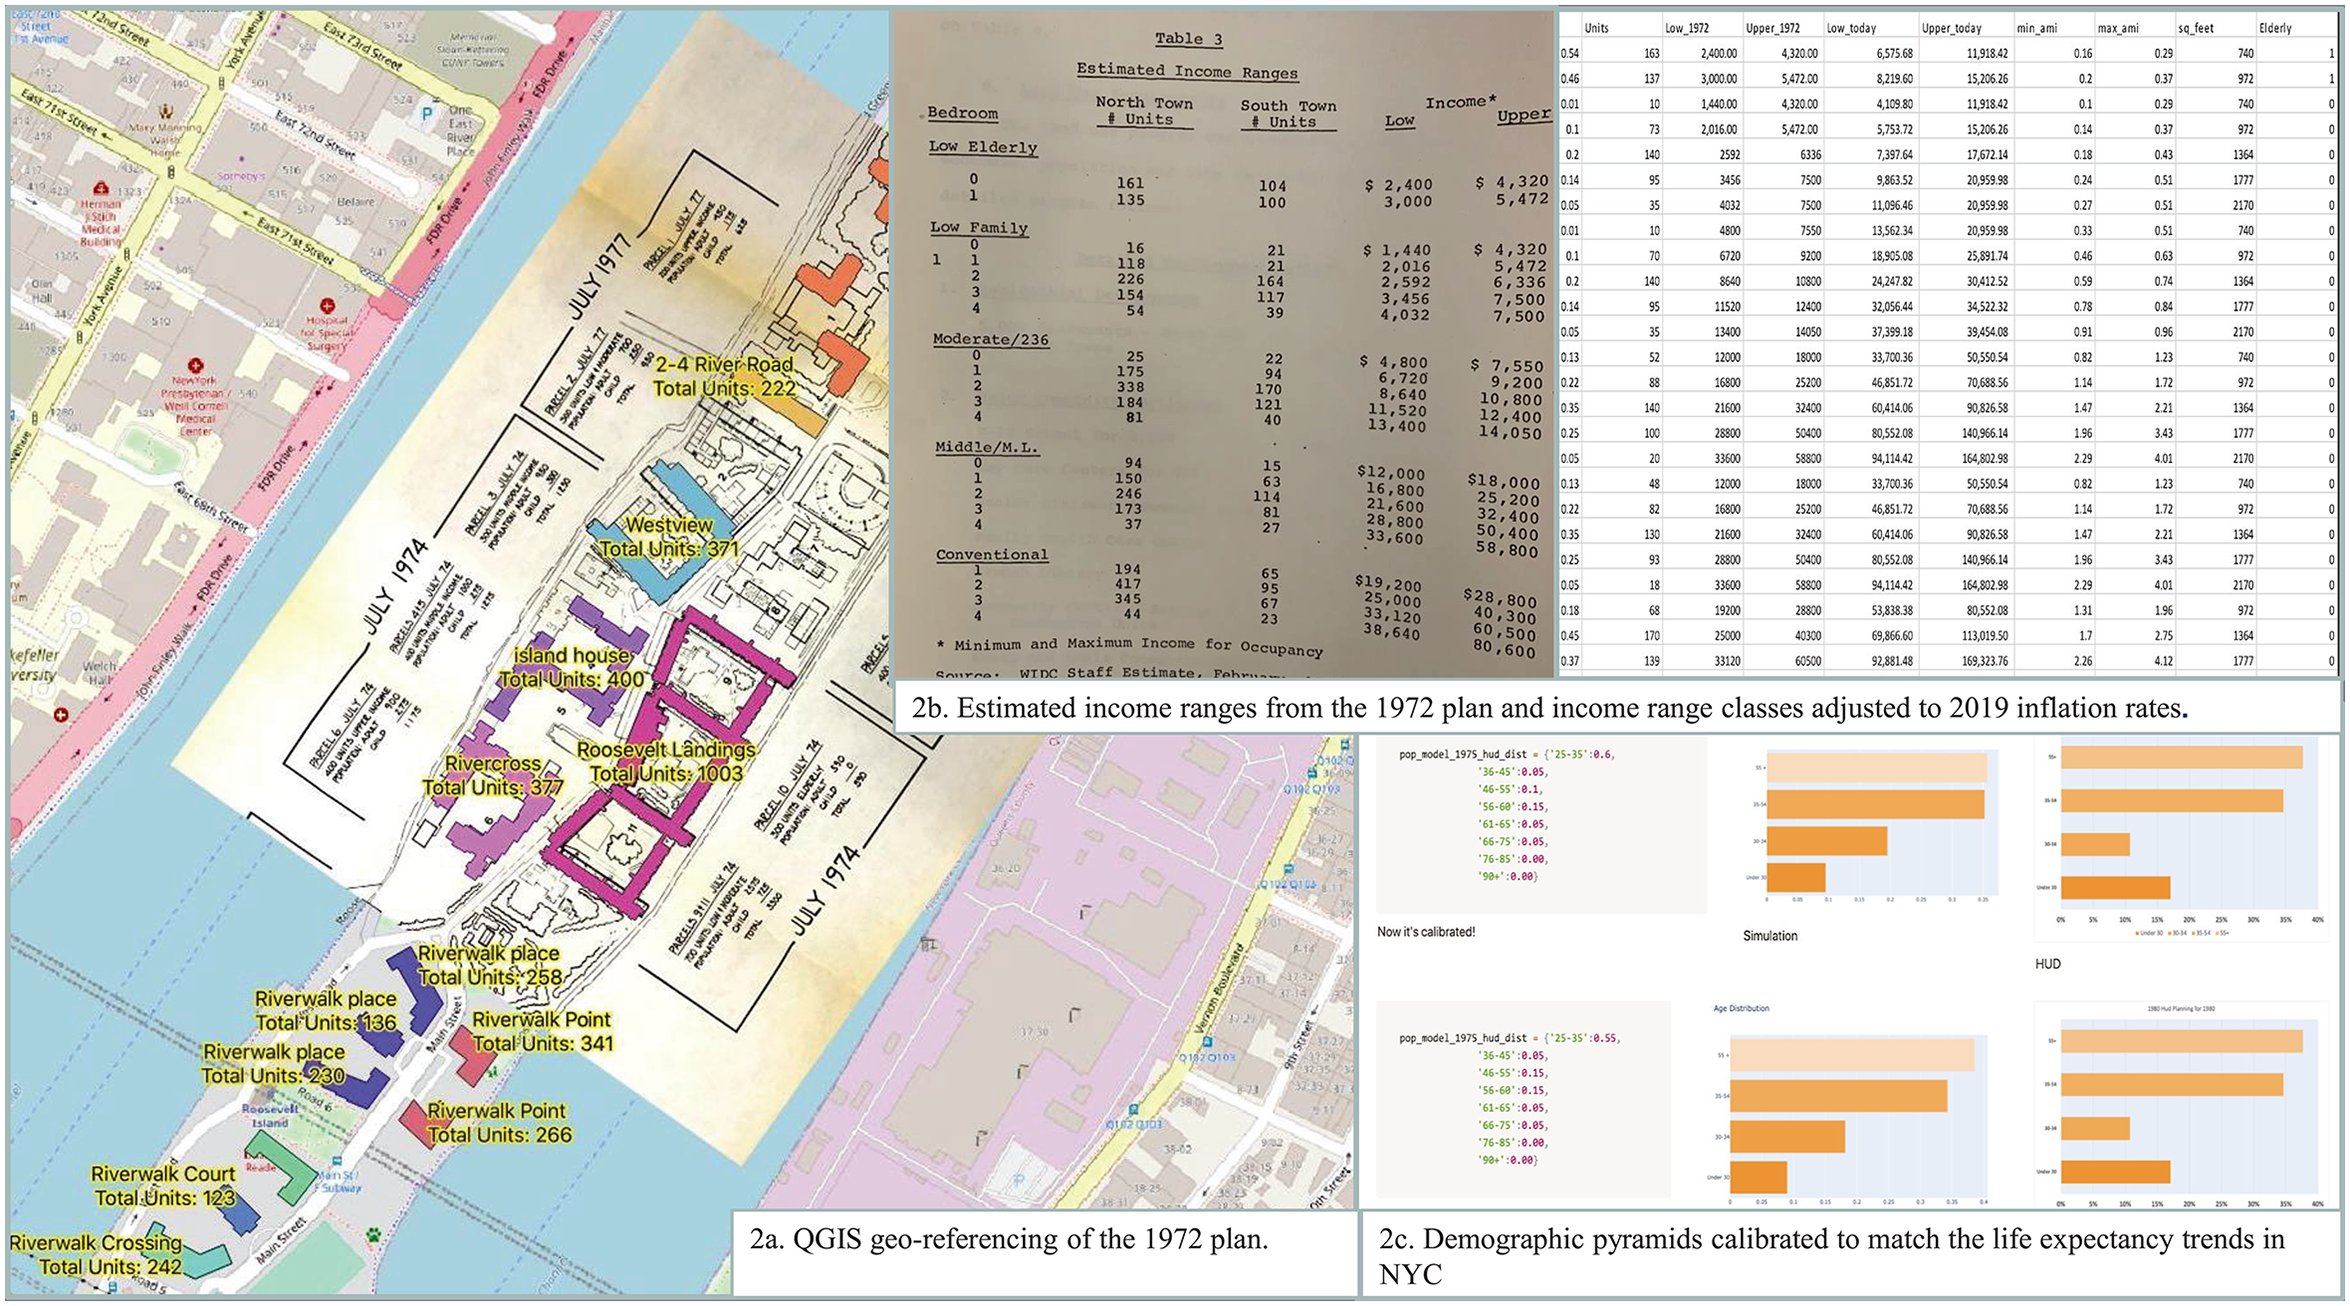
The microsimulation inputs and outputs.

The Island Scale: The history of the island through the eyes of the simulation.
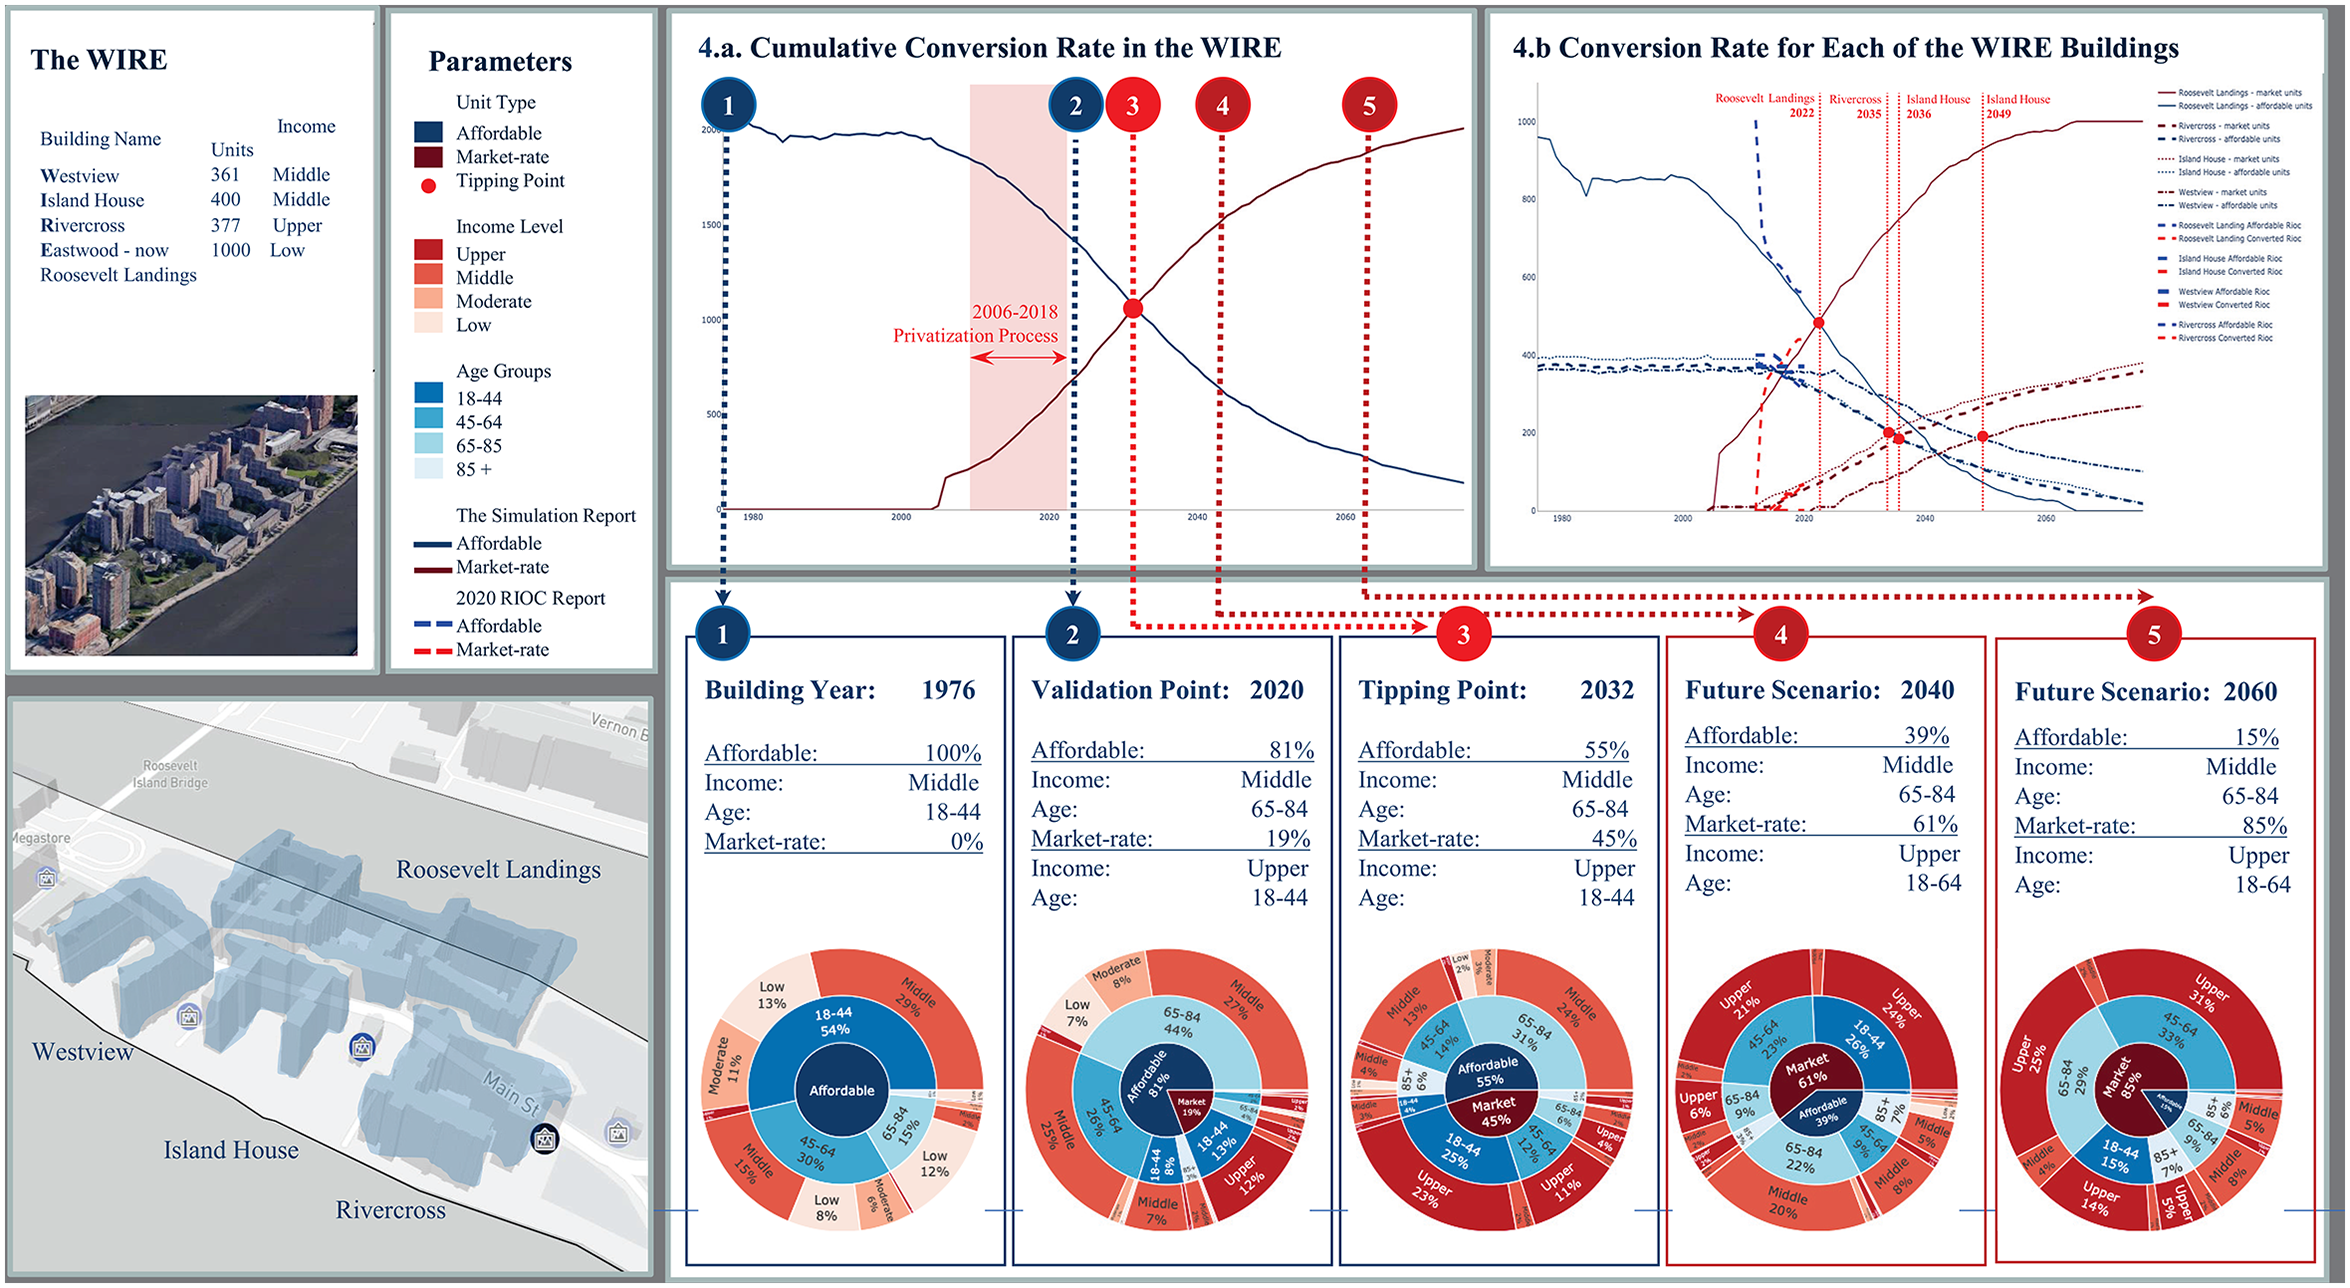
The Housing project scale—The WIRE complex deregulation.

Roosevelt Landings deregulation process.

Island House deregulation process.
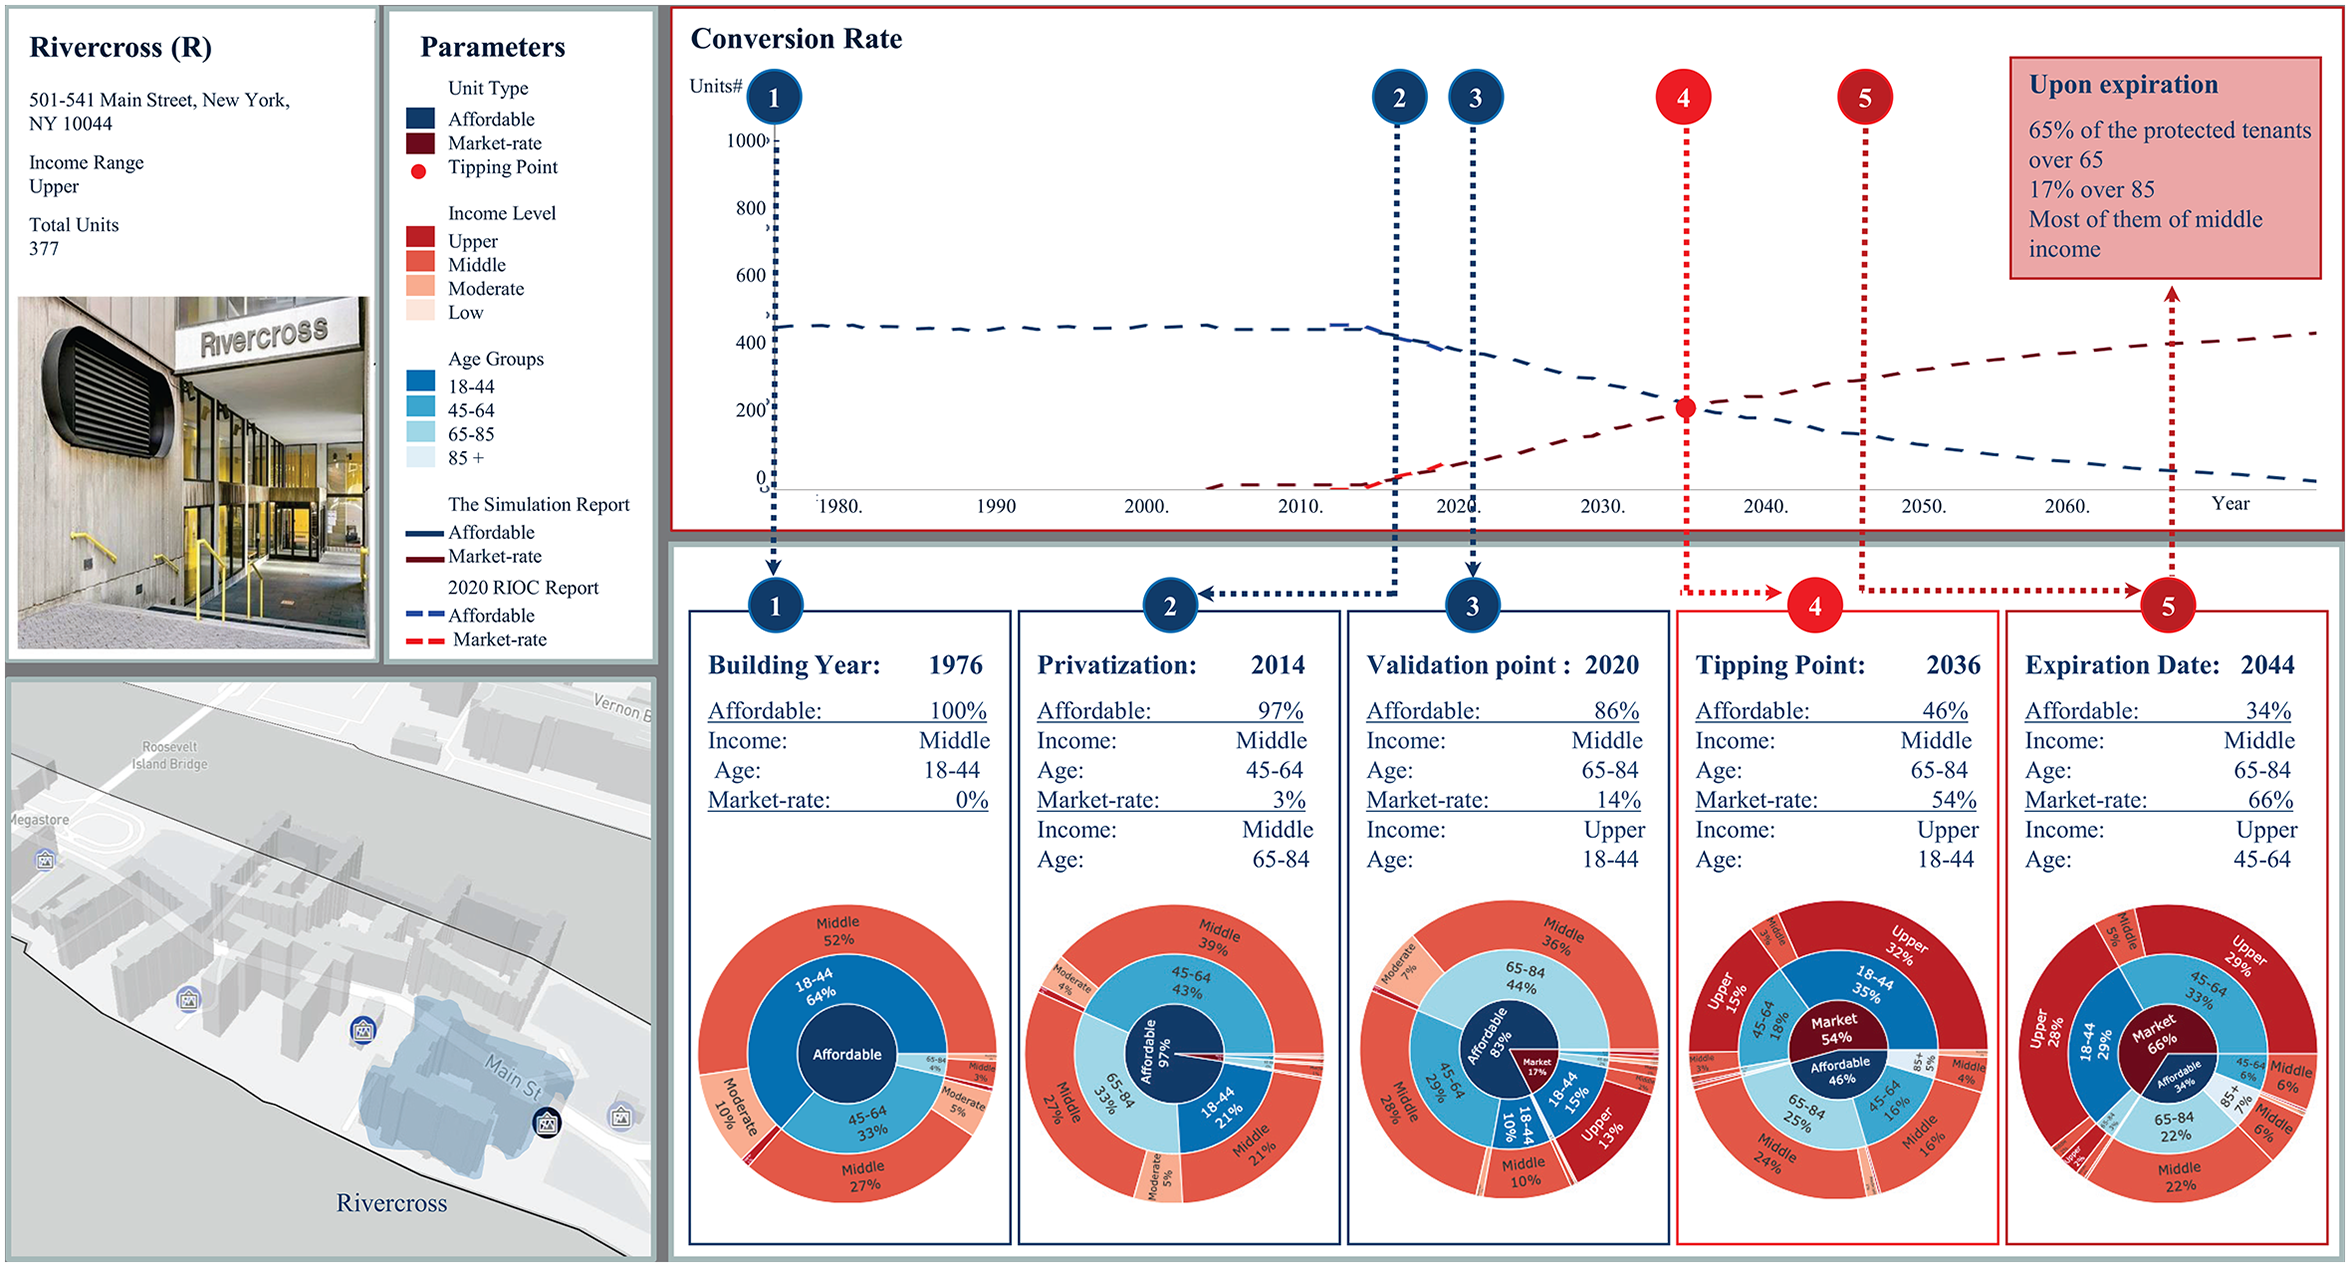
Rivercross deregulation process.
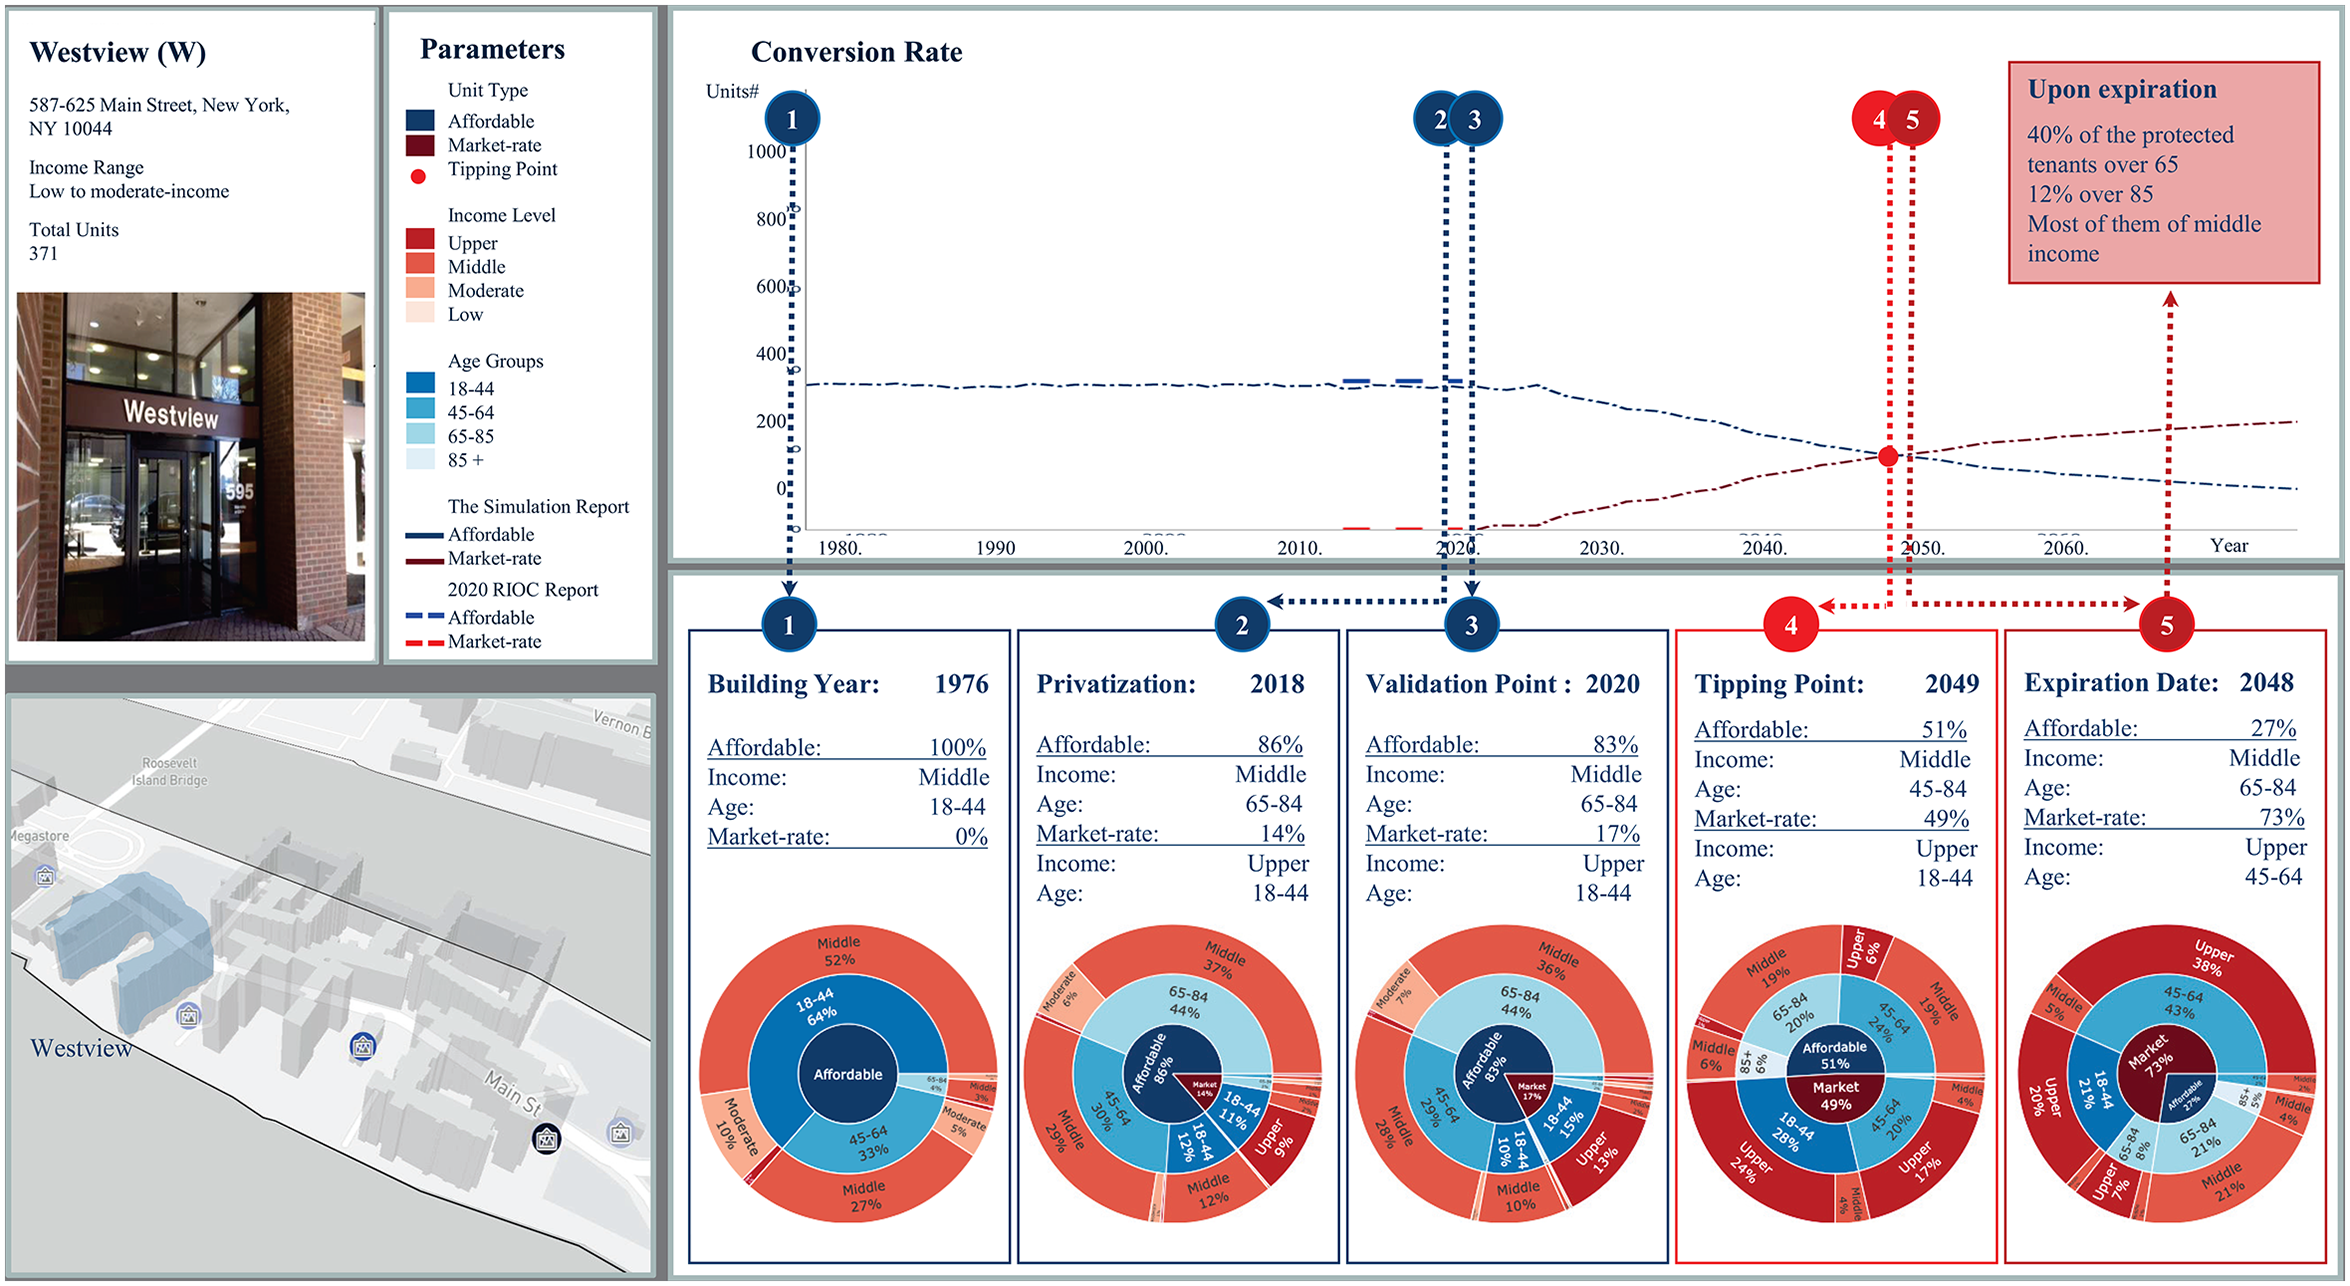
Westview deregulation process.
General Information.
Roosevelt Island Information.

Housing Project Information.
Building Information.
Apartment Attributes.
Apartments Economic Parameters.

Agent Attributes.
Agent Action.

Supplemental Material
sj-docx-1-uar-10.1177_10780874231169213 - Supplemental material for Affordability with an Expiration Date: A Microsimulation for Estimating the Demographic Changes Caused by Deregulation of Assisted Housing
Supplemental material, sj-docx-1-uar-10.1177_10780874231169213 for Affordability with an Expiration Date: A Microsimulation for Estimating the Demographic Changes Caused by Deregulation of Assisted Housing by Sharon Yavo-Ayalon, Daphna Levine, Shai Sussman and Meirav Aharon Gutman in Urban Affairs Review
Footnotes
Declaration of Conflicting Interests
The author(s) declared no potential conflicts of interest with respect to the research, authorship, and/or publication of this article.
Funding
The author(s) received no financial support for the research, authorship, and/or publication of this article.
Supplemental Material
Supplemental material for this article is available online.
Notes
Author Biographies
References
Supplementary Material
Please find the following supplemental material available below.
For Open Access articles published under a Creative Commons License, all supplemental material carries the same license as the article it is associated with.
For non-Open Access articles published, all supplemental material carries a non-exclusive license, and permission requests for re-use of supplemental material or any part of supplemental material shall be sent directly to the copyright owner as specified in the copyright notice associated with the article.