
Abstract
Circles of Support and Accountability (CoSA) aim to augment sex offender risk management at the point of community reentry by facilitating “Circles” of volunteers who provide support, guidance, and advice, while ensuring that the offender remains accountable for their actions. In this study, the authors provide (a) a rapid evidence assessment of the effectiveness of CoSA in reducing reoffending, and (b) a U.K. cost-benefit analysis for CoSA when compared to the criminal justice costs of reoffending. From the study analysis, the average cost of a “Circle” was estimated to be £11,303 per annum and appears to produce a 50% reduction in reoffending (sexual and nonsexual), as the estimated cost of reoffending was estimated to be £147,161 per offender, per annum. Based on a hypothetical cohort of 100 offenders—50 of whom receive CoSA and 50 of whom do not—investment in CoSA appears to provide a cost saving of £23,494 and a benefit-cost ratio of 1.04. Accounting for estimates that the full extent of the cost to society may be 5 to 10 times the tangible costs substantially increases estimated cost savings related to CoSA.
Keywords
Introduction
The continuing incidence of sexual violence presents a significant challenge to law enforcement agencies, policy makers, medical services, and providers of therapeutic interventions for both victims and perpetrators. Sexual crime directed toward adults and children is rightly considered a gross violation of the person and has been linked to a great number of long-term negative consequences for victims, in terms of mental health, revictimization, and adult social and sexual functioning (e.g., Andersen, Tomada, Vincow, Valente, & Polcari, 2008; Easton, Coohey, O’Leary, Zhang, & Hua, 2011; Hillberg, Hamilton-Giachritsis, & Dixon, 2011; Itzin, Bailey, & Bentovim, 2008). As such, crimes of this nature carry heavy legal penalties, including substantial custodial and community sentences. Sexual offenses incite a great deal of fear among the general public, leading to variety of criminal justice policies designed to protect communities from further sexual victimization (Levenson, Brannon, & Fortney, 2007).
Consequently, releasing and reintegrating an individual convicted of sexual offenses into the community after prison is a sensitive issue that needs to be managed with careful consideration of the needs of the individual being released, the victims, and the community in general (Wilson, Cortoni, & McWhinnie, 2009). On release, the criminal justice system is tasked with balancing the safety of the communities into which the offender is released with the need to support the offender in developing an offense-free life. As Willis, Levenson, and Ward (2010) note, desistence for sex offenders on reentry to the community is “dependent on specific environmental conditions, for example, stable housing, access to employment opportunities, cognitive transformations, and social support” (p. 553).
One approach that seeks to provide these positive environments is that of Circles of Support and Accountability (CoSA). In 1994 a Mennonite pastor agreed to provide support to a recently released sex offender and asked a group of his congregation to volunteer a small amount of their time to assist him in establishing himself in the community. The approach was then subjected to a successful pilot project by Correctional Service of Canada and the Mennonite Central Committee of Ontario (MCCO), who were able to operationalize the approach and its protocols (Correctional Service of Canada, 2003). In light of the success of this pilot, the Circles approach has since been adopted in a number of other countries, including the United States, England and Wales, Scotland, the Netherlands, and Belgium.
According to Wilson, Bates, and Vollm (2010), a U.K. “Circle” consists of a group of four to six trained volunteers from the local community and an experienced Circle coordinator who provide a social network around the offender, referred to as the core member (CM). The volunteers provide support and practical guidance (e.g., in obtaining employment or housing), help the CM to recognize patterns of potentially risky thoughts/behaviors, and ensure that the CM is accountable and takes responsibility for his or her own ongoing risk management. The CM is involved in all planning and decision making and, along with the volunteers, signs a contract committing to the Circle and its aims. The Circle then meets regularly, and volunteers spend individual time with the CM either face to face or via telephone, for the duration of the Circle (typically 1 year or more). The aim of the Circle is to assist the CM in reintegrating responsibly into the community, acting as a support and safety mechanism for both the CM and the community, and enhancing public safety when there is a perceived element of risk.
In order to establish the benefit of CoSA in terms of its use as a supplementary risk management strategy for sex offenders, it appears timely to assess and collate any previous attempts to evaluate the effectiveness of the approach, as there are currently no systematic reviews of specific CoSA approaches to sex offender management. Funding organizations are not only concerned that supported programs achieve their aims and objectives but also that their impact can be justified in terms of money spent (Friendship, Falshaw, & Beech, 2003). To this end, this study was commissioned by Circles U.K. and conducted by the authors at the University of Birmingham. 1 In this study we aimed to provide the following: (a) a rapid evidence assessment outlining the research base for the effectiveness of the CoSA approach in reducing reoffending, and (b) a cost-benefit analysis of the potential cost savings related to any reduction in reoffending in comparison to the costs to the criminal justice system of reoffending by sex offenders.
Establishing the Effectiveness of CoSA
Design: Rapid Evidence Assessment
Policy makers often require the synthesis of knowledge in an area within a shorter time frame than that required to produce a systematic review, which can typically take up to 12 months and utilizes a team of researchers. Rapid reviews, such as the Rapid Evidence Assessment, “streamline traditional systematic review methods” (Ganann, Ciliska, & Thomas, 2010, p. 58) by limiting searches (by year, databases, language, etc.) or employing fewer researchers for data extraction. Consequently, though the process is expedited, it may lead to missing data and introduce biases (Ganann et al., 2010); this is, however, balanced against the time and resources available. This project was completed within a time frame of 12 weeks.
Selection of Studies
Computer searches of Digital Dissertations, National Criminal Justice Reference System (NCJRS), PsychINFO, PubMed, Scholar Portal, and Web of Knowledge were conducted using the following key terms: sex* offen* and circle*. Additional searches were made of reference lists of collected articles, review articles, and contacts with researchers with links to CoSA organizations in Europe and North America. The search was limited to studies published after 1995 (the year of the first CoSA). One researcher was employed to review abstracts, assess methodological quality, and extract data.
PICO (Participants, Interventions, Comparators, Outcomes) Elements
Reviews in health care interventions typically report their method in terms of their PICO elements (participants, interventions, comparators, outcomes; Centre for Reviews and Dissemination, 2008), as follows:
Participants
To be included in the REA the studies needed to include an identifiable sample of adult (18+) male CoSA CMs.
Interventions
CoSA CMs were defined as individuals who received a community-based intervention by a CoSA provider, where trained volunteers provide a supportive community for the individual offenders, holding that person accountable for their actions.
Comparators
Randomized control studies are typically preferred in systematic review; however, there are ethical challenges associated with random assignment for criminal offenders. RCTs were, therefore, included in the criteria, but relevant matched control studies using non-CoSA sex offenders, risk norm, and cohort studies were also considered eligible.
Outcomes
Selected studies reported reoffending/reconviction outcomes for the samples. Reconviction is defined as the conviction for another offense during a specific follow-up period derived from official records of criminal convictions (Friendship et al., 2003). Other outcome data (e.g., employment, educational, health, housing, etc.) were also collected and reported.
Although this is a U.K.-based study, based on U.K. criminal justice costs, it was decided that this study would consider any quality studies into the effectiveness of CoSA regardless of the location of their sample. This decision was made due to a lack of quality studies into the effectiveness of CoSA in the United Kingdom specifically. Consequently, although it meant that we may not be able to generalize the findings to a U.K.-based population, any well-conducted cross-cultural comparisons (e.g., other European or North American samples) are included in this study in order to make estimations of effectiveness.
Initial Results
Four studies were identified (see Table 1). Two were classified as published papers (Bates, Saunders, & Wilson, 2007; Wilson et al., 2009), one was classified as an unpublished document (government report; Wilson, Picheca, & Prinzo, 2005), and one was a report in preparation (Bates, Macrae, Webb, & Williams, in press). Two were from a single research team in Canada and two were from a single research team at Hampshire Thames Valley Police, United Kingdom. The studies were all recent, ranging from 2005 to 2011. Table 1 provides details of the included studies.
Studies Examining the Effectiveness of CoSA (Circles of Support and Accountability).
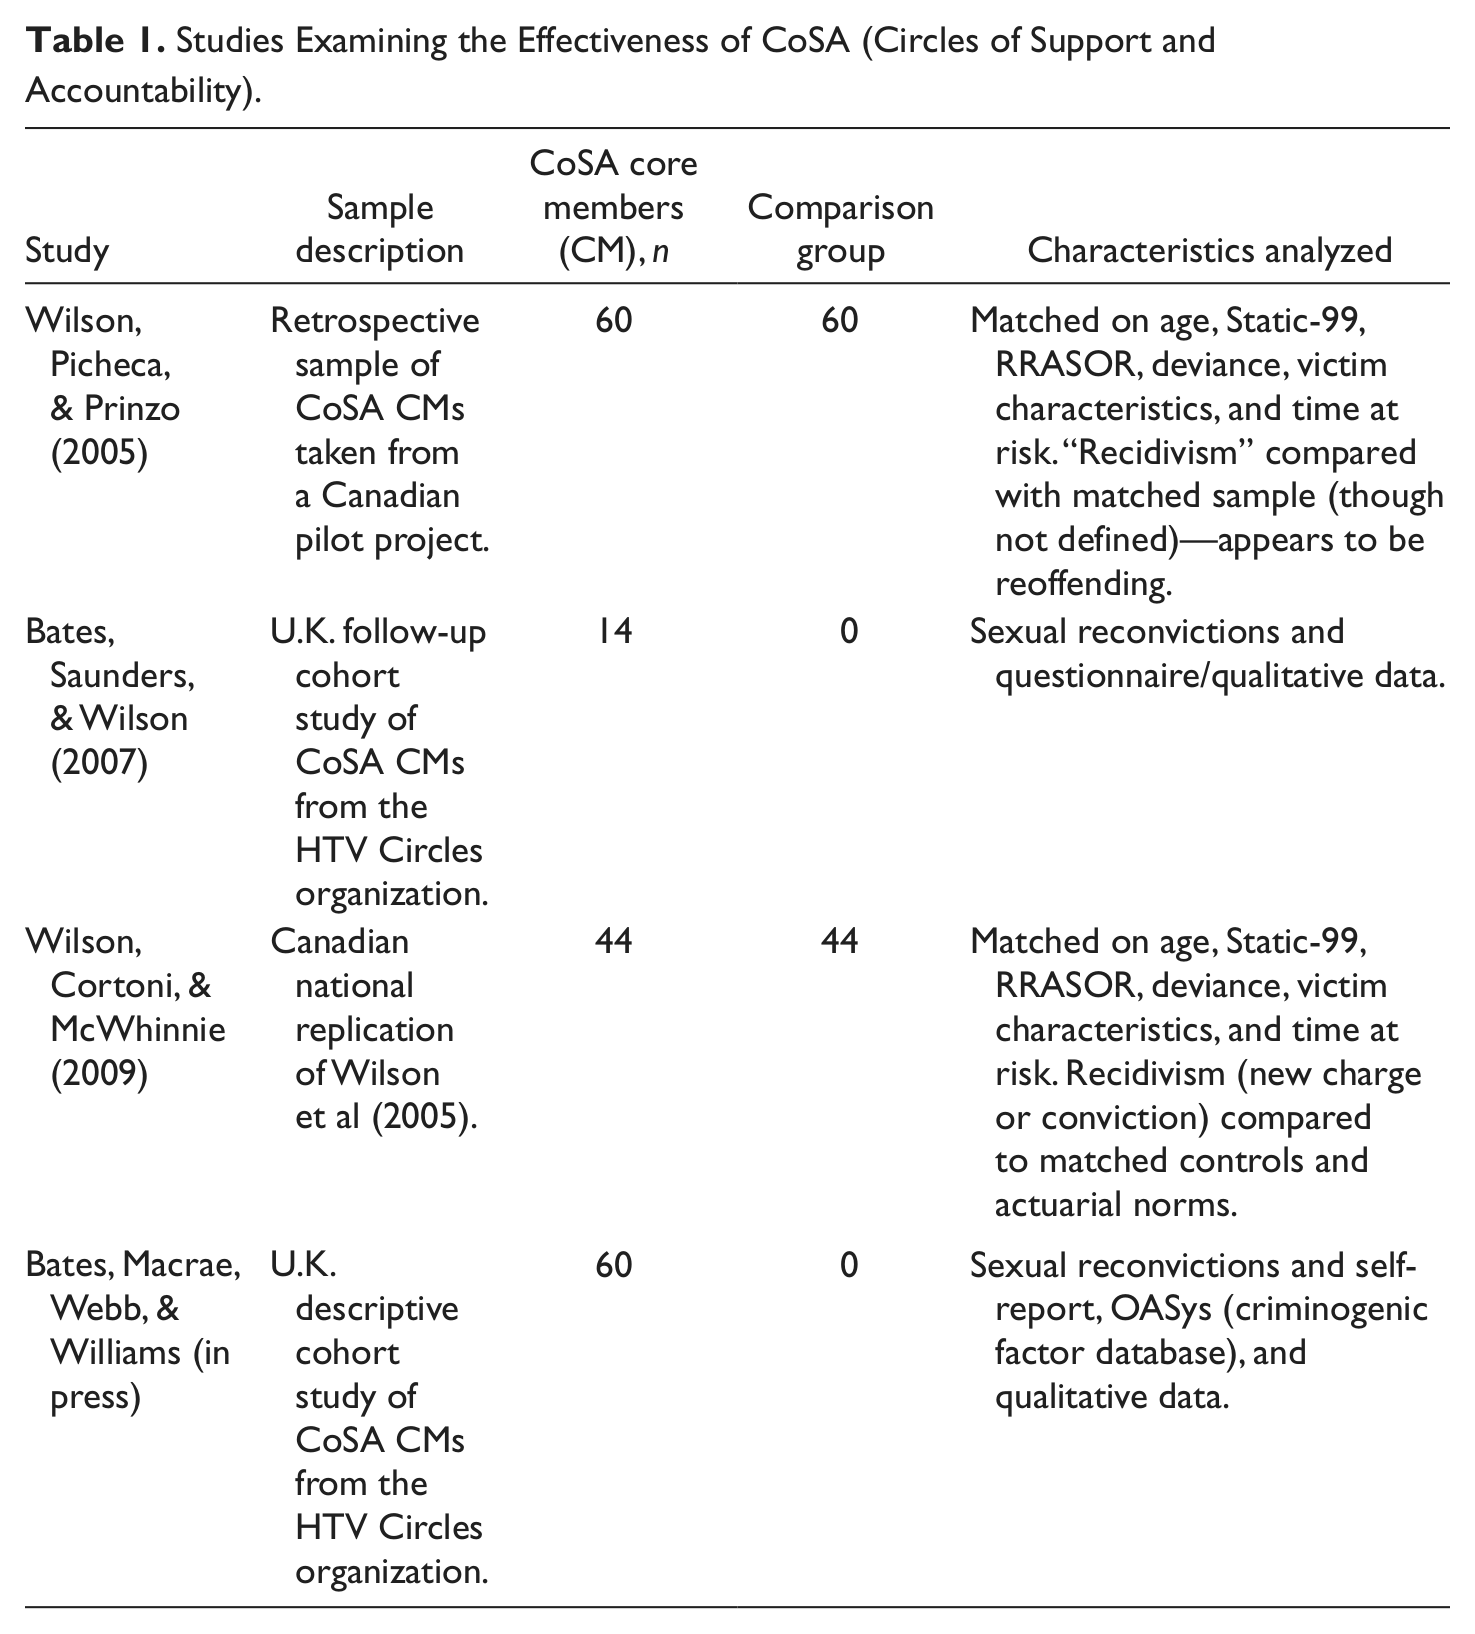
To provide the most robust estimate of the effectiveness of CoSA in reducing reoffending, we sought to calculate an aggregated percentage reduction. It should be noted that in cost-benefit analyses the aggregation of the size of the effect in identified studies alone (including outcomes from meta-analysis) is not necessarily indicative of a positive result. Effect size alone has been found to be a poor indicator for overall net benefit, and the use of effect size alone can often lead to different policy recommendations (i.e., producing a highly significant reduction in offending can still produce a negative cost benefit; Marsh, Chalfin, & Roman, 2008). However, figures for percentage reduction were only available for the Canadian samples. Consequently, in order to include the U.K. data to the overall percentage reduction, and hence provide a more valid and culturally balanced comparison to the financial data, the raw Bates et al. (in press) data were acquired and a risk-norm analysis was conducted.
Risk-Norm Designs Using Bates et al. (2007) and Bates et al. (In Press) Data
The data in both Bates et al. (2007) and Bates et al. (in press) studies did not include a comparison with a control sample. We did, however, obtain the raw data for these studies for the purpose of this analysis. These data included category allocations for the Risk Matrix 2000 (RM2000; Thornton et al., 2003) actuarial risk assessment tool. The RM2000 categories are ordinal groupings along the risk continuum with higher categories representing relatively higher levels of risk of reconviction—low, medium, high, and very high risk (Thornton, 2007). Access to these data allowed for a basic risk-norm design analysis (e.g., Cortoni & Nunes, 2007) to be conducted. The Bates et al. (2007) data, however, reported only an average follow-up time (time at risk) of only 18 months and as such a comparison with the 3- and 5-year follow-up data provided for the RM2000 was not considered appropriate. Consequently, a risk-norm analysis was only provided for the Bates et al. (in press) data.
A risk-norm design compares the actual reoffending rate of a sample of offenders with a projected reoffending rate based on norms for a risk assessment tool (Wilson et al., 2009). Although the individual RM2000 scores (i.e., 0-10) were not available, we did obtain individual category membership (i.e., low, medium, high, very high). Therefore, we could not, as Wilson et al. (2009) were able, calculate the exact probability of reconviction for each CM. Instead, we took the number of CMs in each group and calculated the number of offenders in a group whose size would be used to predict reoffending based on the RM2000 norms. See Table 2 for a breakdown of those offenders predicted to reoffend by RM2000/S based on two reported normative samples, 2 as follows: (1) the latest norms supplied for RM2000/S (Thornton, 2007), and (2) a more recent large-scale U.K. analysis reported by Barnett, Wakeling, and Howard (2010). It should also be noted that the length of follow-up for the norms are longer than those of the CoSA sample (3 years follow-up for CoSA and 4 years follow-up for RM2000); therefore, the Bates et al. (in press) data may underestimate the sexual reconviction rates in the Bates et al. sample. 3
Comparison Between Number of Actual Reoffenders in Bates, Macrae, Webb, & Williams (in press) and Projected Numbers Based on RM2000s Norms Reported by Thornton a (2007) and Barnett et al. (Barnett, Wakeling, & Howard, 2010; rounded totals in parenthesis).
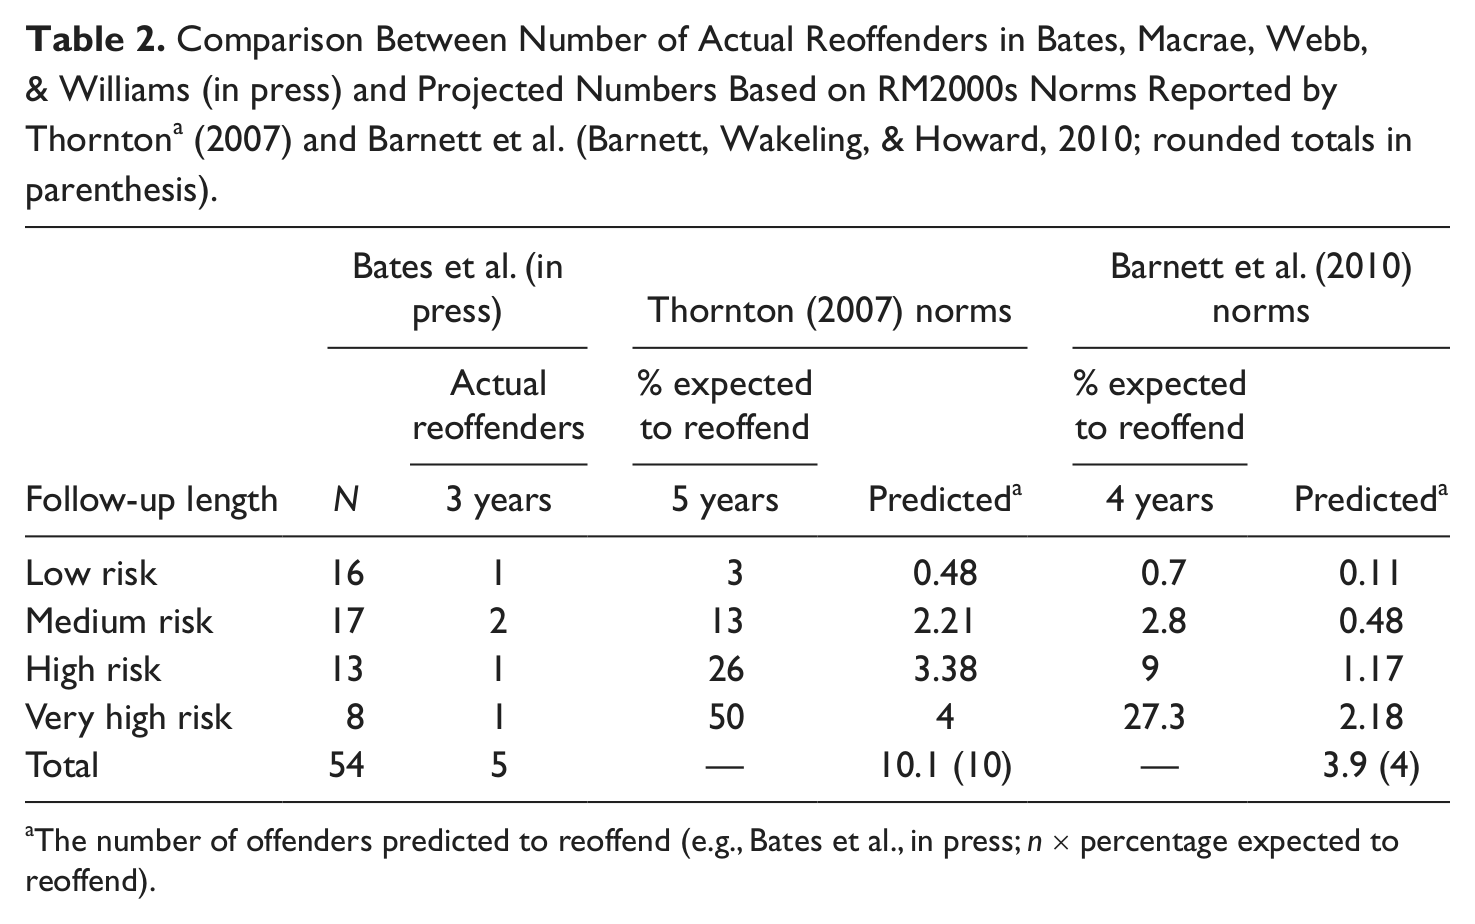
The number of offenders predicted to reoffend (e.g., Bates et al., in press; n × percentage expected to reoffend).
Based on the two Canadian studies and the risk-norm analysis, estimates for the effect of CoSA on both sexual and nonsexual reoffending rates were calculated.
Sexual Reoffending
The four papers include nine comparisons between a CoSA group and either a matched-sample group or normative risk data for sexual reoffending. Table 3 provides the calculated percentage change in each of these analyses and their related statistical significance level.
The Various Percentage Changes in Sexual Reconviction Reported in Analyses Between CoSA (Circles of Support and Accountability) and Control (or Risk-Norm) Samples.
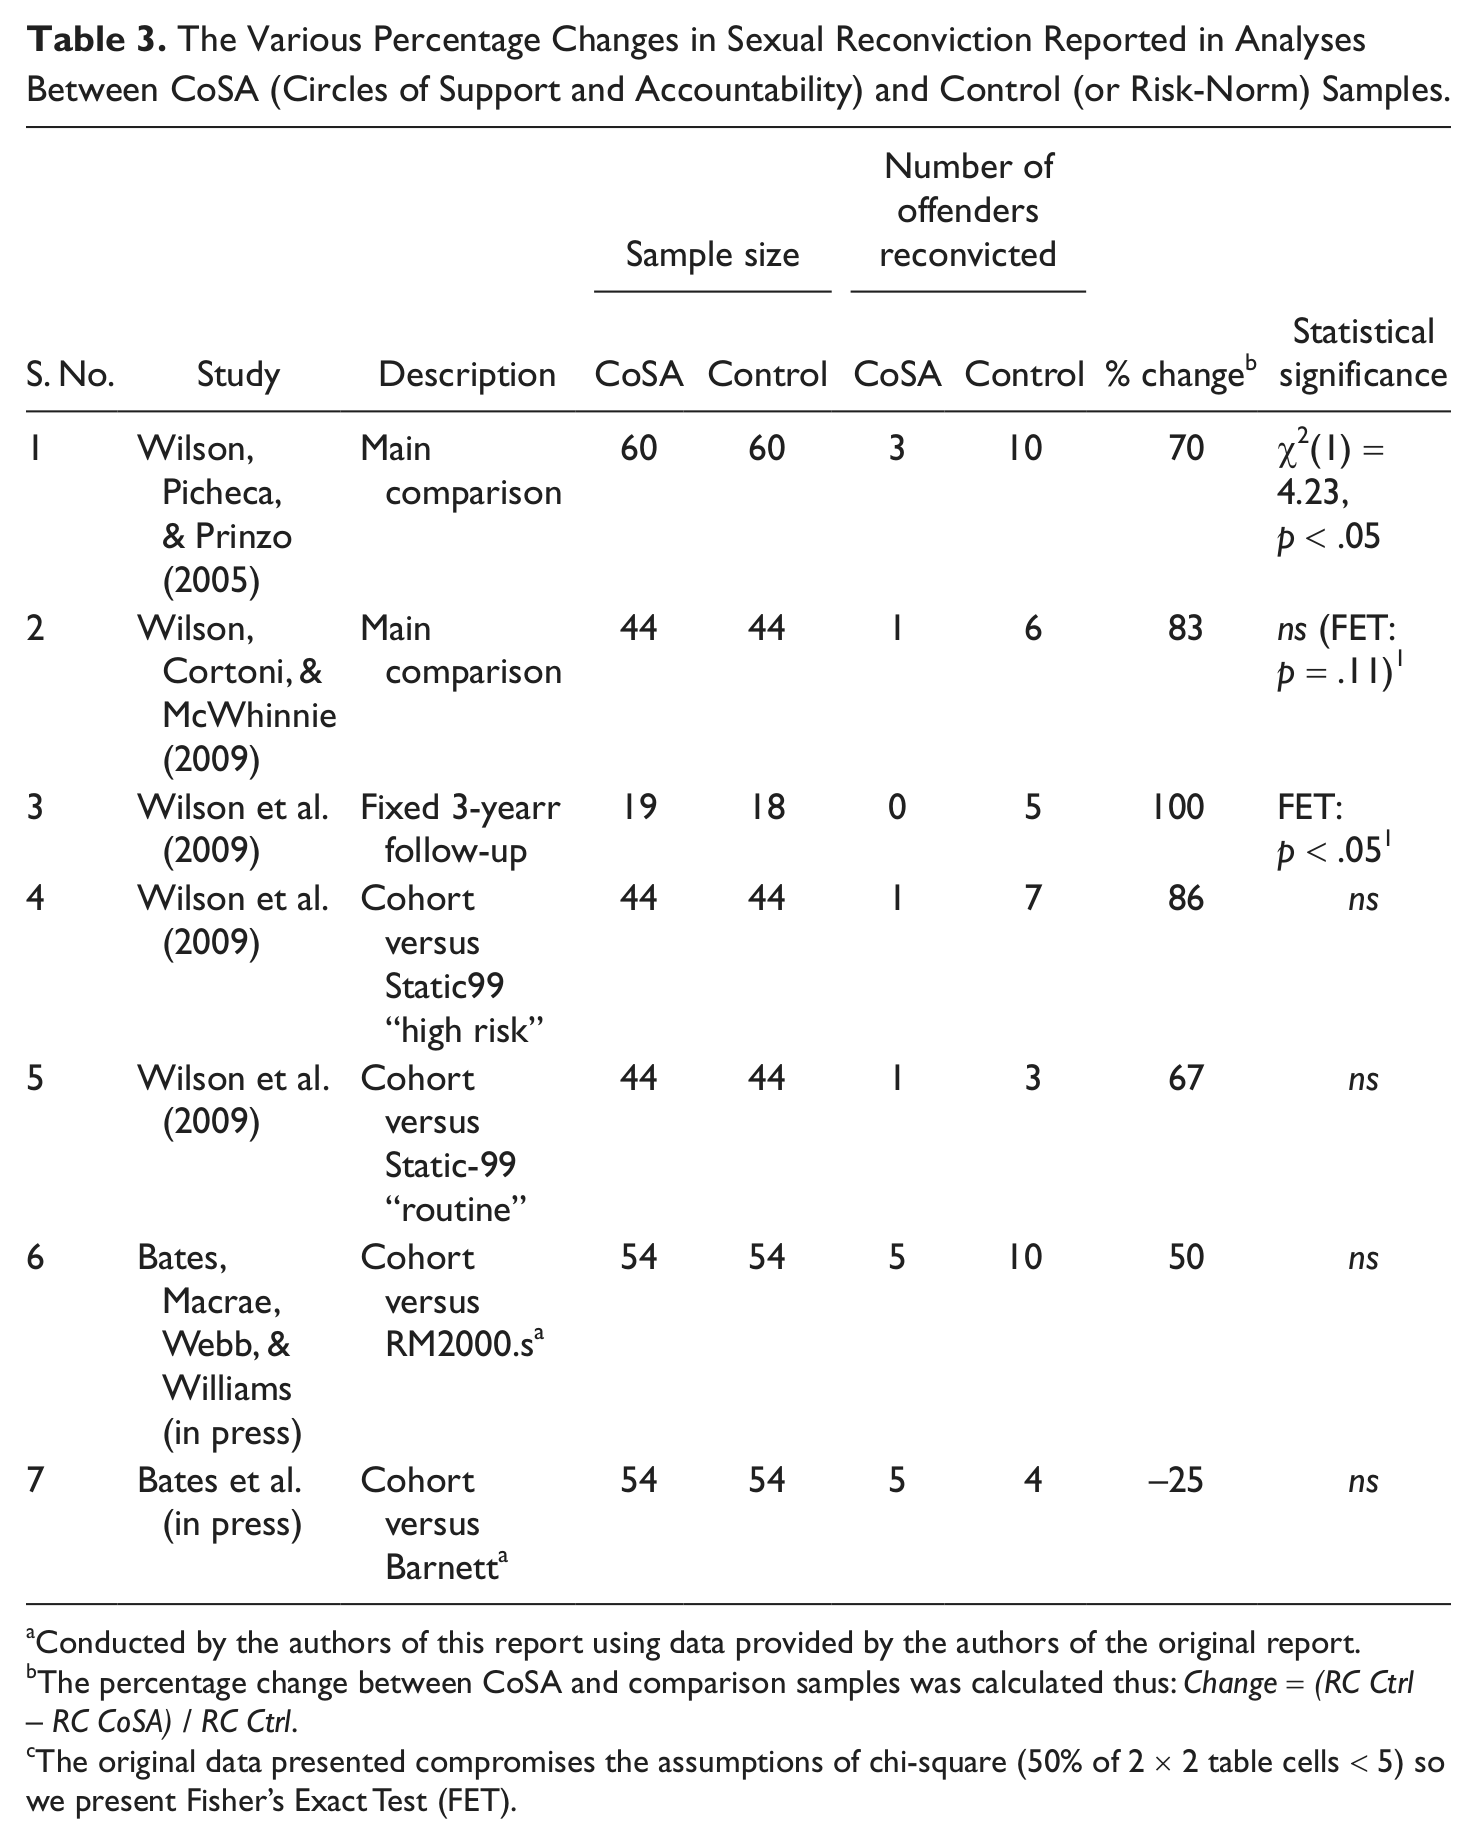
Conducted by the authors of this report using data provided by the authors of the original report.
The percentage change between CoSA and comparison samples was calculated thus: Change = (RC Ctrl – RC CoSA) / RC Ctrl.
The original data presented compromises the assumptions of chi-square (50% of 2 × 2 table cells < 5) so we present Fisher’s Exact Test (FET).
Table 3 shows that sexual reoffending is reduced by 70% and 83% in the two largest significant matched control studies, 100% in a significant fixed follow-up comparison, and 62% on average across the four nonsignificant analyses (the last four rows of Table 3). Taking the average of these three figures, weighted to account for sample size, we estimate an approximate reduction in sexual reoffending as a result of CoSA of 61% over an average 3.5-year follow-up period. Meta-analysis, using a fixed-effects model, shows that, combined, the results indicate a highly significant reduction in sexual recidivism (OR = 0.31, 95% CI = 0.12-.070, p <.01).
Any Reoffending (Sexual and Violent Offenses)
Sexual reoffending, as we have calculated earlier, is not the only form of reoffending that will create costs to the criminal justice system. The cost-benefit analysis that we aim to provide is based on the cost of rearrest, reconviction, and return to prison. Therefore, we calculated the reduction in any reoffending (so a combination of sexual and violent offenses) as a result of CoSA. The four studies include three comparisons between a CoSA group and either a matched-sample group data on a combination of sexual and violent reoffending. Table 4 provides the calculated percentage change in each of these analyses and their related statistical significance level. In order to conduct a risk-norm analysis for the two U.K. studies, the RM2000/V (risk of violent reoffending) and RM2000/C (risk of sexual or violent reconviction combined) were used. Statistics from the two Hampshire Thames Valley data sets (Bates et al., in press, 2007) did not include either the CM’s RM2000/V 4 or RM2000/C 5 scores and, hence, comparisons to the normative data for nonsexual offenses was not possible.
The Various Percentage Changes in Any Reconviction Reported in Analyses Between CoSA (Circles of Support and Accountability) and Control (or Risk-Norm) Samples.

The percent change between CoSA and comparison samples was calculated thusly: Change = (RC Control – RC CoSA) / RC Control.
Originally reported as p < .07.
As shown in Table 4, any reoffending is reduced by 35%, 71%, and 83%, respectively, in the three Wilson et al. (2005, 2009) analyses. Taking an average of the two 6 main outcomes in Table 4, weighted to account for sample size, we estimate an approximate reduction in any reoffending as a result of CoSA of 50% over an average 3.75-year follow-up. Meta-analysis, using a fixed-effects model, shows that, combined, the results indicate a highly significant reduction in sexual recidivism (OR = 0.29; 95% CI = 0.12-0.67, p < .01).
Baseline U.K. Reoffending Rates
In order to establish the cost of reoffending for non-CoSA offenders it was also necessary to establish the base rate of reoffending by sex offenders in the United Kingdom. The latest reoffending rates for sex offenders in general were sourced from the U.K Home Office figures. These figures, however, were based on a 1-year follow-up. The likelihood that criminal behavior will reappear decreases the longer the person has abstained from that behavior; for example, the rate of reoffending between the time of release from prison and Year 2 is not likely to be the same as the rate of reoffending between Years 10 and 12 (Harris & Hanson, 2004). Hence, it is important that any estimate of reoffending be “time defined” (i.e., matched for follow-up time), to ensure that each group has the same opportunity or “time at risk” to commit subsequent offenses.
The average follow-up time for the CoSA samples were 3.75 years and so this seems inappropriate as a comparison. As such, we decided to use the latest figures from Barnett et al.’s (2010) assessment of the applicability of the RM2000. They report 4-year reoffending rates in the United Kingdom at 15.1% for sexual and/or nonsexual violent offenses.
Cost-Benefit Analysis
Cost-benefit analysis (CBA) is a well-known analysis technique and is used to assess the effectiveness of interventions in a way that allows choices to be made regarding the allocation of resources among competing approaches (see Swaray, Bowles, & Pradiptyo, 2005, for a review). Cost-benefit analysis is used for multiple purposes in addition to assessing intervention effectiveness. As Swaray et al. note, CBA identifies the scope of the problem (i.e., that effective interventions need also to be as cost-beneficial as possible), measures the effects of an intervention, monetizes the stream of intervention costs and outcomes, and subjects those estimates to a sensitivity analysis. Having established the effectiveness, we can then analyze the efficiency in terms of whether the benefits of the intervention outweigh the costs (Marsh et al., 2008).
Method
In order to calculate the potential monetary benefit of CoSA we first sought to calculate three figures: (1) the cost of “a Circle,” (2) the cost of reoffending, and (3) the base rate of reoffending by sex offenders. Direct and indirect operation in a Circle by established CoSA providers 7 were calculated along with an estimate of the number of Circles per year. This enabled us to calculate an average “per Circle” running cost. This average cost was calculated to be £11,303 per Circle, per annum. These costs are shown below in Table 5.
The Cost of “a Circle”: Average Number of Circles per Year = 20.

Includes estimates for CoSA organizations who receive some resources (e.g., office space, staff costs, etc.) “in kind” from the National Probation Service.
An estimate for the cost of the criminal justice response to reconviction, per offender, was calculated. We estimated tangible costs (direct costs of the criminal justice process) and intangible costs (the indirect cost of crimes to health, education, and extra costs to policing) for reoffending. Inflation calculators were used to provide estimates of these costs in 2009 (the latest inflation figures available). The estimated cost per reoffense was calculated to be £147,161 per offender. These costs and estimates are shown in Table 6.
Calculating the Cost of Reconviction.
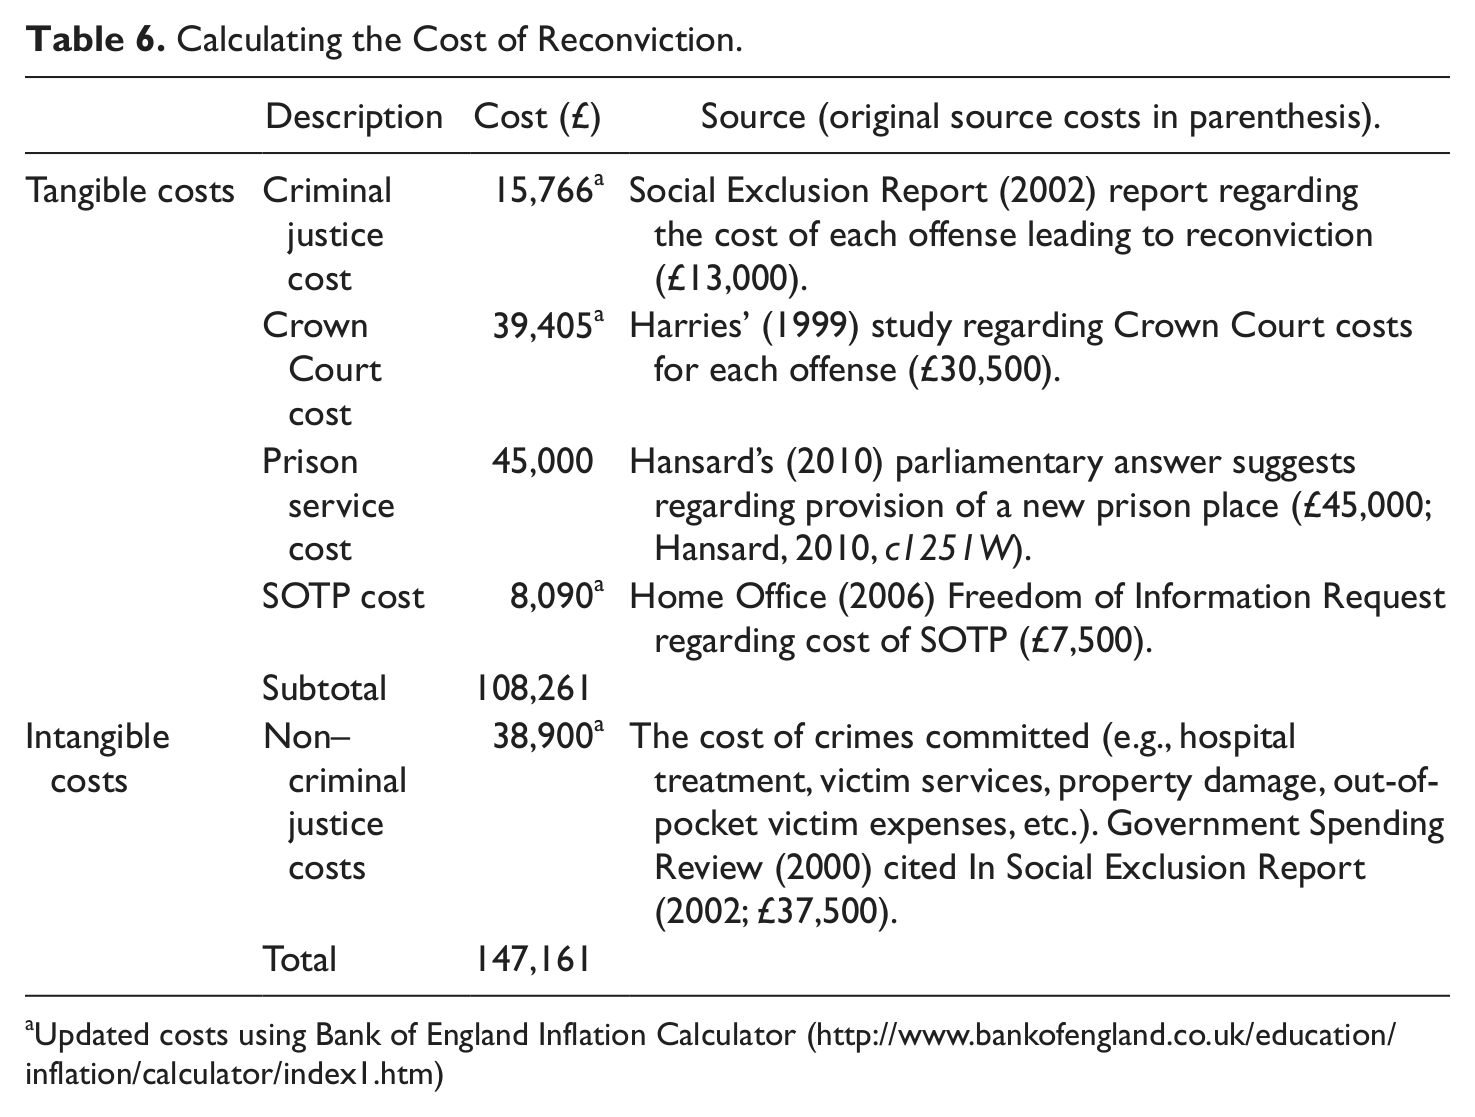
Updated costs using Bank of England Inflation Calculator (http://www.bankofengland.co.uk/education/inflation/calculator/index1.htm)
The intangible costs outlined in Table 6 are those indirect costs identified as being borne by other related agencies, out-of-pocket costs to victims, and potential commercial costs. It has, however, been noted that there are many hidden intangible costs produced as a consequence of the deleterious effects on the victims of sexual abuse that may increase the true cost of reoffending, potentially by up to 10 times the intangible costs (McGurk & Hazel, 1998; Miller, Cohen, & Wiersma, 1996). This main analysis is based on the potential cost benefits of CoSA as an intervention and, therefore, it may not seem appropriate to include these hidden intangible costs in the main analysis, as they are unlikely to be borne directly by those providers. It is important though to acknowledge that reoffending has personal and societal costs and as such we have provided an analysis that includes these costs as an additional analysis in this article.
Modeling the Results of CoSA Interventions
To conduct the CBA we caulculated costs for a cohort of 100 hypothetical offenders released from prison per annum into the community, 50 in CoSA Circles, and 50 who were not. A decision tree models the two populations and their reoffending patterns . See Figure 1 for this decision tree.
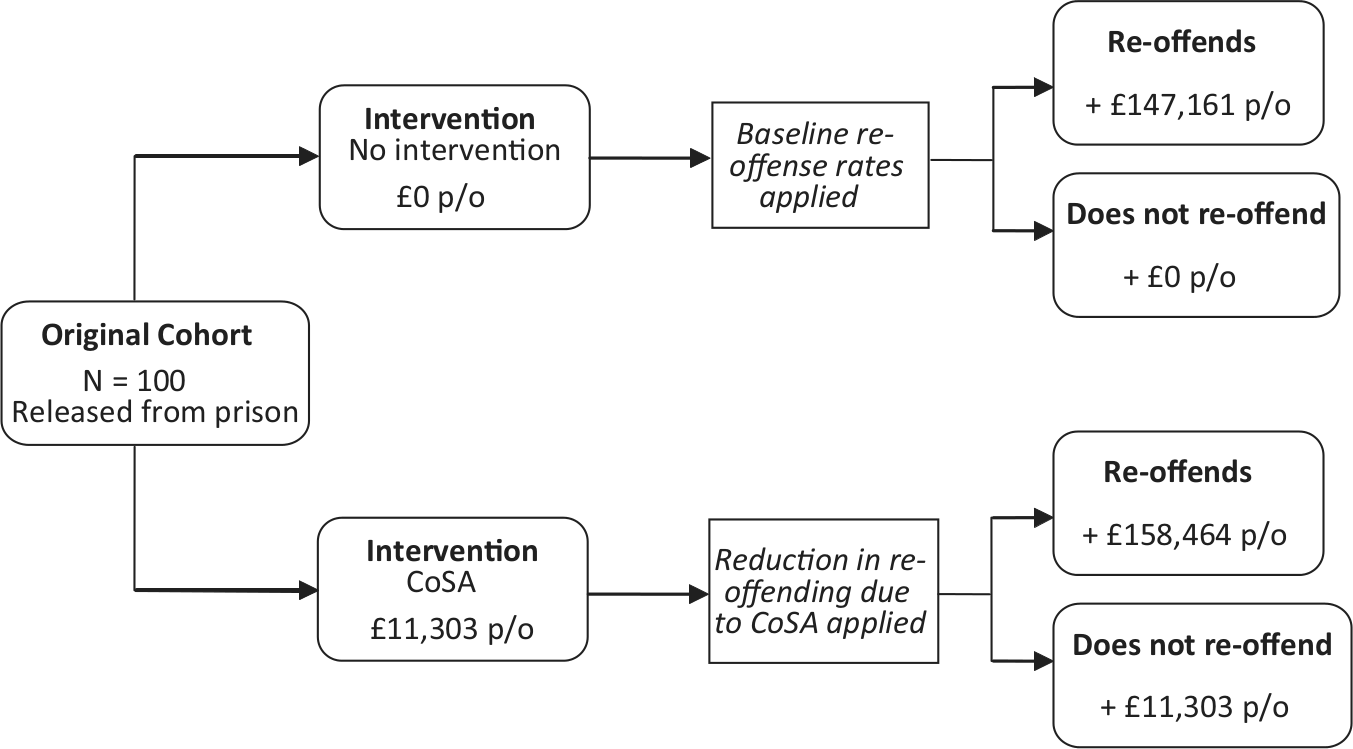
Cost-benefit analysis decision tree.
We can input our estimated reoffending and CoSA effectiveness data into the CBA decision tree. First, we have estimated that 15.1% of the non-CoSA cohort is predicted to reoffend (base reoffense rate). Second, we have estimated that there will be an approximate 50% reduction in any new offenses in the CoSA group. According to the figures presented above, we would predict the number of the cohort reoffending in Table 7.
The Breakdown of Reoffending by a Cohort of 100 Offenders Released From Prison Based on Predicted Base Rates of Reoffending and Reductions in Any New Offenses Due to CoSA (Circles of Support and Accountability).
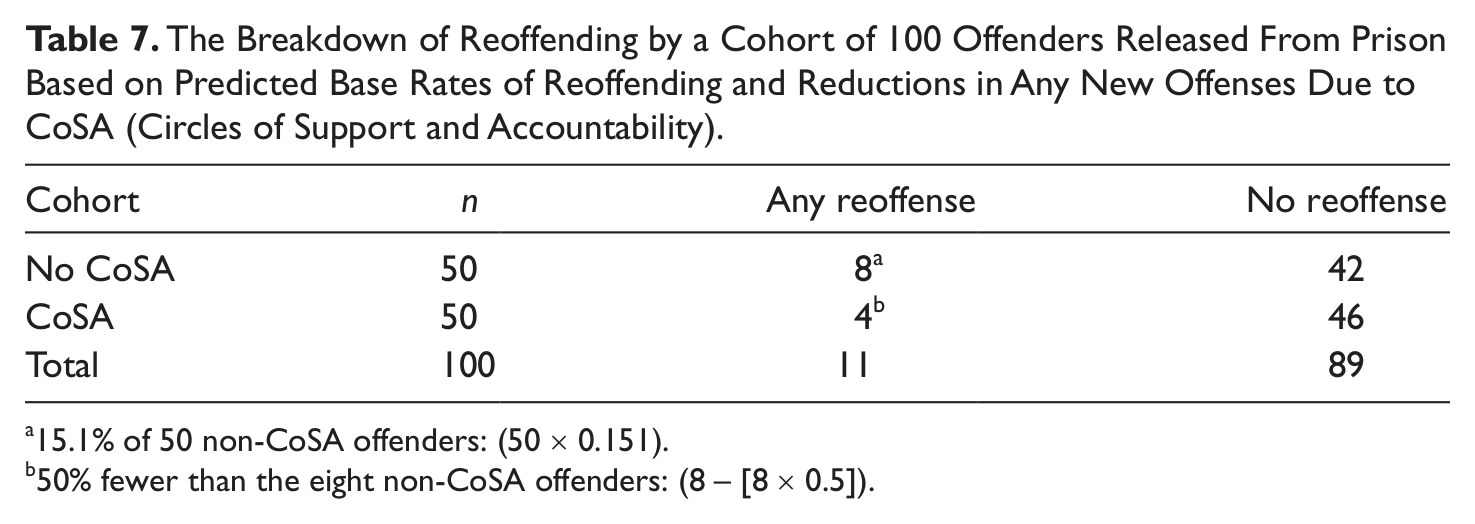
15.1% of 50 non-CoSA offenders: (50 × 0.151).
50% fewer than the eight non-CoSA offenders: (8 – [8 × 0.5]).
Applying the costs calculated in Tables 5 and 6 produces the costs per outcome seen in Table 8. These costs are based on tangible criminal justice costs.
Cost Matrix for CBA (Cost-Benefit Analysis; Tangible Costs Only).
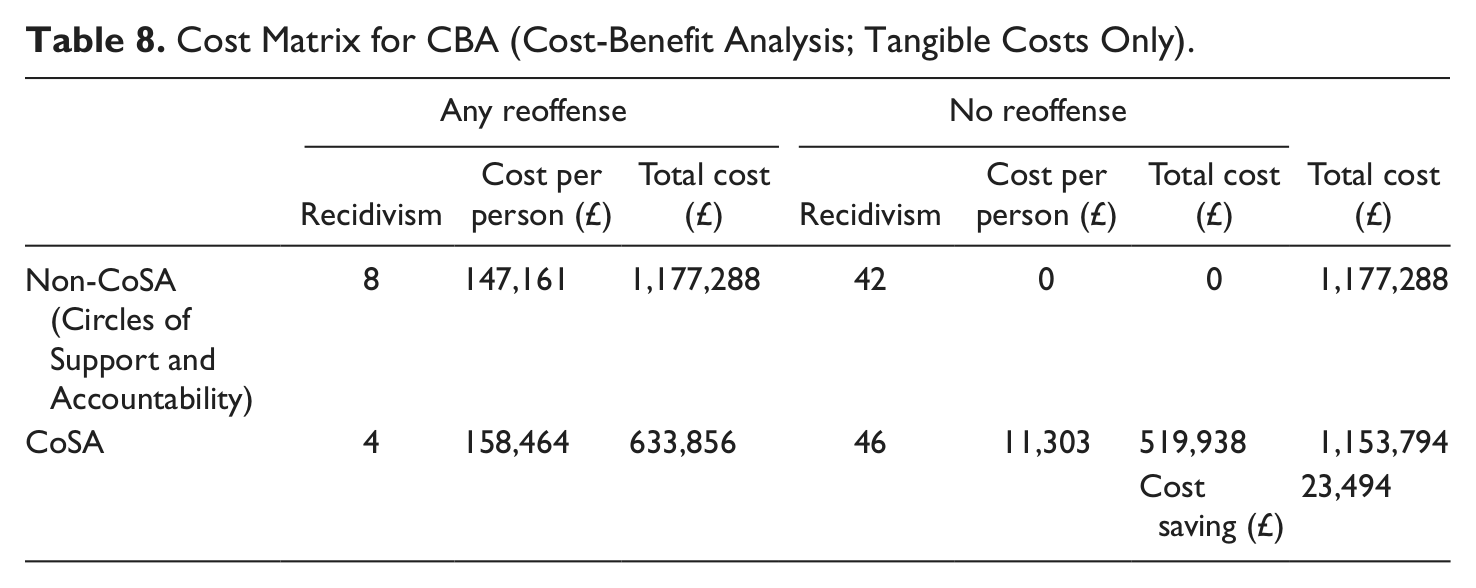
We can see from the figures that the net benefit for the 50 offenders provided with CoSA is £23,494. Therefore, based on a total cost of £565,150 (50 offenders receiving CoSA at £11,303) and a total benefit of £588,644 (4 fewer offenders at £147,161 each), this results in an estimated benefit-cost ratio of 1.04.
Cost-Benefit Analysis (Including Intangible Criminal Justice Costs)
This analysis outlines the potential savings based on the costs that may be borne by criminal justice agencies, other related agencies, and the out-of-pocket costs to victims. Other researchers, however, have noted that the full extent of the cost to society through the deleterious effects on the victims of sexual abuse may be more in the region of 5 to 10 times the intangible costs (McGurk & Hazel, 1998; Miller et al., 1996) and these upper limits have been previously adopted to adjust cost-benefit analyses of sex offender interventions (e.g., Donato & Shanahan, 1999). These estimates are based on the amounts of money that nonaffected individuals (e.g., juries in compensation cases, research participants, etc.) place on the long-term physical and emotional damage caused by child sexual abuse on its victims.
In what follows, we present the potential “full societal costing” of the benefit of the reduction in reoffending due to CoSA (using the figures in Table 7). If we multiply the non–criminal justice costs in Table 6 by 5 times (taking the total cost of reconviction to £302,761—see Table 9) and 10 times (£497,261—see Table 10) we obtain different costs per outcome.
Cost Matrix for 5 Times Non–Criminal Justice Costs.

Cost Matrix for 10 Times Non–Criminal Justice Costs.

We can see from the figures that the cost saving for the 50 offenders provided with CoSA, when intangible costs are estimated to be 5 times the non–criminal justice costs, is £645,894. Based on a total cost of £565,150 (50 offenders receiving CoSA at £11,303) and a total benefit of £1,211,044 (4 fewer offenders at £302,761 each), this results in an estimated benefit-cost ratio of 2.14.
We can see from the figures that the cost saving for the 50 offenders provided with CoSA, when intangible costs are estimated to be 10 times the non–criminal justice costs, is £1,423,894. This produces a benefit-cost ratio of 0.56—every £1 invested in CoSA returns £0.56 in savings. Based on a total cost of £565,150 (50 offenders receiving CoSA at £11,303) and a total benefit of £1,989,044 (4 fewer offenders at £497,261 each), this results in an estimated benefit-cost ratio of 3.52.
Discussion
In this investigation a cost-benefit analysis of CoSA interventions was presented based on estimations of reductions in offending due to CoSA and U.K. estimated costs and recidivism rates. Although limited data are available on CoSA outcomes, and the quality of that data varies, it was estimated that there is a reduction of 50% in all types of reoffending for CoSA CMs compared with no intervention. The delivery of CoSA in the U.K. costs, on average, £11,303 per “Circle.” The U.K. costs of reconviction are estimated to be £147,161. According to these estimations, CoSA appears to be cost beneficial—although the related cost-benefit ratio is not substantially large. The net benefit of CoSA over reconviction was calculated to be £23,494 per year, per 100 offenders, equating to a cost-benefit ratio of 0.02. To put these figures into context, a recent review of cost-benefit analyses for 106 criminal justice programs (including sex offender treatments, drug treatments, basic education, electronic monitoring, etc.) between the years of 1988 and 2005 found the average cost benefit to be $13,711 (around £8,500; Marsh et al., 2008).
Hence, it would appear that few criminal justice interventions produce vast cost savings. If these estimations do prove to be a realistic and accurate reflection of cost-effectiveness, then the CoSA program would appear to fall within a reasonable range for interventions within these populations. This is important within a rehabilitative political climate. If a rehabilitative option can, at the very least, break even in terms of reducing offending to an extent that it doesn’t produce additional cost to criminal justice agencies then it may be viewed as a preferable option to a no-treatment alternative. That a number of those studies identified in this investigation relating to CoSA (e.g., Bates et al., in press, 2007; Wilson et al., 2009) report evidence that the offenders themselves consider CoSA to be a positive influence on their behavior and their ability to reintegrate into the community lends further credence to the provision of CoSA where appropriate being preferable to not providing any postrelease intervention at all.
It is also worth noting that any reconviction of an offender depends on those behaviors being detected. As Zedlewski (2009) states, a notable weakness in criminal justice evaluations is the reliance on recidivism, the outcome measure, as this is simply the recorded outcome of a single crime (or series of offenses) and it is not, therefore, a true measure of whether the offender is more or less active as a result of the intervention. So is it likely that recidivism rates are being underestimated in both CoSA and non-CoSA groups. It is, however, not necessarily a failing of CoSA if reconviction rates for CMs are not lower than those who do not have a Circle. An effective Circle will provide support in the absence of offending behaviors and accountability where offending does occur. That is not to say that all new offences by a CM would be detected, but the additional offender contact and accountability provided by a Circle may inflate the detection of new offenses in the CM group. This may be especially so for those that are more difficult to detect, such as breaches of parole conditions.
It is important too to note that the full extent of the cost to society through the deleterious effects on the victims of sexual abuse may be much greater than those that represent direct tangible costs. These costs might include costs to the victim, such as additional health care or loss of income; related to this, costs to the victim’s family or dependents; costs to the offender’s families in terms of loss of income, or potential loss of social benefits; and also indirect costs to commercial enterprises and the economy in general. As such, a further analysis found that CoSA may potentially produce more encouraging cost benefits when the estimated nontangible effects of sexual abuse on the victims are taken into consideration. The real cost saving to society may be in the region of about £650,000-£1.4m.
These estimates, though, are based on costs from the United States and Australia; hence, it would be of benefit to analyze the potential worth the U.K. population places on the non–criminal justice costs created by child sexual abuse. Indeed, having more well-defined and reliably collected data on outcomes related to societal integration by offenders may also contribute positively to future analyses of CoSA. Anecdotally, the CoSA model appears to have a positive impact on employment and securing housing for CMs. If it were possible to establish the extent to which this may be the case and a financial value then any additional benefits of additional tax revenue and reduced benefits of employment could be integrated into a cost-benefit model. There is an inherent difficulty in establishing intangible cost of sexual assault, as multiple victimization (i.e., one offender having a number of victims or one victim being linked to multiple perpetrators) and willingness to access services and the varying costs of those services, all combine to create very different costs for victimization.
There are a number of limitations in this analysis that should be taken into account when evaluating the outcomes. First, both the figures for the effectiveness and the financial figures presented in the CBA represent estimations produced by the authors for the purpose of this article. All efforts have been made to make these figures as evidence based as possible; however, they may not truly reflect the costs and benefits of CoSA. For example, it was difficult to estimate the cost of a Circle, due to operational and primary funding differences between different providers. The effectiveness figures were taken from a small number of mainly Canadian studies, with small numbers of CMs and, therefore, may not directly translate to the effectiveness of CoSA in the United Kingdom. There is certainly a pressing need for a large-scale RCT-style study of the effectiveness of CoSA in the United Kingdom on which we can base future policy and financial examinations.
Second, there were also some methodological compromises, for example, the use of the REA over a full systematic review, and the ability to explore nondatabase sources was limited (i.e., to contact other researchers in the field). Those U.K. data that were available were not randomized-controlled studies, and hence, we sought to estimate effectiveness using the risk-norm design (Cortoni & Nunes, 2007). In the risk-norm design it was difficult to match variables such as time at risk between studies and any estimation of effectiveness will be dependent on the quality and reliability of suitable risk assessment instruments and reconviction data.
There is continuing interest in developing and providing novel management solutions for sex offenders in the community. CoSA is a fairly new model, designed to augment management for sex offenders who may benefit from additional social support at the point of reentry to the community and is still being developed in terms of providing an increasingly effective service. As with the vast majority of criminal justice interventions, policy makers are keen to balance effectiveness and the costs to the state. As criminal justice agencies seek to provide both evidence-based and cost-effective programs, future analyses of emerging interventions should seek to include information about the related cost benefits (Zedlewski, 2009). The flexible models in which CoSA are delivered will continue to make it a difficult program on which to estimate costs and as such further efforts should be made to assess effectiveness in order to present the most accurate case. However, should these estimates be found realistic, then where the alternative is not providing a service for reentry into the community and where practitioners find that their clients are suitable, CoSA can be an effective tool.
Footnotes
Acknowledgements
The authors would like to thank Prof. Nick Freemantle at the University College London Medical School for his assistance in the statistical analysis of the effectiveness data. We also thank Jack Bergman at Avans University of Applied Sciences for his comments on a previous analysis of these data.
Declaration of Conflicting Interests
The author(s) declared no potential conflicts of interest with respect to the research, authorship, and/or publication of this article.
Funding
The author(s) disclosed receipt of the following financial support for the research, authorship, and/or publication of this article: This paper was commissioned and funded by Circles U.K.