



Abstract
There has been little research on the sexual offending behavior of different racial groups. This study compares the characteristics and risk factors for American, non-Hispanic Whites (n =797) and Blacks (n = 788) who had been convicted of a sexual crime in New Jersey. The results indicated that Whites appeared more paraphilic whereas Blacks displayed higher antisociality. Despite the differences, however, the Static-99R, sexual recidivism risk tool, predicted equally well for both racial groups: Whites (area under the curve [AUC] = .76) and Blacks (AUC = .78). The findings suggest that there may be opportunities to improve treatment for the individuals at risk for sexual offending by tailoring interventions to the distinctive risk-relevant characteristics of Whites and Blacks.
Sexual offending is a serious concern across different countries and different cultural groups (Jina & Thomas, 2013; Mason & Lodrick, 2013). For the last few decades, considerable effort has been devoted to understanding and managing individuals with a history of sexual crime. Most of this research, however, has been based on Whites who committed a sexual crime. There is little understanding of the sexual offending behavior of different racial or ethnic groups.
The United States is multicultural and multiethnic society. Approximately 40% of the U.S. population identifies as a racial or ethnic minority (U.S. Census Bureau, 2017a). The race is a social-construct based on individuals’ phenotypic characteristics (e.g., skin, hair, or eye color; White, Black, or Asian). Although the terms of “race” and “ethnicity” are often used interchangeably, ethnicity has a broader meaning than race. Ethnicity is a category of people who are sharing common cultures (e.g., language, social norms, religion, or even racial characteristics; Cornell & Hartmann, 2007). A racial group (e.g., White), therefore, comprises multiple ethnic groups (e.g., Hispanic, Irish, or Italian).
According to the U.S. Census Bureau (2018), there are five racial categories used in the United States: White (including Hispanic; 76.9%), Black (13.3%), American Indian (1.3%), Asian (5.7%), and Native Hawaiian (0.2%; U.S. Census Bureau, 2017a). Blacks are the most overrepresented racial group within both the general U.S. criminal justice system and among those convicted of sexual offenses. Currently, Blacks makeup 13% of the U.S. general population (U.S. Census Bureau, 2017a), but represent 22% of state or federal prisoners incarcerated for either rape or sexual assault offenses (Carson, 2018). Despite considerable efforts made to understand the causes of the disproportionately high rates of criminal convictions among Blacks, to date, little research has examined the sexual offending behavior of Blacks.
There are only a few studies examining the sexual offending behavior of Blacks. Compared with Whites, Blacks who had committed a sexual offense showed lower levels of social achievement and less deviant sexual interests (Burton & Ginsberg, 2012; Schaaf, Jeglic, Calkins, Raymaekers, & Leguizamo, 2016). There is insufficient research, however, to make strong conclusions concerning racial differences. Consequently, it is not surprising that Blacks with a history of sexual offending are routinely provided with the same correctional services (rehabilitation programs, community supervision) as those provided to Whites. To the extent that racial and ethnic differences exist, it may be possible to improve the effectiveness of correctional intervention by tailoring services to distinctive characteristics of Blacks (i.e., the Need and Responsivity Principles from Andrews & Bonta, 2010, theory of correctional rehabilitation; Hanson, Bourgon, Helmus, & Hodgson, 2009).
Racial Differences in Sex Offending
The onset and persistence of sexual offending are broadly associated with two major propensities: general criminality (e.g., impulsivity, juvenile delinquency, and hostility toward women) and sexual criminality (sexual crime specific factors; Hanson & Bussière, 1998; Hanson & Morton-Bourgon, 2005). The major dimensions of sex crime specific criminality are sexual self-regulation (e.g., sexual preoccupation) and paraphilia (e.g., pedophilia; Brouillette-Alarie & Proulx, 2018; Hanson & Bussière, 1998; Hanson & Morton-Bourgon, 2005; Mann, Hanson, & Thornton, 2010; Whitaker et al., 2008). The risk-relevant characteristics of sexual offending might differ for Whites and Blacks.
Although there are only a few studies examining the sexual crime–specific risk factors for different ethnic groups in the United States, certain findings have been consistent. First, Whites convicted of sexual offenses appear more paraphilic than Blacks. They show higher sexually deviant arousal (to male children, rape, and exhibitionism; Murphy, DiLillo, Haynes, & Steere, 2001) and are less likely to have committed crimes involving conventional sexual behavior (i.e., adult victim, female victim, vaginal intercourse, less use of pornography; Fix, Falligant, Alexander, & Burkhart, 2017; Forbes, 2007; Kirk, 1975; Leguizamo, Peltzman, Carrasco, Nosal, & Woods, 2010; Waldron, 2012). Second, Whites who commit sexual crimes report a higher rate of childhood sexual and physical abuse than Blacks who commit sexual crimes (Cooper, Murphy, & Haynes, 1996; Fix et al., 2017; Murphy et al., 2001). Similarly, among those who have been abused, the age at first victimization is younger for Whites than for Blacks (the average age of 7 vs. 10; Fix et al., 2017).
There is strong evidence that a greater proportion of Blacks than Whites are recorded in official statistics concerning general and violent rule-breaking behavior (e.g., theft, robbery, or assault; Carson, 2018; Hartney & Vuoung, 2009). However, theoretical explanations for the high rates of rule-breaking behaviors among Blacks have been widely debated. First, the apparent difference could be attributed to the differential response of the criminal justice system and not on differences in the actual behavior. For example, racial bias and prejudice toward Blacks might directly or indirectly lead police officers to be more likely to stop, search, or arrest Black individuals than Whites in the same circumstances (e.g., racial profiling; Esqueda, 1997; Ioimo, Tears, Meadows, Becton, & Charles, 2007; Weitzer & Tuch, 2002). Supporting this position is research demonstrating that, compared with Whites, Blacks are far more likely to be arrested, and prosecuted, and to receive harsher and longer sentences (Bales & Piquero, 2012; Barnes & Kingsnorth, 1996; Hartney & Vuoung, 2009).
The second set of explanations focuses on behavioral differences that follow from Blacks’ history of slavery, oppression, and social disadvantage. Although officially equal before the law, social inequality persists. In comparison with White Americans, current estimates show that Blacks have lower average annual income (US$36,898 vs. US$62,950), higher poverty rates (24% vs. 9%), lower homeownership rates (42% vs. 72%), and lower education levels (Callis & Kresin, 2018; Proctor, Semega, & Kollar, 2016; U.S. Census Bureau, 2017b). Consequently, social oppression and discrimination can lead Blacks to seek other or illicit means to achieve common societal goals (e.g., theft, burglary, or robbery; Agnew, 1992; R. L. Simons, Chen, Stewart, & Brody, 2003; Tatum, 2002).
Social oppression can increase the risk of developing psychological risk factors associated with general and violent crimes. For example, compared with Whites, Blacks have more antisocial attitudes (e.g., negative attitudes toward society) and antisocial personality (e.g., impulsivity, anger; Agnew, 2006; Arbona & Power, 2003). Furthermore, the disorganized social environments caused by poverty and oppression could inhibit the development of self-control due to the lack of opportunities for conventional bonding (e.g., family, school; Gottfredson & Hirschi, 1990; Reiss, 1951). Self-control is a strong predictor of a variety of delinquent behavior (e.g., vandalism, drug use, assault; Pratt & Cullen, 2000; Vazsonyi & Crosswhite, 2004) and is facilitated by positive, stable relationships with family and friends, and opportunities for success in school and work.
Blacks under an unequal social structure (e.g., poverty or low socioeconomic status [SES]) might develop a subculture of violence (i.e., norms that support violent behavior; Anderson, 1999; Brezina, Agnew, Cullen, & Wright, 2004; Wolfgang, 1958). In circumstances where parental monitoring is low, and individuals feel not accepted by society, such individuals may feel insecure in their environments and have little hope for their futures. Individuals with low security may try to protect themselves and learn norms present in the street (e.g., toughness is both a virtue and a necessity; Anderson, 1999; Brezina et al., 2004). Individuals who follow the code of street are more likely to engage in violent acts (e.g., assault, gang fights; Stewart & Simons, 2010).
Predictive Validity of Risk Assessment Instruments Across Racial Groups
Even if there are differences in the levels of certain characteristics shown to be associated with sexual crime, further research is required to identify the extent to which these factors have the same meaning across racial/ethnic groups. Over the last few decades, considerable research (on predominantly White samples) has identified the risk factors for sexual recidivism (Hanson & Bussière, 1998; Hanson & Morton-Bourgon, 2005; Mann et al., 2010; Whitaker et al., 2008). Many structured risk assessment instruments designed to predict the risk of sexual recidivism have been developed by combining particular risk factors.
The Static-99R (Hanson & Thornton, 2000; Helmus, Thornton, Hanson, & Babchishin, 2012) is the most widely used structured (actuarial) risk assessment instrument for adult sexual offenders utilized by forensic experts in the United States (Neal & Grisso, 2014). The Static-99R contains both general crime factors (e.g., nonsexual violent offense) and sexual crime–specific risk factors (e.g., noncontact sex offense and any male victims; Brouillette-Alarie, Babchishin, Hanson, & Helmus, 2016; Brouillette-Alarie & Proulx, 2018). Considerable research has found overall moderate predictive validity for the Static-99R (area under the curve [AUC] = .70,n = 8,106, k = 23; Helmus, Hanson, Thornton, Babchishin, & Harris, 2012).
Actuarial risk assessment instruments use prespecified risk factors and explicit combination rules to estimate the recidivism rates. Consequently, actuarial risk tools provide little room for cultural evaluator bias in administration and interpretation (Dawes, Faust, & Meehl, 1989; Kleinmuntz, 1990; Meehl, 1954). Nevertheless, actuarial risk tools can be biased when they systematically (i.e., nonrandom error) overestimate or underestimate the sexual recidivism risk for particular racial/ethnic groups (Reynolds, 2000; Reynolds & Suzuki, 2013). Given that the development and normative samples of Static-99R included predominantly White samples (an underrepresented racial group in the sex offender population), research is required to evaluate the potential existence of a cultural test bias within Static-99R for racial minority groups (e.g., Blacks, Hispanics, or Asians). Blacks may demonstrate substantially different patterns in the general and sexual criminality due to societal oppression (e.g., poverty), and/or their unique cultural qualities not reflected in predominantly White normative samples (e.g., “Nguzo Saba” [an African communitarian philosophy], religious values, or moral values; Grills & Longshore, 1996; Latzer, 2018; Sanchez, Hamilton, Gilbert, & Vandewater, 2018). Ignoring the potential cultural/racial differences in general and sexual criminality may lead to cultural test bias in the instruments.
There are many possible sources of cultural test bias (e.g., inappropriate content, measuring different constructs, differential predictive validity; Reynolds, 2000; Reynolds & Suzuki, 2013). Given the main purpose of using Static-99R is assessing the likelihood of sexual recidivism, demonstrating a lack of cultural bias in predictive validity is necessary and generally sufficient to justify its use for different racial and ethnic groups in the criminal justice system. It is not necessary that the same items function identically for all racial and ethnic groups provided that the results of the overall scale support the same interpretations (i.e., the same inferences from the same scores). Predictive validity involves two main components: discrimination (how large are the differences in Static-99R scores between those who reoffend and those who do not reoffend) and calibration (how well the estimated recidivism probability from the scale’s norms corresponds with the observed recidivism probability of new samples).
Table 1 presents five studies that have evaluated the predictive validity of Static-99R for Blacks. Compared with Whites, Black sex offenders are younger and have consistently higher Static-99R scores; however, they have similar sexual recidivism rates. The discrimination (AUC values) of Static-99R for Blacks was moderate but generally lower than for Whites. Concerning calibration, the norms of Static-99R slightly overestimated the sexual recidivism rates for Blacks (Hanson, Lunetta, Phenix, Neeley, & Epperson, 2014; Lee & Hanson, 2017; Lee, Hanson, Fullmer, Neeley, & Ramos, 2018). In summary, Static-99R predicts sexual recidivism for Blacks, but perhaps not as well as for Whites.
Predictive Accuracy of Static-99R for Blacks and Whites.
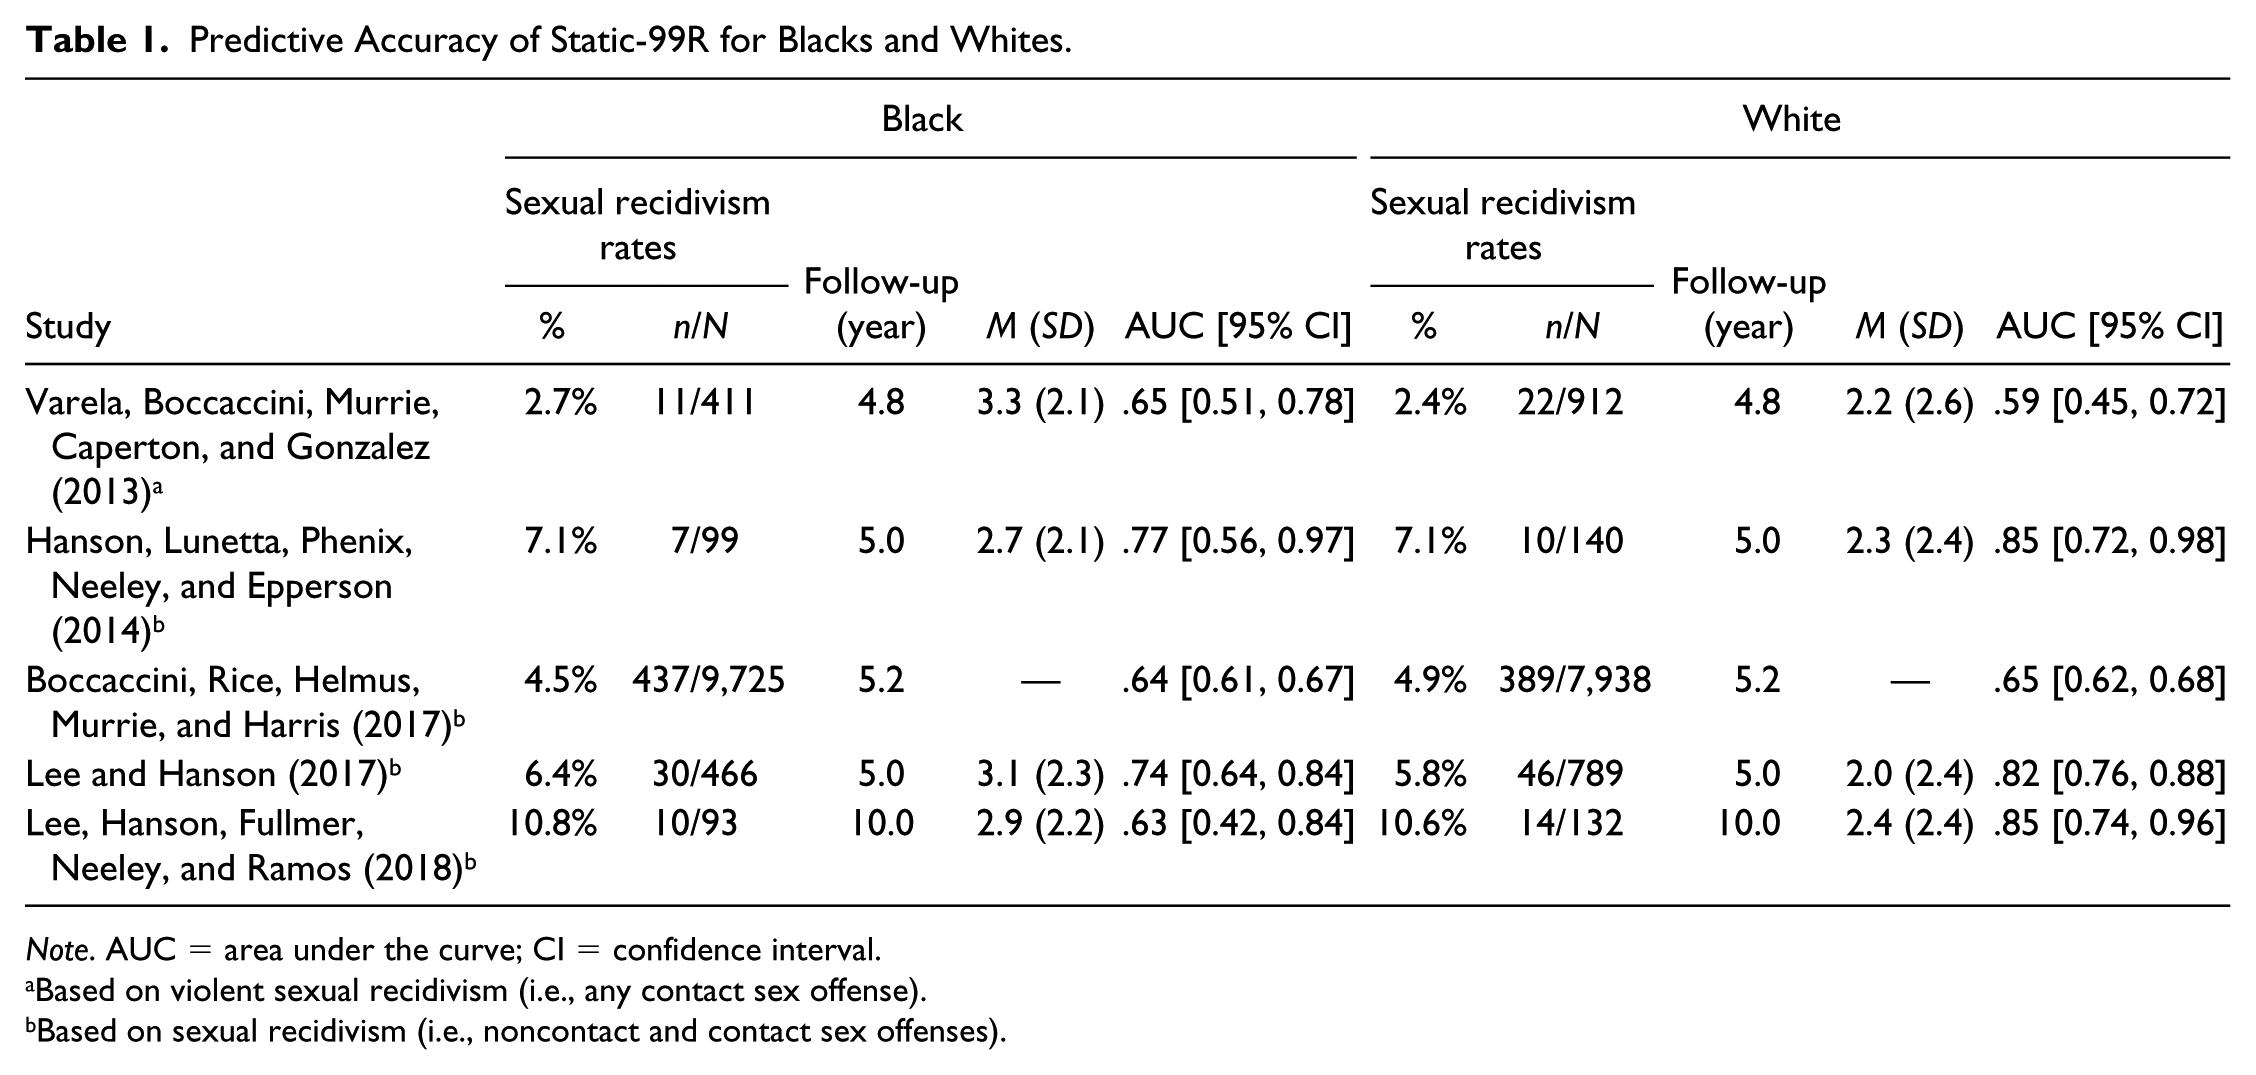
Note. AUC = area under the curve; CI = confidence interval.
Based on violent sexual recidivism (i.e., any contact sex offense).
Based on sexual recidivism (i.e., noncontact and contact sex offenses).
Current Study
The purpose of this study was twofold: (a) examine whether Whites with a history of sexual offending have different patterns on risk-relevant characteristics from Blacks and (b) examine whether the Static-99R predicts sexual recidivism risk differently for Whites and Blacks (i.e., cultural test bias). Based on the previous research findings, the main hypotheses were (a) Blacks will score higher on Static-99R than Whites; (b) Blacks will be younger and have lower SES than the White group; (c) Blacks will be less likely to report childhood sexual and physical abuse experiences than Whites; (d) Blacks will have fewer indicators of sexual deviancy (e.g., pedophilia, sexual criminality) than Whites; (e) Blacks will have more antisocial features than Whites; (f) Static-99R will show moderate discrimination for Blacks, but less than that observed for Whites; and (g) Static-99R will overestimate recidivism risk for Blacks but not for Whites.
Method
Sample
The sample was from a larger study examining sex offender management, treatment, and civil commitment (Mercado, Jeglic, & Markus, 2011). All individuals in this study were adult males who were convicted of a sexual offense. In total, 1,585 individuals were included in this study; 788 were Black and 797 were non-Hispanic White. The racial classifications were based on the State of New Jersey Department of Correction’s designations. Of the total sample, 21% (n = 325) was legally designated as sexually violent predators (SVPs). The sample was selected from individuals who had been detained at either the Adult Diagnostic Treatment Center (ADTC) or any of New Jersey State Prisons (Supplemental Table S1). The ADTC is the sex offense–specific treatment center for individuals who are incarcerated as well as who are at highest risk. In practice, most of the clients are individuals who committed offenses against children, who admit to their crimes, and who are motivated to participate in treatment. Those not classified as SVPs were released from custody between 1996 and 2007.
Measures
Static-99R
Static-99R (Hanson & Thornton, 2000; Helmus, Thornton et al., 2012) is a 10-item empirical actuarial risk tool designed to assess the risk of sexual recidivism among adult males with a history of sexual offending. Static-99R is identical to Static-99 except that it contains revised age weights. The total score (ranging from −3 to 12) is calculated by summing all item points and can be used to place individuals in one of five risk categories: Level I—very low risk (scores of −3 to −2), Level II—below average risk (scores of −1 to 0), Level III—average risk (scores of 1 to 3), Level IVa—above average risk (scores of 4 to 5), and Level IVb—well above average risk (scores of 6 or higher; Hanson, Babchishin, Helmus, Thornton, & Phenix, 2017). Static-99R scores were computed from Static-99 scores by using the individual’s date of birth to calculate the updated age item. The Static-99R total score was found to have good interrater reliability in previous studies (intraclass correlation [ICC] = .78 [.64, .90]; Hanson et al., 2014). In this study, the interrater reliability of Static-99 (n = 30) was found to be excellent (ICC = .89; Quesada, Calkins, & Jeglic, 2014).
Minnesota Sex Offender Screening Tool–Revised (MnSOST-R)
The MnSOST-R (Epperson et al., 1998) is a 16-item actuarial risk assessment tool designed to predict sexual recidivism among adult males with a history of sexual offending. Twelve items are static risk factors (historical), and four items are dynamic risk factors (institutional). In the current study, MnSOST-R total scores were not used; instead, selected items were used to assess sexual criminality (e.g., length of sexual offending history) and general criminality (e.g., adolescent antisocial behavior, substantial drug, and alcohol abuse).
Pervasive Anger scale
Pervasive Anger scale was developed as a subscale of Massachusetts Treatment Center: Child Molester Typology–Version 3 (MTC: CM3; Knight, Carter, & Prentky, 1989). It was scored in this study by clinicians at the ADTC. Pervasive anger was measured by five items (e.g., lost temper, verbal aggression, assaults, aggressive fantasies, and cruelty to animals). Each item was scored 0 (absent) or 1 (present). The total score can range from 0 to 5, with higher scores indicating more anger symptoms.
In this study, pervasive anger scores were calculated only if there was no more than one item with missing information (N = 466). The five items related to pervasive anger were summed with an average score of 1.01 (SD = 1.34) and had good internal consistency (ordinal α = .84). For binary and ordinal response scales, ordinal alpha more accurately estimates reliability by using polychoric correlation matrix than Cronbach’s alpha using Pearson correlation matrix (Gadermann, Guhn, & Zumbo, 2012; Zumbo, Gadermann, & Zeisser, 2007).
General Criminality scale
This scale was developed for this study. General criminality was measured by eight items: three from the Static-99R (index non-sexual violence, prior non-sexual violence, and 4+ prior sentencing dates) and five from the MnSOST-R (sex offense under supervision, adolescent antisocial behavior, substantial drug and alcohol abuse, employment history, and discipline history while incarcerated).
General criminality scores were calculated only if there was no more than one item with missing information (N = 1,214). The eight items related to general criminality were summed with an average score of 2.57 (SD = 1.90, range = 0 to 10, N = 1,214) and had good internal consistency (ordinal α = .74, Gadermann et al., 2012; Zumbo et al., 2007).
Sexual Criminality scale
This scale was developed for this study. Sexual criminality was measured by six items: five from the Static-99R (prior sex offenses, non-contact sex offenses, the unrelated victim, stranger victim, and male victim) and one from MnSOST-R (length of sexual offending history). Sexual criminality scores were calculated only if there was no more than one item with missing information (N = 1,581). The six items related to sexual criminality were summed with an average score of 2.06 (SD = 1.58, range = 0 to 8, N = 1,581) and had acceptable internal consistency (ordinal α = .70, Gadermann et al., 2012; Zumbo et al., 2007).
Paraphilia scale
This scale was developed for this study. Paraphilia was measured by eight binary items: diagnosis of pedophilia, paraphilia (not otherwise specified), and exhibitionism; any molestation of a child, using pornography in the offense, any exhibitionism/voyeurism offenses, non-contact sexual crime (Static-99R item), and any male victims (Static-99R item). Paraphilia scores were calculated only if there were no more one item with missing information (N = 1,376). The eight items related to paraphilia were summed with an average score of 1.40 (SD = 1.07, range = 0 to 6) and had acceptable internal consistency (ordinal α = .69, Gadermann et al., 2012; Zumbo et al., 2007).
Sexual recidivism
Sexual recidivism was defined as any subsequent conviction for a sexual offense (contact or non-contact) after release. Recidivism data were accessed from the New Jersey State Police criminal records database through June 2009. These records include criminal records from the state of New Jersey as well as other states who share their records with the New Jersey State Police.
Procedure
Trained graduate assistants coded the data used in this study, including demographic characteristics (e.g., age and race/ethnicity), offense history (e.g., type and number of past sexual and non-sexual offenses), institutional behavior, victim characteristics (e.g., age and gender), and risk assessment scores (i.e., Static-99 and MnSOST-R).
Plan of Analysis
Comparing the risk-relevant characteristics
For assessing the relationship of characteristics between Blacks and Whites, the AUC analysis (Swets, Dawes, & Monahan, 2000) was used. The AUC can vary between 0 and 1, with .50 indicating no difference in the characteristics between Blacks and Whites. AUCs above .50 indicate that Blacks have higher levels of the risk-relevant characteristics compared with Whites. As a rough heuristic, an AUC of .56 corresponds to small effect size, while .64 reflects moderate effect, and .71 reflects a large effect size (Rice & Harris, 2005). In contrast, AUCs below .50 indicate that Whites have higher levels of the risk-relevant characteristics compared with Blacks (.44 for a small effect, .33 for moderate effect, and .29 for larger effect). An AUC value is statistically significant if the 95% confidence interval (CI) does not include .50.
When a risk factor was a binary variable, odds ratio (instead of AUC) was calculated with 0.5 added to each cell to stabilize the variance (Fleiss & Berlin, 2009). An odds ratio is defined as p / (1 − p), where p is the raw proportion of the sample with the characteristic. Odds ratios above 1 indicate that Blacks have higher levels of the risk-relevant characteristics compared with Whites. For example, an odds ratio of 2 can be interpreted that the odds that Black has the risk-relevant characteristic were twice as high as the odds for Whites. No association is indicated when the 95% CI of the odds ratio contains 1 (i.e., the odds are equal for both groups).
Predictive validity of Static-99R
Assessing the predictive accuracy of a risk scale requires considering calibration (correspondence between expected and observed recidivism rates) as well as discrimination (how different are recidivists from non-recidivists?). For discrimination, we used two statistical methods: (a) the AUC from receiver operating characteristic (ROC) analysis (Swets et al., 2000) and (b) odds ratios from logistic regression (Hosmer & Lemeshow, 2002). For calibration, we used two indices: (a) E/O index (the ratio of the expected number of recidivists divided by an observed number of recidivists; Hanson, 2017) and (b) fixed-effect meta-analysis of logistic regression parameters (Borenstein, Hedges, Higgins, & Rothstein, 2009; Hanson & Broom, 2005).
AUC
AUC values also can be interpreted as the probability that a randomly selected recidivist would have a more deviant score than a randomly selected non-recidivist. AUC values are expected to be smaller in prognostic studies than in diagnostic studies because the outcome of interest in prognostic studies does not exist at the time of assessment, and may never happen (Helmus & Babchishin, 2017; Royston, Moons, Altman, & Vergouwe, 2009). The AUC has an advantage of insensitivity to base rates and robustness to outliers (Ruscio, 2008). An AUC value is statistically significant if the 95% CI does not include .50.
Odds ratios
Odds ratios indicate the change in relative risk associated with one unit change in Static-99R scores. For example, Static-99R scores are associated with a consistent relative risk increase of approximately 1.45 (Hanson, Thornton, Helmus, & Babchishin, 2016), which means the odds of recidivism increases 1.45 times as each Static-99R score increases. The primary advantage is that it is less influenced by a restriction of range compared to AUCs (Hanson, 2008).
E/O index
The E/O index is a measure of calibration in which the expected number of recidivists is divided by an observed number of recidivists (Hanson, 2017). Perfect calibration is indicated by an E/O index of 1.0. Following Rockhill, Byrne, Rosner, Louie, and Colditz (2003), the 95% CIs for the E/O indices were computed as follows:

The expected number of recidivists was based on the 5-year sexual recidivism rates for routine/complete samples reported by Hanson et al. (2016).
Comparing logistic regression parameters
A second method of testing calibration was to examine the extent to which logistic regression parameters, such as intercept values (centered on Static-99R scores of 2), differed from the logistic regression parameters for the 5-year routine sample norms (Table 7: B02 = −2.827, SE = 0.079; B1 = 0.368, SE = 0.025l; Hanson et al., 2016). Specifically, the B02 represents the expected recidivism rate for a Static-99R score of 2 (p2) in logit units (ln[p2 / {1 − p2}]). Differences between the parameters in the current sample and those of the norms were tested using fixed-effect meta-analysis (Borenstein et al., 2009; Hanson & Broom, 2005).
Results
The Static-99R total scores for Blacks (M = 3.3, SD = 2.2, n = 788) were significantly higher than for Whites (M = 2.5, SD = 2.5, n = 797; AUC = .60, 95% CI = [0.57, 0.63]). Compared with the norms of Static-99R (Hanson, Lloyd, Helmus, & Thornton, 2012), Blacks in this sample were underrepresented in Levels I and II (below average risk groups), whereas White sex offenders were proportional with the norms in Levels I and II. On the contrary, in Levels IVa and IVb (above average risk groups), both racial groups were overrepresented, but more so for Blacks (Supplemental Figure S1).
Comparing Risk-Relevant Characteristics
Blacks were, on average (M = 37.5, SD = 10.3, n = 788), significantly younger than Whites (M = 41.8, SD = 13.1, n = 797). Blacks displayed lower rates of marriage (odds ratio = 1.24) but were more likely than Whites to have children (odds ratio = 1.82; Supplemental Table S1).
Compared with Whites, Blacks had a significantly lower SES level (see Supplemental Table S2). Specifically, Blacks were less likely to earn more than US$20,000 annually (odds ratio = 2.12), less likely to have been employed (odds ratio = 1.91), and less likely to have a high school degree (odds ratio = 1.69).
Regarding early childhood adversity, Blacks were less likely than Whites to have been raised in a home with both parents up to age 13 (odds ratio = 2.32). Blacks were, however, less likely to have reported childhood physical and sexual abuse (odds ratios = 0.63–0.69; Table 2).
Early Childhood Adversity.
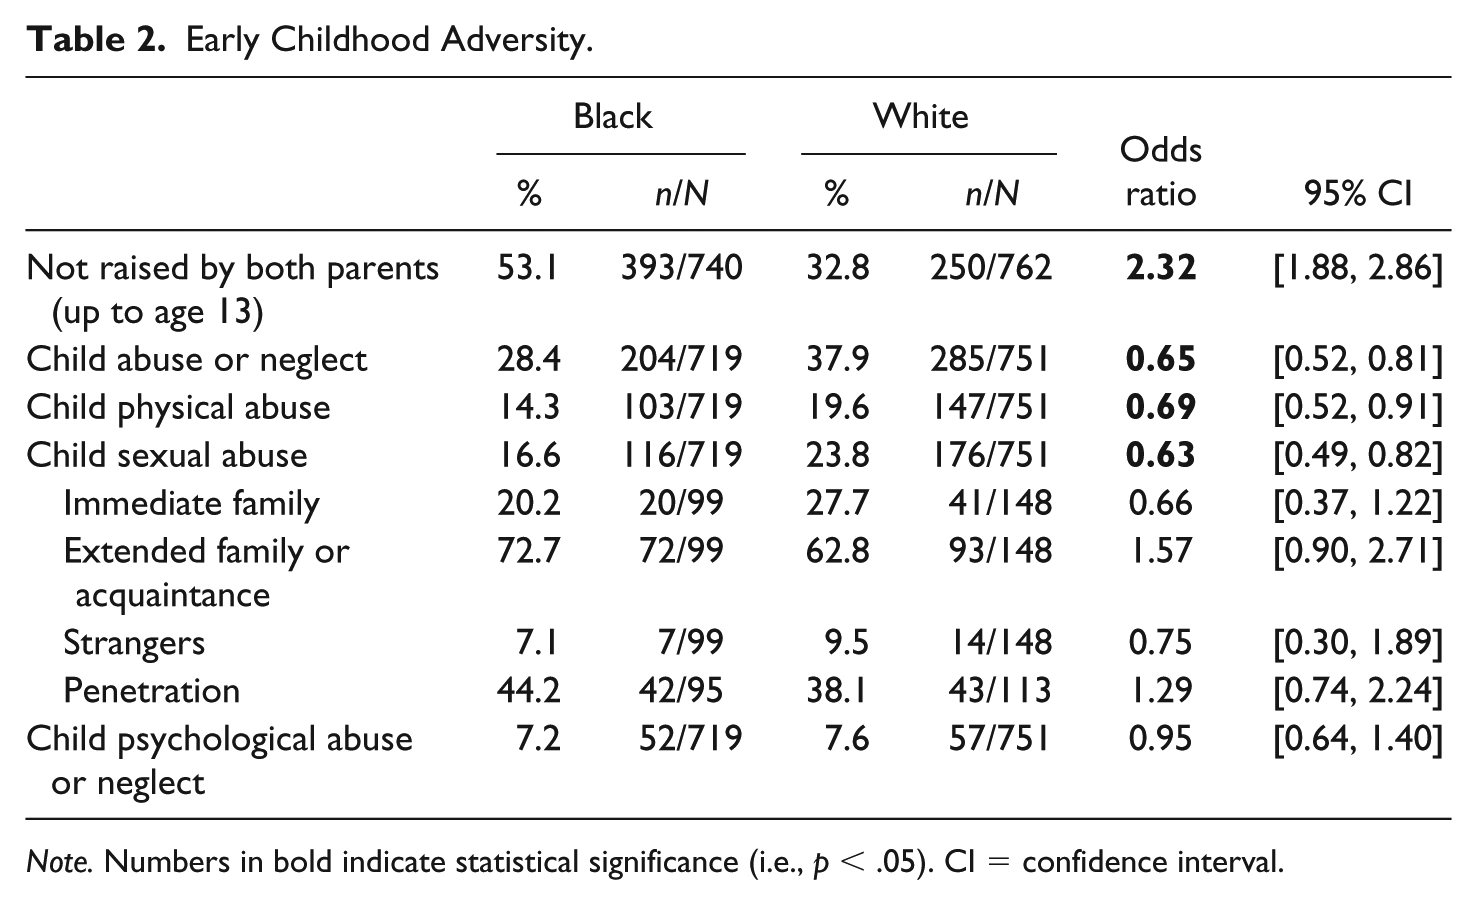
Note. Numbers in bold indicate statistical significance (i.e., p < .05). CI = confidence interval.
Blacks were assessed as having higher hostility levels than Whites. Specifically, Blacks were rated to have significantly higher pervasive anger symptoms (M = 1.3, SD = 1.4, n = 243) than Whites (M = 0.8, SD = 1.2, n = 223; AUC = .58). In addition, Blacks were noted as more likely to use force, threat, and violent behavior during the sexual offense compared with Whites (odds ratios of 1.80, 1.47, and 2.33, respectively). There were, however, no significant differences in sexual sadism disorder and impulsivity level between Blacks and Whites (Table 3).
Hostility (Sadism, Anger, Impulsivity).

Note. Numbers in bold indicate statistical significance (i.e., p < .05). AUC = area under the curve; CI = confidence interval.
Blacks showed fewer indicators or paraphilia than did Whites (paraphilia scale total score AUC = .36). Compared with Whites, Blacks were significantly less likely to be diagnosed as having pedophilia (odds ratio = 0.42). Similarly, Blacks were less likely to have minor and/or male victims compared with Whites (odds ratios = 0.58 and 0.39). Blacks were less likely to use pornography during the sexual offense than Whites (odds ratio = 0.16). In addition, Blacks were less likely to be involved in non-contact sex offenses (odds ratio = 0.38), specifically for exhibitionism and voyeurism offenses (odds ratio = 0.25; Table 4).
Paraphilia.

Note. Numbers in bold indicate statistical significance (i.e., p < .05). CI = confidence interval; AUC = area under the curve; NOS = not otherwise specified.
Blacks showed more general criminality than Whites (AUC = .66). The average age at first non-sexual offense for Blacks (M = 19.9, SD = 5.9) was significantly lower than for Whites (M = 21.4, SD = 7.7; AUC = .56). Blacks were also more likely to have a history of adolescent antisocial behavior, and more likely to have been charged or convicted as a juvenile. Compared to Whites, Blacks had a greater history of non-sexual violent offending (odds ratio = 2.46; Table 5).
General Criminality.
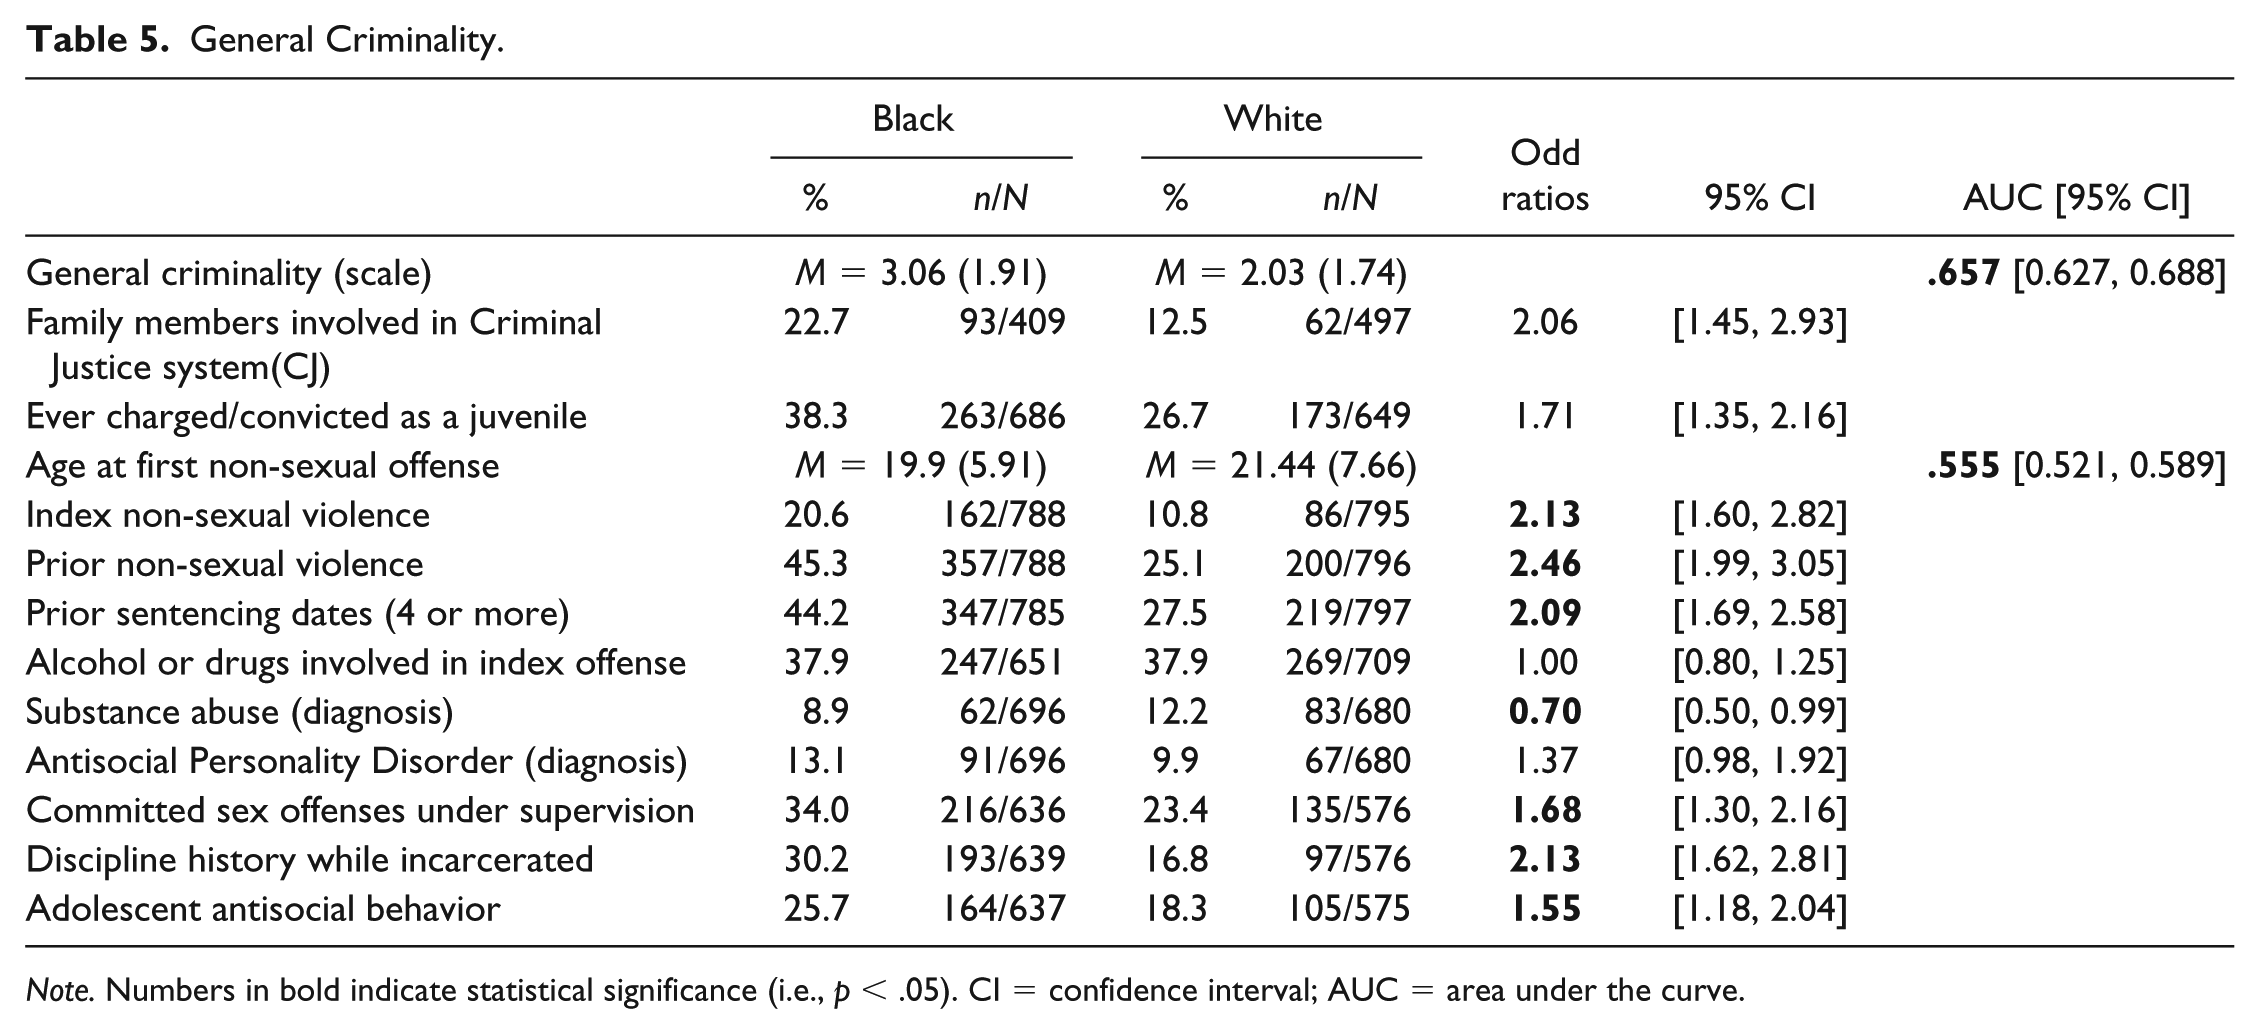
Note. Numbers in bold indicate statistical significance (i.e., p < .05). CI = confidence interval; AUC = area under the curve.
There was no significant difference in sexual criminality scale between Blacks and Whites. Blacks engaged in their first sexual offense at a younger age (M = 27.7, SD = 10.2, range = 10-77) than Whites (M = 30.5, SD = 12.3, range = 7-73), although the absolute difference was only 3 years. Blacks were more likely to have unrelated/stranger victims for sexual crimes whereas Whites were more likely to have related victims (e.g., family members; odds ratios = 1.44 and 1.31; Table 6).
Sexual Criminality.

Note. Not completed sex offender treatment (MnSOST-R item). Numbers in bold indicate statistical significance (i.e., p < .05). CI = confidence interval; AUC = area under the curve; SVP = sexually violent predators; MnSOST-R = Minnesota Sex Offender Screening Tool–Revised.
Blacks were less likely than Whites to have a history of psychiatric problems, serious medical conditions, or suicide attempts (odds ratios of .50 to .65; Table 7).
Mental Health.
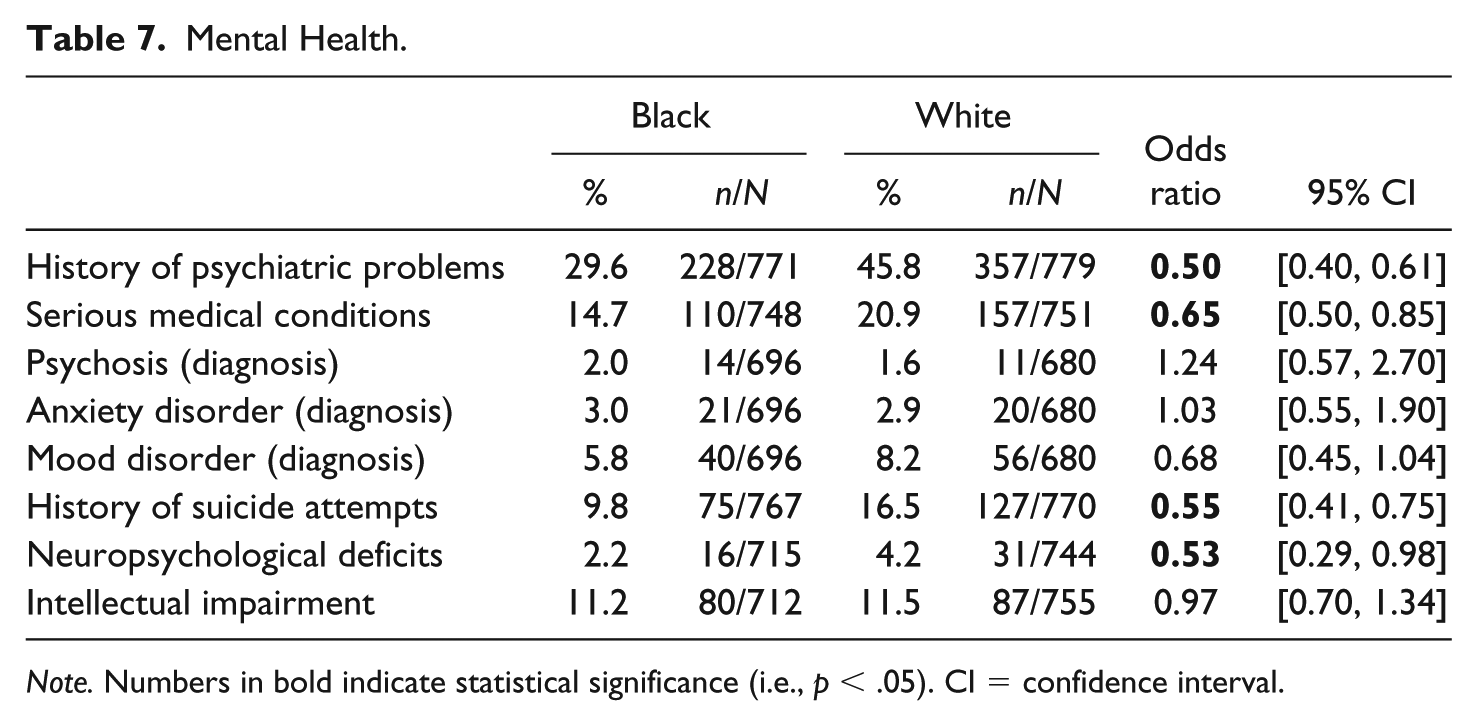
Note. Numbers in bold indicate statistical significance (i.e., p < .05). CI = confidence interval.
Predictive Validity of Static-99R Within a Fixed 5-Year Follow-Up Period
Of the initial 1,585 cases, 676 were eliminated because they had no follow-up information (including 325 civilly committed sex offenders, that is, SVPs) and 336 were eliminated because they had less than 5 years between their release date and the date of follow-up (June 2009). Of the remaining 573 offenders, 291 were Black and 282 were non-Hispanic White.
The average age of the Black follow-up group (M = 37.4, SD = 10.3) was lower than that of the White follow-up group (M = 39.0, SD = 12.4), but not statistically significant (AUC = .53, 95% CI = [0.48, 0.58]). As with the full sample, the Static-99R total scores of Blacks (M = 2.7, SD = 2.1, n = 291) were significantly higher than those of the Whites (M = 2.2, SD = 2.3, n = 282; AUC = .57, 95% CI = [0.52, 0.62]; Table 8).
Five-Year Sexual Recidivism Rates, Static-99R Scores, and AUC Values for Whites and Blacks.

Note. Based on a fixed 5-year follow-up period. Numbers in bold indicate statistical significance (i.e., p < .05). AUC = area under the curve; CI = confidence interval.
Discrimination
Using the fixed 5-year follow-up, the AUC with sexual recidivism for the full sample was .77 [0.69, 0.86]. Static-99R was able to discriminate recidivists from non-recidivist for both Blacks and Whites (all AUCs > .76; Table 8). Contrary to expectations, the AUC value of Blacks (AUC of .78) was slightly higher than AUC value of Whites (AUC of .76; Table 8; Supplemental Figure S2), although the difference was not significant.
Both major dimensions associated with sexual recidivism (general criminality and sexual criminality) discriminated recidivists from non-recidivists equally well for both Blacks and Whites (all AUCs > .65; Supplemental Table S3). Contrary to expectations, however, the paraphilia scale created for this study was unrelated to recidivism for both Blacks and Whites; the direction of the trends was for lower paraphilia scale scores to be associated with greater sexual recidivism risk (Supplemental Table S3).
The 5-year sexual recidivism rates at a Static-99R score of 2 for two racial groups were very similar (2.1% for Blacks and 2.3% for Whites; Qbetween = 0.02, df = 1, p = .881; Supplemental Table S4). The discrimination (change in relative risk) was higher for Black sex offenders (odds ratios = 1.77 and 1.54 for Whites), but, again, the differences between racial groups were not statistically significant (Qbetween = 0.435,df = 1, p = .509; Supplemental Table S4).
Calibration
For the full sample, the logistic equation indicated a relative risk increase of 1.65 for each increase in Static-99R score (e.501 = 1.65), and an adjusted 5-year sexual recidivism rate of 2.3% for a Static-99R score of 2 ([1 / {1 + e−(−3.768)}] = .0226. When compared to the norms (from Hanson et al., 2016), the adjusted (score of 2) base rate was significantly lower (B02 of −3.77 vs. −2.83; Qbetween = 7.99, df = 1,p = .004), and the discrimination was larger, but not significantly (B1 = 0.501 vs. 0.368; Qbetween = 1.52, df = 1, p = .218; Supplemental Table S5).
Overall, the adjusted base rates (B02) of each racial group were significantly lower than the norms (5.6% vs. 2.1% for Blacks and 2.3% for Whites). Relative risk rates for each racial group were greater than the norms, but there was no significant difference among those values (all p values > .05; Supplemental Table S5).
The E/O index also indicated that the observed 5-year overall recidivism rate in this sample was significantly lower than the norms (4.7% vs. 8.4%; E/O index = 1.79 [1.23, 2.61]; Supplemental Table S6). When comparing each of the five Static-99R risk categories, only Level III (average risk; scores of 1, 2, and 3) showed significantly lower observed values than the expected values (2.8% vs. 6.1%; E/O index = 2.15 [1.03, 4.51]; Supplemental Table S6).
Figure 1 provides a plot of the observed recidivism rates per Static-99R risk score, the rates based on the smoothed logistic curve fitted to this data, and the recidivism rate norms for routine samples (Hanson et al., 2016). As can be seen in Figure 1, the general pattern is that the sexual recidivism rates were lower than expected.
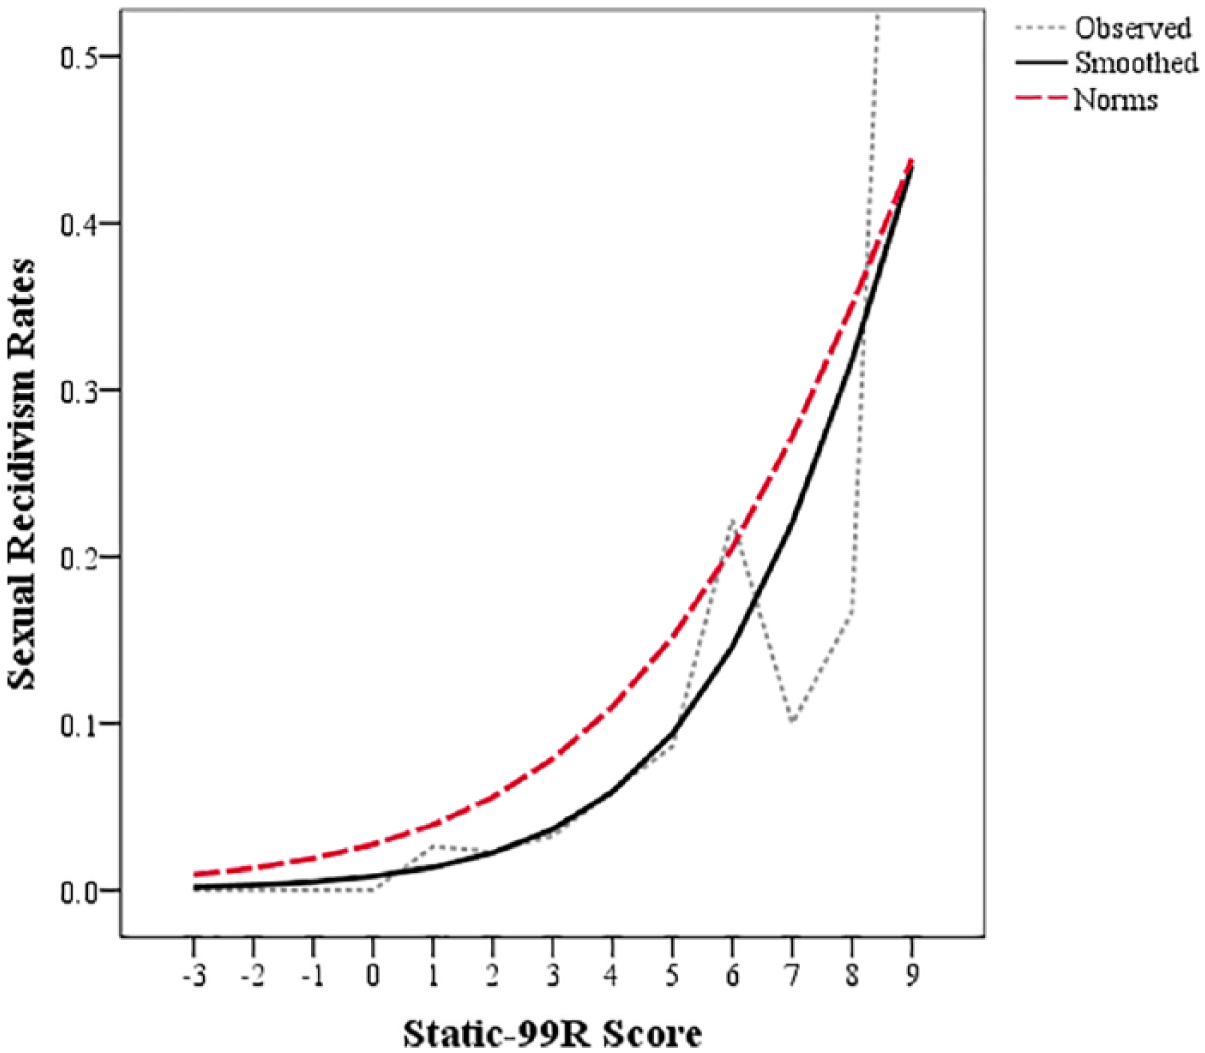
Observed and expected recidivism rates based on Static-99R 5-year sexual recidivism rates.
For White sexual offenders, the observed 5-year overall recidivism rate was lower than expected rate (3.9% vs. 7.9%; E/O index = 2.03 [1.12, 3.66]; Supplemental Table S6 and Figure 2). For Black sex offenders, the observed 5-year overall recidivism rate was also lower than the expected rate, but the difference was not significant (5.5% vs. 8.9%; E/O index = 1.63 [0.99, 2.65]; Supplemental Table S6 and Figure 2).
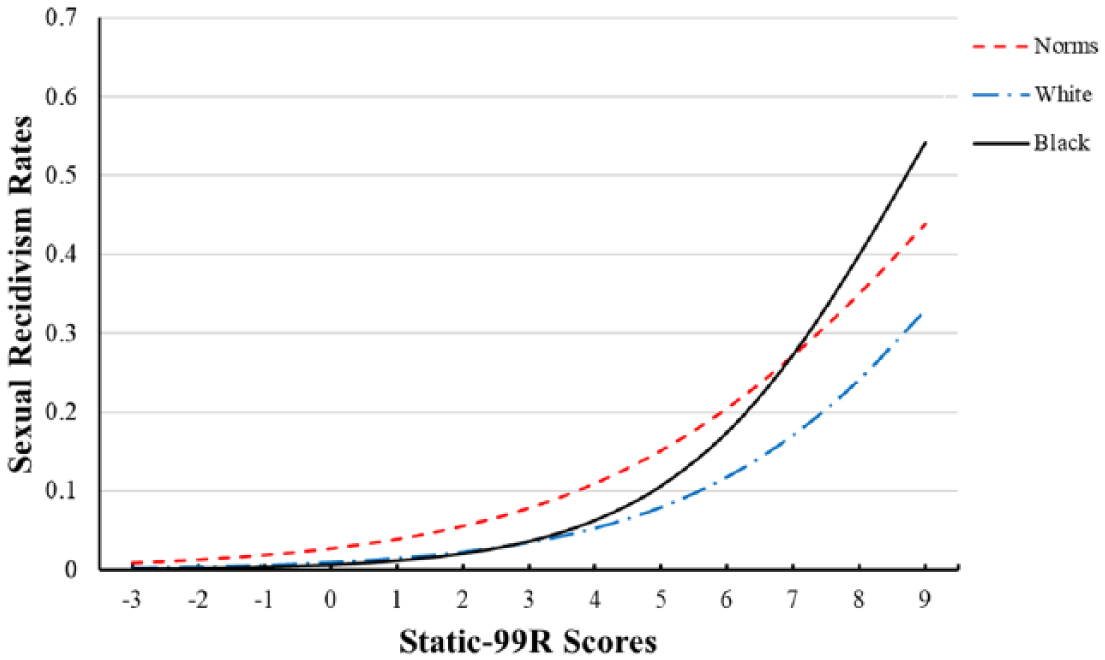
Logistic curves for White and Black racial groups with the norms.
Although Blacks showed more general criminality than Whites, general criminality similarly predicted sexual recidivism for both Blacks and Whites (odds ratios = 1.30 and 1.35, respectively). There was no significant interaction between general criminality and race with the 5-year sexual recidivism (Wald χ2 = .031; p = .860). In addition, sexual criminality also discriminated recidivists from non-recidivists equally well for Blacks and Whites (odds ratios = 1.68 and 1.56). There was no significant interaction between sexual criminality and race with the 5-year sexual recidivism (Wald χ2 = .093; p = .760).
Discussion
The main purposes of the current study were to examine whether Whites who commit sexual crimes have different patterns of risk-relevant characteristics from Blacks who commit sexual crimes and, if so, to test whether these differences influence the predictive validity of a commonly used actuarial risk assessment instrument for sex offenders: Static-99R. The study found that Blacks displayed higher general criminality (i.e., antisociality), whereas Whites appeared more paraphilic (i.e., pedophilic interests). Despite the differences, however, the Static-99R predicted sexual recidivism equally well for both Blacks and Whites. Furthermore, the two major dimensions associated with sexual recidivism risk—sexual criminality and general criminality—both predicted sexual recidivism equally well for both racial groups. The paraphilia scale created for this study was, strangely, unrelated to sexual recidivism for either racial group given that strong relationship between paraphilia and sexual recidivism in previous studies (Hanson & Morton-Bourgon, 2005); this finding is difficult to explain other than by unknown, idiosyncratic features of the current study.
As hypothesized, Blacks who commit sexual crimes had elevated levels of antisocial behavior compared with Whites who commit sexual crimes. For example, Blacks had a greater history of adolescent antisocial behavior and had more criminal charges, convictions, or sentencings as a juvenile and as an adult compared with Whites. We also found that Blacks who commit sexual offenses had, on average, lower SES, lower levels of education, and lower levels of employment than Whites who commit sexual offenses. These findings are consistent with a large body of empirical work demonstrating an association between social oppression/discrimination, disadvantaged and unstable family environments, and the likelihood of engaging in antisocial behavior and attitudes (J. M. Kaufman, Rebellon, Thaxton, & Agnew, 2008; Pérez, Jennings, & Gover, 2008; R. L. Simons et al., 2003).
Like previous studies, this study found that Whites showed more sexually deviant interests and behavior than Blacks. Whites were more likely to molest children and more likely to be diagnosed with pedophilia than Blacks. Also, Whites were more likely to commit non-contact sexual offenses (e.g., exhibition and voyeurism) and more likely to use pornography in their offenses. Despite being a consistent research finding, there are no clear explanations as to why Whites should be more paraphilic than Blacks. It is even difficult to know whether the rates of paraphilia are unusually high among Whites, or unusually low among Blacks. It is possible that the relatively lenient legal dispositions (e.g., beneficial plea bargains, lower rates of prosecution) that privileged Whites can receive in the criminal justice system does not extend to sexual assaults involving children. As well, the low rates of arrest/prosecution for sexual crimes against minors among Blacks may be artificially low because of non-cooperation with police by family members who are the most likely victims of child sexual abuse (Stacey, Martin, & Brick, 2017).
Their different positions in the racial and social hierarchy could result in differing motivations for Whites and Blacks to commit a sexual offense. Blacks, experiencing discrimination and social inequality as a subordinate group, might commit violent sexual crimes (e.g., rape, sexual assault) along with non-sexual violent crimes as an expression of their frustration with their social position or as a reenactment of power and domination by Whites. Experiencing discrimination and prejudice has been empirically supported to significantly increase the likelihood of engaging in delinquent and criminal behaviors among ethnic minority groups, mediated by anger and depression (e.g., Blacks and Hispanics; Pérez et al., 2008; R. L. Simons et al., 2003).
Although we do not know the extent of explicit discrimination experienced by individuals in this study, we can be certain that they were aware of, and influenced by, the widespread social disadvantage and racism against Blacks in the United States (Bales & Piquero, 2012; Hartney & Vuoung, 2009; Proctor et al., 2016; U.S. Census Bureau, 2017b). In contrast, Whites who already have privileges (social and economic power) in the United States would not be acting from a position of systemic disadvantage. White male individuals might feel more sexual entitlement as a dominant class in a family (i.e., patriarchy) as well as a society. They might, thus, have a more distorted belief about sex with children and commit such behavior (e.g., sexual offending against children or incest).
In addition, consistent with the previous findings with men convicted of sexual crimes (Cooper et al., 1996; Fix et al., 2017; Murphy et al., 2001), Whites who commit sexual crimes reported more experiences of sexual and physical abuse during childhood compared with Blacks. The high rates of childhood sexual and physical abuse among Whites contrasts with population data showing that the rates of child sexual and physical abuse are higher for Blacks males (16.5% and 25%, respectively) than Whites males (7.2% and 20%; Dakil, Cox, Lin, & Flores, 2011; Stoltenborgh, van, IJzendoorn, Euser, & Bakermans-Kranenburg, 2011). The contrasting findings may suggest differences in either what Whites and Blacks identify as childhood abuse, or what they are willing to report. At any rate, the findings from the current study suggest that the sexually abused–sexual abuser hypothesis may be more relevant for Whites than Blacks. In addition, a prospective study found a history of childhood physical abuse increased the risk of committing a sexual crime as adults (Widom & Massey, 2015). This association, however, also may be more relevant for Whites than Blacks.
Previous research has suggested a link between child sexual abuse and sexual offending against children or pedophilic interests (e.g., young and male victims; Fedoroff & Pinkus, 1996; Jespersen, Lalumière, & Seto, 2009; K. L. Kaufman & Hilliker, 1996; Levenson, Willis, & Prescott, 2016; D. A. Simons, Wurtele, & Durham, 2008). Nevertheless, most sexually abused victims do not become sexual offenders against children (Salter et al., 2003). Consequently, individual or cultural differences might play a role in the association between sexual abuse history and later sexual offending against children (pedophilic interests).
In addition, sexual crimes among Whites may be related to psychological dysfunctions. The current study found more evidence of dysfunctional coping among Whites than Blacks. It is possible that some of this dysfunctional coping are related to the risk of sexual offending. For example, privileged Whites might be more likely to use sex as a coping method when they are in emotional distress (use of prostitution, pornography, or masturbation), which, in turn, increase the risk of engagement in deviant sexual behaviors (Långström & Hanson, 2006). Population surveys of U.S. sexual practices, however, find little difference in the overall rate of conventional sexual behaviors (masturbation, number of sexual partners) between Whites and Blacks (Laumann, Gagnon, Michael, & Michaels, 1994). We are unaware of any U.S. population surveys on the rates of paraphilic sexual interests and behaviors.
Although Blacks showed less sexually deviant interests and behavior, they are, nonetheless, overrepresented among individuals convicted of sexual offenses (Carson, 2018; U.S. Census Bureau, 2017a). The reasons for this overrepresentation are not fully understood. Racial prejudice in the criminal justice system is well documented and would be one contributing factor. Blacks show disproportionately high rates of arrest compared with Whites across all types of crimes (e.g., murder, aggravated assault, robbery, or burglary; U.S. Census Bureau, 2017a; U.S. Department of Justice, Federal Bureau of Investigation, 2015). However, it is also possible that there are real, behavioral differences in antisociality between Whites and Blacks.
It is also possible that there are some distinct, culturally specific risk factors for sexual offending that were not measured by the current study. For example, it is possible that some negative elements of their family and school experiences (other than sexual abuse) might inhibit the development of appropriate sexual self-regulation strategies and result in increased rates of sexual offending behavior among Blacks. Consequently, future research should explore cultural differences in sexual socialization across racial and ethnic groups. In particular, it would be important to consider the extent to which positive sexual socialization practices are linked to family income, education, and involvement in prosocial community activities (e.g., church attendance).
Another purpose of this study was to examine how well Static-99R assessed sexual recidivism risk for Blacks compared with Whites. Consistent with previous studies, Blacks had a higher Static-99R total score than Whites. The discrimination of Static-99R for both racial groups was good (all AUCs > .76; odds ratios > 1.54) given the average values of relative accuracy (AUC = .70 and odds ratio = 1.45; Hanson et al., 2016; Helmus, Hanson et al., 2012). Contrary to our hypothesis, however, the discrimination of Static-99R for Blacks was slightly better (not worse) than those for Whites.
When compared to the norms for a 5-year routine sample, the observed 5-year sexual recidivism rate (4.7% after 5 years) was significantly lower than the norms (8.34%; E/O = 1.79). Both racial groups showed lower than expected recidivism rates, and there were no differences in the calibration of Static-99R for Blacks compared with Whites. The reasons for the low recidivism rates are not fully known. The low sexual recidivism rates of this specific sample may be related to the research method used (e.g., the accuracy of records), sample selection (excluding high-risk sex offender groups; for example, SVP), or other factors that are not yet fully understood.
Despite the significantly higher score of Static-99R for Blacks than Whites and the different patterns on risk-relevant characteristics between Blacks and Whites, there was no evidence that the risk factors/propensities measured by Static-99R had any differential associations with sexual recidivism for Blacks compared with Whites.
Limitations
The sample used in this study was limited to individuals who were serving a sentence for sexual crimes in prison or a forensic treatment center in the State of New Jersey. The findings of this study, thus, may not generalize to Whites and Blacks convicted of sexual crimes who are being managed in the community, or the different jurisdictions. Specifically, a higher level of paraphilic interests among Whites in this study (i.e., a higher risk group) may not be generalized to Whites who were sentenced to community supervision in lieu of prison time (i.e., a lower risk group).
The meaning of racial and ethnic identity is fluid and is expected to have different features in different times and places. Although there are certain features commonly found among Blacks in the United States, Black culture is not homogeneous, including multiple ethnic groups with distinct cultures (e.g., Jamaicans, West Indians, Somalis, and Nigerians). In addition, given the high rates of undetected or unreported sexual crimes (e.g., rape or sexual assault; Langton, Berzofsky, Krebs, & Smiley-McDonald, 2012), the current sample was unlikely to be representative of all those who engage in sexual offending.
The information regarding child abuse in this study was collected via self-report. Given the cultural values or norms of Black society (e.g., emphasizing on family and community relationships; Boyd-Franklin & Lockwood, 2009; Grills & Longshore, 1996; Mattis & Grayman-Simpson, 2013), relatively low rates of childhood abuse among those who convicted of sexual offenses in this study might be related to the underreporting of sexual or violent abuse, especially in family and community members.
Although the overall sample was large (N = 1,585), the sample size was significantly reduced when examining the predictive validity of Static-99R (n = 573). In subanalyses, there were 291 Blacks (16 recidivists) and 282 non-Hispanic Whites (11 recidivists). Additional research with larger numbers of Blacks is recommended to increase confidence in any conclusions regarding the potential of a cultural test bias of Static-99R for Blacks.
Implications for Research
Further research is needed to explain the different patterns of general criminal behavior and paraphilia between Blacks and Whites who commit sexual crimes. In particular, are there different patterns of sexual self-regulation problems (e.g., sexual preoccupation and using sex as coping) among Blacks and Whites who commit sexual crimes? In addition, researchers should empirically explore potentially race and culture-specific risk or protective factors for Blacks that influence the likelihood, or continuation, of sexual offending.
Another avenue of research could investigate whether the latent constructs (sexual and general criminality) measured by risk assessment instruments are consistent across different racial groups—particularly minorities who are overrepresented in the criminal justice system (i.e., cultural test bias in construct validity; Brouillette-Alarie et al., 2016). Furthermore, the extent to which the two major propensities (general and sexual criminality) are associated with sexual recidivism for Blacks is worthy of further examination.
Implications for Practice
The current findings support the use of Static-99R in risk assessment for both Black and White individuals to identify those at high risk to reoffend sexually (Risk-principle). Even though Static-99R places both Black and White individuals at equivalent risk levels for equivalent scores, there still could be different risk-relevant characteristics between Black and White individuals within the same risk level (Need-principle).
Given that Blacks present as more antisocial, whereas Whites present as more paraphilic, it might be desirable to tailor treatment to these differences. The treatment for Blacks who commit sexual crimes may benefit from an increased focus on antisocial attitudes and behaviors (e.g., anger management, cognitive restructuring, vocational training). In contrast, sex crime–specific treatment may more likely be prioritized for Whites. Such treatment would address the usual targets of managing deviant sexual interest and developing sexual self-regulation. Treatment providers should also expect that they would have an increased need to address general mental health concerns for Whites compared with Blacks.
It is important to remember, however, that both general criminality and sexual criminality were present in both racial groups, and both dimensions were related to the risk of sexual recidivism. Consequently, differences in treatment should be a matter of emphasis rather than creating separate programs that address fundamentally different criminogenic needs.
In general, treatment programming will likely be most effective when it takes into consideration the cultural values or norms of Blacks (e.g., maintaining family relationships, community, racial unity, spirituality, and religion; Boyd-Franklin & Lockwood, 2009; Grills & Longshore, 1996; Mattis & Grayman-Simpson, 2013) as well as socio-demographic characteristics that influence their response to treatment (e.g., low education and SES, systemic oppression, distrust of criminal justice system; Responsivity-principle).
Prevention programs for sexual crimes may also benefit from being tailored to racial and racial differences in risk-relevant characteristics. For example, sexual violence prevention programs for Blacks may be most effective when they focus on education and vocational training as well as antisocial attitudes and delinquencies in adolescence whereas for White individuals, prevention programs may benefit from reducing child sexual abuse and providing treatment for childhood sexual abuse victims. As well, the effectiveness for programs for White individuals may be increased by addressing distorted beliefs about privilege in general, and sexual privilege and entitlement in particular.
Supplemental Material
Supplemental_materials(Table)_2(1) – Supplemental material for Paraphilia and Antisociality: Motivations for Sexual Offending May Differ for American Whites and Blacks
Supplemental material, Supplemental_materials(Table)_2(1) for Paraphilia and Antisociality: Motivations for Sexual Offending May Differ for American Whites and Blacks by Seung C. Lee, R. Karl Hanson, Cynthia Calkins and Elizabeth Jeglic in Sexual Abuse: A Journal of Research and Treatment
Supplemental Material
Supplemental_materials_(Figure) – Supplemental material for Paraphilia and Antisociality: Motivations for Sexual Offending May Differ for American Whites and Blacks
Supplemental material, Supplemental_materials_(Figure) for Paraphilia and Antisociality: Motivations for Sexual Offending May Differ for American Whites and Blacks by Seung C. Lee, R. Karl Hanson, Cynthia Calkins and Elizabeth Jeglic in Sexual Abuse: A Journal of Research and Treatment
Footnotes
Acknowledgements
The authors would like to thank Daryl Kroner and David D’Amora for their feedback on an early version of this article. The authors also thank the New Jersey Department of Corrections and New Jersey Department of Human Services for their support in providing access to files.
Authors’ Note
The opinions, findings, conclusions, and recommendations expressed are those of the authors and do not necessarily reflect those of the institutions that supported this research.
Declaration of Conflicting Interests
The author(s) declared the following potential conflicts of interest with respect to the research, authorship, and/or publication of this article: R. Karl Hanson is a co-author and certified Static-99R trainer. The copyright for Static-99R is held by the Government of Canada and none of the authors receive royalties from this measure.
Funding
The author(s) disclosed receipt of the following financial support for the research, authorship, and/or publication of this article: This research was supported in part by Grant Number NIJ 2007-IJ-CX-0037 from the National Institute of Justice, Office of Justice Programs, U.S. Department of Justice.
Supplemental Material
Supplemental material for this article is available online.
References
Supplementary Material
Please find the following supplemental material available below.
For Open Access articles published under a Creative Commons License, all supplemental material carries the same license as the article it is associated with.
For non-Open Access articles published, all supplemental material carries a non-exclusive license, and permission requests for re-use of supplemental material or any part of supplemental material shall be sent directly to the copyright owner as specified in the copyright notice associated with the article.
