
Abstract
Keywords
Organized spatial displays such as geographic maps and their related texts are two of the most common forms of curricular materials used in school classrooms today. From the elementary school student who uses maps of the United States to learn about American geography to the high school student who studies maps of famous battles from World War II, students are using maps as aids in learning important and vital information. To understand the learning of both prose and visuospatial material, we must review two models of memory, Baddeley’s and Kulhavy’s models.
Baddeley’s (1986, 1992) model of working memory posits four types of working memory: the central executive, the phonological loop, the visuospatial sketch pad, and, the later added, episodic memory. The central executive memory provides oversight to the working memory subsystems. It controls and regulates cognitive processes, including selective attention and inhibition, and coordinates its slave systems, among other tasks. The phonological loop, one of the slave systems, controls auditory memory and phonological information as well as the acquisition of vocabulary. The visuospatial sketch pad deals with the temporary storage and manipulation of both visual and spatial information. The visual system is involved with just remembering essentially what we see and the spatial with the location of these images. Episodic memory is responsible for remembering the context, including the time, place, and associated emotions for a particular stimulus.
A related model of memory, Kulhavy’s model for text learning using organized spatial displays was based on Paivio’s dual coding theory (Paivio, 1986, 2006) and conjoint retention theory (Kulhavy, Lee, & Caterino, 1985). The model states that learning an organized spatial display prior to learning a related text will result in an increase in the learning of both the display and the text. It goes on to say that verbal information from the text is stored in the form of propositions (e.g., van Dijk & Kintsch, 1983) in a verbal store, although visual information in the form of intact images is stored in a visual store. Thus, visual information found in displays is the key to learning with maps and text because it provides several cognitive advantages. First, visual information contains both feature and structural information. Feature information includes the icons, labels, and pictures found within a display. Moreover, feature information also includes what Bertin (1983) calls the retinal variables of color, size, and shape. Second, organized spatial displays also include structural information that details the metric distances between and among the features on a map as well as their distances from the border of the map. It is the structural information found in displays that allows for the creation of intact images that the student can use in learning the related text. Larkin and Simon (1987) refer to this as the computational advantage of graphics. Because images are encoded in an intact manner, they are simultaneously available in working memory to form associative links between the image of the display and the related text. Propositions do not share this advantage because they are stored and searched for sequentially (Anderson, 1983). It is these associative links that Kulhavy and his associates call referential links that allows information in the visual store to act as retrieval cue in the verbal store and vice versa.
This advantage is clearly demonstrated when learners view a display prior to reading a related text when compared with when they study the same materials in a reverse order. In studies comparing map versus text presentations, there were typically two groups of students. One group of students studied a map and then read a related text, and a second group of students studied the same materials in the reverse order. Equal time was given to study each type of curricular material (e.g., Stock, Kulhavy, Webb, Pridemore, & Verdi, 1992; Verdi, Kulhavy, Stock, Rittschof, & Johnson, 1996). The results of these studies were identical. Students in the map-before-text group were able to create intact images of the map and form referential links with the text that provided for an increase in the recall of both feature and factual information. The processing of the text was not seriously hindered because of the images’ representation in working memory. However, this was not the case for those students who studied the text before the map. In these cases, students were first forced to process the text in sequential order as propositions. When asked to then study the map, these learners were faced with a choice that those who learned the map prior to the text did not have to make. If they chose to learn the map, they would lose several of the propositions being held in working memory, thus, resulting in a decrease in text learning. However, if they chose to ignore the map, they could lose the ability to form referential links from the text to the map and once again cause a decrease in their ability to learn the map and text information. In either case, the computational advantage of encoding an intact map image is lost, and hence, recall of related text information is decreased (Kulhavy, Stock, & Kealy, 1993; Stock et al., 1992).
In the general case, when working with participants with typical attentional skills, we have found that learning an organized spatial display prior to learning a related text has resulted in an increase in the learning of both the display and the text. However, Kulhavy’s model has not been tested with atypical groups, for example, participants with symptoms of ADHD. We wanted to see how this group would fare in contrast to typical learners when provided with both visual and textual stimuli.
As a group, children and adolescents with ADHD have been found to perform more poorly in school than nonaffected youth (Barkley, 1998; Forness & Kavale, 2001). Several researchers have studied this phenomenon and found that up to 80% of children with ADHD exhibit learning and achievement problems (e.g., Cantwell & Baker, 1991; Frick et al., 1991). After completing a review of 17 studies related to ADHD and learning disabilities, DuPaul and Stoner (2003) estimated that the rate of learning disabilities was 3 to 4 times greater for children with ADHD than those without ADHD (31.1% of ADHD children as compared with 8.9% of non-ADHD children). This academic underachievement may be due to acquisition difficulties. Students with ADHD may have problems encoding information in working memory. Indeed, Rapport, Chung, Shore, and Isaacs (2001) have proposed that impaired working memory may be the primary hallmark of ADHD. Working memory can organize and manipulate new information, but when it is impaired, the individual may find it difficult to manage the incoming information, resulting in rapid shifts of attention and redirection to new stimuli.
Research has demonstrated that ADHD appears to negatively effect operations that occur in working memory (e.g., Roodenrys, Koloski, & Grainger, 2001). Although studies have shown that all systems described in Baddeley’s model have been negatively affected for children with ADHD, researchers (Martinussen, Hayden, Hogg-Johnson, & Tannock, 2005; Willicutt, Doyle, Nigg, Faraone, & Pennington, 2005) have generally found larger effect size for the visuospatial system than the phonological loop system, with the central executive component also contributing to the poorer working memory performance in individuals with ADHD. For example, Rapport et al. (2008) found that for children (ages 8-12) with ADHD, working memory deficits were present across all of the cognitive memory systems they explored—the phonological loop, the central executive, and, especially, the visuospatial sketchpad. The authors suggested that children with ADHD may have impairment in buffer (storage)rehearsal functioning in both the phonological loop and visuospatial sketch pad systems, difficulties in the development and use of mnemonic strategies as well as serious impairments in central executive functioning. However, Karatekin (2004) found neither significant phonological loop nor visuospatial impairments in children with ADHD, as compared with controls; however, this result may have been due to the task demands of his study, which required a recognition task, rather than a recall task.
In the present experiment, we explored the dual coding model with a group of high school participants, some of whom exhibited symptoms of ADHD as measured by the Caterino Assessment of Attention Deficit Hyperactivity Disorder Scale (CAADS; Caterino, 1995) and some of whom did not. We varied the order of stimuli (that is map before text vs. text before map) and looked at the total number of stimuli recalled from the text and the map as well as the correct location of the stimuli (spatial). We predicted that those students who have more symptoms of ADHD, as indicated by a higher composite score on the CAADS, will demonstrate a decreased ability to recall information from the map and text even when presented with the materials in the advantaged condition of learning the map prior to the text. This prediction was based on our hypothesis that ADHD interferes with visuospatial memory and the overall cognitive load students can handle. Thus, presenting the visual representation or map first would adversely affect the learner’s ability to learn both map features as well as text facts.
Method
Design
The base design involved two between-participants groups differing in order of stimulus presentation with one group receiving a map before the text and the other a text before the map.
Participants
The participants were 83 high school students (42 females and 41 males, mean age = 16.71 years). Age and gender were balanced across experimental conditions. Students were selected from four classrooms in a suburban high school in the Southwestern United States. All students in the classes were given an explanation of the study and informed consent forms to take home to their parents. Only students who returned the informed consent forms and indicated assent were included in the study. After screening out participants who failed to complete the entire task, there were a total of 77 usable protocols, 42 in the map-text group and 35 in the text-map group. The mean age of these participants was 16.69 years. Thirty-nine of these 77 participants were female.
Materials
The map used in the current study depicted the city of Rome and was previously used in another study (Kulhavy, Stock, Verdi, Rittschof, & Savenye, 1993). The map shown in Figure 1 depicts the area of Rome and contains a total of 20 target features consisting of 15 Roman landmarks, each identified by a small square and a label and five geographic locations with labels. The wall that circles the city was not counted as a map feature. The map also contained a compass rose, a distance scale, and the words “City of Rome” in the upper left corner. The map was printed in black ink on a 21.6 × 27.9 cm sheet of white paper.
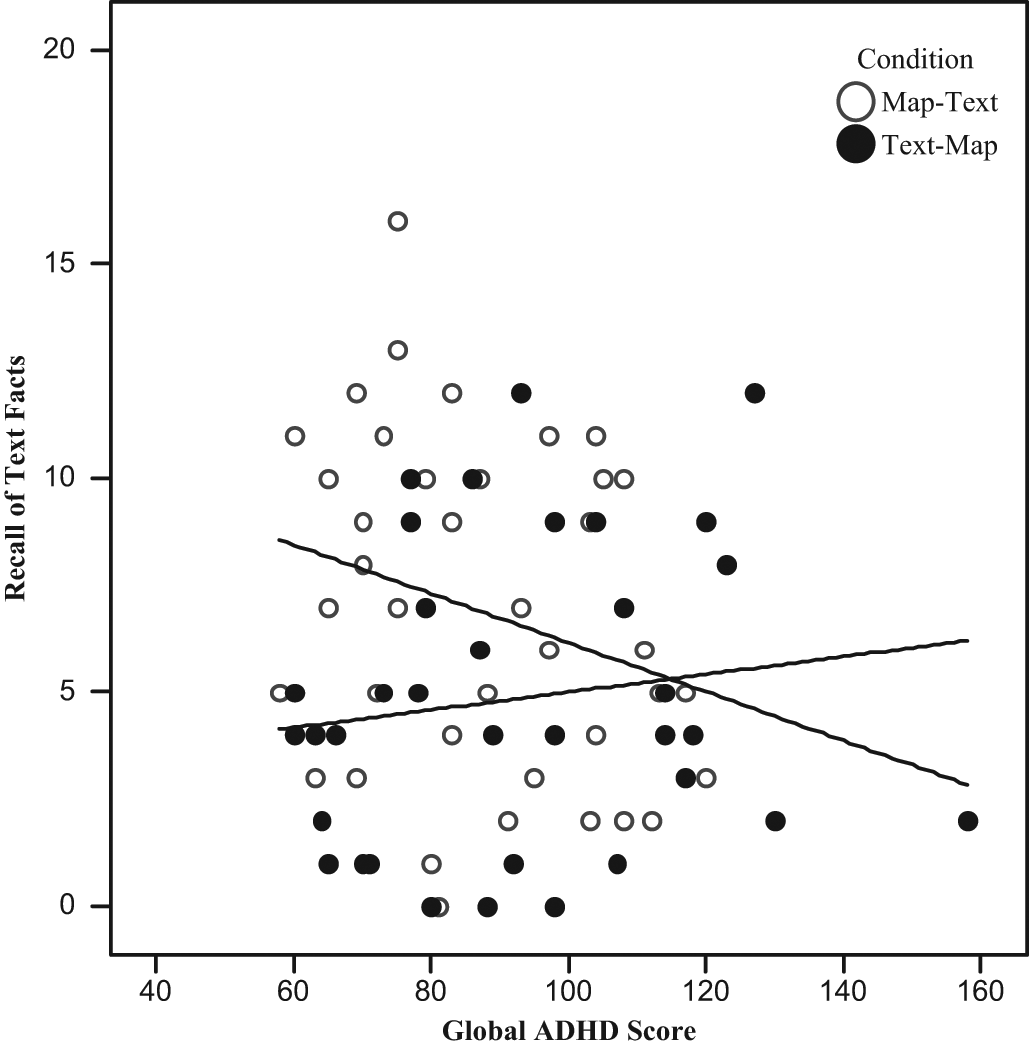
Scatter and regression lines for recall of text facts and ADHD symptoms
The fact text was an expository passage titled the “City of Rome” also taken directly from the Kulhavy, Stock, Verdi, Rittschof & Savenye (1993) article. The text had a total of 26 sentences, 20 of which included the name of a different map feature and a related fact. Six sentences included no feature name and were simply used to lend continuity to the text. To preserve ecological validity, each of the 20 facts described a real event or a relationship that was historically associated with the feature referred to in the same sentence. A copy of the text is contained in the appendix.
The CAADS (Caterino, 1995) was also administered. The CAADS (Caterino, 1995) has been developed to measure the Diagnostic and Statistical Manual of Mental Disorders (4th ed.; DSM-IV; American Psychiatric Association [APA], 1994) criteria associated with attention deficit hyperactivity impulsivity syndrome. The CAADS uses a 32-item Likert-type scale with four responses: 0 = a little, 1 = somewhat, and 2 = a lot. Each of the items is linked to specific criterion of ADHD listed in the DSM-IV–text revision (TR; APA, 2000). The scale provides a score for the ADHD domains of inattention and hyperactivity/impulsivity. For each item on the CAADS, adolescents were asked to assess the current presence of symptoms: A = at home, B = at work or school, and C = in social settings as well as retrospectively in a category labeled, as a child, which is not combined into the total score but is used by the clinician to determine if the disorder has existed since childhood because this is required by the DSM-IV-TR (APA, 2000). Nine items comprise the attention scale, and there are six hyperactivity items and three impulsivity items, which together comprise the hyperactivity/impulsivity scale. Given the three possible location scales (home, school, and social), the 0 to 2 ratings, and the 36 possible ADHD items, the total possible score for the ADHD items is 108 with a total of 54 possible for each of the inattention and hyperactivity/impulsivity scales. The CAADS also includes two other scales for rule-out purposes: generalized anxiety (6 items) and oppositional defiant disorder (8 items); however, data from these scores were not used in the present study.
Results of empirical studies reflect the reliability and validity of both the child and adult self-report CAADS. The CAADS has been found to be a reliable and valid measurement for the assessment of ADHD among adults (Ahern, 1999; Ahern, Caterino, Byars, & Verdi, 1996; Caterino, Gomez, Balleurka, Amador-Campos, & Stock, 2009) and children (Caterino, Romano, Leibe, Moreno, & Tansy, 2003). The internal reliability of the CAADS was found to be appropriate for parent, children, and teacher ratings (Caterino et al., 2002) with Cronbach’s alphas of .88 for inattention and .84 for the combined hyperactivity/impulsivity subscale. The alpha coefficient for the entire scale (summed across inattention, hyperactivity, and impulsivity responses in all three settings) demonstrated that the CAADS as a whole possesses excellent internal consistency (α = .95; Caterino et al., 2009).
All participants received a stack of five envelopes numbered 1 through 5 with each stack assigned a subject number for all envelopes. No names or other identifications were used. The first and second envelopes contained either the map or the test, depending on the condition. The third envelope contained two blank sheets of paper for text recall, and the fourth envelope contained an outline of the map of Rome for the map reconstruction task The fifth and final envelope contained a copy of the CAADS as described earlier.
Procedure
The first author and graduate students in psychology served as experimenters. As students entered their regular classrooms, they were randomly given a stack of envelopes by the experimenters. All conditions were represented in each classroom. When all participants in a given class were seated, they were told to open the first envelope and to read the instructions, which told them to study the materials on the next page carefully (map or text) because learning this material would be useful to them in learning materials they would see later. The instructions were also given verbally by the experimenters. The participants then studied the map or text for 6 min and were then told to put the materials back in the envelope and place it under their chairs. The second envelope was opened and participants were instructed to learn the material as well as possible using the previous information to assist them. After 6 min, participants placed the second envelope under their chairs and opened the third envelope that directed them to write down as much as they could remember from the text they had read. Following 6 min of written recall, the third envelope was placed under their chairs, and the fourth envelope was opened showing the outline of the map of Rome. Participants were given 6 min to reconstruct the map as accurately as possible. Finally, the fourth envelope was placed under the students’ chairs and the fifth envelope opened, which contained a copy of the CAADS. The participants were read standardized instructions for taking the test and then given 16 min to complete it. When subjects had completed the CAADS, the five envelopes were collected and the class dismissed.
Results
The results of separate analyses of variance based on the 77 of the 83 participants who completed all tasks in their entirety established that neither age nor ADHD scores differed significantly between the two conditions of the experiment. Fact recall was scored by assigning one point for each fact correctly recalled on the written recall sheet. Fact statements were scored as correct if they contained the gist of the fact information from the text. Participants did not have to use an exact word for word recall to receive credit. For the recall of text facts, the map-text mean was 6.88 (SD = 3.95), and for the text-map group, the mean was 4.86 (SD = 3.52). For the recall of text features, the map-text mean was 4.24 (SD = 3.23), and for the text-map group, the mean was 2.09 (SD = 2.08).
Map reconstructions were scored for both number of features written on the map and for feature names that were placed in their correct location. Feature placement was counted as correct if the feature name occupied a 1-inch circle centered on the stimulus location. A sample of six protocols from each location was independently scored by another rater with an agreement of 92% between scorings. For the recall of map features, the map-text group mean was 11.05 (SD = 4.82) and the text-map mean was 8.17 (SD = 3.44); for placement of map features, the map-text group mean was 10.12 (SD = 4.87) and the text-map group was 8.17 (SD = 3.44).
Table 1 shows the correlations among text- and map-recall measures and ADHD symptoms. This analysis supports several conclusions. First, correlations among the text and map measures are statistically significant and substantial. Second, each correlation between text and map outcomes in the map-text condition is higher than its respective correlation in the text-map condition, except for the correlation between recall of text facts and text features. Third, for map-text participants, each correlation of a text or map outcome with ADHD is negative, whereas for text-map participants all but one correlation is positive.
Correlations a Among Text and Map Recall Measures and ADHD Symptoms

Correlations for the map-text and the text-map conditions, respectively, appear below and above the principal diagonal.
p ≤ .05. **p ≤ .01.
Of the eight correlations between a text or map outcome measure and ADHD, only the correlation between placement of map features and ADHD in the map-text condition is statistically significant. Nevertheless, the two conditions appear to induce correlations in opposite directions, a fact corroborated by Z-tests between independent correlations. Statistically significant differences between the experimental conditions were observed for the correlation of recall of text facts with ADHD (Z = -1.65, p < .05), the correlation between recall of map features and ADHD (Z = -1.78, p ≤ .05), and the correlation between placement of map features and ADHD (Z = -2.01, p ≤ .025) but not for the correlation between recall of map features and ADHD.
Figures 1, 2, 3, and 4 depict scatter plots between each of the four text or map outcomes and ADHD (map-text and text-map participants are denoted, respectively, by open and solid markers). In each figure, a within-condition regression line highlights the inverse relationship that exists between a text or map outcome measure and ADHD in the map-text condition. (In each figure, this line starts in the upper left portion of the figure.)
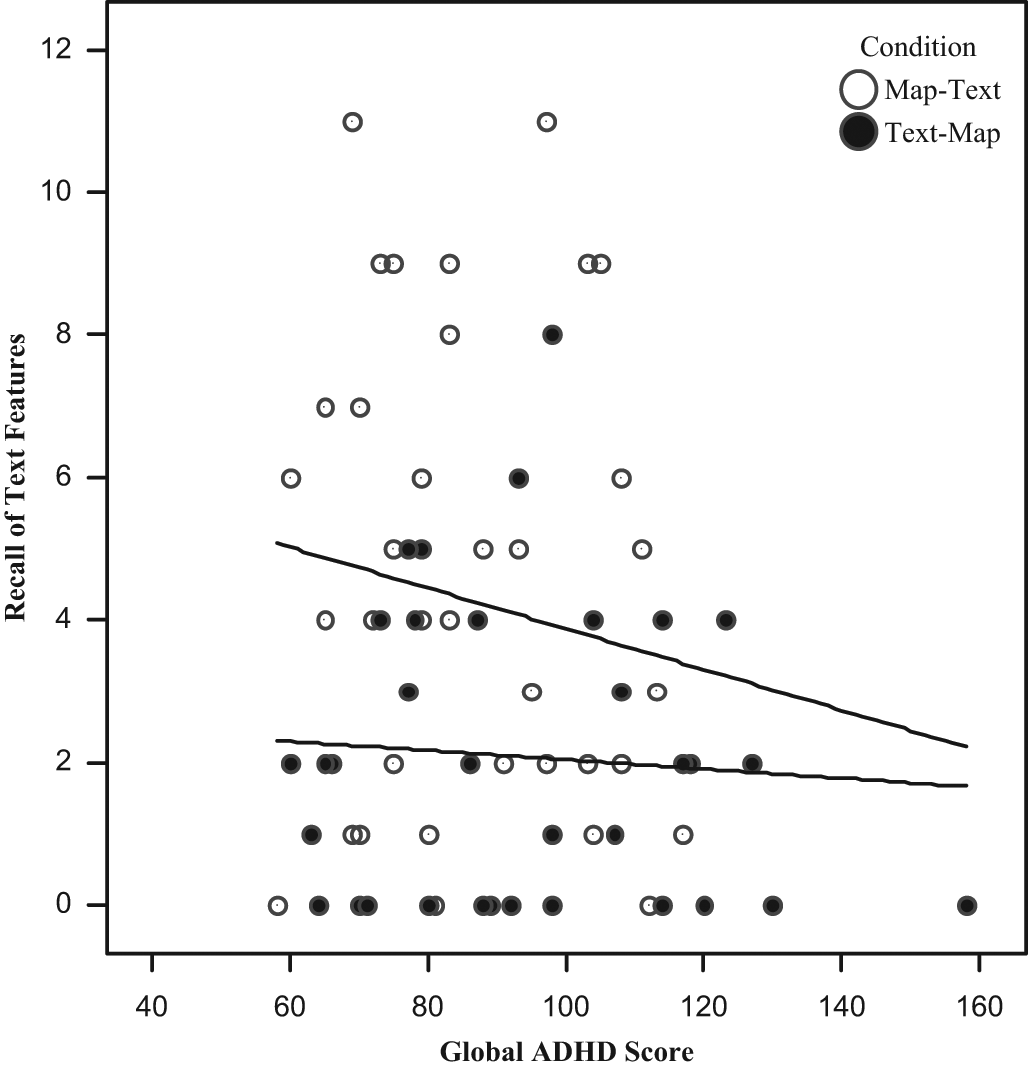
Scatter and regression lines for recall of text features and ADHD symptoms
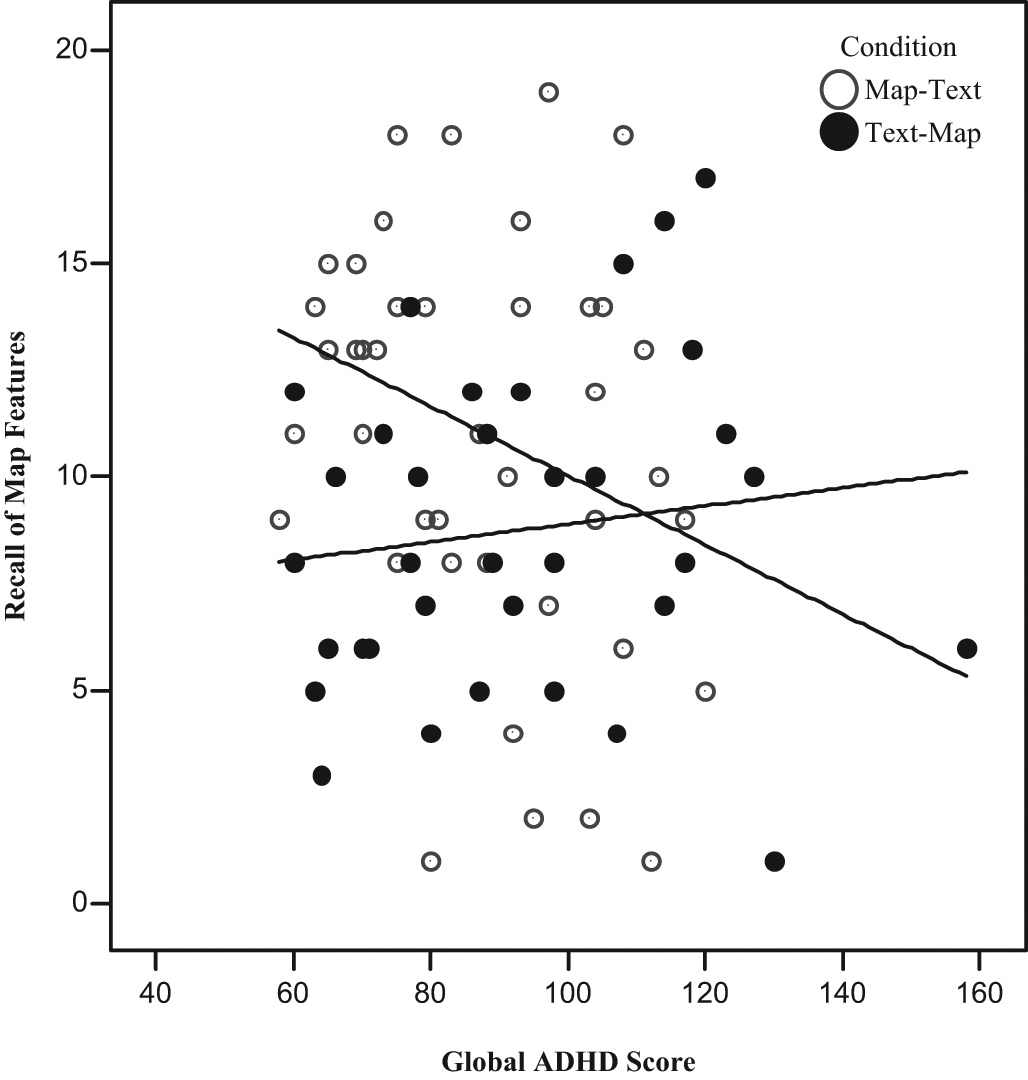
Scatter and regression lines for recall of map features and ADHD symptoms

Scatter and regression lines for placement of map features and ADHD symptoms
A 2 presentation (map text vs. text map) × 2 total CAADS score (high vs. low) was conducted. The high or low level was found by taking the median score of the CAADS total score and assigning those who scored below the median to the low group and those scoring above the median to the high group. Main effects were found for each of the four dependent variables measured. Students who saw a map prior to studying a text and were in the lower half of total CAADS scores indicating endorsement of fewer symptoms recalled significantly more text facts, F(3, 73) = 3.840, p < .013, SEM = .417; text features, F(3, 73) = 4.154, p < .009, SEM = .336; map features, F(3, 73) = 3.106 p < .03, SEM = .470; and map locations, F(3,73) = 2.863, p < .043, SEM = .474, than any of the other three experimental conditions.
Following the completion of the initial analyses described, the six previously disregarded protocols were completed and added to the sample. Therefore, in the analysis preformed on the individual symptoms, a sample size of 83 was used and not 77, as in the initial analysis.
Next, the hyperactivity–impulsivity and inattention factors were looked at individually to assess which of these symptoms had an effect in the participants’ ability to process the organized spatial display and text.
First, it was clear that the group as a whole neither exhibited high levels of ADHD symptoms based on their inattention and hyperactivity–impulsivity scores nor were their anxiety or oppositional defiant scores high. For example, the mean for inattention (max score 54) was 18.93 (SD = 11.99), for hyperactivity (max score 54) was 17.20 (SD = 10.42), for anxiety (max score 12) was 3.65 (SD = 2.39), and for operational defiant disorder (max score 16) was 4.87, (SD = 2.74). Thus, according to the CAADS scoring system, which is based on endorsement of ADHD symptoms from the DSM-IV-TR (APA, 2000), only 5 of the 83 participants (6.02%) met the criteria for ADHD–inattentive, only 1 met criteria for ADHD–hyperactive (1.2%), and only 2 met criteria for ADHD–combined (2.4%).
Although the analyses based on specific ADHD symptoms supported the predictions, none reached a significant level due to the low average scores found in the sample. However, even with the low mean scores, two factors, inattention and hyperactivity-impulsivity, supported our prediction that students with higher levels of these symptoms would not benefit from viewing a map prior to reading a text. Participants who were above the average score for hyperactivity-impulsivity and saw the map prior to reading the text recalled fewer text facts, M = 6.89, SD = 3.11; text features, M = 3.78, SD = 3.05; and map features, M = 12.0, SD = 2.50, and placed less features on their reconstructions, M = 11.22, SD = 2.77, than those participants with lower levels of hyperactivity—text facts: M = 8.67, SD = 5.22; text features: M = 4.78, SD = 3.04; and map features: M = 12.2, SD = 5.40, and placed less features correctly on their reconstructions, M = 11.78, SD = 5.07. This shows that the order of presentation effect found for the whole group was tempered by the presence of higher levels of hyperactivity-impulsivity.
In looking at inattention, the same pattern can be seen. Students who showed higher levels of inattention and viewed a map prior to reading a text recalled fewer text facts, M = 7.2, SD = 3.49; text features, M = 3.67, SD=2.87; and map features, M = 12.0, SD = 4.09, and placed fewer features accurately on their reconstructions, M = 11.22, SD = 2.95, than those participants with lower levels of inattention who viewed the map prior to the text—text facts: M = 8.3, SD = 5.07; text features: M = 4.89, SD = 3.79; and map features: M = 12.2, SD = 5.22, and placed fewer features accurately on their reconstructions, M = 11.78, SD = 4.97. Therefore, the results of the additional analysis support the position that higher levels of symptoms interfere with a participant’s ability to use the learning advantages found by seeing a map prior to a related text. However, the results also indicated that more testing with a larger sample, including those with higher levels of ADHD symptoms, are required to obtain a complete and accurate picture of how the symptoms affect student learning of organized spatial displays in conjunction with a related text.
Discussion
In the experiment presented here, we sought to provide information relevant to Baddeley’s model of working memory and the theory of text learning using organized displays as proposed by Kulhavy and his associates (Kulhavy, Stock, Verdi, et al, 1993). More importantly, we also wished to examine whether students with ADHD could use the advantage provided by using an organized spatial display in conjunction with a text to overcome the learning problems experienced by these students. Finally, we sought to explain the results and to provide a practical use for the results in today’s classroom.
The results of the study provide support for the model of text learning using organized spatial displays (see Verdi & Kulhavy, 2002, for a complete review of the research in this area). The model based on Paivio’s dual coding theory (1986) and Kulhavy’s conjoint retention theory (Kulhavy et al., 1985) states that learners store information in two distinct memory codes, one for verbal information and one for visual information. Verbal information in the form of propositions is stored in the verbal code and visual information in the form of images is stored in the nonverbal code. Moreover, the model states that visual information has a computational advantage over verbal information (Larkin & Simon, 1987). This is due to the fact that visual information in the form of images is stored intact and can be viewed and stored as a single unit. These images take up less space in a learner’s working memory, which allows the learner to hold in working memory any additional information they may acquire from other sources, such as a related text. Thus, the order that students view information has a great effect on their ability to learn and process information. Learners who view an organized spatial display prior to learning a related text should be able to learn more information than those who view the information in the reverse order. Learners who must first learn a text must process that text in sequential order, which fills their working memory leaving no space for additional processing. When shown a visual, these learners then have a choice. If they choose to process the visual, they then lose the pieces of the text they are holding in working memory. However, they may choose to ignore the visual and in essence, lose the advantage gained by learning material in two mediums and not be able to make any links between the visual and the text. In either case, these learners are at a disadvantage and hence, have a decrease in their ability to process the information and make the necessary associative links that will aid in learning and future recall.
This result, that students who view an organized spatial display prior to a text learn more than students who learn the same material in reverse order, has been replicated several times and with various forms of displays and mediums. In the original study that demonstrated the order effect, one group of students viewed a map of the city of Rome and read a related text about the landmarks found on the map and a second group of students viewed the same material in reverse order. Following their study, students were given a task to clear working memory and then were asked to recall everything they could from the text and to reconstruct the map. The findings showed that students who viewed the map prior to reading the text recalled significantly more information from both the map and the text and did so more accurately than those who viewed the same materials in reverse order (Kulhavy, Stock, Verdi, et al., 1993). It should be noted that the materials used in the original order effect study are the same materials used in the experiment presented here. The order effect was also found when using scientific diagrams (Verdi, Johnson, Stock, Kulhavy, & Ahern, 1997) and when materials were presented to students via the Internet in a digital form (Verdi, Crooks, & White, 2002). Finally, the results of the current study also support the order effect. In looking at the students overall and not factoring in those with ADHD, students who viewed a map prior to reading the text recalled more facts from the text and more information from the map than those who viewed the material in reverse order. This study replicates the original results and provides additional support for the order effect with a younger, high school–aged population because the original study was undertaken with postbaccalaureate students.
Interestingly, this same effect was not observed with students who endorsed more symptoms of inattention and hyperactivity–impulsivity. Although the results were not clearly significant, most likely due to low mean levels of ADHD symptoms and small sample size, students with higher mean scores on the inattention and hyperactivity factors recalled fewer text facts and features and placed fewer features accurately on their map reconstructions. Moreover, these students’ ability to recall information from the display and the text was not improved with the order of presentation (map vs. text). We believe this can best be explained by the characteristics of those with ADHD and cognitive load theory.
Based on the previous studies of working memory in children with ADHD (e.g., Martinussen et al., 2005; Rapport, et al., 2001; Willicutt et al., 2005), it appears that the visuospatial sketchpad is the working memory system most negatively affected by the disorder; therefore, the advantage of receiving a map or visual image prior to a text is less likely to be advantageous with this population. They may have more difficulty encoding a visual stimulus than a typical group of learners. In essence, students with greater ADHD symptoms, when faced with the decision of multiple sources of learning material, suffer from excess cognitive load.
Richard Mayer (1997) suggested that learning graphics and text together may overtax a learner’s cognitive load and hence decrease learning. It is important to note that Mayer’s subjects did not have ADHD and yet, when presented with a graphic and a related text, they had a decrease in learning. For students with ADHD, this task may be even more difficult. Others suggest that the use of graphic and text together may increase a student’s navigation of a map but not the comprehension of the material (Nilsson & Mayer, 2002). Scott and Schwartz (2007) have found that increased curricular material only improves cognitive load if the learner finds the material to be germane. Students with ADHD would no doubt have trouble finding enough cognitive space to process and make the decision as to what is germane and what is not. When students with ADHD have multiple curricular materials to learn, it is just too excessive for their load and their learning decreases regardless of the order in that the materials are presented.
Interestingly, when looking at total CAADS scores, our predicted analyses were significant. Thus, it appears that students with more symptoms of ADHD, coupled with additional symptoms related to anxiety and oppositional defiant disorder, have an even more difficult time benefiting from the advantages of seeing a visual display prior to learning a textual passage.
There are several limitations to this study, particularly the rather small sample size and the limited number of participants per experimental condition (about 20 per cell). In addition, it was not possible to obtain a clinical diagnosis of these students, so we had to rely on self-report measures of inattention, hyperactivity, and impulsivity. Future studies will be implemented with a clinical sample of students independently diagnosed with ADHD, which will show even greater effects.
The results of the study indicate that classroom teachers and designers of curricular material must be cognizant of the order in which information is presented and, in the case of students with ADHD, the type of display used as well as what is most germane to the learning situation. Designers of curricular materials, including textbooks and power point presentations, in addition to classroom teachers, must all be aware that the order in which the materials are presented to most learners can and does increase their ability to learn. For most students, an organized spatial display, whether it be a map or diagram, should be presented prior to a related text. However, this does not appear to be the case for students with ADHD symptoms; for these students, presenting visuospatial information first does not provide the same benefit that it does for typical learners. Thus, future studies will need to focus on what assistance can be provided to these students to increase their learning. Specialized materials for this population may improve their learning ability. For example, they may benefit from shorter text or simpler and very germane images so that their working memory is not overloaded.
Footnotes
Appendix
Acknowledgements
The authors wish to express their gratitude to the following individuals who assisted with data collection and analyses: Marita Mahoney, William Stock, Sally Exworthy, Amanda Fessler, Virginia Newton, Dina Romano-Shacknai, Tabatha Sandman, and Michael Tansy and also to Raymond Kulhavy who read and commented on an earlier draft of this article.
Declaration of Conflicting Interests
The authors declared that they had no conflicts of interests with respect to their authorship or the publication of this article.
Funding
The authors received no financial support for the research and/or authorship of this article.