
Abstract
Monitoring the prevalence of attention-deficit/hyperactivity disorder (ADHD) is an important public health activity as public awareness has increased and treatment options have expanded across the globe. A metaregression analysis comprised of over 102 studies revealed a worldwide ADHD prevalence rate of 5.3% for studies published between 1978 and 2005 (Polanczyk, de Lima, Horta, Biederman, & Rohde, 2007). The pooled prevalence rate in North America was higher than those of Africa or the Middle East, but was comparable to those of Europe, South American, Oceania, and Asia.
Conclusions about the epidemiology of ADHD within the US are complicated by ongoing reports of limited access to care (Burns et al., 1995), conflicting evidence of over- and under-diagnosis, and clinical debates about the appropriateness of medication use (Angier, 1994; Bussing et al., 2005; Diller, 1996; McGinnis, 1997). Nevertheless, parent-reported rates of ADHD diagnosis have increased steadily since 1998 (Akinbami, Liu, Pastor, & Reuben, 2011; Centers for Disease Control and Prevention, 2010; Pastor & Reuben, 2008). A recent parent survey revealed that 9.5% of those 4-17 years of age (approximately 5.4 million American children) had an ADHD diagnosis by 2007, representing a 22% increase in four years (Centers for Disease Control and Prevention, 2010). Although parent surveys reveal important trends, they lack clinical validation and are predicated on access to health care.
Application of DSM-IVTR criteria for ADHD requires “some impairment from the symptoms be present in two or more settings (e.g., at school and home)” and clear evidence of significant impairment in social, academic, or occupational functioning (APA, 2000). Thus, the diagnosis requires a degree of impairment (“some” and “clinically significant”) and multiple (“two or more”) settings but does not direct application of these criteria. The lack of explicit in impairment criteria likely contributes to variable prevalence rates (Gathje, Lewandowski, & Gordon, 2008) and is compounded by the lack of clarity regarding the inclusion of multiple informants (American Academy of Pediatrics [AAP] Committee on Quality Improvement and Subcommittee on Attention-Deficit/Hyperactivity Disorder, 2000); AAP’s practice guidelines recommend using information from parents and teachers (AAP’s Subcommittee on Attention-Deficit/Hyperactivity Disorder Steering Committee on Quality Improvement and Management, 2011), although the correlation between parent and teacher ratings is often low (Lahey et al., 1987; Newcorn et al., 1994; Wolraich et al., 2004) with no clear recommendation for resolving these conflicts.
Many previous population-based estimates of ADHD have relied on a single reporter or existing clinical diagnoses (Barbaresi et al., 2002; Burd, Klug, Coumbe, & Kerbeshian, 2003; Mandell, Thompson, Weintraub, Destefano, & Blank, 2005)—methods that are insufficient to evaluate DSM-IVTR diagnostic criteria. Nationally representative cross-sectional surveys that are used to estimate ADHD prevalence have relied solely on parental report of the diagnosis (Pastor & Reuben, 2008; Visser, Lesesne, & Perou, 2007) or have otherwise used less than the full DSM-IVTR criteria (Hargreaves, Shumway, Tei-Wei, & Cuffel, 1998). Thus, very few studies have documented symptoms in multiple settings, using information from multiple sources, possibly resulting in inaccurate estimates of prevalence (Barkley, 2006). Although clinical studies allow for more rigorous application of diagnostic criteria, community-based epidemiological studies that include participants regardless of health care access promise greater generalizability of findings to the population (Eaton et al., 2008; Goldberg, 1995; Susser, Schwartz, Morabia, & Bromet, 2006).
Given the upward trend in parent-reported ADHD and the complicated nature of DSM-IVTR diagnostic requirements, community-based studies that apply strict diagnostic criteria (APA, 2000) are clearly needed. Such work has great potential to provide important information for resource management and efficient delivery of services in school and health care. The objectives of this study were to describe the epidemiology of ADHD, using a DSM-IVTR case definition that includes multiple informants and multiple settings, among community-drawn samples of elementary-age children.
Method
To directly address the DSM-IVTR criteria for ADHD, this study used a two-phase design. In the first phase, school district-wide behavioral screenings were conducted by elementary school teachers within four school districts in South Carolina (SC) and Oklahoma (OK). In the second phase, parents (or caregivers) of children who met high- or low-screen criteria were invited to participate in direct, structured interview assessments of ADHD, co-occurring conditions, treatment history, demographics, and health-risk behaviors. A strict, DSM-IVTR-based case definition was developed and applied to generate weighted estimates of ADHD within each of the two sites. A detailed description of each phase is included below.
Phase I
Sampling population
Four school districts were targeted: one large district in SC (15 schools) and three districts in OK (20 schools). All elementary schools in three of the districts participated; in one large OK district, 8 of the 65 schools in the district were systematically selected to participate, and 7 schools participated. The communities included rural, suburban, and urban neighborhoods, and reflect a diverse student population.
The sampling universe included children in mainstream elementary classrooms (8,487 in SC; 7,212 in OK), targeting kindergarten through fifth grade. Screening included a small number of elementary schools that offered a sixth grade (OK only), and preK programs. Demographic characteristics are presented for the district and the screened populations in Table 1.
Characteristics of the Project to Learn About ADHD in Youth School Population and Screened Sample, by Site.
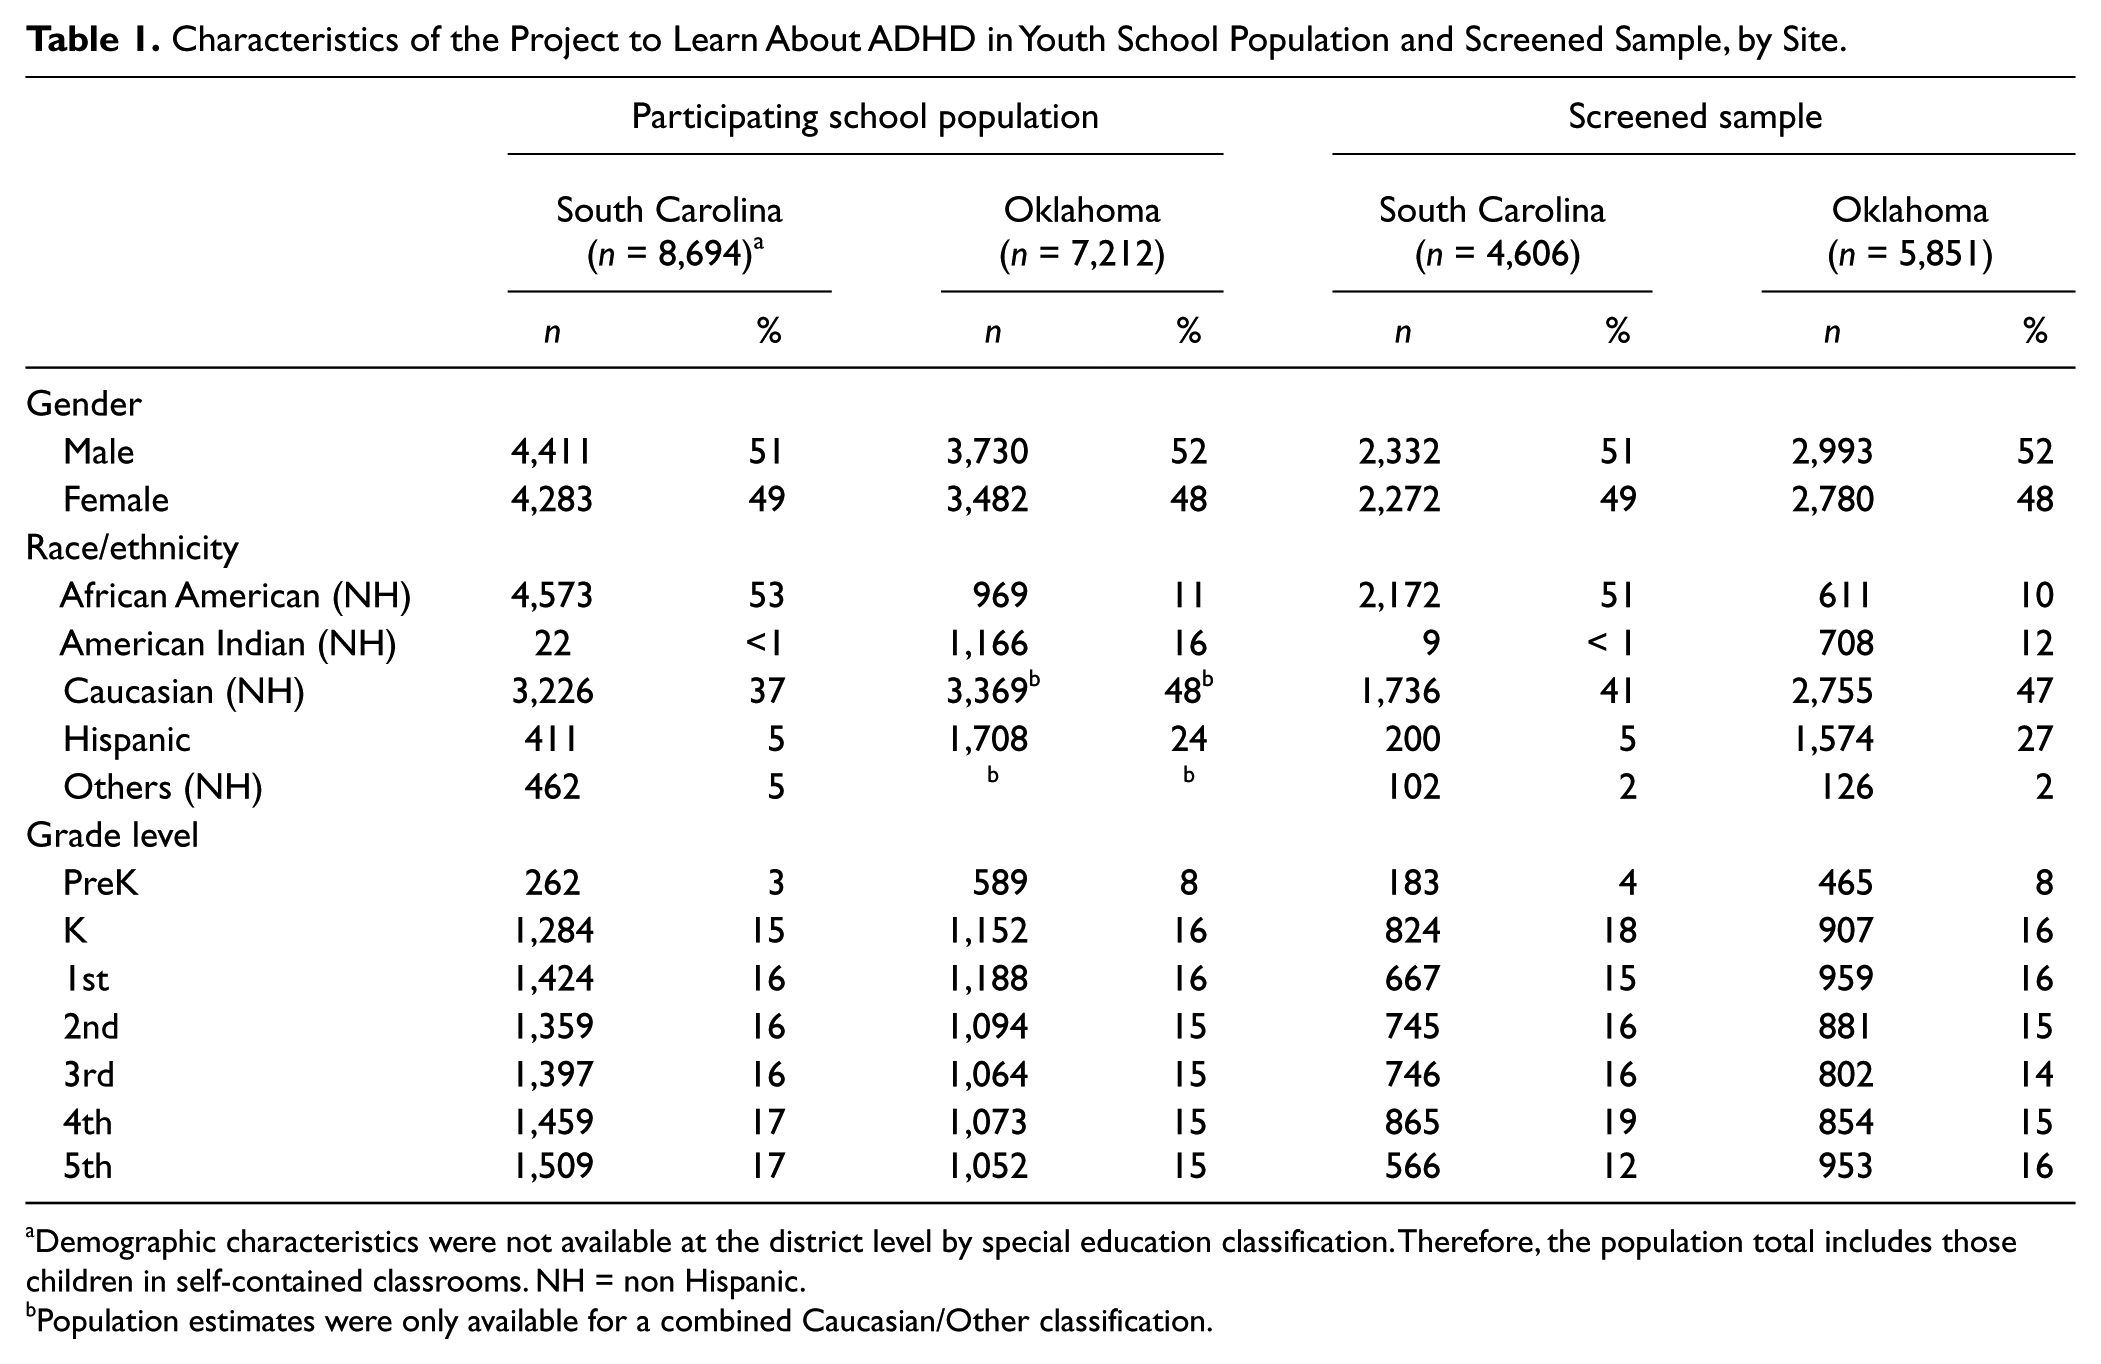
Demographic characteristics were not available at the district level by special education classification. Therefore, the population total includes those children in self-contained classrooms.
Population estimates were only available for a combined Caucasian/Other classification.
Screening procedures
Participating teachers rated each classroom student on the presence of ADHD core symptoms (Vanderbilt ADHD Diagnostic Teacher Rating Scale [VADTRS]; Wolraich et al., 2003), general behavior and associated functioning (the Strength and Difficulties Questionnaire [SDQ]; Goodman, 2001), and two questions about previous ADHD diagnosis (“Has this child been diagnosed with ADHD or ADD?”) and current ADHD medication treatment (“Is the child on medication for ADHD or ADD?”). A screening form was sent home by teachers, asking parents the same two questions about diagnosis and treatment. Research staff received research numbers, but no identifying information; school personnel retained names and research numbers, but no assessment results.
Data from teachers and parents were used to divide the children into two strata from which eligible Phase II participants were drawn: those likely to have ADHD (high screen) and those not likely to have ADHD (low screen). Children were categorized as high screen if they (a) had six or more ADHD core symptoms in either or both ADHD dimensions on the Vanderbilt scale and intermediate impairment ratings on the SDQ or (b) received an ADHD diagnosis or were taking medication for ADHD, based on either the parent or teacher report. The remaining children were categorized as low screen.
Sampling procedures
Both sites used representative sampling procedures. An eligible subsample was selected from the two screening strata by taking all high screens and a sample of low screens, proportionally (in OK) or frequency (in SC) matched on gender. The school districts required a process in which school staff contacted eligible families and requested permission to release their information to study staff. Families expressing an interest in study participation (n = 1,167) were invited into the diagnostic phase (Phase II) in which parents (n = 844; 73.3% of those invited) completed the diagnostic interview. Site-specific participation rates are documented in Figure 1.

Project to Learn about ADHD in Youth screening and case ascertainment flowchart.
Phase II
Case ascertainment
Following screening, consenting families were interviewed after a median 13 months in SC (interquartile range [IQR] = 8-16 months) and 10 months in OK (IQR = 6-12 months), using modules of the parent DISC-IV (Shaffer, Fisher, Lucas, Dulcan, & Schwab-Stone, 2000) parent report (generalized anxiety disorder, obsessive compulsive disorder, posttraumatic stress disorder, major depression/dysthymic disorder, mania/hypomania, ADHD, oppositional defiant disorder, conduct disorder), a health-risk behavior survey, and a demographic survey. In most cases, the participating caregiver was the child’s mother (94% SC and 86% OK). DISC-IV interviews completed in OK were primarily conducted via telephone with most other measures returned by mail, due to large catchment size; in-person interviews were conducted to accommodate hearing difficulties or Spanish translation. SC interviews were completed primarily in person; written measures were collected during the interview or returned by mail. Participants were given an incentive (gift cards or checks) for participation.
Demographic characteristics of the interviewed sample are presented in Table 2. Parents were notified of probable diagnoses and given referral information when requested, following review of the DISC reports by a clinician. Triage protocols were in place for timely response to identified risks of harm to self or others or reported abuse. All study procedures were reviewed and approved by the Institutional Review Boards of the Centers for Disease Control and Prevention, and respective universities.
Characteristics of the Project to Learn About ADHD in Youth Interview Participants, by Site.

Note: CI = confidence interval.
ADHD Study Case Definition
The DSM-IVTR case definition was based on ADHD symptom counts (at least six of nine symptoms in either or both of the inattentive or hyperactive/impulsive subscales), impairment ratings (at least one DISC-IV impairment domain rated severe, or two rated moderate), and a report of age of onset from the diagnostic interview of parents (Figure 2). Case criteria were met through endorsement of the following criteria:

Project to Learn about ADHD in youth case definition diagram.
High-screen children (six or more symptoms plus some impairment, as reported by teachers)
Six or more symptoms plus positive impairment rating and age of onset before 7 years, as reported by parents during the interview phase (Figure 2, case inclusion Group h).
High-screen children (report of ADHD diagnosis or current ADHD medication by the teacher or parent)
Six or more symptoms plus positive impairment rating and age of onset before 7 years, as reported by parents during the interview phase, and four or five screening symptoms, as reported by teachers (Figure 2, case inclusion Group g).
Low-screen children (fewer than six symptoms and/or no impairment due to reported symptoms, as reported by teachers; no report of ADHD diagnosis or current ADHD medication by the teacher or parent)
Six or more symptom plus positive impairment rating and age of onset before 7 years, as reported by parents during the interview phase; and four or five symptoms and some SDQ impairment, as reported by teachers (Figure 2, case inclusion Group f).
Children who were medicated at the time of the DISC-IV were excluded as cases if they did not otherwise meet the preceding case criteria.
Analysis
Selection of participants was by a multistage sampling stratified design by district. Therefore, sampling weights were calculated to account for the differential sampling design (screening status and gender) as well as adjustments for nonresponse. When applied, the weights produce estimates that more closely reflect the demographic characteristics of the sampled district populations. Consideration of the complex design features in the analytic phase results in asymptotically unbiased estimates and standard errors. This sampling design was developed and executed within each of the school districts separately, and district-level estimates therefore best represent the population of children in that district.
SAS version 9.2 was used for data management; analyses were conducted using SAS-callable SUDAAN 10.0. Confidence intervals (CIs) are presented alongside weighted point estimates as an indicator of precision; a relative standard error greater than 30% was used as an indicator of statistical instability. Inferential tests of association for weighted analyses were based on Fellegi-adjusted Wald F statistics (Fellegi, 1980). More details on the design can be found in the appendix.
Results
Site participation rates can be found in Figure 1. The SC screened sample included 4,606 children (54.3% of the district’s population). The OK screened sample included 5,851 children (81% of the three districts’ population). Children were not screened for one of three reasons: (a) The teachers did not complete the screener, (b) the children were not included in the screening universe (i.e., self-contained special education classrooms), and (c) the parents indicated that they did not want their child screened. Of those meeting eligibility requirements, 28.7% in SC (633) and 32.1% in OK (537) returned a letter sent by their school, indicating interest in participating in the study. Ultimately, of those volunteering for the study, 76% of SC and 70% of OK were interviewed.
Overall, 8.7% (95% CI = [7.2, 10.5]) of the children in SC (99 cases) and 10.6% (95% CI = [7.5, 14.9]) of the children in OK (117 cases) met the case definition. In OK, the weighted prevalence was 15.3% (95% CI = [9.4, 23.8]) for the suburban/rural district (54 cases), 9.0% (95% CI = [4.2, 18.5]) for the urban district (29 cases), and 9.1% (95% CI = [6.3, 13.0]) for the rural district (34 cases). The OK district estimates were not significantly different, nor were they explained by variations in within-stratum teacher screening scores. Combining the SC and OK samples, the district indicator was not statistically significant, nor were any of the district pairwise comparisons (all multiple-comparison adjusted p values > .17). Of the 258 high screens for SC, 36.8% met the case definition, whereas of the 223 low screens, only 1.8% met the case definition.
Among children meeting the case definition, the percentage of parent-reported ADHD medication use in the last month in SC was 46.7%, compared with 19.3% for OK. Overall, the percentage of children taking ADHD medication was 10.1% in SC and 7.4% in OK; 4.0% in SC and 2.1% in OK met the case definition despite medication, and 6.1% in SC and 5.4% in OK were on medication and did not meet the case definition.
The two sites exhibited comparable differences in prevalence across most sociodemographic factors (Table 3). Thus, the data were pooled across sites for the purpose of making demographic comparisons. Pooled prevalence estimates were higher among males (13.6% vs. 5.3%), F(1, 835) = 20.8, p < .01, children covered under Medicaid (13.7% vs. 6.5%), F(1, 808) = 13.1, p < .01, and families earning less than US$45,000 per year (12.1% vs. 5.1%), F(1, 804) = 16.4, p < .01. Small race/ethnic group sample sizes limited race/ethnicity comparisons within the OK sample and race/ethnic group comparisons across sites. A comparison of prevalence among the largest racial groups in SC (Caucasian and African American) was not statistically significant, nor was the cross-site difference in prevalence among Caucasians. At both sites, the mean symptom counts for medicated comparison children were significantly higher than for unmedicated comparison children (pooled M = 5.6 vs. 2.2), F(1, 619) = 40.6, p < .01.
Project to Learn About ADHD in Youth Case Prevalence by Site and Demographic Factors.
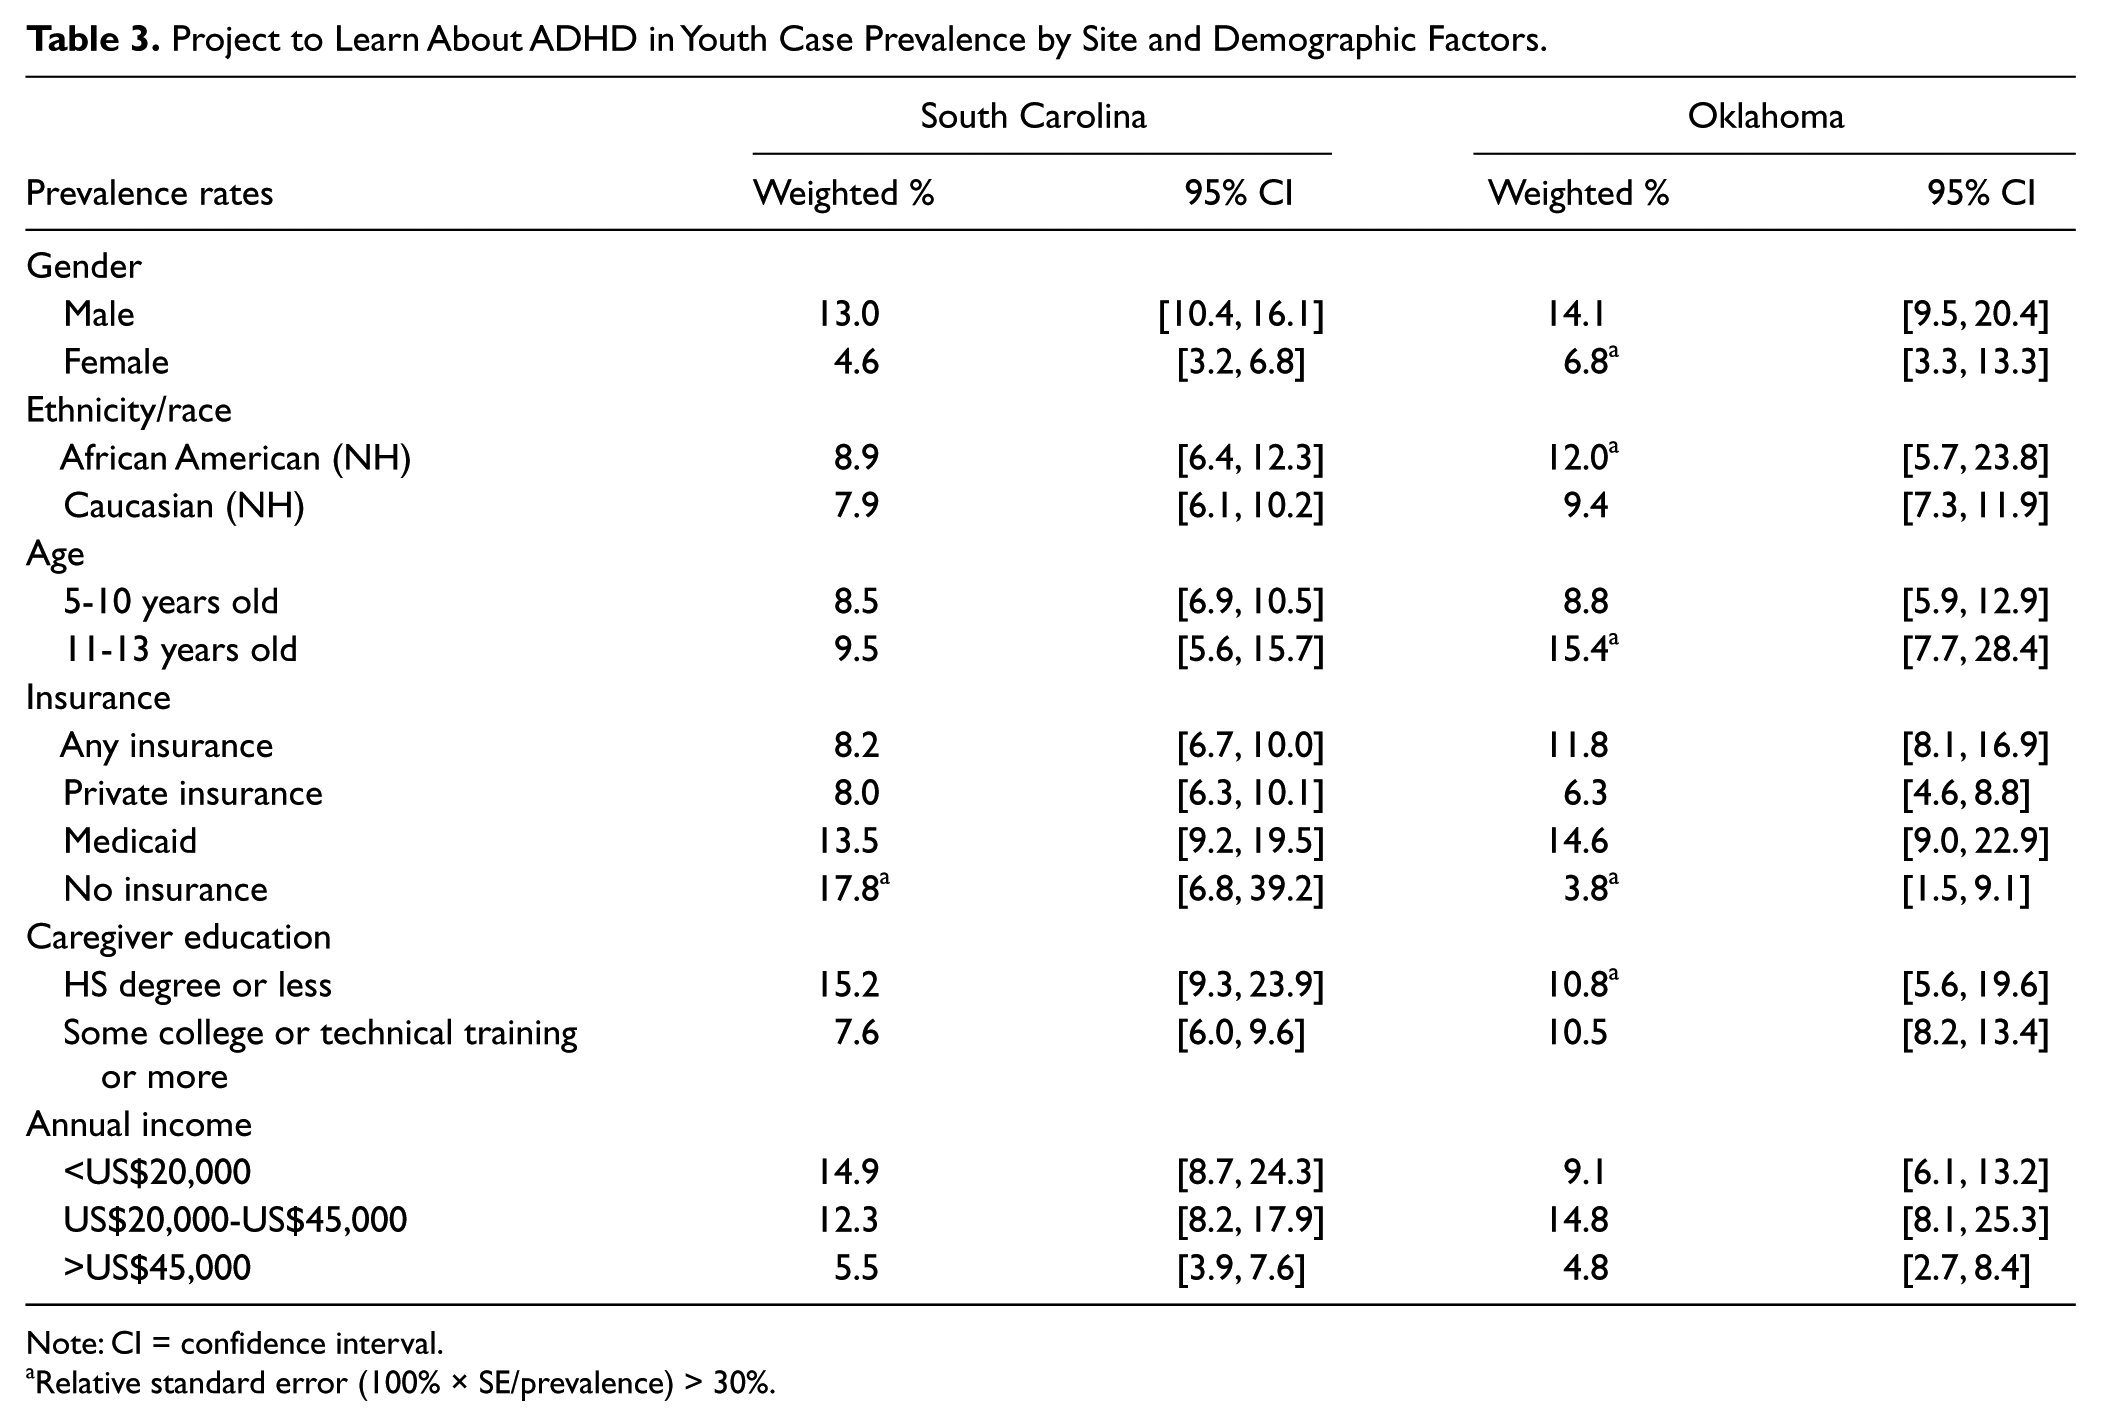
Note: CI = confidence interval.
Relative standard error (100% × SE/prevalence) > 30%.
Discussion
This study provides ADHD prevalence estimates in communities (school districts) based on a multistage screening and a DSM-IVTR diagnostic interview process, including multiple reporters (parents and teachers). The percentage of children meeting the case definition for ADHD was 8.7% in SC and 10.6% in OK. Our overall prevalence rates were higher than previous community-based estimates and were at the middle to upper end of the range found in a 2001 systematic review (Brown et al., 2001). The creation of subtypes in DSM-IVTR could be a contributing factor; however, parent-reported rates have increased steadily since 1998 (Akinbami et al., 2011), suggesting that other factors may be influencing the epidemiology of ADHD, including changes in the cultural acceptance of ADHD and health care provider characteristics (Eiraldi, Mazzuca, Clarke, & Power, 2006; Fulton et al., 2009). Other hypothesized contributing factors include changes in access to care, increased awareness of the condition, changing sociodemographic patterns within the United States, and changes to state-based policy and screening program efforts (Berry, Bloom, Foley, & Palfrey, 2010).
Our prevalence estimates may be conservative because we did not include self-contained special education classrooms in our sampling design. Furthermore, 5.7% of sample children were taking ADHD medication but did not meet our study’s case definition. Some of the medicated children were likely cases who were adequately managed with medication. These children were not included in the case definition because those adequately managed and those inappropriately treated were indistinguishable. Notably, medicated comparison children had roughly double the number of core symptoms than unmedicated comparison children; however, their symptom counts were less than half those of cases.
The SC and OK sites differed demographically, with the OK samples having lower incomes, less parental education, a higher rate of Medicaid coverage, and a lower rate of private insurance, all suggesting a lower socioeconomic level among the OK sample. These demographic differences could contribute to the higher prevalence of ADHD found in OK and higher medication use in SC.
Of the cases, 54.6% in SC and 80.7% in OK had not taken ADHD medication in the past month. This finding supports previous national reports of the geographic variability of ADHD medication treatment (Centers for Disease Control and Prevention, 2005). Froehlich et al. (2007) reported a similar rate of ADHD medication; 68% of those who met ADHD criteria had not taken ADHD medication in the previous year. Taken together, these data suggest that the majority of children who meet ADHD criteria, independent of diagnostic status, are not taking ADHD medication.
Study Strengths and Limitations
School-based samples can be used to efficiently collect behavioral information about children in communities, and these data are more likely to be generalizable than data from clinical samples. Teachers are valuable respondents, because they observe students for up to 6 hours per day; however, they may not be aware of students’ diagnoses and treatment. Parents usually are aware of diagnoses and treatment, and observe their children in varying circumstances, but they can be difficult to access in a defined community-sampling frame, such as a school district. Therefore, combining teacher and parent information may yield the strongest psychometric approach for identifying cases in a community. However, the estimates in this study may not be generalizable to other geographic areas or to children not enrolled in mainstream public school classrooms.
Importantly for this study, the case definition relied on parent and teacher reports and did not incorporate clinical information or judgment. In addition, the interview phase yielded approximately 30% of all of those who might have been interviewed (all eligible), due to school district regulations on how personally identifiable information could be released. Lower response rates among eligible participants increases the risk of response bias; however, there was no evidence of systematic biases within our samples. In addition, nonresponse adjustments were made for lower recruitment of African American students in SC and African American and Hispanic students in OK, yet the weighting methods somewhat underestimated race/ethnic group size in OK. Unmeasured bias is also possible, including bias introduced by greater participation of parents of children with ADHD.
Conclusion
Estimates from this community-based study corroborate the high prevalence (7.8%-9.5%) of ADHD found in recent parent-reported surveys (Centers for Disease Control and Prevention, 2005, 2010). Although typical gender ratios were found, there were no differences between Caucasian and African American children. Many children meeting case criteria had not been previously identified and were not receiving medication treatment, suggesting that the condition remains underdiagnosed for some children. In addition, many diagnosed children were not receiving treatment that adequately reduced their core symptoms and impairments. The impact of untreated ADHD is serious, with school failure, dropout, and poor functioning in adulthood common for these children (Ingram, Hechtman, & Morgenstern, 1999). This information lends itself to the development of community or school-based programs that address the needs of this large, school-age population. In addition, clinicians should use rigorous assessment procedures such as those recommended by the practice parameters of the American Academy of Child and Adolescent Psychiatry and the AAP (AAP’s Subcommittee on Attention-Deficit/Hyperactivity Disorder Steering Committee on Quality Improvement and Management, 2011; Pliszka & AACAP Work Group on Quality Issues, 2007). These parameters call for thorough assessment, input from parents and teachers, and the use of standardized behavior rating scales to diagnose children with ADHD.
Footnotes
Appendix
Acknowledgements
The authors wish to acknowledge the early contributions of those who participated in the collaborative meetings that led to the development of the screening protocol and design phase of the Project to Learn about ADHD in Youth. Contributors included: Dr. Edward Brann, Dr. Sandra Evans, Kurt Heisler, Dr. Gretchen LeFever, Dr. Catherine Lesesne, Dr. James Paulson, and Dr. Ruth Perou. We would like to further acknowledge Dr. Angelika Claussen for her assistance with manuscript formatting and the statistical and data management assistance from Dr. Cheryl Addy, Dr. Charity Moore, Gina Babka-Bryan, and Donna Wells.
Disclaimer
The findings and conclusions in this report are those of the authors and do not necessarily represent the official position of the Centers for Disease Control and Prevention.
Declaration of Conflicting Interests
The author(s) declared the following potential conflicts of interest with respect to the research, authorship, and/or publication of this article: The lead author has been a consultant to Shire, Lilly, Shinoghi and Nextwave pharmaceutical companies.
Funding
The author(s) disclosed receipt of the following financial support for the research, authorship, and/or publication of this article: This manuscript was supported by the Centers for Disease Control and Prevention through cooperative agreements U50/CCU622315-02 and U84/CCU422516-02 and contracts 200-2006-18912 and 200-2006-18949.