



Abstract
ADHD is one of the most commonly diagnosed disorders affecting school-age children, with approximately 5% of children diagnosed (American Psychiatric Association [APA], 2013). Children and adolescents with ADHD are at an increased risk for negative outcomes in various domains, including academic (Loe & Feldman, 2007), social (Gaub & Carlson, 1997), and familial functioning (Danforth, Barkley, & Stokes, 1991), as well as an increased risk for internalizing psychopathology (Kadesjö & Gillberg, 2001; Miranda, Soriano, Fernández, & Meliá, 2008). Although the symptoms of ADHD, inattention and hyperactivity-impulsivity, are highly correlated, the particular outcomes faced by youth with ADHD typically differ by subtype. Children with the predominantly inattentive subtype of ADHD often experience greater academic impairments and are more likely to have a comorbid learning disability than are students with other ADHD subtypes (Gaub & Carlson, 1997). Children displaying inattention also tend to be more socially withdrawn (Hodgens, Cole, & Boldizar, 2000) and are often rated as being more sluggish and passive (McBurnett, Pfiffner, & Frick, 2001). However, children with significant levels of hyperactivity or impulsivity often present with more externalizing, inappropriate behaviors, such as interrupting and talking excessively, and therefore tend to experience more peer problems than do children with inattentive symptoms (Gaub & Carlson, 1997).
Multiple conceptualizations of the dimensionality of ADHD have been presented to account for the heterogeneity of the disorder. These include a one-factor model, a two-factor model of inattention and hyperactivity-impulsivity, and a three-factor model in which inattention, hyperactivity, and impulsivity are separate factors. Recently, an alternative to these models, referred to as a bifactor model, has been proposed as “more consistent with the way ADHD is thought of by clinicians or portrayed in the DSM-IV” (Martel, von Eye, & Nigg, 2010, p. 906). In the bifactor model, each symptom has a non-zero loading on the primary dimension of ADHD (i.e., the general or “g” factor) and a secondary loading on a specific component (“s” factor; for example, inattention, hyperactivity-impulsivity), as shown in Figure 1. Bifactor models have been recommended for “substantively complex constructs” (Reise, Morizot, & Hays, 2007, p. 22) such as ADHD that contain a heterogeneous set of symptom indicators. Unlike a second-order factor model in which a construct is conceptualized at a higher level of abstraction to explain lower order constructs, the bifactor model represents the general and specific constructs at the same conceptual level (Reise et al., 2007). This model provides an opportunity to explore general and specific risk factors that youth with ADHD may face, depending on the specific constellation of symptoms they experience. Support for the fit of the bifactor model in clinical and community samples of school-age children has been provided (Martel, Roberts, Gremillion, von Eye, & Nigg, 2011; Martel et al., 2010; Toplak et al., 2009; Toplak et al., 2012).

Bifactor model of ADHD.
One of the advantages of the bifactor model is that general and specific dimensions of ADHD can simultaneously be examined in relation to external variables, thus providing information on whether these dimensions of ADHD relate to other theoretically meaningful constructs (e.g., conduct disorder, anxiety) in similar or different ways. Martel and colleagues (2011) demonstrated the value of the bifactor model in relationship to external outcomes when they explored the links between ADHD general and specific latent factors (“g” and “s”), and problem behaviors, cognitive control, and personality factors. Martel and colleagues (2011) found the bifactor model demonstrated differential associations between the “s” factors and external outcomes. Specifically, the inattention factor was associated with outcomes such as withdrawal/depression, slower cognitive performance, introversion, and agreeableness, while hyperactivity-impulsivity and the general ADHD factors were associated with outcomes such as anxiety/depression, rule-breaking behavior, aggression, social problems, extraversion, low effortful control, high negative emotionality, and disagreeableness.
One external outcome not yet explored in relation to ADHD symptoms in adolescence, which may be particularly relevant, is life satisfaction (LS). LS has been defined as a “cognitive judgmental process in which individuals assess the quality of their lives on the basis of their own unique set of criteria” (Pavot & Diener, 1993, p. 164). LS appraisals span from miserable to delighted (Seligson, Huebner, & Valois, 2003). The purposeful examination of perceived quality of life beyond simply satisfactory contrasts the historical research attention devoted to problem-focused conceptualizations of mental health. Keyes (2009) and others makes clear that an absence of problems is not equivalent to the presence of wellness. As such, LS has been increasingly used as a positive indicator of mental health in line with the tenets of positive psychology (Seligman & Csikszentmihalyi, 2000). In a growing number of studies, high LS has predicted healthy youth development in multiple domains, including social relationships, academic performance, and physical health (for a review of this literature, see Suldo, Huebner, Savage, & Thalji, 2011). LS also serves functional roles in explaining the pathway or conditions under which environmental circumstances are linked to negative indicators of mental health in youth. As a mediator, for example, authoritative parenting has been linked to reduced psychopathology in adolescents via their increased LS (Suldo & Huebner, 2004b). As a moderator, high LS has functioned as a buffer against the development of later behavior problems following increased environmental stressors (Suldo & Huebner, 2004a). Among adults, low levels of LS have been found to precede the onset of depression (Lewinsohn, Redner, & Seeley, 1991). These findings underscore the importance of high LS as it facilitates positive functioning and buffers against the development of psychopathology. Notably, many of the negative outcomes associated with ADHD (e.g., depression, reduced academic achievement) are also associated with low LS; therefore, it seems plausible (but untested) that youth with ADHD could be more vulnerable to lower levels of LS. In any event, exploring the relationship between ADHD symptoms and LS could help move toward a dual focus on strengths and challenges encountered by this population and away from an exclusive focus on problem behaviors (DuPaul, 2007).
We could identify only one published study, conducted with 369 university students in Iceland, that examined the relationship between severity of ADHD symptoms and LS (Gudjonsson, Sigurdsson, Eyjolfsdottir, Smari, & Young, 2009). Participants in this study provided self-reports of their combined ADHD symptoms (i.e., inattention, hyperactivity, and impulsivity), which were examined on a continuum, and their LS. Even though the levels of ADHD symptoms in this study were mild, they were significantly correlated to lower levels of LS. Gudjonsson and colleagues (2009) also examined the relationship between LS and subtype-specific checklists of ADHD symptoms. For males, the negative relationship between LS and ADHD symptoms was significant for inattentive symptoms, but was not significant for hyperactive-impulsive symptoms. For females, the relationship between LS and both sets of ADHD symptoms was significant in the negative direction. Thus, results of this study demonstrated that even mild symptoms of ADHD were associated with lower levels of LS. However, there is currently no research examining this relationship in children or adolescents.
Research has demonstrated that ADHD persists throughout the course of life and that difficulties in the academic and social domains, as well as other comorbidities, can compound over time. The aims of this study were to determine the associations between ADHD (broadly and with regard to the specific symptoms) and LS in early adolescence. To address this aim, this study began with an evaluation of a bifactor model of ADHD consisting of a general (“g”) factor and two specific (“s”) factors (inattention and hyperactivity-impulsivity). Separate bifactor models were evaluated for 18 ADHD symptoms reported by students and 18 ADHD symptoms reported by teachers. Following an examination of the factor structure of the ADHD symptoms, this study used the bifactor models to examine how “g” and “s” factors of ADHD symptoms related to the LS of early adolescents.
The current study adds to the literature in that there are no published studies examining the relationship between inattentive and hyperactive-impulsive symptoms and LS within a child or adolescent population. Although different measures are utilized, the current study mirrors the aforementioned study conducted examining the relationship between ADHD symptoms and LS (Gudjonsson et al., 2009) by having each of these constructs rated through self-report by middle school students. However, given previous research indicating teachers are more accurate reporters of student behavior than are students when rating externalizing behavior (Pelham, Fabiano, & Massetti, 2005; Phares, 1997), the relationship between ADHD and LS was also explored with teacher-rated ADHD symptoms.
Method
Participants
Participants were students in Grades 6 through 8 who were recruited from two public middle schools in a large school district in the southeastern United States. Participants were required to be enrolled full-time in the general or gifted education curriculum, to return a signed parent consent form, and to provide written assent. Parent consent was obtained for 198 students (10% of total enrolled students). One-hundred eighty-three students were present on data collection days and assented to participate (9% of students enrolled across both schools). The sample was 63.9% female; 26.2% African American, 36.1% Caucasian, and 28.4% Hispanic; 57.9% of the students in the sample received free or reduced-price school lunch (FRL). This sample was comparable with the combined school populations in terms of race/ethnicity (27.3% African American, 31.1% Caucasian, and 32.4% Hispanic) and receipt of FRL (65.5%), but the sample had a higher percentage of females in comparison with the combined school populations (49.9%). Similarly, the sample was comparable with the district (which is similar to state demographics) in terms of race/ethnicity (21.7% African American, 40.4% Caucasian, and 29.4% Hispanic), receipt of FRL (56.1%), but again the sample had a higher percentage of females in comparison with the district (48.4%). Nearly half of the sample was comprised of sixth-grade students (46.4%), with the remainder almost equally split between seventh (25.7%) and eighth (28.0%) grade.
Instruments
Vanderbilt ADHD Diagnostic Teacher Rating Scale (VADTRS)
Teachers completed the 43-item VADTRS (Wolraich, Feurer, Hannah, Baumgaertel, & Pinnock, 1998). The inattention and hyperactivity-impulsivity subscales from this measure were used in the present study. The measure includes 9 items that assess symptoms of inattention (e.g., “Is forgetful in daily activities”) and 9 items that assess hyperactive-impulsive symptoms (e.g., “Fidgets with hands or feet and squirms in seat”). Teachers’ responses range from 0 (never present) to 3 (very often present). The VADTRS has high internal consistency (Wolraich et al., 1998). Wolraich and colleagues (1998; Wolraich et al., 2003) used exploratory and confirmatory factor analyses (CFAs) with two sets of data and suggest that analyses most strongly supported the two-factor solution (inattention and hyperactivity-impulsivity).
ADHD Student Self-Rating Scale
Students completed a 25-item rating scale created by the authors of the present study and designed to be comparable with the VADTRS with permission from the VADTRS author. The inattention and hyperactivity-impulsivity subscales from this measure were used in the present study. The measure includes 9 items that assess symptoms of inattention (e.g., “I tend to forget what I am supposed to do every day”) and 9 items that assess hyperactive-impulsive symptoms (e.g., “I fidget with my hands or feet or squirm in my seat”). Students’ responses range from 0 (never present) to 3 (very often present).
Students’ Life Satisfaction Scale (SLSS)
The SLSS, completed by student participants, is a 7-item measure of global LS in children and adolescents (Huebner, 1991). Example items include “My life is going well” and “I would like to change many things in my life” (reverse-scored). The response scale ranges from 1 (strongly disagree) to 6 (strongly agree). Research has demonstrated that the SLSS has adequate internal consistency reliability, test–retest reliability, and concurrent validity (Huebner, 1991, 1994).
Procedure
On institutional review board (IRB) approval, consent forms were sent home with all eligible students in both middle schools. Teachers were instructed to tell students that by returning a signed consent form (regardless of whether parents gave consent for participation) they would be entered into a drawing for a US$25 gift card. This information was also communicated to students through a video announcement during the daily school news program. Two gift cards per grade were given at both schools. Data were collected in the spring of 2010 by a research team of graduate assistants led by a faculty member (primary investigator [PI]). Assistants received training from the PI to ensure standardization across data collection. The student assent form was read aloud and completed prior to survey completion. Student participants completed the SLSS, ADHD scale, and other measures administered as part of the larger study in groups of approximately 5 to 25 during the students’ elective classes. Completion of the survey packet took approximately 40 min. Students received a small token of appreciation immediately following completion of the survey.
Teachers who consented to participate were provided with a packet containing the VADTRS for each student participant in their homeroom class. Teachers were given approximately 1 week to complete the rating scales, and completion of the scales was estimated to be approximately 5 min per student. Teachers were provided with a US$2 gift card for each student questionnaire packet they completed. Fifty-two teachers completed the ratings. The number of ratings ranged from 1 to 10 students with the modal number of students rated equal to 3 (M = 3.5, median = 3).
Analyses
To evaluate the various conceptualizations of ADHD that have been presented in the literature, separate CFAs were conducted for the 18 items from the ADHD Student Self-Rating Scale and the 18 items from the VADTRS. Responses to items from both instruments were treated as ordinal data. Analyses of the polychoric correlations of the 18 items were conducted in Mplus 6.0 (Muthén & Muthén, 1998-2010) using robust weighted least squares estimation with mean- and variance-adjusted chi-square test statistic (WLSMV). When covariates are not present in the model, Mplus uses pairwise deletion of missing data when computing the polychoric correlations. The amount of missing data per item was minimal and ranged from 0% to 4.9% (M = 1.6%, median = 1.1%). Chi-square tests of model fit and standard errors were computed using Mplus’s complex sampling analysis approach (i.e., Type = Complex) to take into account the lack of independence in the data (i.e., students were nested within teachers).
Analyses began with an examination of the bifactor model underlying the ADHD items (see Figure 1). The variances of the general, inattentive, and hyperactivity-impulsive latent variables were fixed to 1 to identify the model. Consistent with previous formulations of the bifactor model, the correlation between the specific factors (inattentive and hyperactive-impulsive) was constrained to 0, as were the correlations between the general factor and each of the specific factors. Because several alternative models (i.e., a two-factor model of hyperactivity-impulsivity and inattention; a three-factor model of hyperactivity, impulsivity, and inattention; and a one-factor model) have been presented in the literature, these models were examined for comparative purposes. Fit of the models was evaluated using the χ2 test, the comparative fit index (CFI), and the root mean square error of approximation (RMSEA). Hu and Bentler’s (1999) cutoff values of greater than or equal to .95 for the CFI and Kline’s (2005) value of the RMSEA < .05 as suggesting close fit and between .05 and .08 as indicating adequate fit were used as general indicators of acceptable fit of the models; however, substantive issues such as the interpretability of the parameter estimates were also considered.
Following an examination of the measurement model underlying the 18 ADHD items, LS was added to the bifactor model as an endogenous latent variable as measured by the seven LS items. Students’ gender (0 = male, 1 = female) and grade level (6, 7, 8) were added as covariates to the full structural equation model (SEM).
Results
Descriptive Analyses
Table 1 provides the response distributions for the 18 ADHD items as reported by students and teachers. Cronbach’s alphas for the teacher-rated ADHD items in the current sample were .97 for the total scale (n = 165), .97 for inattention (n = 175), and .95 for hyperactivity-impulsivity (n = 170). For the student-rated items, Cronbach’s alphas were .92 (n = 173) for the total scale, .88 (n = 175) for inattention, and .85 (n = 178) for hyperactivity-impulsivity. Item means on the SLSS, which was completed by students, ranged from 3.48 (SD = 1.81) for the reverse-scored Item 3 (“I would like to change many things in my life”) to 4.94 (SD = 1.29) for Item 5 (“I have a good life”). The Cronbach’s alpha for the current sample on the SLSS was .89 (n = 170).
Distribution of ADHD Items as Rated by Student Self-Report and Teachers.

Note. Responses ranged from 0 (never present) to 3 (very often present).
CFA
Two CFA models using robust least weighted squares were run to evaluate the bifactor model, one with student ratings of inattention and hyperactivity-impulsivity and one with teacher ratings. For student self-ratings, the results of the CFA indicated that based on the chi-square statistic there was a statistically significant lack of fit for the bifactor model, χ2(117, N = 176) = 132.836, p < .001. However, limitations of the chi-square fit statistic have been well documented with minor misfit achieving statistical significance as a function of sample size. When alternative measures of fit less sensitive to sample size were used, the results indicated very good fit for the bifactor model (CFI = .995; RMSEA = .028). Similarly for the teacher data, results of the CFA indicated that based on the chi-square statistic there was a statistically significant lack of fit for the bifactor model, χ2(117, N = 181) = 156.253, p < .001; however, alternative measures of fit indicated very good fit for the bifactor model (CFI = .997; RMSEA = .043). The student and teacher bifactor models were compared with alternative models (one-factor model, two-factor model of hyperactivity-impulsivity and inattention, and the three-factor model of hyperactivity and impulsivity as separate factors and inattention), and the fit for these models was consistently poorer than those from the bifactor model. See Table 2 for a summary of the fit statistics for these models. Given the poorer fit of these models, they are not discussed further.
Confirmatory Factor Analysis Model Comparisons Using Robust Weighted Least Squares Estimation for Non-Independent Data.
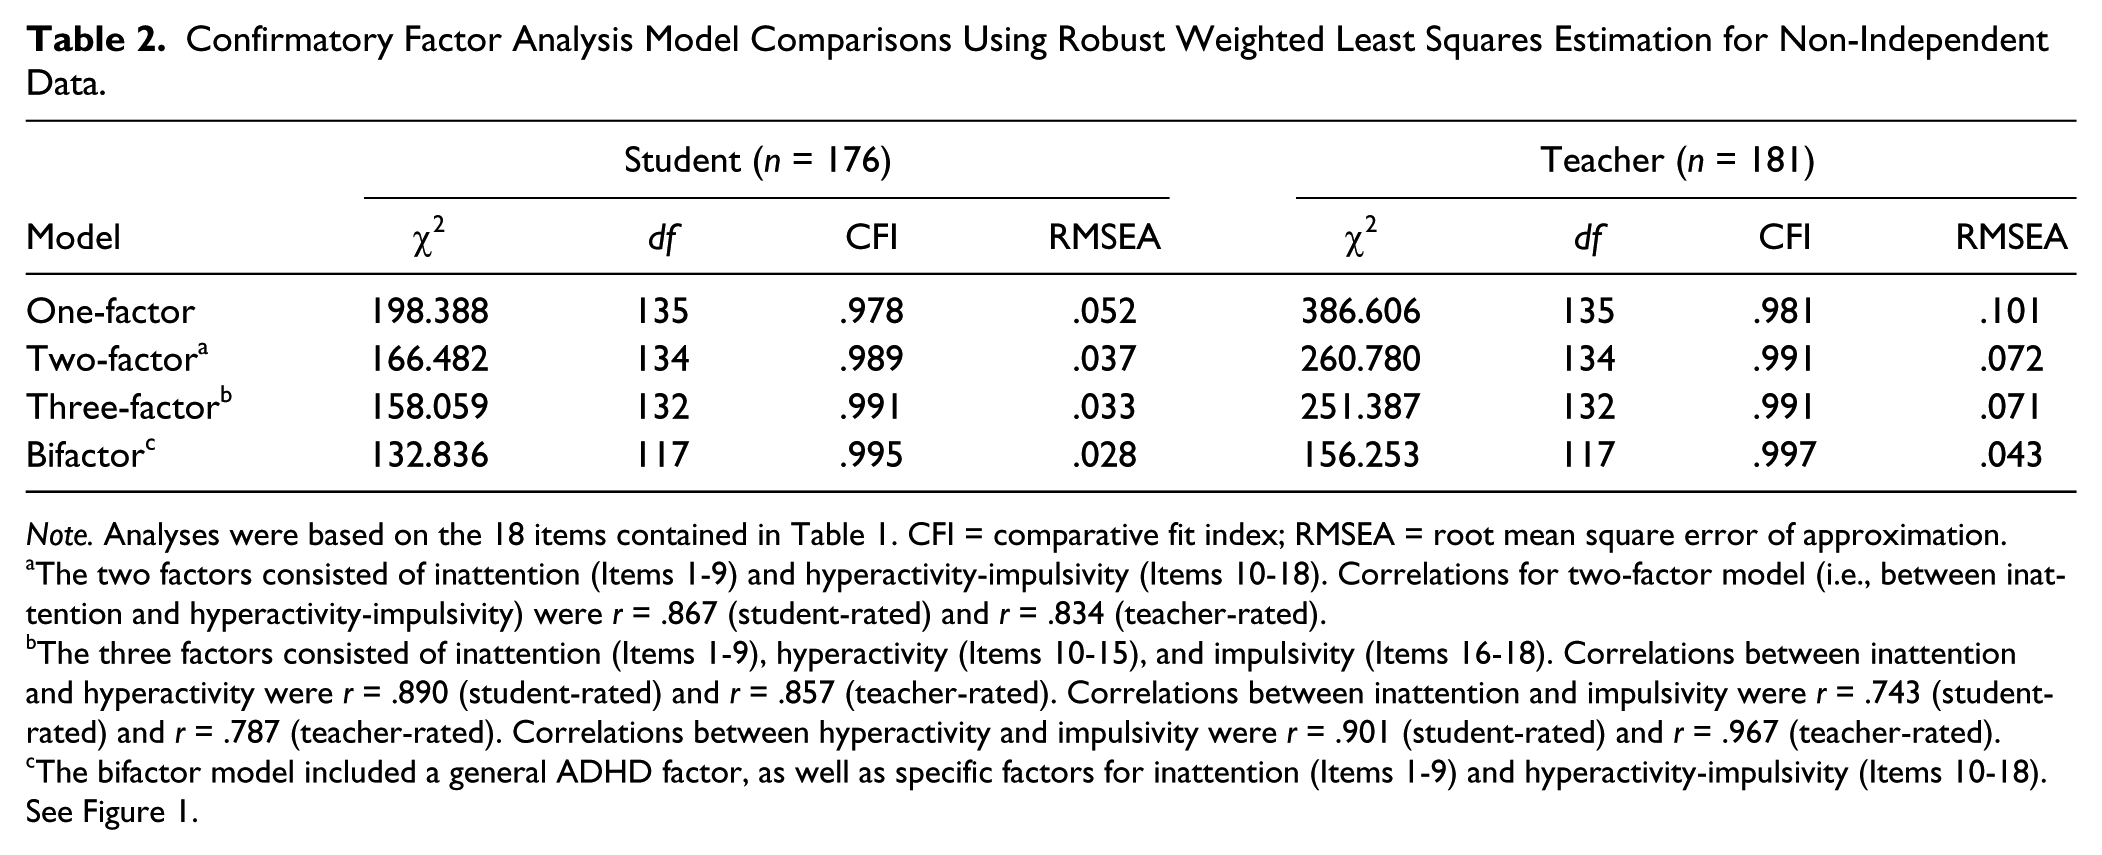
Note. Analyses were based on the 18 items contained in Table 1. CFI = comparative fit index; RMSEA = root mean square error of approximation.
The two factors consisted of inattention (Items 1-9) and hyperactivity-impulsivity (Items 10-18). Correlations for two-factor model (i.e., between inattention and hyperactivity-impulsivity) were r = .867 (student-rated) and r = .834 (teacher-rated).
The three factors consisted of inattention (Items 1-9), hyperactivity (Items 10-15), and impulsivity (Items 16-18). Correlations between inattention and hyperactivity were r = .890 (student-rated) and r = .857 (teacher-rated). Correlations between inattention and impulsivity were r = .743 (student-rated) and r = .787 (teacher-rated). Correlations between hyperactivity and impulsivity were r = .901 (student-rated) and r = .967 (teacher-rated).
The bifactor model included a general ADHD factor, as well as specific factors for inattention (Items 1-9) and hyperactivity-impulsivity (Items 10-18). See Figure 1.
Standardized factor loadings (shown in Table 3) for the general factor in the bifactor student self-rating CFA model were all significantly different from zero (p < .05) and ranged from .481 to .845 (M = .680, median = .681, SD = .102). For the specific factor of inattention, only three of the nine standardized loadings were statistically significant (p < .05). The loadings ranged from −.132 to .470 (M = .084, median = .044, SD = .208). For the specific factor of hyperactivity-impulsivity, eight of the nine standardized loadings were statistically significant and ranged from .144 to .570 (M = .375, median = .362, SD = .127).
Standardized Parameter Estimates (Standard Error) Using Robust Weighted Least Squares Estimation for Non-Independent Data.

Note. All factor loadings are significant at p < .05 level, except for items marked ns.
For the teacher ratings, the standardized factor loadings (shown in Table 4) for the general factor in the bifactor CFA model were all significantly different from zero (p < .05) and ranged from .667 to .944 (M = .835, median = .847, SD = .079). For the specific factor of inattention, eight of the nine standardized loadings were statistically significant and ranged from .186 to .619 (M = .406, median = .405, SD = .125); for hyperactivity-impulsivity, eight of the nine factor loadings were statistically significant and ranged from .068 to .625 (M = .385, median = .396, SD = .185).
Standardized Regression Coefficients of Life Satisfaction on ADHD Factors and Covariates for Student and Teacher Ratings.

Note. A correlated error term was estimated for the errors for the two reverse-scored items (Items 3 and 4) on the Students’ Life Satisfaction Scale. The correlations were .312 (SE = .071) and .215 (SE = .045) for the student and teacher data, respectively.
p < .05. **p < .01.
Looking across the student and teacher models for the specific factors revealed that the biggest differences were for the inattention factor. Only three of the nine loadings for the student model were statistically significant, whereas eight of the nine loadings were statistically significant in the teacher model. Items 5 (“Has difficulty organizing tasks”), 7 (“Loses things necessary to work on tasks or activities”), and 9 (“Tends to forget what to do every day”) were significant in each model, while Item 8 (“Gets easily distracted”) was not significant in both models. For the specific factor of hyperactivity-impulsivity, Item 10 (“Fidgets with hands or feet or squirms in seat”) was the only item that was not statistically significant in each model.
Structural Equation Modeling: ADHD and LS
LS was added to the bifactor model as an endogenous latent variable as measured by the seven LS items. A correlated error term between the reverse-scored Items 3 and 4 on the SLSS was included in the student and teacher models based on statistical (i.e., improvement in model fit) and conceptual criteria (i.e., method effects introduced by reverse-scored items). Students’ gender (0 = male, 1 = female) and grade level were added as covariates to the full SEM. The main focus of interest with this model was the assessment of how well the three latent factors (general ADHD, inattention, hyperactivity-impulsivity) relate to LS, after controlling for the covariates of gender and grade level.
Results of the two models (student self-ratings, teacher ratings) using robust weighted least squares indicated that based on the chi-square statistic there was a statistically significant lack of fit for the full SEM that included the ADHD factors, LS, and the two covariates: Student: χ2(295, N = 178) = 328.473, p < .001; Teacher: χ2(295, N = 181) = 360.438, p < .001. Alternative measures of fit for this model, however, indicated very good fit (Student: CFI = .993; RMSEA = .025; Teacher: CFI = .995; RMSEA = .035).
In the student self-rating model, 55% of the variance in LS (R2 = .550, SE = .116, p < .001) was accounted for by the three latent factors (general ADHD, inattention, hyperactivity-impulsivity) and the two covariates (gender and grade level). The standardized regression coefficients of LS on the general ADHD factor (β = –.608, SE = .061) and the inattention factor (β = –.408, SE =.139) were negative and statistically significant (p < .01). Hyperactivity-impulsivity was not significantly related to LS (β = −0.047, SE = .071, p = .510) when taking into account the covariates.
In the teacher rating model, 22% of the variance in LS (R2 = .220, SE = .101, p < .05) was accounted for by the three latent factors (general ADHD, inattention, hyperactivity-impulsivity) and the two covariates (gender and grade level). The standardized regression coefficient of LS on the specific inattention factor was negative and statistically significant (β = –.397, SE = .117, p < .01). LS was not significantly related to the specific factor of hyperactivity-impulsivity (β = –.117, SE = .138, p = .395) or the general ADHD, or “g,” factor (β = –.006, SE = .123, p = .962) when taking into account the covariates. These results are shown in Table 4.
Discussion
The present study found that the bifactor model with one general ADHD factor and two specific factors of inattention and hyperactivity-impulsivity provided very good fit to the ADHD symptom data reported by students and teachers. These results are consistent with recent studies that have examined the bifactor model with various samples using different measures of ADHD. For example, the fit indices of the bifactor model in the current study (CFIs = .995 and .997 and RMSEAs = .028 and .043 for the student and teacher models, respectively) were slightly higher than those found by Toplak et al. (2012) for the identical bifactor model in a sample of 1,350 children and adolescents with ADHD from eight countries; fit indices for the two-factor bifactor model using teacher ratings of ADHD were .968 (CFI) and .067 (RMSEA). The strong statistical and conceptual support for these bifactor models with ADHD would suggest that researchers consider these models as possible alternatives to either unidimensional models or models with correlated factors without a dominant general factor.
Results of the current study also demonstrated that the ADHD symptoms as conceptualized using a general ADHD factor and two specific factors were differentially related to LS. For student self-ratings of ADHD symptoms, the general ADHD factor and the specific factor of inattention were significantly and negatively related to LS; however, when teacher ratings of ADHD symptoms were used, only inattention was significantly negatively related to LS. The results based on student self-report are consistent with the available literature that suggests a link between ADHD symptoms and LS in university students (Gudjonsson et al., 2009). No previous research has explored the link when an external rating of behavior (e.g., informant report) is used to identify ADHD symptoms.
The finding that inattention was a more consistent predictor of LS than hyperactivity-impulsivity and the general ADHD factor is consistent with previous research. Gudjonsson et al. (2009) found that inattention was more consistently related to LS. It seems plausible that inattention may be a stronger predictor of LS given the fact that inattention is more often linked to higher levels of depression than other subtypes of ADHD (Carlson & Mann, 2000), and depression has a strong inverse relationship with LS in youth (Proctor et al., 2010). These findings demonstrate the utility of the bifactor model in providing deeper insight into which students may be at the greatest risk for experiencing lower levels of LS. This has implications for the development of comorbid conditions including internalizing and externalizing forms of psychopathology (Lewinsohn et al., 1991; Suldo & Huebner, 2004a). Whereas the results of this study consistently point to links between inattentive symptoms and LS, this research is not conclusive as to whether LS is related to ADHD broadly (e.g., the “g” factor), given that the broad ADHD factor was found to be related to LS when ADHD symptoms were reported by students but not by teachers. In general, students’ reports of ADHD symptoms were more strongly linked to LS than were teachers’ reports of ADHD symptoms. This is not surprising given that LS is a subjective, self-report rating; it seems logical that if students rate themselves high for problematic behaviors (e.g., inattention, hyperactivity, and impulsivity), they would also be less satisfied with their life circumstances. The relationship between ADHD symptoms and LS was still present but weaker when ADHD symptoms were reported by teachers. This is important given that teacher ratings are often used to measure students’ externalizing behavior, in line with the notion that teachers are accurate reporters of student behavior, especially externalizing behaviors (Pelham et al., 2005; Phares, 1997). Teacher ratings are also often utilized, in combination with other sources, for diagnosis of ADHD.
Limitations and Directions for Future Research
One key limitation of this study is the sole focus on the presence of symptoms of ADHD, as opposed to impairment in various domains associated with these symptoms. To meet diagnostic criteria for ADHD, impairment in two or more domains is necessary (e.g., academics or social relationships). Research has suggested that the symptoms of ADHD and impairment may be only moderately correlated, and impairment may be more directly related to outcomes than symptoms (Gordon et al., 2006). It is unclear how impairment would relate to ADHD symptoms and LS. Future research should examine outcomes (including LS) in samples of students who demonstrate not only symptoms of ADHD but also meet the full diagnostic criteria (i.e., symptoms and impairment). Another limitation of the study is the lack of parent ratings of ADHD symptoms. In the current study, differences were found in the relationship between LS and ADHD symptoms when student versus teacher ratings were used. Parent ratings are a key component of the ADHD diagnostic process (Pelham et al., 2005), and should be included in future research examining the relationship between ADHD symptoms and LS.
The sample size in the current study was also smaller than desired, and the subsamples of students with elevated symptoms of ADHD as rated by their teachers were particularly small. Moreover, it is possible that students who returned parental consent forms and agreed to participate in the study represent a self-selected sample of students that differs in some ways from other middle school students who did not return their parental consent forms or declined to participate. However, the samples for the current study were overall representative of the students across both schools and in the district, with the exception of the overrepresentation of females and sixth-grade students in the current study sample. As the current study was the first to examine the relationship between ADHD symptoms and LS in an early adolescent population, replication is needed prior to making definitive conclusions on this relationship.
Implications
The current study contributes to existing literature on ADHD and LS given that there is currently only one study, which was conducted with university students (Gudjonsson et al., 2009). Because individuals with ADHD are at higher risk of negative outcomes in multiple domains, it is important to consider if ADHD symptoms in adolescents are associated with lower levels of LS. In addition, by using the bifactor conceptualization of the latent structure of ADHD, the current study also provides more nuanced insights into the relationship between ADHD symptoms and LS. The current study demonstrated that risk status for low levels of LS may differ based on the specific ADHD symptoms reported by students or their teacher. Given increased evidence related to the importance of fostering LS in the overall population (Diener & Diener, 1996), as well as recent suggestions regarding the importance of increasing positive academic and social outcomes for children with ADHD rather than focusing on problem behaviors (DuPaul, 2007), the current study provides additional insight into the mental health (when defined broadly) of youth with symptoms of ADHD. Students with elevated inattention symptoms, in particular, may be at risk for diminished LS, whereas LS may be unrelated to levels of hyperactive-impulsive symptoms.
Footnotes
Declaration of Conflicting Interests
The author(s) declared no potential conflicts of interest with respect to the research, authorship, and/or publication of this article.
Funding
The author(s) received no financial support for the research, authorship, and/or publication of this article.