



Abstract
Adolescence is a period characterized by increased risk-taking behaviors (Centers for Disease Control Prevention, 2010), with the prevalence of certain behaviors rising during late adolescence due to developmental transitions and increased opportunities for engagement (Brown et al., 2008; Institute of Medicine (US) and National Research Council (US) Committee on the Science of Adolescence, 2011). Prior research has identified attention/hyperactivity problems (AP) during childhood, including clinical diagnoses of ADHD, to be a risk factor for engaging in risk-taking behavior during late adolescence and early adulthood (Graziano et al., 2015), as well as risky decision making on laboratory tasks (Dekkers, Popma, Agelink van Rentergem, Bexkens, & Huizenga, 2016). However, the mechanistic processes connecting these two behavioral phenotypes remain uncertain. One likely candidate is neurobiological development, as brain regions exhibiting altered developmental trajectories in individuals with attention problems overlap with regions implicated in risk taking.
Attention problems (AP) that frequently co-occur with hyperactive and impulsive behaviors, as seen within the context of ADHD, are thought to be mediated by distributed brain regions, and in particular, the frontostriatal network comprising prefrontal regions and the basal ganglia (Cubillo, Halari, Smith, Taylor, & Rubia, 2012). There is also a growing literature indicating that maturation of frontostriatal regions during adolescence may be related to AP during this period. For example, Shaw and colleagues demonstrated that individuals with ADHD have delayed cortical maturation in components of the attention network (Shaw et al., 2007). Longitudinal follow-up into adulthood identified a convergence toward normal cortical dimensions in individuals with remitted ADHD (i.e., similar thickness to typically developing individuals), while those with persistent ADHD continued to exhibit different cortical dimensions/patterns (Shaw et al., 2013). While these findings suggest differential cortical development in ADHD, comparatively less research has focused on AP as a continuous dimension with varying levels of severity within the general population.
In one of the few neuroimaging studies to examine AP dimensionally in a normative population, Ducharme and colleagues (2012) found that higher levels of AP, as assessed by the Child Behavior Checklist (CBCL), were associated with thinner cortices (in multiple prefrontal regions) in young children (up to 10 years of age), and a reversal of the relationship was identified in adolescents (11-18 year old). This was thought to be suggestive of slower cortical thinning in adolescents with greater AP, but findings were from cross-sectional data and only minimal trend-level effects were present in longitudinal data. In comparison, a longitudinal study by Shaw and colleagues (2011) found that greater hyperactivity and impulsivity symptoms in typically developing children were related to slower cortical thinning of prefrontal regions, including the middle frontal gyrus extending medially to the anterior cingulate, the orbitofrontal cortex (OFC), and right inferior gyrus. However, their questionnaire measure did not address attentional problems. Therefore, further longitudinal research is needed to confirm whether AP, characterized as a continuous dimension, is also related to changes in brain structure over time.
Furthermore, it is interesting to note that many of the neurodevelopmental correlates that have been identified in relation to AP and ADHD, specifically dorsolateral prefrontal, anterior cingulate, and striatal regions underlying cognitive control, are also postulated to underlie risk behaviors during adolescence. Indeed, functional magnetic resonance imaging (MRI) studies have implicated activity in these regions in riskier decision making within laboratory paradigms, and some have also correlated this neural activity with riskier behaviors in real life (Braams, van Duijvenvoorde, Peper, & Crone, 2015; Crone & Dahl, 2012). However, research linking the neural correlates of AP and ADHD with risk behaviors is limited. Although there is some empirical evidence from functional MRI studies that activity in prefrontal and striatal regions predict risky decision making in individuals with ADHD (Cubillo et al., 2012), there has been no research examining the association between these two variables using a neurodevelopmental framework. This is an important limitation in the literature given that AP tends to occur earlier in childhood, while many risk behaviors only present later in adolescence when there is greater opportunity to engage in such activities.
Therefore, the current study investigated neurodevelopmental trajectories related to AP in a community sample of adolescents and subsequently whether these trajectories predicted later-emerging risk behaviors. Given that AP generally presents early in development, with prior estimates that 95% of individuals experience onset before 11 years of age (Kessler et al., 2005), we were particularly interested in investigating whether AP during early adolescence was related to future risk behaviors in late adolescence via brain development during the teen years. Using a longitudinal design with three time points of limited age variance (at 13, 17, and 19 years), we obtained up to three repeated brain scans per individual, as well as self-report questionnaires on AP at the first time point and risk behaviors at the last time point. We first examined the relationship between AP during early adolescence and brain development, hypothesizing that greater problems would be related to less thinning of the prefrontal cortex (PFC) over time, particularly in the cingulate and dorsolateral prefrontal cortices. We also explored whether similar developmental effects were present in striatal regions. Subsequently, we investigated whether neurodevelopmental trajectories associated with attention problems were in turn related to risk behaviors at late adolescence, specifically focusing on alcohol-harms and driving-related risk given the larger prevalence of these issues within the general population. We limited this analysis to regions related to attention problems as opposed to a whole brain approach, given that engagement in risk behaviors is influenced by a multitude of factors (aside from attention problems) beyond the scope of this study. We hypothesized that brain regions exhibiting less attention-related thinning over time would also predict greater risk behaviors at late adolescence. Finally, analyses were undertaken to examine whether reduced cortical thinning mediated the relationship between greater attention problems during early adolescence and greater risk behaviors at late adolescence.
Method
Participants
The sample described in the current study was derived from a larger longitudinal cohort enrolled in the Orygen Adolescent Development Study, conducted in Melbourne, Australia. Students (N = 2,453) in the final year of primary school were recruited from schools across metropolitan Melbourne to participate in an initial school-screening phase, which involved completion of the Early Adolescent Temperament Questionnaire-Revised (EATQR; Capaldi & Rothbart, 1992). Based on their scores on this measure, a smaller sample of 415 students were selected to be part of the study by over-sampling adolescents at the extreme ends of the distribution for temperamental factors of effortful control and neuroticism to maximize inter-individual differences in psychological well-being. Specifically, an equal number of participants were recruited from the following range of standard deviations above and below mean: (a) 0 to 1, (b) 1 to 2, (c) 2 to 2.5, and (d) greater than 2.5, to emphasize distribution at the tails.
Of the selected adolescents, 245 agreed to participate in further research. They were invited to take part in brain MRI assessments at three time points, when they were aged approximately 13 (Time 1 [T1]), 17 (Time 2 [T2]), and 19 (Time 3 [T3]), respectively. A number of adolescents declined participation in the MRI assessments, resulting in 177 participants who completed an MRI assessment at one time point or more. Based on visual inspection of processed MRI data (see below for details) by a researcher trained in neuroanatomy, nine of these participants were excluded due to poor MRI image quality and cortical reconstruction. In addition, two participants with full-scale IQ less than 70, as assessed by the Wechsler Intelligence Scale for Children IV, were excluded from the analyses.
Following exclusions, 166 participants (n = 86 males) aged 11 to 20 years were available for analysis, with a total of 367 scans over the three time points. Seventy-three of these participants had three scans, 55 had two scans, and 38 had one scan. Refer to Table 1 for a breakdown of the number of participants, by sex, available at each time point, as well as further demographic and cognitive characteristics of the final sample. Males and females were not found to differ on any of these variables (all p values > .05). Despite the sampling strategy described above, the final sample exhibited normal distribution on all temperamental factors that were used during the selection process, suggesting that the sampling bias had “re-normalized” due to participant loss. The final sample also did not differ from the initial school-screening sample (N = 2,453) on socioeconomic disadvantage (t(2,439) = 21.292; p = .197), or sex (Pearson’s χ2 = 2.245; p = .691). Twenty-eight participants of the final sample met criteria for past or current psychiatric disorder at T1, as assessed by a structured clinical interview using the Schedule for Affective Disorder and Schizophrenia for School-Aged Children: Present and Lifetime Version (K-SADS-PL; Kaufman & Schweder, 2004). Six of these participants were diagnosed with attention-related disorders at baseline (specifically five with ADHD and one with attention deficit disorder not otherwise specified). An additional 28 participants met criteria for psychiatric diagnoses at T2, and 19 participants at T3. The prevalence of psychopathology in the sample is consistent with previous reports in large community samples (Merikangas et al., 2010). We chose to include those with psychopathology in our analyses given the dimensional approach to mental health that was adopted by this study, as these adolescents increase variability in the symptom of interest (i.e., those with psychopathology lie on the extreme ends of continuous symptom dimensions). As a result, 20 participants were on psychotropic medication (for longer than 1 month) over to entire course of the longitudinal study. Refer to Online Supplementary Table S1 for further detail on psychiatric diagnoses. Informed consent was obtained from the child and at least one parent/guardian at each time point, consistent with the guidelines of the Human Research Ethics Committee at the University of Melbourne, Australia.
Sample Characteristics.
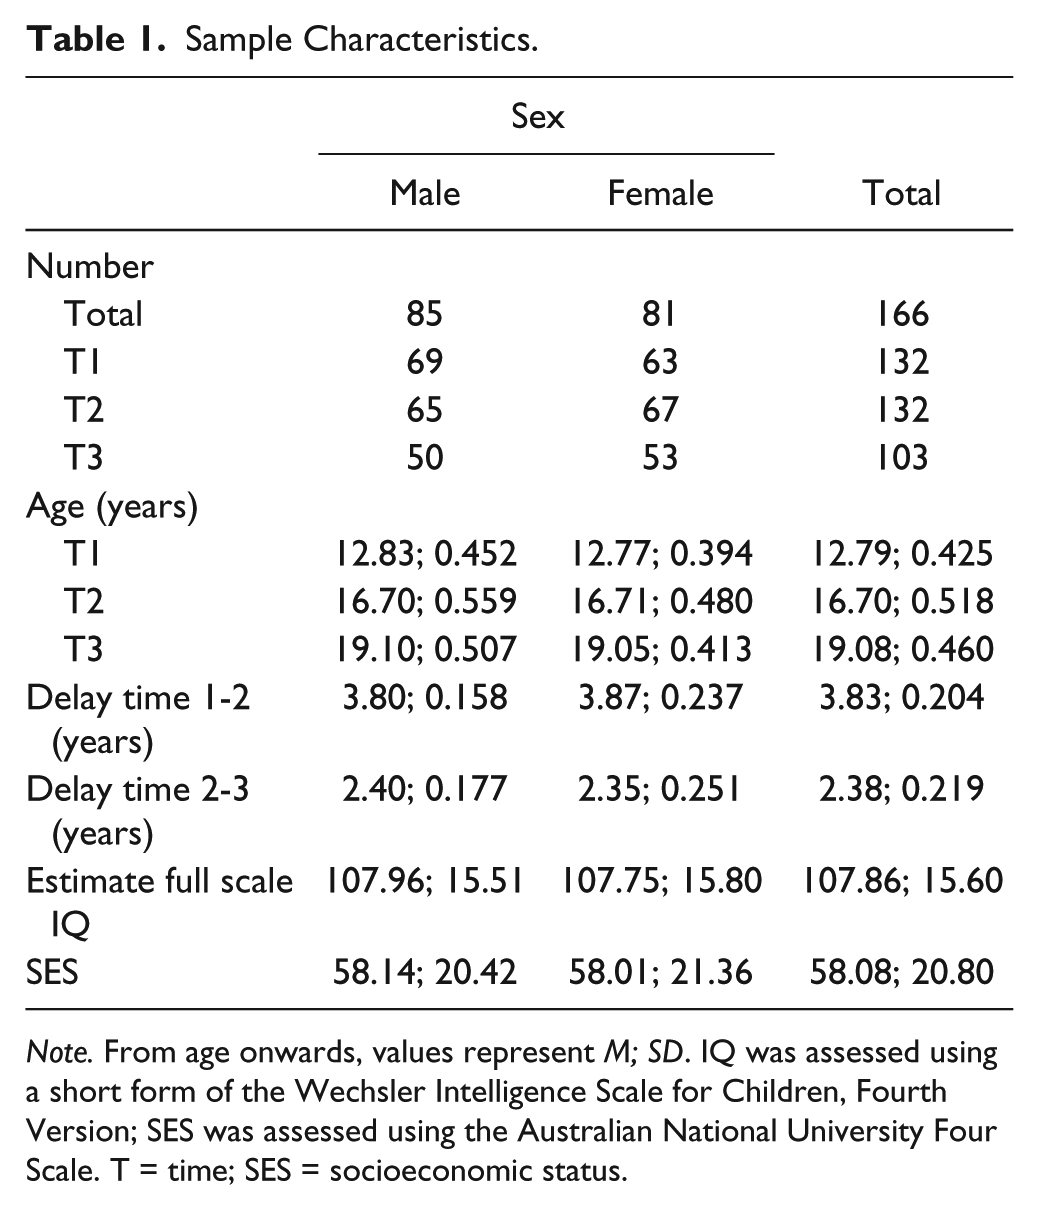
Note. From age onwards, values represent M; SD. IQ was assessed using a short form of the Wechsler Intelligence Scale for Children, Fourth Version; SES was assessed using the Australian National University Four Scale. T = time; SES = socioeconomic status.
MRI Acquisition and Analysis
Image acquisition
At T1, MRI scans were performed on a 3-T GE scanner at the Brain Research Institute, Austin, and Repatriation Medical Centre, Melbourne, Australia, with the following parameters: repetition time = 36 ms; echo time = 9 ms; flip angle = 35°, field of view = 20 cm, 124 T1-weighted contiguous slices (voxel dimensions = 0.4883 × 0.4883 × 1.5 mm). MRI scans at T2 and T3 were performed on a 3-T Siemens scanner at the Royal Children’s Hospital, Melbourne, Australia, with the following parameters: repetition time = 1,900 ms; echo time = 2.24 ms; flip angle = 9°, field of view = 23 cm; 176 T1-weighted contiguous slices (voxel dimensions = 0.9 mm3).
Processing
Images were transferred to an SGI/Linux workstation for morphometric analysis at the Melbourne Neuropsychiatry Centre, Melbourne, Australia. Cortical reconstruction was performed using the FreeSurfer image analysis suite (http://surfer.nmr.mgh.harvard.edu/), which provides a set of tools to reconstruct topologically correct and geometrically accurate surface models of the inner and outer cortical boundaries, thus deriving multiple anatomical measures, including cortical thickness and volume. To address issues arising from longitudinal and/or multisite studies (such as geometric distortion and voxel dimension drift), images were processed through the longitudinal stream of FreeSurfer Version 5.3 (Reuter, Schmansky, Rosas, & Fischl, 2012), which creates a within-subject unbiased template space and average image from both time points using robust, inverse consistent registration (Reuter & Fischl, 2011). The template is used as an estimate to initialize subsequent segmentation processes in the longitudinal stream for each time point, providing common information regarding anatomical structures and has been found to significantly increase reliability and statistical power (Reuter, Rosas, & Fischl, 2010). All images were visually inspected and manually edited if necessary.
Given that different scanners were used at T1 versus T2 and T3, a reliability analysis was undertaken to address concerns that changes in cortical thickness over time may be due to measurement bias from the different scanner platforms and acquisition parameters. This analysis revealed that changing scanners between T1 and T2 did not produce a systematic bias (see supplementary information online for further details), as reported in other studies by our group (Dennison et al., 2013; Vijayakumar, Whittle, Dennison, et al., 2014; Vijayakumar et al., 2013; Vijayakumar, Whittle, Yücel, et al., 2014).
Attention Problems
At T1 (age: M = 12.79; SD = 0.425), participants completed the Youth Self-Report–CBCL (Achenbach & Rescorla, 2000); a questionnaire that assesses children’s behavioral problems/competencies and contains an AP scale. This scale includes nine items that are rated from 0 (not true) to 2 (very true or often true) and relate to difficulty concentrating and sitting still and impaired school performance. The AP scale of the CBCL has been found to be a valid measure for use in adolescent populations (Ebesutani, Bernstein, Martinez, Chorpita, & Weisz, 2011). This was supported by negative associations between AP scores and temperamental effortful control in our sample (χ2 = −0.55, p < .001). Twelve adolescents (7%) had missing CBCL data, and Little’s Missing Completely At Random test was found to be non-significant (p > .05), suggesting the data were missing completely at random. To maximize power without bias, missing CBCL data were imputed using Expectation Maximization in SPSS 23.
Risk Behaviors
At T3 (age: M = 19.08; SD = 0.460), participants completed the “DRIVE” questionnaire subscale on risky driving behavior, which was developed as part of a large cohort study investigating risk factors for driving-related injuries and death in young populations (Ivers et al., 2006). Participants responded to 14 items about how often they engaged in behaviors such as speeding, using their mobile phone, listening to loud music, drag racing, and doing burnouts/skidding. Scores are summated, with higher scores representing greater engagement in risky driving behavior. In addition, we assessed alcohol-related harms at T3 using 10 items adapted from the Victoria Adolescent Health Survey (Hibbert, Caust, Patton, Rosier, & Bowes, n.d.). Participants were asked to endorse (yes/no) whether, over the past 12 months, their consumption of alcohol resulted in issues at home/work/school, fights, trouble with the police, loss of memory, depression/irritability, and other such adverse outcomes. Consistent with past research (Little et al., 2012), we summed the binary responses to create an alcohol-harms total score (ranging from 0 to 10). Following exclusions for missing data (n = 40) and participants who did not drive and/or had never consumed alcohol (n = 54), we were left with 72 adolescents with data on risk behaviors. We chose not to impute missing risk-taking data given that some adolescents may have never driven or consumed alcohol. Due to the positively skewed nature of the data, driving scores were log-transformed and alcohol data were binarized (based on a median split, as data were too skewed to achieve normality with transformations). We did not examine other risk behaviors, such as illicit substance use, given the comparatively low prevalence of risky use (e.g., only 20% of the current sample endorsed using cannabis more than 2 times).
Statistical Analysis
Linear mixed models were used to assess associations between AP and brain development, using cortical thickness and subcortical volumetric estimates obtained from each time point. For subcortical regions, volumetric estimates of the right and left caudate, putamen, pallidum, and nucleus accumbens were obtained from FreeSurfer’s automated subcortical segmentation procedure, and subsequent analyses were conducted in R. Vertex-wise thickness estimates for the cortical mantle were extracted from FreeSurfer and analyzed using SurfStat, a statistical toolbox for MATLAB (http://www.math.mcgill.ca/keith/surfstat/). We investigated the relationship between AP scores and brain development using linear mixed models that analyzed the effects of age and AP, while controlling for sex. Specifically, cortical thickness was modeled within each ith subject at each jth vertex using the following equation:

The dij term represents the random effect of the intercept within each vertex in each subject. The eijk represents the normally distributed residual error term. The same model was used for subcortical structures, although this was not conducted at a vertex-wise level (i.e., no j term). Age, sex, and AP were fixed effects, with β representing the parameter estimates for each of the main effects and interactions. All models were run with standardized continuous variables. Cortical analyses were corrected for multiple comparisons at a whole-brain level using random field theory (RFT), set at p < .05, within SurfStat. Subcortical analyses were corrected for multiple comparisons using Bonferroni correction for eight tests (p < .006). We chose to only examine linear trajectories of brain development, as opposed to higher order functions (i.e., quadratic or cubic change), given that there is a risk of over-fitting the data to more complex trajectories when there is a maximum of three data points available from each individual, along with limited variance in age at each wave of assessment.
For regions (either cortical or subcortical) whose development was found to be associated with AP, linear mixed models were subsequently used in R to assess whether development of these regions of interest (ROIs) were associated with risk behaviors during late adolescence. This was undertaken in the subsample of adolescents (n = 72) who had risk behavior data at T3 (with 177 MRI scans over the three time points). For cortical regions, a 5-mm cluster was defined around the peak vertex identified in the main analysis (described above), and average thickness was calculated for these cluster-based ROIs. These average thickness estimates, as well as relevant subcortical volumes, were modeled as outlined below:

Separate models were run for driving- and alcohol-related risk behaviors. Significant models were re-analyzed with residualized risk scores controlling for the other behavior type.
If ROIs also predicted risk behavior, mediation analyses were undertaken to examine whether brain development partially mediated the relationship between AP and risk behaviors. Given the unbalanced neuroimaging data set (i.e., different number of scans per individual and scans from different waves of assessment), brain development was calculated as the random slopes for each individual from the following linear mixed model:
Results
Attention Problems
Mean AP scores at T1 are reported in Table 2. No sex differences were identified in AP. Cortical thickness analyses identified a significant relationship between AP and grey matter development (i.e., age × AP interaction) within three clusters: (a) left dorsal prefrontal cortex (dPFC; p = .003, RFT-based cluster correction), extending both medially and laterally; (b) left ventrolateral prefrontal cortex (vlPFC; p = .002, RFT-based cluster correction); and (c) right OFC (p = .009, RFT-based cluster correction). As illustrated in Figure 1, those with lower AP at T1 had greater cortical thinning, while higher AP was related to less decrease (or increase) in cortical thickness with age. Post hoc analyses of median-split AP groups are presented in Table 3. Additional analyses, reported in supplementary information (see online supplementary information), revealed the cortical effects were specific to AP, as opposed to other externalizing (and internalizing) problems. Furthermore, controlling for psychopathology status (i.e., those with and without clinical diagnoses) or psychotropic medication use did not change the results. Analyses of striatal regions failed to identify any significant association between baseline AP and subcortical development. As such, subcortical regions were not explored any further in relation to risk behaviors.
Mean (SD) Attention Problem Scores at T1.

Note. T1 = Time 1; AP = attention/hyperactivity problems.

Significant interactions between age and AP scores predicting cortical thickness.
Post-Hoc Analyses of Cortical Development in Median-Split AP and Driving Risk Groups.
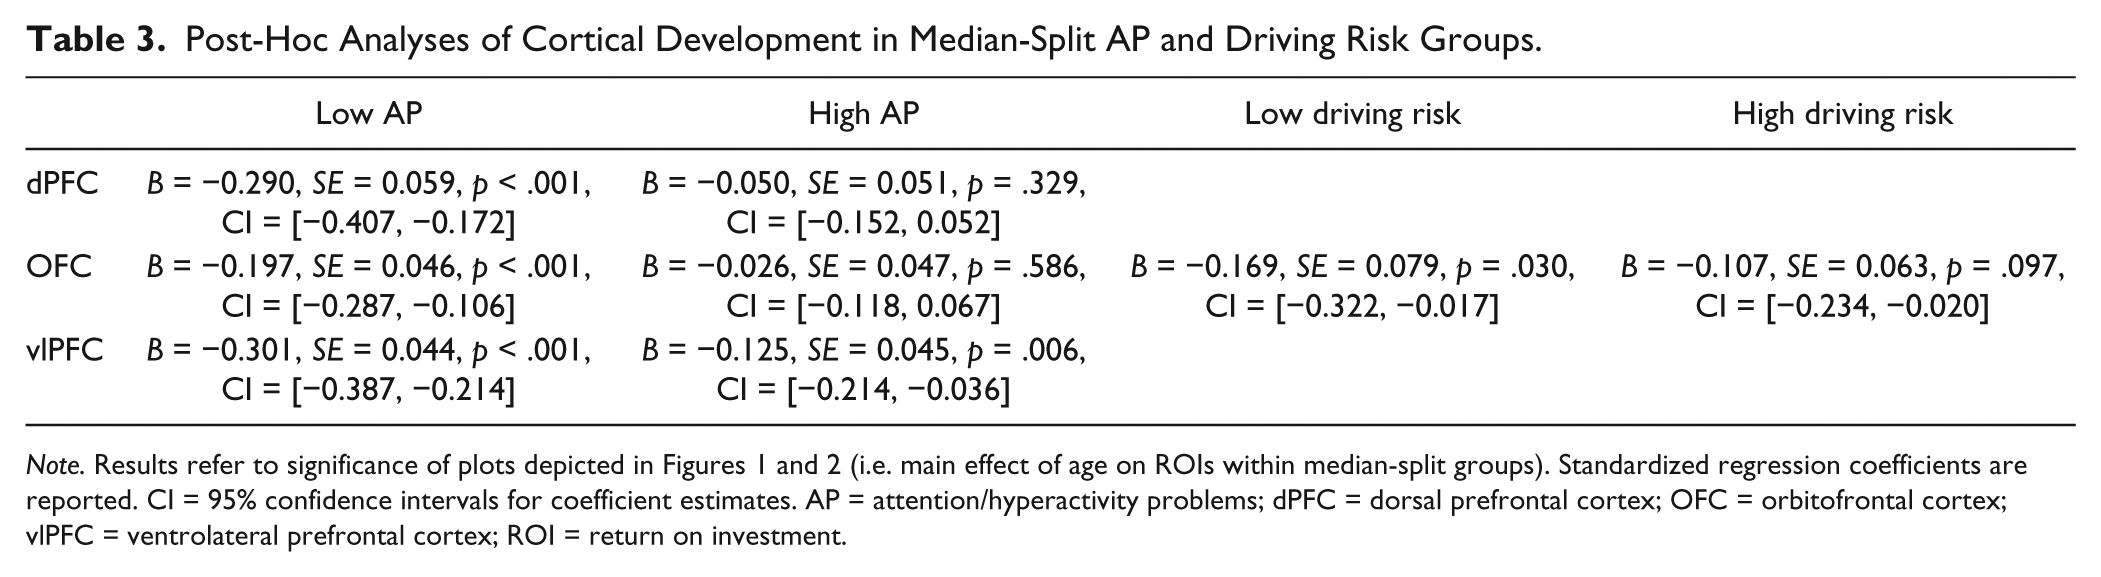
Note. Results refer to significance of plots depicted in Figures 1 and 2 (i.e. main effect of age on ROIs within median-split groups). Standardized regression coefficients are reported. CI = 95% confidence intervals for coefficient estimates. AP = attention/hyperactivity problems; dPFC = dorsal prefrontal cortex; OFC = orbitofrontal cortex; vlPFC = ventrolateral prefrontal cortex; ROI = return on investment.
Risk Behaviors
The association between brain development and adolescent risk behaviors was explored for regions whose development was significantly associated with AP (i.e., age × risk behavior interaction within left dPFC, left vlPFC, and right OFC). Mean thickness of 5-mm spheres around peak AP-related vertices in each cluster was calculated and used in mixed model analyses. Development of the OFC was tending toward significance (based on Bonferroni corrected p = .008) in its relationship to driving-related risk at late adolescence (B = 0.236, SE = 0.089, p = .009). As illustrated in Figure 2, greater risk behavior was associated with less thinning of this region. Post hoc analyses of median-split groups are presented in Table 3. Furthermore, given the strong correlation between driving- and alcohol-related risk behaviors (χ2 = 0.647, p < .001), we ran the same model after regressing out variance in driving risk explained by alcohol-risk (i.e., residualized score). This resulted in an even stronger association between OFC development and risk behavior uniquely related to driving, at p = .002. This finding survives Bonferroni correction for multiple comparisons based on seven models that were examined (p < .007). None of the other ROIs were related to driving- or alcohol-related risk behavior.

Interaction between age and driving risk predicting OFC thickness.
Mediation Analyses
Mediation models examined the indirect effect of AP on driving-related risk (using residualized scores) through OFC development. The results, reported in Table 4, revealed that although there was no direct effect of AP on driving-related risk, relative increases in OFC thickness over time significantly mediated the relationship between greater AP at early adolescence at greater driving-related risk behaviors at late adolescence.
Mediation Analyses: Indirect Effect of AP on Driving-Related Risk Behavior Through Cortical Development.

Note. AP = attention/hyperactivity problems; OFC = orbitofrontal cortex; CI = confidence interval.
Discussion
Our longitudinal neuroimaging investigation revealed a significant association between AP and structural brain development during adolescence, with individuals who had higher AP at early adolescence exhibiting less reduction in cortical thickness within the left dPFC, left vlPFC, and right OFC between early and late adolescence. Developmental trajectories of the right OFC was also associated with driving-related risk behaviors at late adolescence and partially mediated the relationship between AP during early adolescence and this risk behavior at late adolescence.
As hypothesized, adolescents with greater AP at early adolescence, as indexed by the CBCL, exhibited less reduction in cortical thickness within multiple areas of the PFC. These findings parallel prior research by Ducharme and colleagues (2012) that identified less prefrontal cortical thinning in adolescents with high AP, also assessed by the CBCL. Although their findings were only significant within cross-sectional analyses, our results also confirm their trend-level effects in longitudinal analyses, highlighting that AP, characterized as a continuous behavioral phenotype, is related to cortical development within the general population. This CBCL scale reflects problems with attention, hyperactivity, and impulsivity, and as such, it is not surprising that our findings are also consistent with a series of studies by Shaw and colleagues (Shaw et al., 2007; Shaw et al., 2011; Shaw et al., 2013) that have identified slower rates of prefrontal thinning in individuals with ADHD.
The identified brain regions have all been previously implicated in ADHD research, including a number of studies investigating neurodevelopmental differences between individuals with ADHD and controls. Specifically, Shaw and colleagues have shown that ADHD diagnoses, as well as greater hyperactivity/impulsivity symptoms in typically developing individuals, are related to less thinning of these regions (Shaw et al., 2007; Shaw et al., 2011; Shaw et al., 2013). The dPFC, which supports modulation of behavior according to environmental demands and task-related goals (Cubillo et al., 2012), is implicated in a host of cognitive functions, including executive control of attention, working memory, and evaluation of reward contingencies (Alvarez & Emory, 2006; Arnsten & Rubia, 2012; Banich, 2009). Similarly, the vlPFC is involved in inhibitory/interference control and cognitive flexibility. Decreased activation of both these regions has been identified when individuals with ADHD perform cognitive control tasks (Cortese et al., 2012; Cubillo et al., 2012). Structural changes in the OFC, which is involved in the regulation of emotion and motivation, have also been commonly identified in ADHD (Cubillo et al., 2012). This region is particularly important for reward processing and emotion regulation in response to reward and punishment (Arnsten & Rubia, 2012). Overall, our findings suggest that development of brain regions underlying both “cool” and “hot” aspects of cognitive control are associated with attention problems.
We also found that less thinning of the OFC was associated with greater driving-related risk behaviors at late adolescence. Functional neuroimaging has commonly implicated this region in reward processing during adolescence (Crone & Ridderinkhof, 2011), but minimal research has examined whether structural changes in the OFC is related to risk behaviors. To our knowledge, only one prior study investigated this relationship, specifically examining whether a developmental mismatch between maturation of cortical and subcortical structures predicted risky behavior (Mills, Goddings, Clasen, Giedd, & Blakemore, 2014). This prior study used a composite measure of risk that incorporated behaviors of sexual risk, substance and alcohol use, aggressive or illegal behavior, and academic risk behaviors, and failed to find any associations with brain development. Interestingly, we also failed to identify any associations with alcohol-related risk behaviors. While both risky driving and alcohol use increase during late adolescence, our findings may arise from these behaviors being related to different personality traits, and therefore varying neurodevelopmental patterns. For example, impulsivity has been found to be a stronger predictor of risky driving in comparison with sensation seeking, while the latter is more strongly related to alcohol consumption (Magid, Maclean, & Colder, 2007; Romer et al., 2011).
Our results also suggest that altered OFC development partially mediates the relationship between AP during early adolescence and driving-related risk behaviors at late adolescence. As mentioned above, the OFC is thought to regulate behavior and cognition within “hot” affectively laden situations (Zelazo & Carlson, 2012), playing an important role in reward-based decision making (Arnsten & Rubia, 2012). As such, it is unsurprising that development of this region connects attention problems and risk behaviors. Taken together, our findings suggest that greater cortical thinning may be an adaptive developmental pattern, which is consistent with a number of studies by our group and others that have found greater reduction in the size of brain structures during adolescence to be related to more adaptive functioning, including better cognitive and affective control (Ducharme et al., 2014; Tamnes et al., 2013; Vijayakumar, Whittle, Dennison, et al., 2014).
While the current study has strengths in the use of repeated within-participant neuroimaging, limitations should also be considered. For example, the AP scale of the CBCL assesses attention, as well as hyperactivity and impulsivity. As such, the findings are not exclusively related to attentional issues, but rather relate to the profile of issues commonly seen in ADHD. The inclusion of an attentional task in future research may provide valuable information on attentional capabilities to supplement the self-reported questionnaire measure. We chose to focus on two of the most prevalent risk behaviors, but future research would benefit from additional measures that examine a broader range of behaviors. Furthermore, our analysis of risk behavior was limited to brain regions implicated in AP given our research question. As such, we cannot comment on other regions that were not the focus of this investigation. It should also be noted that our MRI scans were acquired multisite, and there is a possibility of scanner/sequence bias affecting morphological estimates. However, post-acquisition procedures were adopted to minimize, as much as possible, any scanner effects on the acquired images. Our previous work has also shown no interscanner bias for most cortical regions, including the main ROIs in this study (Dennison et al., 2013; Vijayakumar, Whittle, Dennison, et al., 2014; Vijayakumar et al., 2013; Vijayakumar, Whittle, Yücel, et al., 2014). Furthermore, it is very unlikely that the measures of attentional problems interacted with scanner type in any way that might bias the reported results. In addition, different structural MRI software packages have their own strengths and weaknesses, and while there is some research suggesting that FreeSurfer is poorer at characterizing curve anatomical variations compared with other programs (Zhong, Phua, & Qiu, 2010), the availability of a longitudinal pipeline makes FreeSurfer the most valuable tool for the current set of analyses.
In conclusion, our study highlights that less thinning of the PFC is related to greater AP during early adolescence. This finding extends on prior work in ADHD and highlights that AP, and associated neural correlates, exist on a continuum of severity within the general population. This pattern of altered neurobiological maturation within the OFC also partially mediates the well-established relationship between AP and later-emerging risk behaviors.
Footnotes
Declaration of Conflicting Interests
The author(s) declared no potential conflicts of interest with respect to the research, authorship, and/or publication of this article.
Funding
The author(s) disclosed receipt of the following financial support for the research, authorship, and/or publication of this article: This research was supported by grants from the Colonial Foundation, the National Health and Medical Research Council (NHMRC; Australia; Program Grant 350241) and the Australian Research Council (ARC; Discovery Grant DP0878136). Dr. Whittle is supported by a NHMRC Career Development Fellowship (ID: 1007716).
Author Biographies
References
Supplementary Material
Please find the following supplemental material available below.
For Open Access articles published under a Creative Commons License, all supplemental material carries the same license as the article it is associated with.
For non-Open Access articles published, all supplemental material carries a non-exclusive license, and permission requests for re-use of supplemental material or any part of supplemental material shall be sent directly to the copyright owner as specified in the copyright notice associated with the article.
