
Abstract
Objective:
The present study examined the impact of Attention Deficit Hyperactivity Disorder (ADHD) on core educational outcomes in two large community cohorts of Australian school children.
Method:
Academic (reading and numeracy) and non-academic (school engagement, attendance, peer victimization, and parental expectations) outcomes were compared between children with ADHD, subthreshold ADHD, and controls when children were in grade 5 (M age = 10.5). Data were drawn from the Longitudinal Study of Australian Children birth cohort (LSAC; N = 3,540) and the Children’s Attention Project (CAP; N = 356).
Results:
Both subthreshold ADHD and ADHD groups had poorer outcomes on all measures, with medium effects sizes. Differences were not evident between subthreshold ADHD and ADHD groups.
Conclusions:
Educational outcomes examined in this study highlight the educational risk for upperprimary school children with ADHD or subthreshold ADHD, in comparison to their peers. Monitoring these outcomes is necessary to inform policy, practice, and intervention.
Children with Attention-Deficit/Hyperactivity Disorder (ADHD) are at increased risk of poorer educational outcomes and lower educational attainment in comparison to children without ADHD (Arnold et al., 2015; Loe & Feldman, 2007). Even those children who are subthreshold for ADHD (i.e., meeting some but not full clinical criteria for ADHD) may experience poorer outcomes (Biederman et al., 2018). It is hypothesized that ADHD symptoms likely cause learning deficits and are directly related to academic underachievement (de Zeeuw et al., 2017). Large discrepancies in the achievement of children and adolescents with ADHD on tests of reading, writing, spelling and mathematics have been reported (Massetti et al., 2008; Silva et al., 2015; Zendarski et al., 2017b), as well as discrepancies across non-academic performance indicators including attendance, engagement with school and peer problems (Fleming et al., 2017; Loe & Feldman, 2007; Rushton et al., 2019). Poor educational outcomes for individuals with ADHD limit employment, income opportunities and contribute to the high costs of ADHD, costing approximately $20 billion per year in Australia (Sciberras et al., 2020). Routine measurement of ADHD treatment outcomes needs to extend beyond the core symptoms of ADHD to prioritize measurement of crucial functional areas in the school environment. Educational outcome measures should be routinely collected and integrated into the decision making process within clinical practice to help improve treatment outcomes. Similarly, these data are likely to be useful to inform teaching policy and practices for school children with ADHD (Adamo et al., 2015).
While there is a great deal of empirical research examining educational outcomes for children with ADHD in early childhood (Loe & Feldman, 2007; Washbrook et al., 2013) and adolescence (Loe & Feldman, 2007; Zendarski et al., 2017a), the immediate preadolescent period (i.e., 10–12 years of age) just prior to transition from primary to secondary education, has been less well studied. This is an important developmental period because children are beginning to create their own views about their academic abilities and potential, and performance in this period has been shown to be a strong predictor of future academic attainment and success. Research examining academic achievement for students with ADHD having transitioned to high school or middle school in the USA has found children with ADHD are already well behind their peers (Langberg et al., 2008; Zendarski et al., 2017a) suggesting intervening is necessary before the transition. There is however little known about school outcomes for children with ADHD and subthreshold ADHD during this educational period across both academic and non-academic domains of functioning.
Longitudinal outcome studies have highlighted ADHD symptoms in childhood to be important predictors of poor educational outcomes in later school years (Arnold et al., 2015; Massetti et al., 2008). ADHD symptom severity, particularly symptoms of inattention, in childhood and adolescence have been found to predict poorer long-term outcomes (Merrell et al., 2017; Rigoni et al., 2020) and evidence suggests ADHD medication use during childhood does not vastly improve long term educational outcomes (Langberg & Becker, 2012). Maintaining engagement with learning in these years is likely to be an important protective factor for students with ADHD and subthreshold ADHD as they enter high school (Dvorsky & Langberg, 2016). Research in community and population studies have also highlighted that many children who meet ADHD criteria may remain unrecognized (Efron et al., 2014; Rowland et al., 2015). It is also the case that important indicators of learning and engagement are not always routinely assessed and even when they are this information is often not available to clinicians treating ADHD. This period at the end of primary schooling may, therefore, represent a period of opportunity to help children with ADHD having difficulty at school to make academic gains and to strengthen their engagement with school, learning and their peers (Dvorsky & Langberg, 2016).
Further, there is evidence to suggest that children with significant ADHD symptoms who fall below the ADHD threshold criteria are also at greater educational risk (Biederman et al., 2018; Kirova et al., 2019). A systematic qualitative review by Kirova et al. (2019) examined the body of literature (24 studies) on the prevalence and morbidity of subthreshold ADHD. Population prevalence of subthreshold ADHD was estimated to be 17.7%. Overall, findings suggest that subthreshold ADHD is associated with increased functional deficits in school, social skills, and cognitive functioning, as well as high comorbidity. However, research comparing educational outcomes for children with subthreshold ADHD symptoms remains limited and few studies compare outcomes between children with ADHD, subthreshold ADHD, and controls (Kirova et al., 2019).
One recent study using data from the Children’s Attention Project, which is a source of data in the current paper, demonstrated that children with subthreshold ADHD had substantially poorer reading and math performance (assessed via a blinded direct assessment), as well as poorer teacher rated academic competence at age 10 than controls and academic performance was similarly lower to children meeting the full criteria for ADHD (Efron et al., 2020). Broader academic indicators, as outlined below, were not examined in this paper. However, given the results from our initial investigation we deem it important to consider children with subthreshold ADHD as well as those with full ADHD in this study.
Indicators of Academic and Non-academic Educational Outcomes
Learning encompasses the knowledge, skills, and abilities that children attain because of their involvement in education. Academic achievement is a key component of this, typically measured by achievement across important academic domains. Performance in reading and numeracy are primary indicators of children’s academic proficiency and are often measured on standardized tests including the National Assessment Program—Literacy and Numeracy (NAPLAN) program in Australia (Department of Education and Training [DET], 2018). However, academic achievement is not the only domain of education success, for example, children’s level of attendance, school engagement and emotional wellbeing (i.e., experience of peer victimization), also contribute to school success (Hughes, 2015). Research examining these broader measures, however, remains limited in preadolescent children with ADHD (Hancock et al., 2013; Loe & Feldman, 2007). Prior research indicates that higher parental expectations may be protective for children’s later academic achievement (Yamamoto & Holloway, 2010). Parents who hold higher expectations for their child’s education attainment may have higher involvement in their child’s education at home and at school, which may also influence their child’s own educational goals (Gubbins & Otero, 2020; Wilder, 2014).
Several socio-demographic factors are known to impact on the educational outcomes of school children in general. Family socioeconomic background, parent education, age or grade, indigenous status, attending a school with a low socioeconomic background or in a rural or remote area can have an impact on educational achievement (Lamb et al., 2015). In Australia, differences in education outcomes remain for Indigenous children even after controlling for socioeconomic status and remoteness (Guenther et al., 2013). Importantly, we must continue to tease out the impact that ADHD has on children’s ability to learn and achieve within foundational education settings to minimize the impact of ADHD on the educational outcomes of children over and above the impact of sex, socioeconomic circumstances, indigenous status and remoteness.
Present Study
The present study examined the impact of ADHD and subthreshold ADHD on core educational outcomes in two large community cohorts of Australian school children. The study aimed to compare academic (reading and numeracy) and non-academic (school engagement, attendance, peer victimization, and parental expectations) performance measures between children with ADHD, subthreshold ADHD, and controls. It was hypothesized that compared to controls both ADHD and subthreshold ADHD would predict poorer educational outcomes, even when considering potentially confounding factors relating to the child, family, and school.
Method
Study Design and Settings
This paper draws on data from two longitudinal studies, the Longitudinal Study of Australian Children (LSAC) and the Children’s Attention Project (CAP; Sciberras et al., 2013). The two samples, which differ in several respects, were included to test whether our findings would be replicated across independent samples. Replication is increasingly recognized as essential in psychological research (Stanley & Spence, 2014). Outcomes are examined when children are near their final years of primary school because this is an important developmental period and to ensure that findings were not confounded by the impact of transition to high school.
Longitudinal Study of Australian Children (LSAC)
LSAC data were collected initially from a population-based birth cohort (B cohort) of Australian children born between March 2003 and February 2004 (Sanson et al., 2002). Subsequently, data are collected every 2 years, referred to as waves. All study procedures were approved by the Australian Institute of Family Studies (AIFS) Ethics Committee (AIFS 13-04) and informed written parental consent was obtained for each participating child at baseline. Consent to access the dataset for this study was obtained from AIFS. The study design is summarized below and more detailed information is provided elsewhere (Soloff et al., 2005).
In summary, LSAC used a two-stage clustered sampling design, stratified by state and by location (metropolitan and urban status) to recruit their sample. Children were randomly selected using the Medicare (publicly funded national health insurance) database. Recruited families in the final sample were broadly representative of Australian children except for those living in remote areas. At each wave, data were collected from parents (97% biological mothers) through interviews conducted by trained research assistants in the family home, child self-report and teacher questionnaires and via data linkage. Comprehensive data is gathered on each participating child, including their experiences within families and communities, and experiences in education and aspects of children’s development. Of the initial 5,107 babies enrolled, 74% were retained in wave 6 (n = 3,764). Families retained were more likely to be English-speaking and parents were more highly educated (Norton & Monahan, 2015). In this study, we used Wave 6 outcome data, measured in 2014 with B-cohort children at age 10 to 11 years. Most children (83%) were in their sixth year of formal education (grade 5) with the remainder in grade 6. A small number of children (n = 224) in the LSAC cohort were excluded from the analyses if they were reported to be in grades lower than 5 or in alternate educational settings, leaving a total sample size of 3,540 for this study.
Children’s attention project (CAP)
CAP is a community-based longitudinal cohort study examining developmental differences and outcomes in children with ADHD and subthreshold ADHD compared to children without ADHD across childhood (Sciberras et al., 2013). Participating children were recruited through 43 Victorian schools in their second year of formal education (grade 1) in 2011 to 2012. In this study, we examined outcomes in wave 3 when participating children were in their sixth and seventh years of formal education (grades 5–6) during 2014 to 2105, aged 10 to 11 years. Of the 491 children enrolled at baseline, data were available for 75% were available at Wave 3, a further 10 children were excluded from the ADHD subthreshold group due to their ADHD status being unclear, leaving a total sample of 356. Ethical approval was obtained from the Human Research Ethics Committees of The Royal Children’s Hospital (#31056) and the Victorian Department of Education and Training (#2011_001095). Informed written parental consent was obtained for each participating child on study entry. The study design is summarized below. Detailed information about the study design is provided elsewhere (Sciberras et al., 2013).
Children who screened positive for ADHD by both parent and teacher report using an ADHD screener were matched to children who screened negative by both parent and teacher report, based on age and school, were invited into the study. Diagnostic interviews to confirm the presence or absence of ADHD were conducted face- to-face with parents by trained research staff, supervised by clinicians. Children were excluded if they had a severe medical condition, intellectual disability or where parents had very low English proficiency. CAP aims to chart the course of children’s ADHD symptoms over time and to identify risk and protective factors associated with different child trajectories. Data are collected on academic, social, cognitive, and mental health outcomes at each wave from multiple informants via parent and teacher surveys, direct child assessments and diagnostic interviews, as well as through data linkages to educational and health datasets.
Measures
Table 1 provides a summary of the educational outcome measures used in this study. Measures were selected if they were (1) identified in the literature as a valid indicator of student achievement or performance, (2) relevant to the upper-primary school period, and (3) available in both the LSAC and CAP datasets. Eight educational outcomes met these criteria: reading and numeracy achievement, student engagement, reading and numeracy risk status, frequent absenteeism, peer victimization, and parent educational expectations.
Description of Study Outcome Measures.
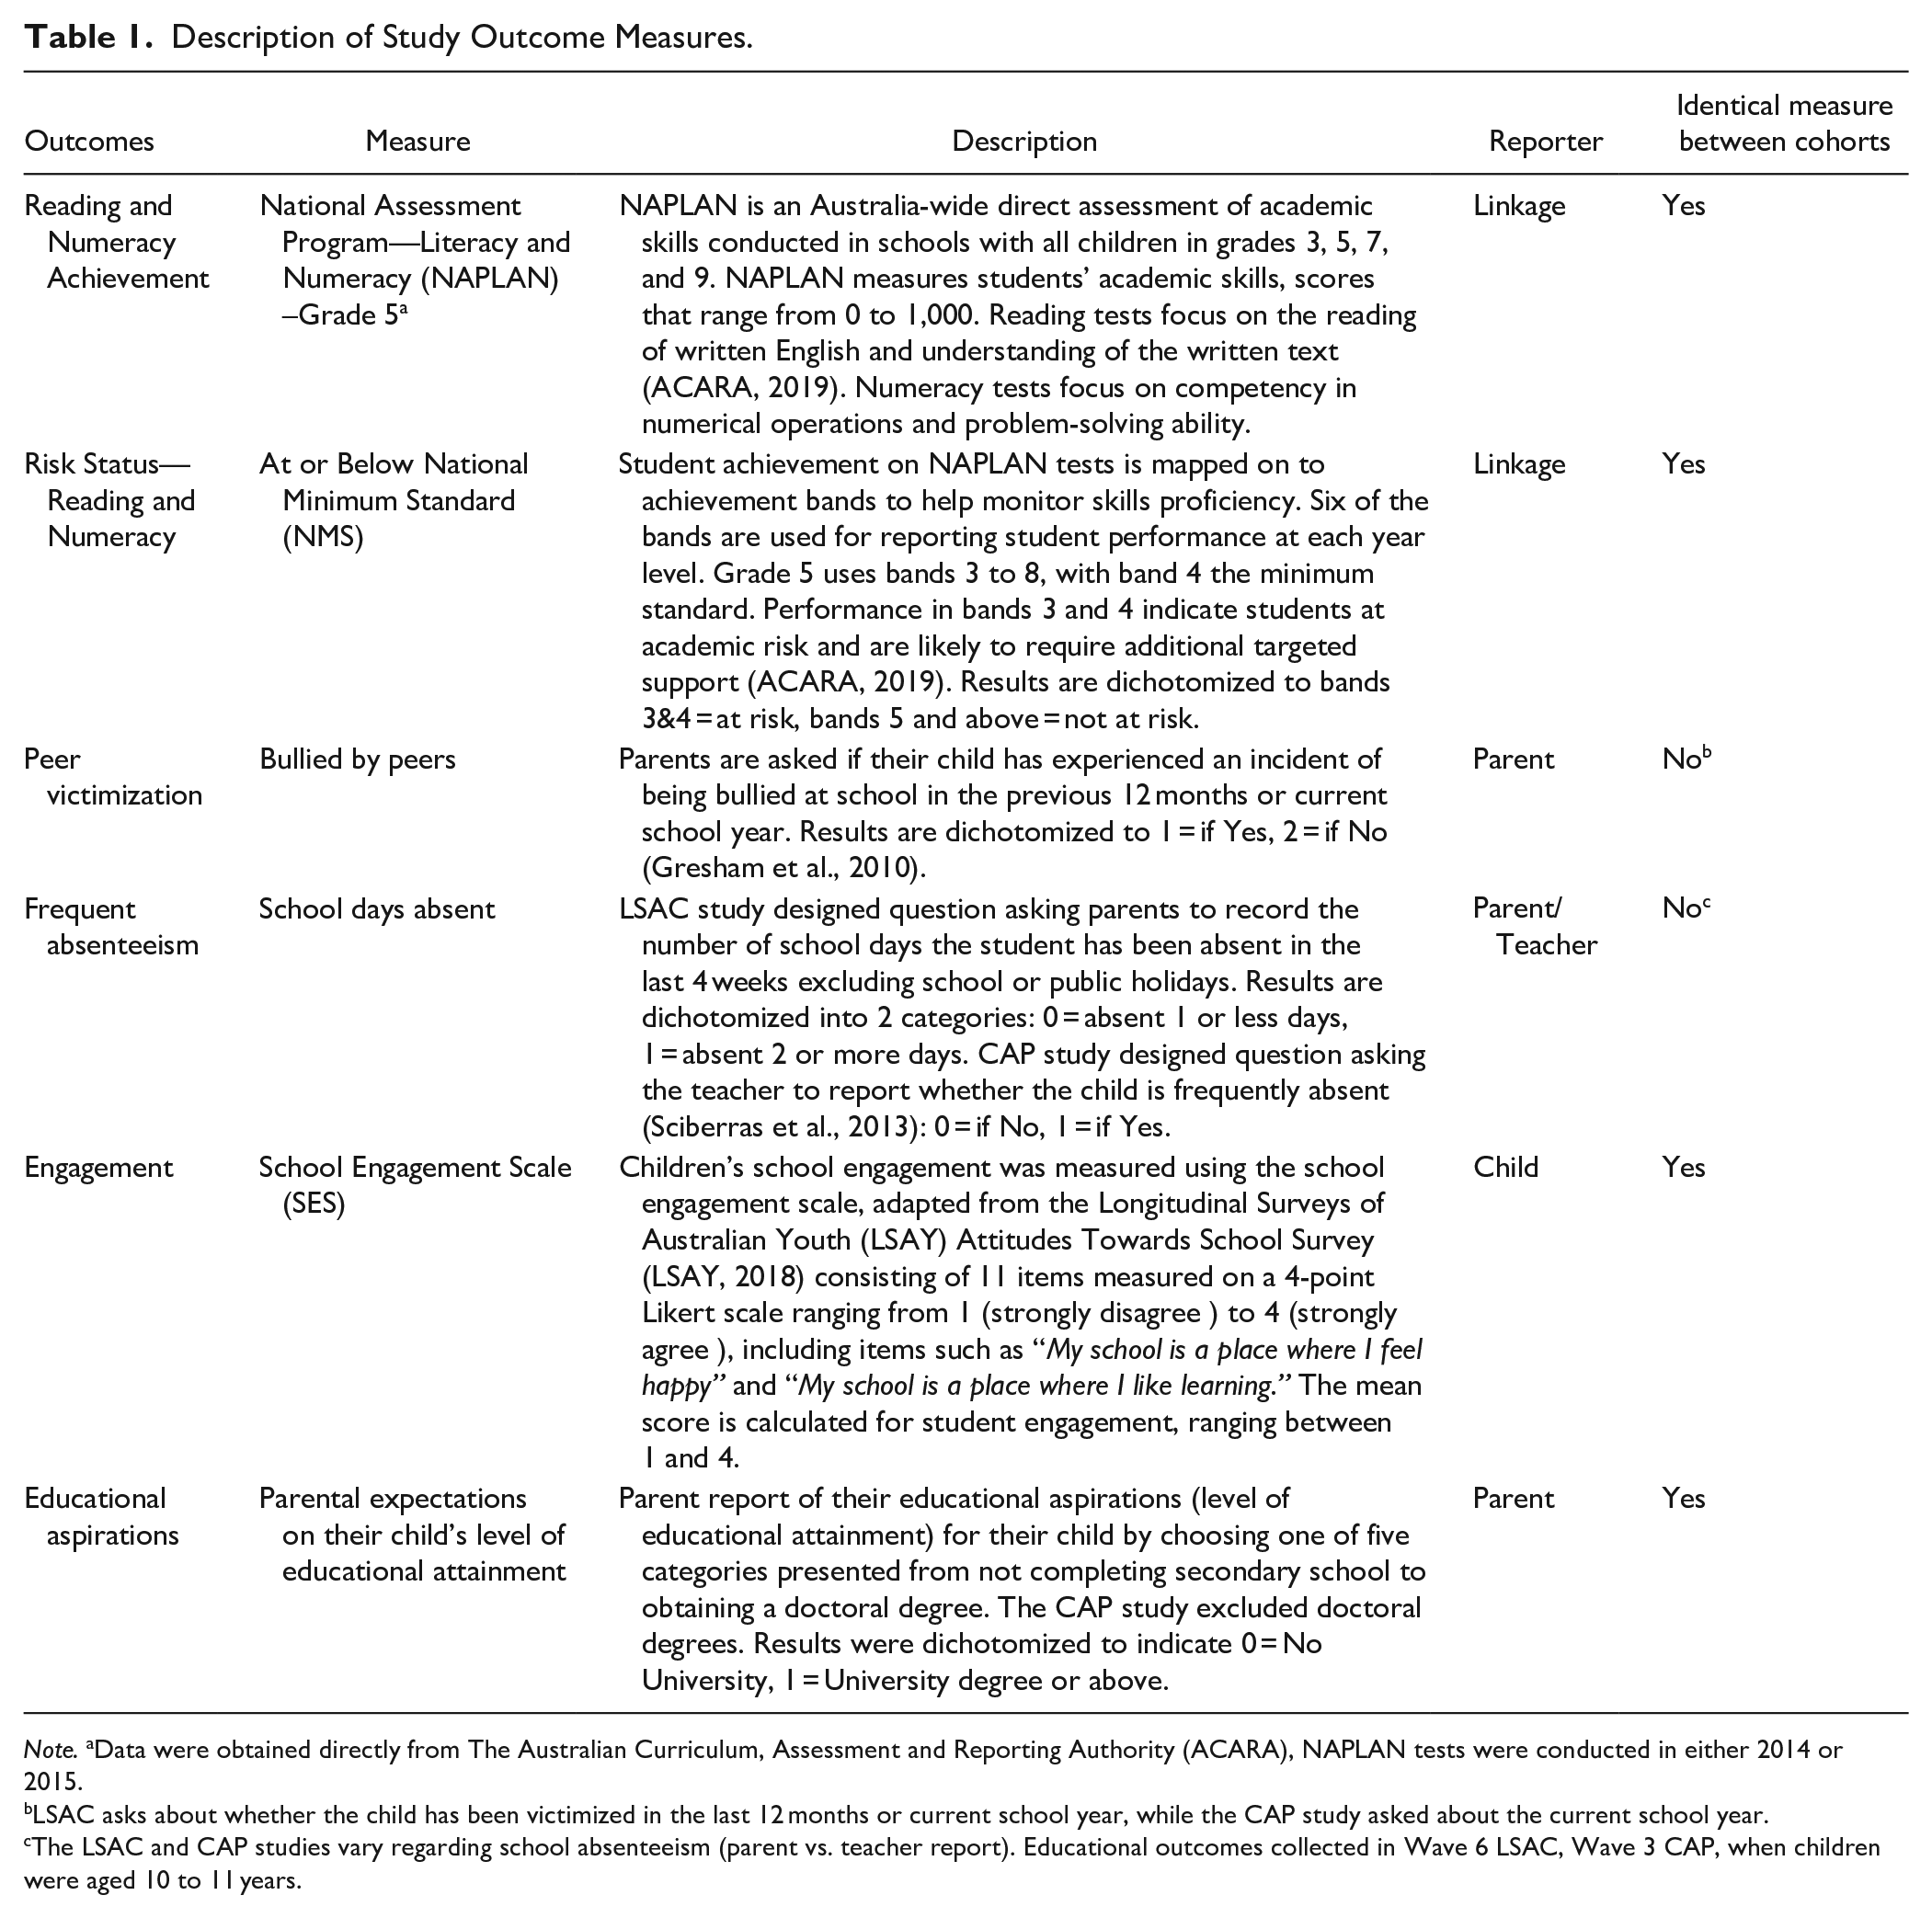
Note. aData were obtained directly from The Australian Curriculum, Assessment and Reporting Authority (ACARA), NAPLAN tests were conducted in either 2014 or 2015.
LSAC asks about whether the child has been victimized in the last 12 months or current school year, while the CAP study asked about the current school year.
The LSAC and CAP studies vary regarding school absenteeism (parent vs. teacher report). Educational outcomes collected in Wave 6 LSAC, Wave 3 CAP, when children were aged 10 to 11 years.
Comparison groups
Comparison groups were coded in the LSAC cohort based on parent report of ADHD diagnosis and symptom profiles on the five-item hyperactivity–inattention (HI) subscale of the Strengths and Difficulties Questionnaire (SDQ; Goodman et al., 2000) at waves 3 to 6. Questions on the HI subscale ask respondents to rate hyperactive and inattentive behavior (e.g., “restless, overactive, cannot stay still for long”). The HI subscale has been validated as an adequate screening tool for ADHD in community settings (Goodman, 2001; Goodman et al., 2000) and is a strong predictor of ADHD diagnoses in clinical (OR = 10.20, 95% CI [2.18–48.71], p = .003) and research (OR = 6.82, 95% CI [1.95–23.84], p = .003) settings (Hall et al., 2019), with moderate sensitivity (42.5–63.3%) which may be improved by using multi-informant SDQs (Goodman et al., 2000; Hall et al., 2019). Children were coded as ADHD if their score on the HI subscale was at or above the 90th percentile (≥6) by either parent or teacher report at two consecutive waves or if they had a parent-reported ADHD diagnosis at any wave (n = 118). Children who were at or above the 90th percentile on the HI subscale at any of the four waves by either parent or teacher report, but who did not meet the ADHD group criteria above, were coded as subthreshold ADHD and all other children were coded as controls.
In the CAP cohort, a two-stage screening (parent and teacher Conners 3 ADHD Index) and case-confirmation (Diagnostic Interview Schedule for Children, Version IV; [DISC-IV]) procedure (Sciberras et al., 2013) was used to group children as either ADHD (met full diagnostic criteria on the DISC-IV), subthreshold ADHD (screened positive but did not meet full diagnostic criteria on the DISC-IV), and controls (did not screen positive or meet diagnostic criteria) at enrolment into the study. The Conners 3 ADHD Index (Conners, 2008) is a 10 item brief screener used to identify possible ADHD. Items (e.g., restless, overactive) are rated on the frequency of occurrence from 1 (never/seldom) to 3 (very often/very frequent), with higher scores indicating greater symptom severity. This measure has been shown to have strong internal consistency (parent-report, α = 0.92) and test-retest reliability (Kao & Thomas, 2010). The ADHD module of the DISC-IV (Shaffer et al., 2000), is a structured diagnostic interview using ADHD criteria outlined in the Diagnostic and Statistical Manual for Mental Disorders-IV with good validity and reliability (Willcutt, 2012).
Demographics and control variables
The LSAC and CAP datasets provided child, family, and school demographic information including child sex, age, parental education level (tertiary education yes/no), and socioeconomic status (SES).The LSAC study also includes the child’s indigenous status (Aboriginal and Torres Strait Islander Heritage), ADHD medication use, for example Ritalin (methylphenidate), attending school location (metropolitan/regional), and school type (Catholic, independent or government). The school data are obtained from data linkage to the “My Schools” database, all other data are parent-reported.
Statistical Analyses
All analyses were conducted using Stata 15.1 (StataCorp, 2017). Participant characteristics and educational outcomes were first summarized using descriptive statistics. Univariate analysis (i.e., one-way test and chi-square test) were then conducted to examine the distribution of ADHD by participants’ socio-demographic and educational outcomes. Additionally, effect sizes (Hedges’ g and odds ratios) are reported calculated on unadjusted multiple regressions. Listwise deletion was used to handle missing data. Missing rates were between 5 and 19% on included variables, with highest rates for NAPLAN variables (see NAPLAN sensitivity analyses below). Multiple linear regression (continuous) and logistic regression (categorical) analysis were used to investigate the associations between each outcome and groups (ADHD, subthreshold ADHD, and controls). Data for each cohort were analyzed separately. Results report group differences between controls and each ADHD group.
LSAC regression models were adjusted for child sex, child Aboriginal or Torres Strait Islander status, child grade level, parent education level, metropolitan location and school type, and clustering by postcodes to reduce biased estimates. The CAP regression models were adjusted for child sex, child age and parent education level, and clustering by school. CAP participants were recruited from government-administered schools in metropolitan areas, so we chose not to control for school location or school type. Aboriginal or Torres Strait Islander status was not collected in the CAP study. ADHD medication use was largely associated with children classified as ADHD. LSAC only collected these data if ADHD diagnosis was indicated. Within the ADHD groups medication rates were low. As such we did not control for ADHD medication use.
NAPLAN sensitivity analyses
In each cohort, we were able to link to the individual-level NAPLAN results for children who sat the grade 5 assessments. The proportion of children across the ADHD, subthreshold ADHD, and control groups who are classified as either having an exemption or absent is consistent with national Australian data which indicates approximately 3% of children do not sit NAPLAN for these reasons. Therefore, the missing scores can be suggested to be missing at random as the data linkage process generally returns between 80 and 90% of children.
A sensitivity analysis was conducted to examine potential differences between the three groups in NAPLAN testing status, results are presented in supplementary Table 1. Overall, patterns of missing NAPLAN results were significantly different amongst the three LSAC groups, with the subthreshold ADHD group having more missing data compared to controls. Overall patterns of missing NAPLAN data were not significantly different between the three CAP groups.
Results
Sample Characteristics
Participants were 3,896 Australian school children in grades 5 to 6; 3,540 children for whom data were available at wave 6 in the LSAC cohort and 356 children for whom data were available at wave 3 of the CAP cohort. Within each cohort, three groups were compared. LSAC groups: ADHD (n = 180), subthreshold ADHD (n = 188), and controls (n = 3,172). CAP groups: ADHD (n = 135), subthreshold ADHD (n = 69), and controls (n = 152). Sample characteristics are summarized in Table 2.
Sample Characteristics and Educational Outcomes.
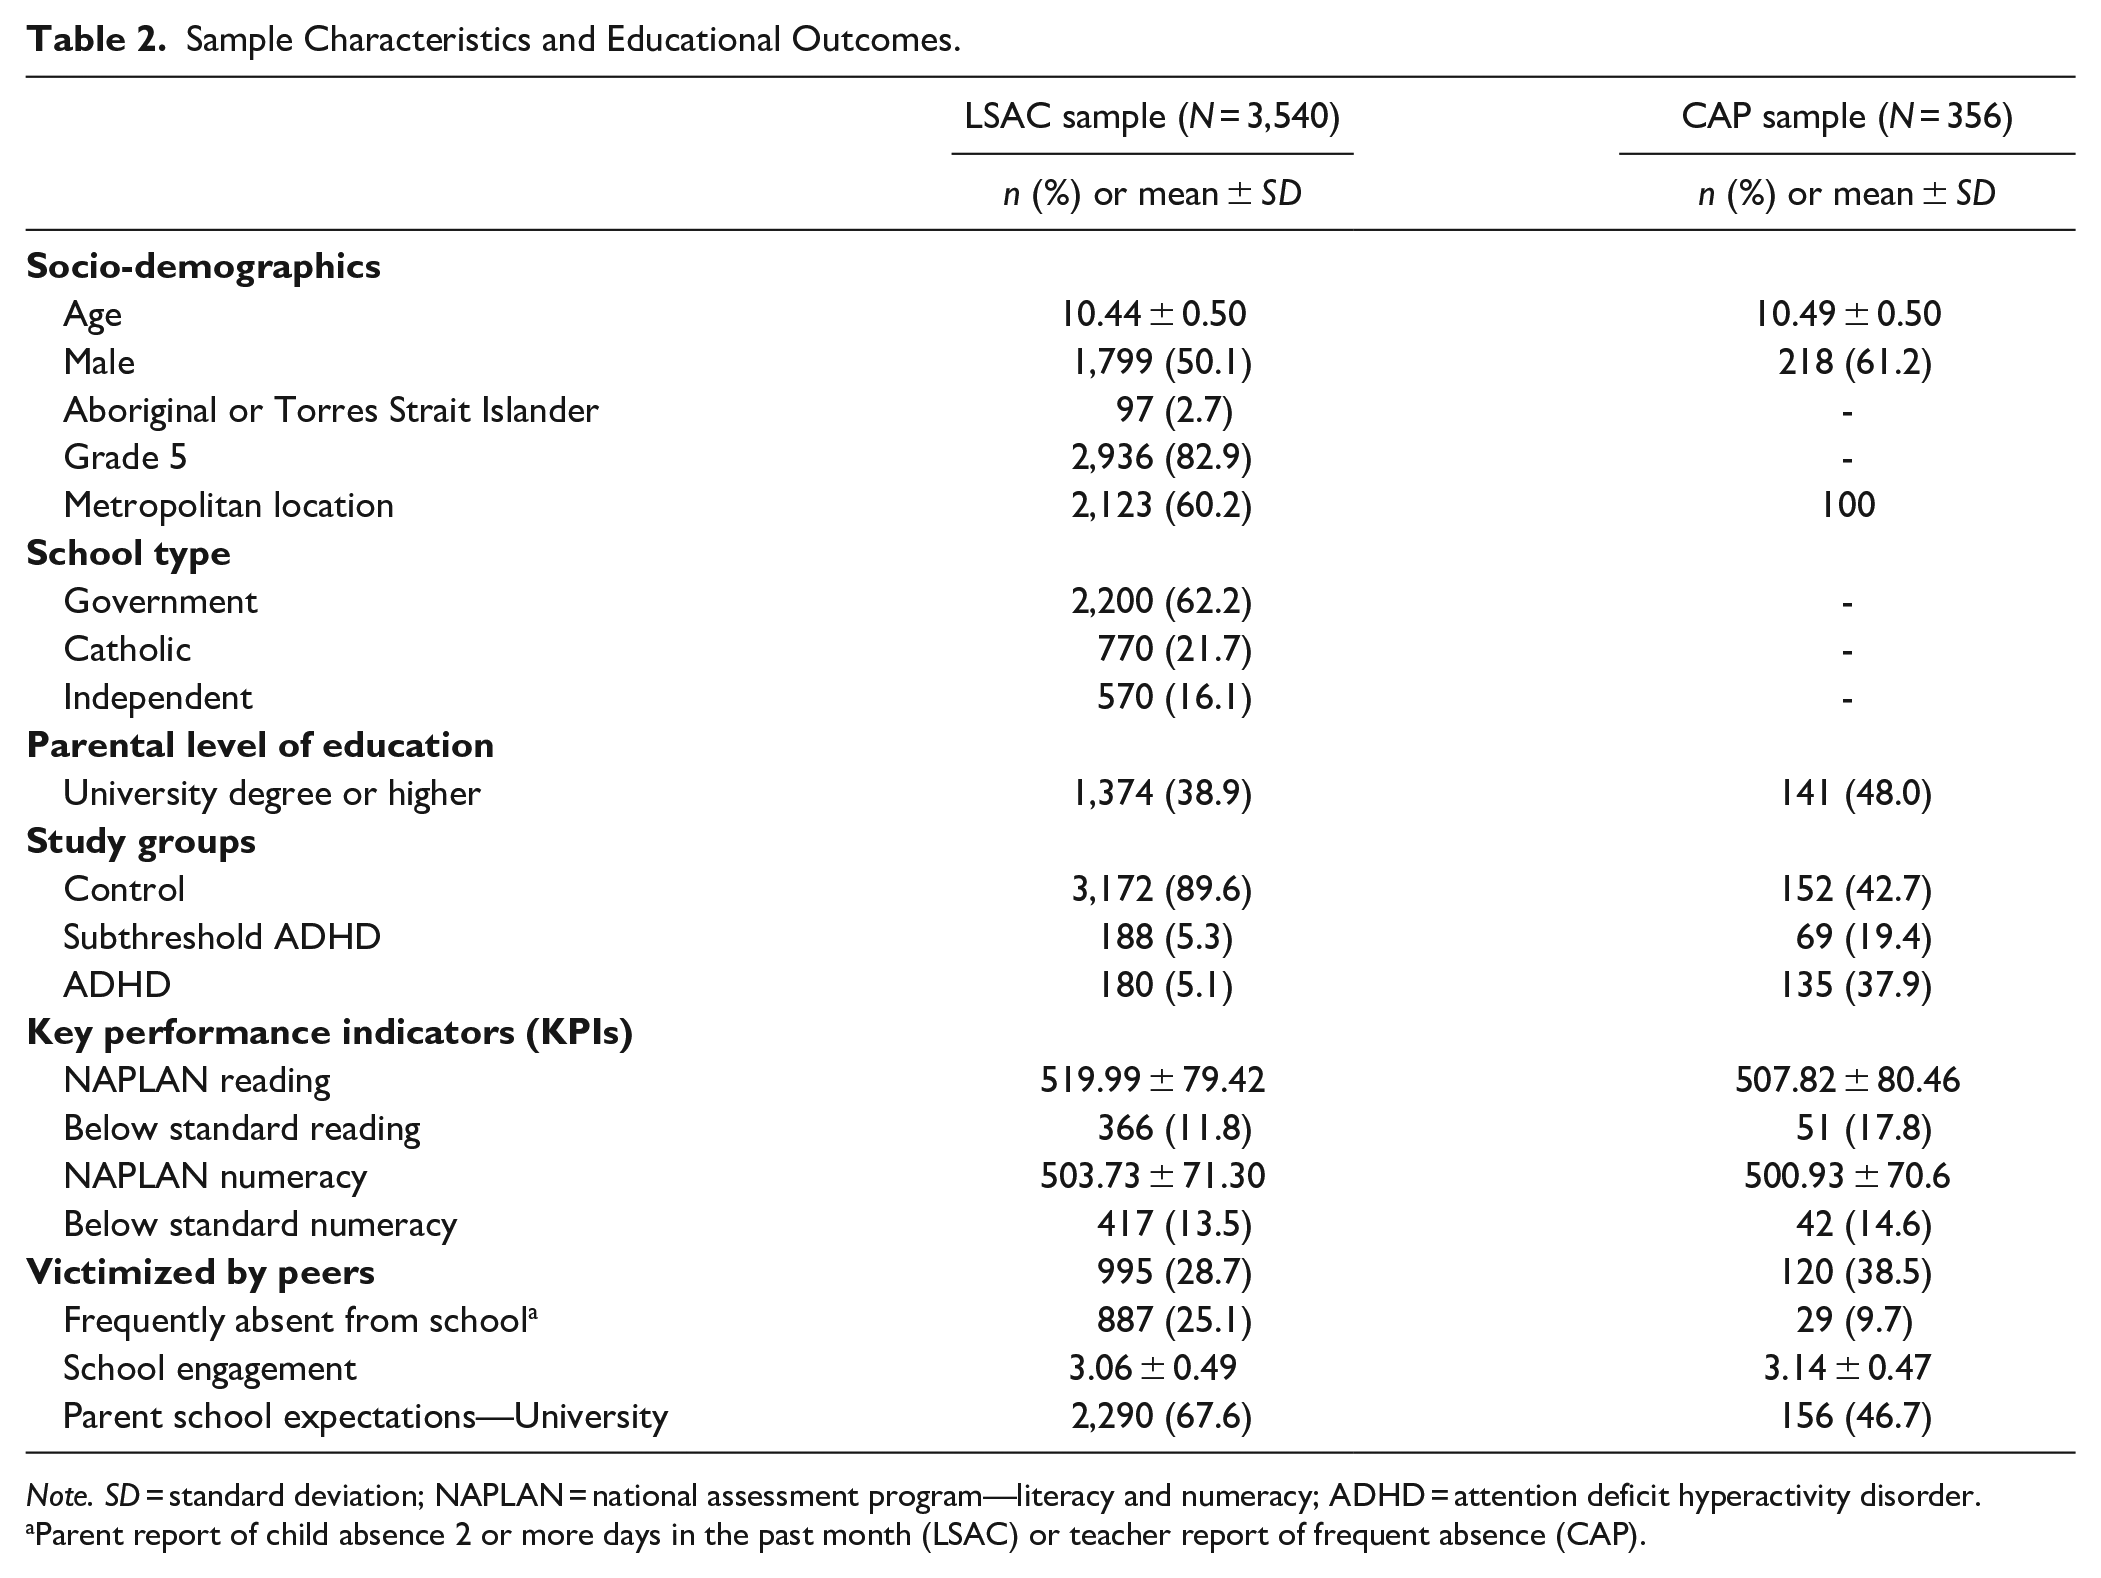
Note. SD = standard deviation; NAPLAN = national assessment program—literacy and numeracy; ADHD = attention deficit hyperactivity disorder.
Parent report of child absence 2 or more days in the past month (LSAC) or teacher report of frequent absence (CAP).
LSAC sample characteristics
The average age of participants was 10.43 years (SD = 0.50) and half were male. The children attended government (62%), Catholic (22%), and independent (16%) primary schools in metropolitan (60%) and regional areas (40%). Additional information on participant characteristic by each group are available in supplementary Table 2, which shows that groups vary across a range of factors including child sex, Aboriginal or Torres Strait Islander status, medication use and parent education, but not on school type or location.
CAP sample characteristics
The average age of participants was 10.49 years (SD = 0.50) and 61% were male and all attended government primary schools in metropolitan areas. Additional information on participant characteristics by group are available in supplementary Table 2, which shows groups vary regarding sex, medication use and parent education levels, with the subthreshold group having more females, while fewer parents in the ADHD groups had completed tertiary studies.
Group Differences in Educational Outcomes by Cohort
Educational outcomes by sample and group are presented in Table 3, which shows outcomes significantly differed between groups. Both the ADHD and subthreshold ADHD groups had poorer outcomes across all measures in comparison to controls as indicated in the corresponding F/χ2 column. There were two exceptions; frequent absenteeism and parental expectations, which were not significantly different between the CAP groups.
Comparison of Children with ADHD Symptoms and Typical Children in Grade Five Across Eight Educational Outcomes (Unadjusted).
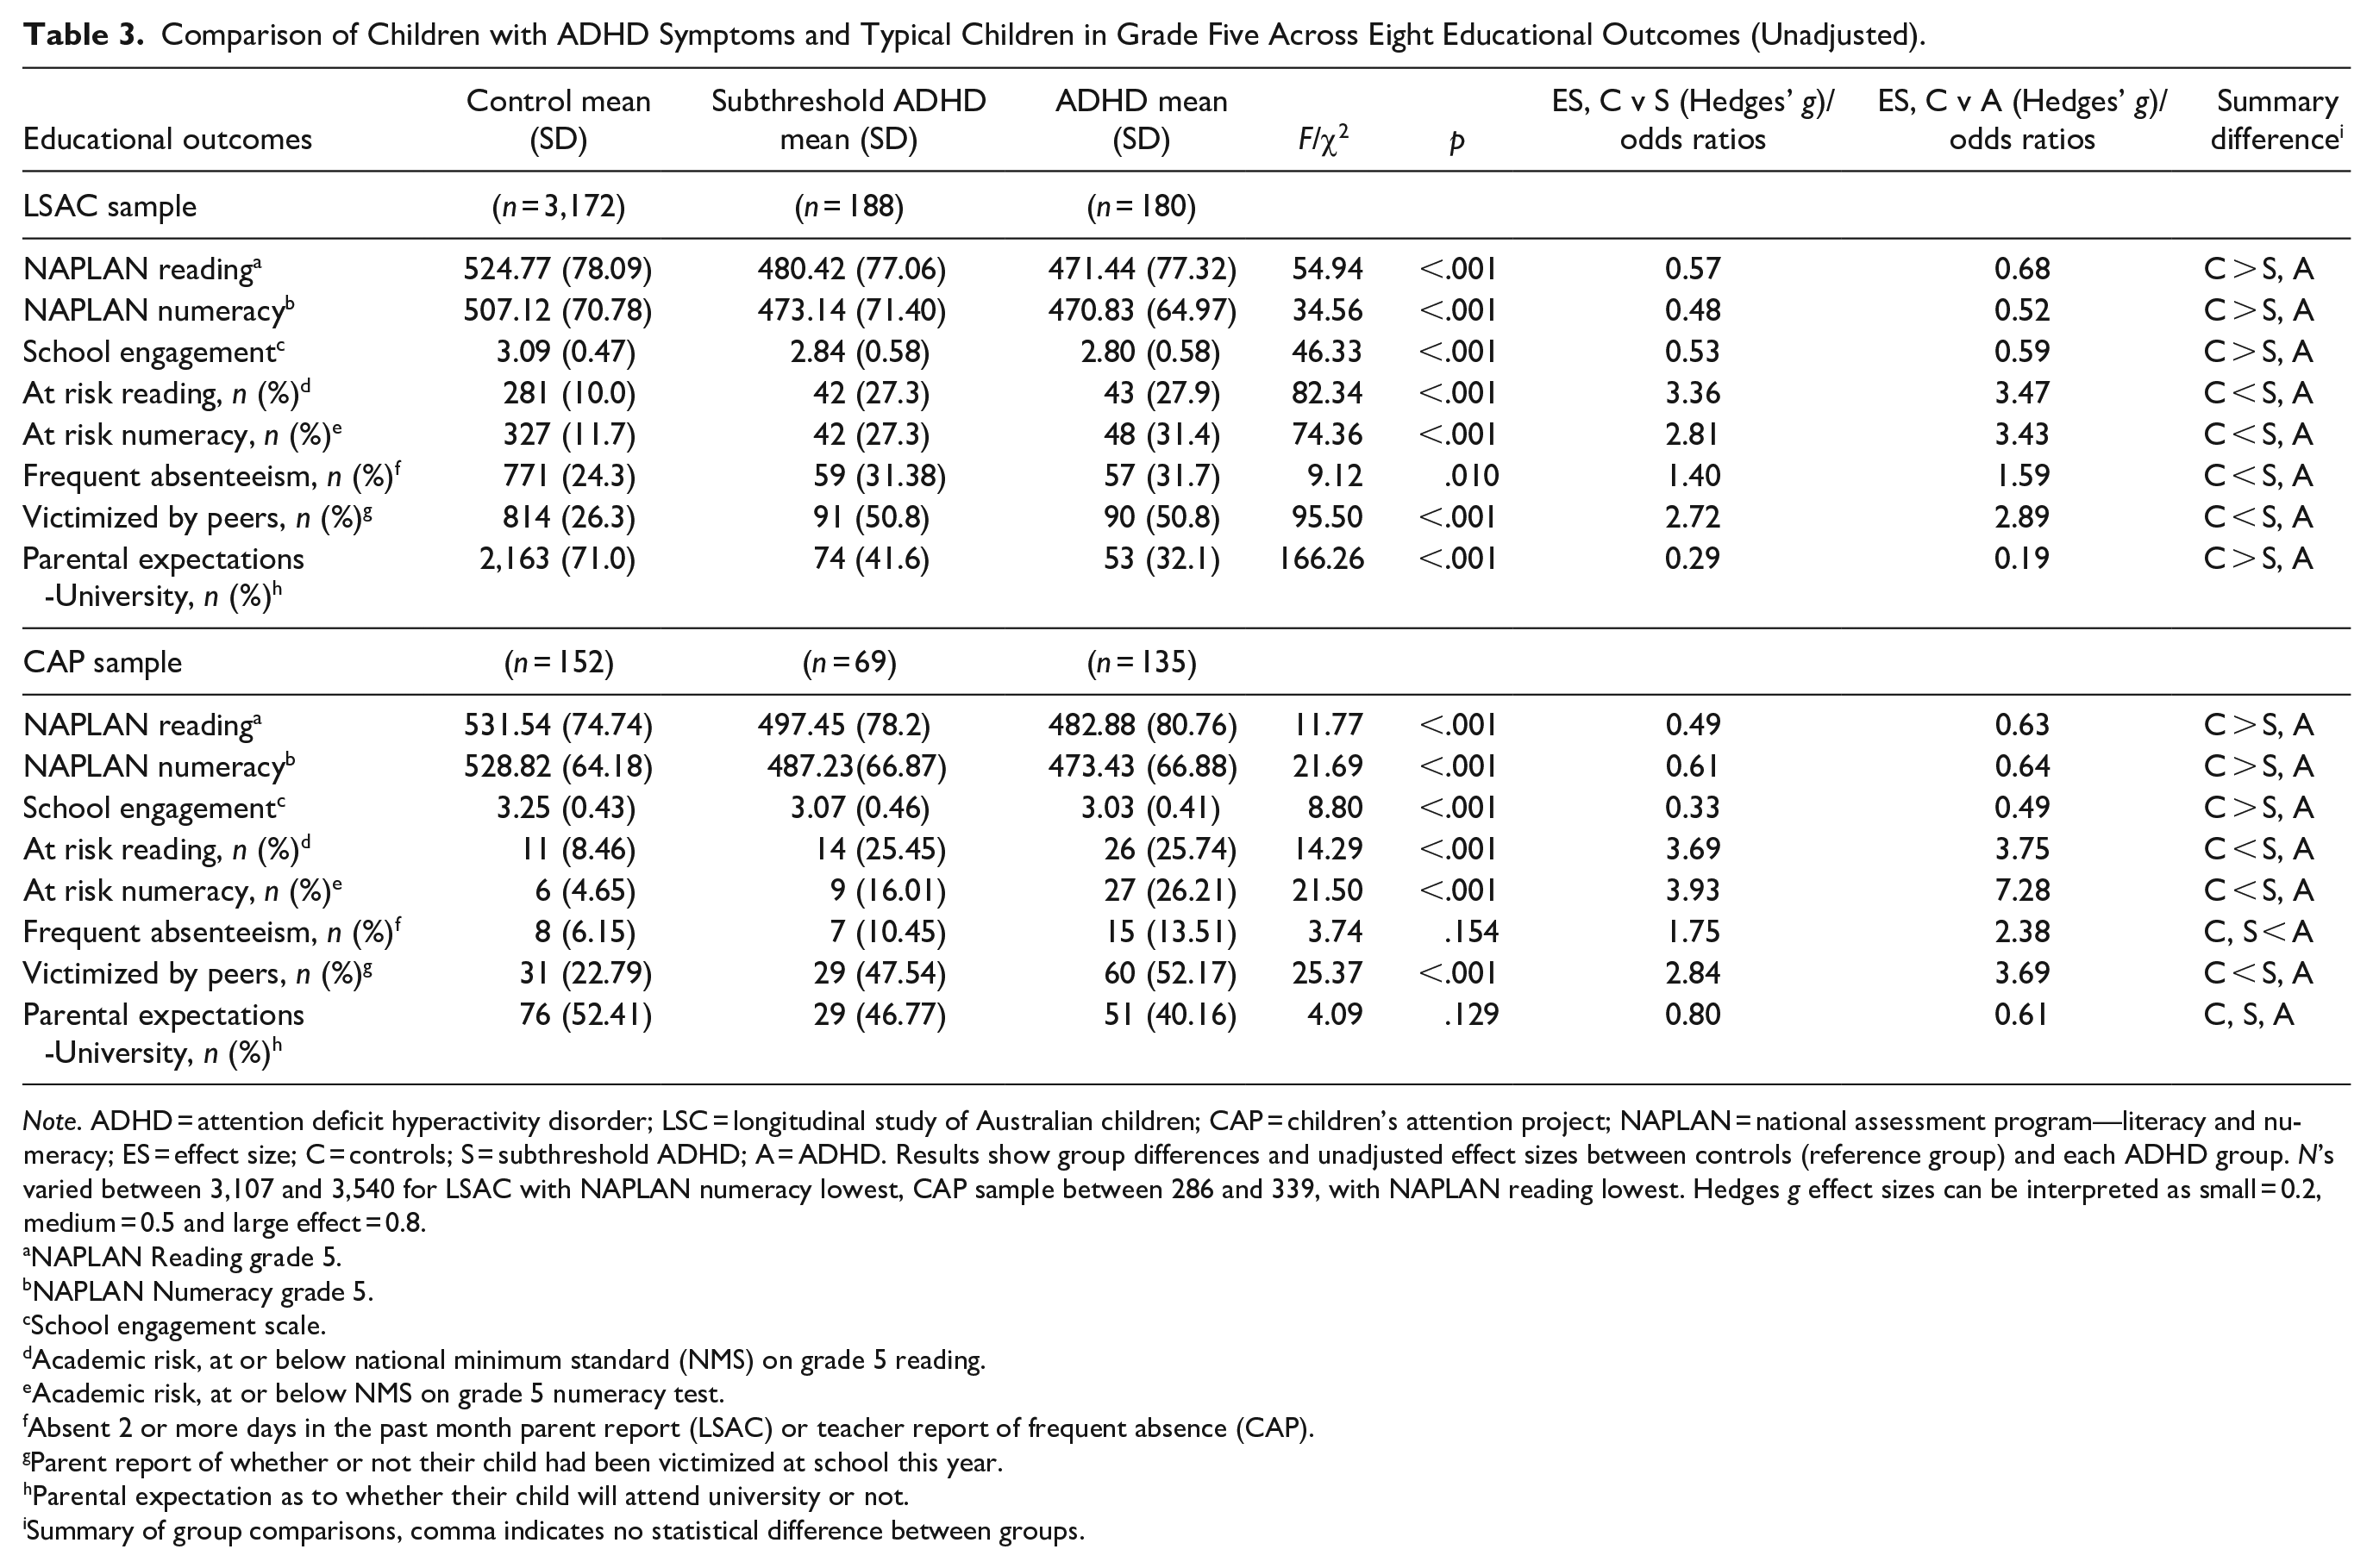
Note. ADHD = attention deficit hyperactivity disorder; LSC = longitudinal study of Australian children; CAP = children’s attention project; NAPLAN = national assessment program—literacy and numeracy; ES = effect size; C = controls; S = subthreshold ADHD; A = ADHD. Results show group differences and unadjusted effect sizes between controls (reference group) and each ADHD group. N’s varied between 3,107 and 3,540 for LSAC with NAPLAN numeracy lowest, CAP sample between 286 and 339, with NAPLAN reading lowest. Hedges g effect sizes can be interpreted as small = 0.2, medium = 0.5 and large effect = 0.8.
NAPLAN Reading grade 5.
NAPLAN Numeracy grade 5.
School engagement scale.
Academic risk, at or below national minimum standard (NMS) on grade 5 reading.
Academic risk, at or below NMS on grade 5 numeracy test.
Absent 2 or more days in the past month parent report (LSAC) or teacher report of frequent absence (CAP).
Parent report of whether or not their child had been victimized at school this year.
Parental expectation as to whether their child will attend university or not.
Summary of group comparisons, comma indicates no statistical difference between groups.
Calculated effect sizes show a medium effect of ADHD or subthreshold ADHD on outcomes. For example, the largest effects in the LSAC sample were observed between the control group and the ADHD group on NAPLAN reading (ES = 0.68) and engagement (ES = 0.59). In the CAP sample, ADHD status had a medium negative effect on NAPLAN numeracy (ES = 0.63) and increased risk of peer victimization (OR = 7.28). There were no significant unadjusted differences between the subthreshold ADHD and ADHD groups in either cohort. Our analysis was sufficiently powered 0.87 and 0.97 respectively, to detect a medium effect size (0.4) with an alpha of 0.05 between the ADHD and subthreshold ADHD groups in CAP and LSAC.
Regression Results
Results for the adjusted multiple linear and logistic regressions are presented in Table 4. Of note, only one relationship was attenuated to non-significant (LSAC—frequent absenteeism) when adjusting for potential confounding variables. Overall, compared to controls, children in the ADHD and subthreshold ADHD groups in both samples performed significantly poorer on nearly all outcomes (13 of 16). For example, in the LSAC sample, the mean performance on the NAPLAN test of reading was 49.2 (95% CI = [−61.65, −36.75]) points lower for children in the ADHD group in comparison to control children (subthreshold ADHD group scores were 40.3 points lower than controls, 95% CI = [−52.63, −27.96]). In the CAP sample, the difference between the two groups was 46.82 (95% CI = [−72.36, −21.28]) points (subthreshold ADHD group scores were 31.25 points lower than controls, (95% CI = [−60.83, −1.68). Also, compared to controls, children in the ADHD and subthreshold ADHD groups were less engaged in school, at increased risk of being below reading and numeracy benchmarks and at increased risk of being victimized. A key difference between cohorts was parent expectations. Significantly fewer parents in the ADHD (OR = 0.21; 95% CI = [0.14, 0.30]) or subthreshold ADHD group (OR = 0.32; 95% CI = [0.24, 0.44]) of the LSAC sample endorsed that they expected their child would attend university in comparison to parents of controls. There were no statistical differences in parental educational expectations between the controls and ADHD groups in the CAP sample and the odds of being frequently absent from school did not significantly differ between groups in either sample.
Multiple Regression Analysis Showing the Associations Between Educational Outcomes and ADHD Groups (Adjusted).
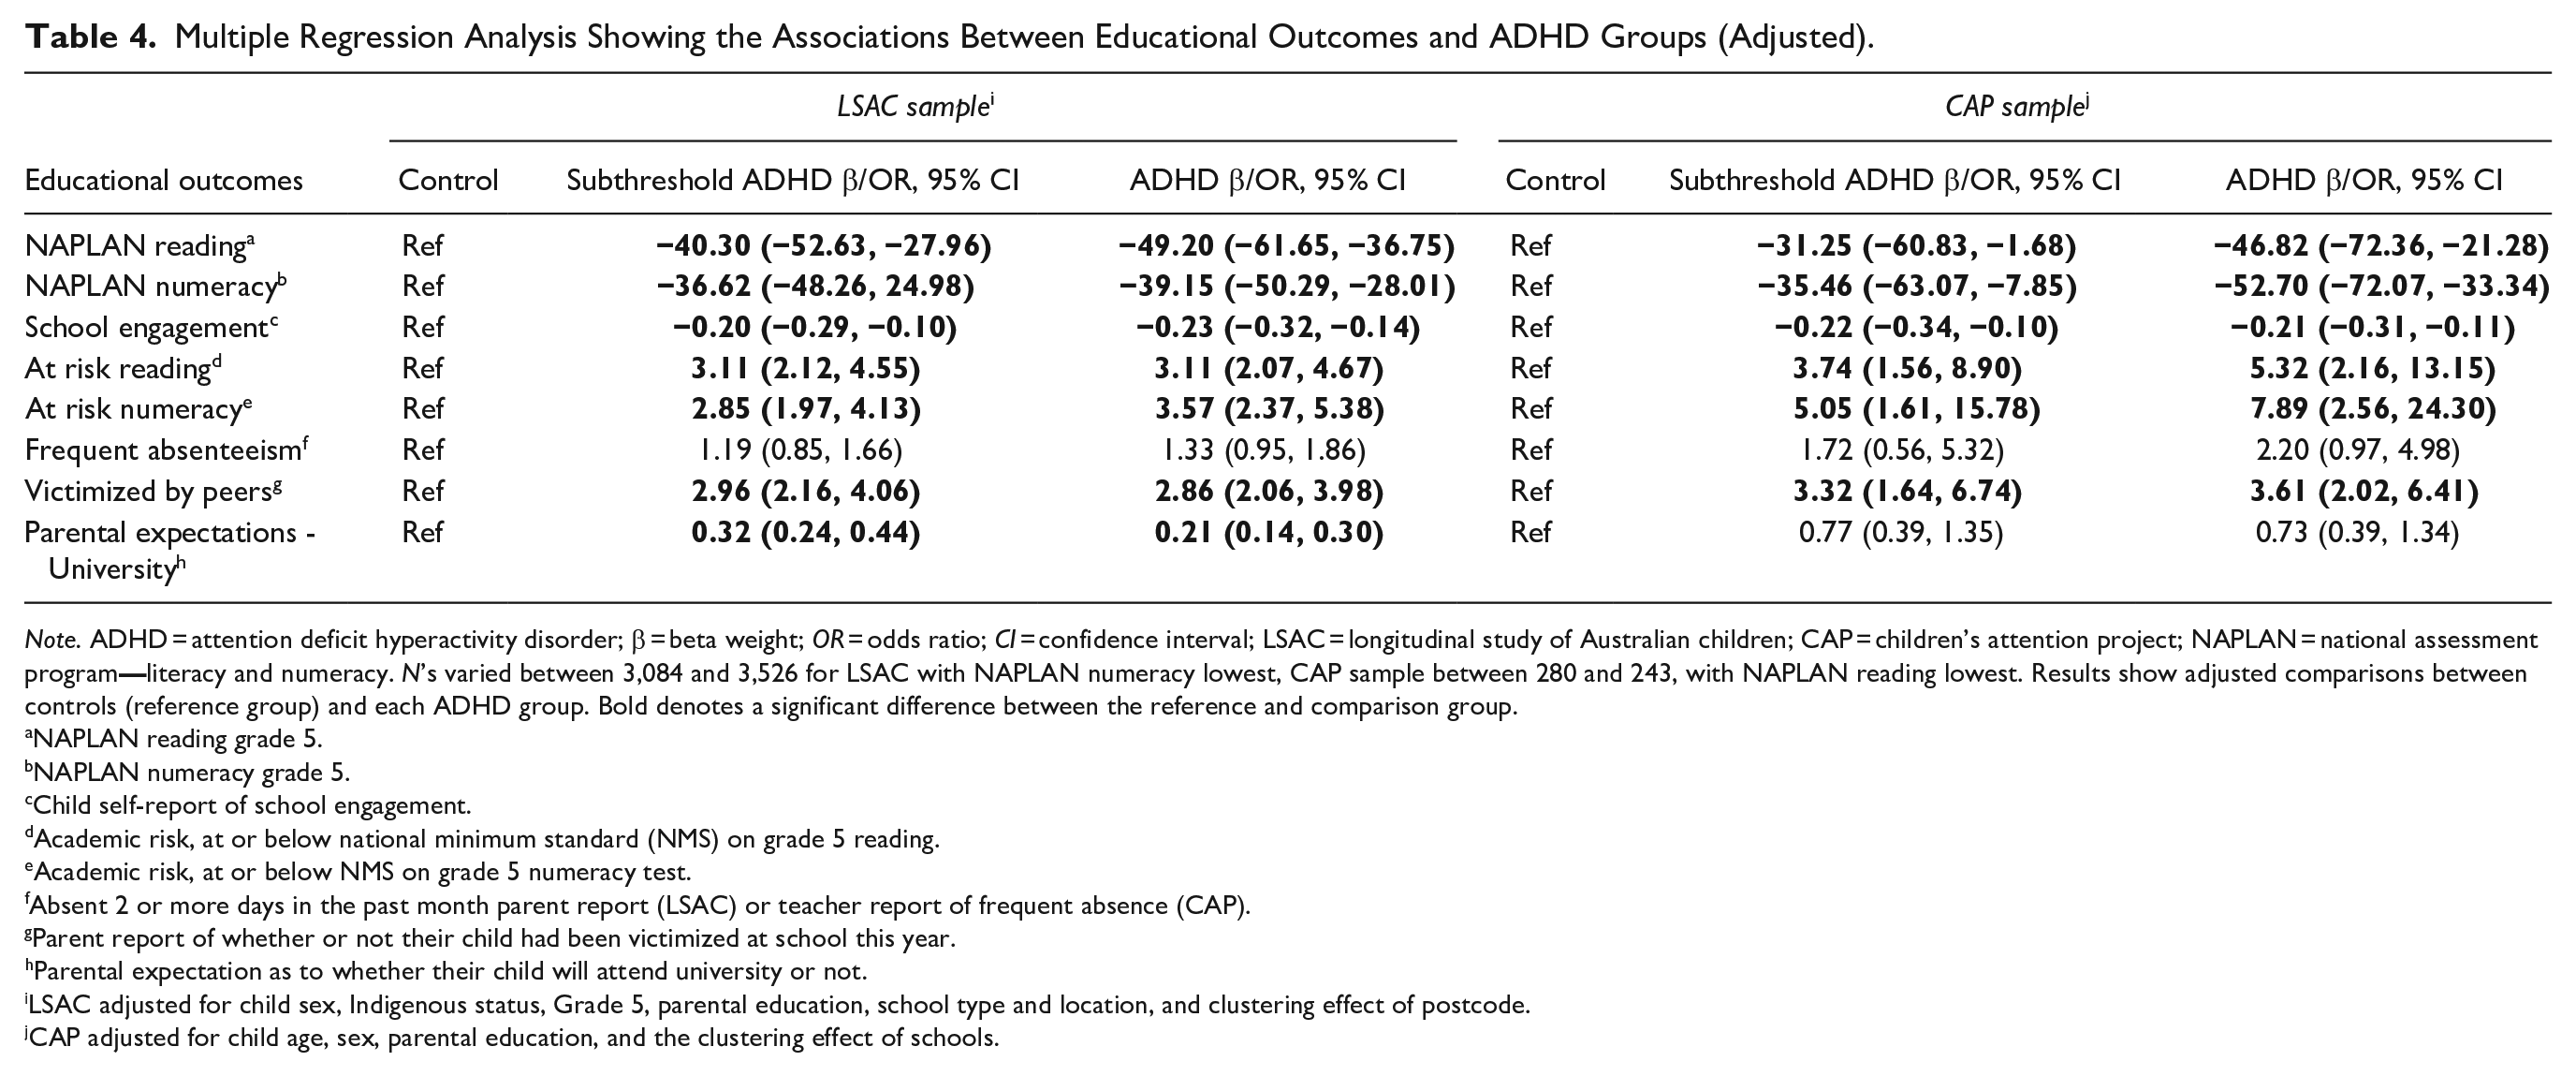
Note. ADHD = attention deficit hyperactivity disorder; β = beta weight; OR = odds ratio; CI = confidence interval; LSAC = longitudinal study of Australian children; CAP = children’s attention project; NAPLAN = national assessment program
NAPLAN reading grade 5.
NAPLAN numeracy grade 5.
Child self-report of school engagement.
Academic risk, at or below national minimum standard (NMS) on grade 5 reading.
Academic risk, at or below NMS on grade 5 numeracy test.
Absent 2 or more days in the past month parent report (LSAC) or teacher report of frequent absence (CAP).
Parent report of whether or not their child had been victimized at school this year.
Parental expectation as to whether their child will attend university or not.
LSAC adjusted for child sex, Indigenous status, Grade 5, parental education, school type and location, and clustering effect of postcode.
CAP adjusted for child age, sex, parental education, and the clustering effect of schools.
Discussion
This study compared educational outcomes for three groups of primary school children (ADHD, subthreshold ADHD, and controls) using outcomes that are routinely available in education settings. As hypothesized, both children with ADHD and subthreshold ADHD had moderately poorer outcomes across most measurement domains. Although children in the ADHD groups had the poorest performance on outcomes, there was no significant difference in performance between these children and children in the subthreshold ADHD groups. An important aspect of these findings is their robust replication across two independent community-based samples that differ in several respects. This study highlights the potential clinical importance of monitoring educational outcomes and additional learning needs of children with ADHD and subthreshold ADHD during primary school.
Academic Achievement
Our findings suggest both children with ADHD and subthreshold ADHD have poorer academic outcomes (i.e., lower reading and numeracy achievement) compared to their non-ADHD peers, which is consistent with prior research (Efron et al., pn press; Fleming et al., 2017; Loe & Feldman, 2007; Silva et al., 2015). Based on the effect sizes for NAPLAN reading and numeracy, children with ADHD were approximately 8 months behind controls (Goss & Sonnemann, 2016), with children in the subthreshold groups similarly impacted. Additionally, a large proportion of children with ADHD and subthreshold ADHD were not progressing well against the national achievement benchmarks, with more than 25% of children with ADHD in the lowest two performance bands for their grade. Findings are consistent with those reported by Silva and colleagues who examined NAPLAN benchmarks in a large cohort of primary school children in Western Australia (Silva et al., 2015). Findings emphasize the importance of being able to identify and monitor children with ADHD, as well as subthreshold ADHD, to provide academic support and services when indicated.
Non-academic Domains
This study extended previous research by examining children’s performance on a range of non-academic domains related to children’s wellbeing and engagement with school. Children with ADHD and subthreshold ADHD in comparison to controls had poor outcomes (i.e. lowered student engagement and increased experience of peer victimization, and to a lesser extent attendance and parental expectations for their child’s future educational attainment). For example, children in the ADHD groups reported feeling less engaged in school in comparison to controls, with medium effect sizes reported. Lowered engagement in children with ADHD has previously been associated with higher depressive symptoms, poor parental supervision, and increased student-teacher conflict in children and adolescents with ADHD (Rushton et al., 2019; Zendarski et al., 2017b). Similarly, children in the ADHD groups were three to four times more likely to be victimized by their peers at school, supporting previous findings and concerns raised about the impact of peer victimization on children with ADHD’s wellbeing and mental health (Rushton et al., 2019; Zendarski et al., 2017b). Engagement and peer victimization are potentially modifiable factors and targeted intervention could help improve these children’s school experience, and consequently build their resilience, leading to improved educational outcomes (Dvorsky & Langberg, 2016).
Subthreshold ADHD
This study makes an important contribution to the literature on the level of educational impairment experienced by children with subthreshold ADHD. Although current research findings suggest subthreshold ADHD symptoms are associated with functional impairment and of clinical importance (Kirova et al., 2019), there is limited research examining the impact of subthreshold symptoms on children’s academic and non-academic performance in upper primary school. Our data, replicated in two large prospective studies, show ADHD and subthreshold ADHD groups were similarly impacted on all outcome measures. Results suggest that, regardless of whether a child reaches the diagnostic threshold, ADHD symptoms have the potential to impact children’s achievement and performance at school. This finding is similar to our recent paper examining academic functioning in children with full syndrome and subthreshold ADHD (Efron et al., 2020) but extends this prior research by focusing on a broader range of educational indicators including national standardized academic assessments. We also show subthreshold ADHD groups have a higher representation of females and higher socioeconomic advantage (i.e., higher parent education) compared with ADHD groups. Both sex and socioeconomic advantage have previously been shown to be characteristic of subthreshold ADHD groups in comparison to ADHD groups (Kirova et al., 2019).Without targeted intervention and support, both groups of children remain particularly vulnerable as they transition to secondary school (Dvorsky & Langberg, 2016).
Strengths and Limitations
In this study, we were able to replicate findings in two large non-clinical samples of Australian primary school children. LSAC is broadly representative of Australian children and families and the proportion of children categorized as ADHD (using the SDQ HI scale) was within the expected range (3–7%) for ADHD in community samples (Lawrence, 2016; Willcutt, 2012). The CAP study used a rigorous case classification and matching process to categorize children into the three groups. A unified set of outcome measures, including data linkage to NAPLAN grade 5 results, were used across both studies. Even though there were differences in methodology between the two studies, the results were replicated across the two samples, which suggests that they were robust to these differences. A novel component of this study was to compare a broad range of important educational outcomes between children with ADHD and children with subthreshold symptoms in upper primary school. Further, we used multi-informant measures including parent, teacher, and self-report in the non-academic domains. Cumulatively, these factors improve the generalizability of findings.
There are several limitations to note. The LSAC sample included children across Australia from different school settings and areas. In contrast, the CAP sample was recruited from government schools in metropolitan areas only. To limit potential bias associated with the type of school attended and area, we included school type and location as confounders in the regression analysis for LSAC data. While standardized tests such as NAPLAN are useful benchmark tests, more regular literacy and numeracy testing in classroom is necessary to identify children who are behind and to monitor children who do not sit NAPLAN testing. Diagnostic testing may also be necessary to understand children’s individual strengths and weakness across cognitive domains. This study did not consider the impact of specific comorbid conditions that can impact on school functioning, including externalizing and internalizing comorbidities, autism spectrum disorder, specific learning disorders and lowered IQ which may account for some of the variations in results (Barnard-Brak et al., 2011). However, many studies have found that ADHD remains a significant predictor of academic outcomes even after controlling for these factors (Kent et al., 2011; Zendarski et al., 2017a).
Practice Implications
Our findings that ADHD symptoms, threshold or subthreshold, are associated with poorer educational outcomes in upper primary school have important implications for practice. A strong primary school foundation in literacy and numeracy underpins a child’s future educational success and outcomes in both these domains remain a key part of educational targets for schools and policy makers. Our findings further substantiate the impact of ADHD symptoms on children’s academic achievement. Despite this, there remains no definitive policy or procedures in relation to the education of students with ADHD within Australian primary schools. Additionally, less than half the children with ADHD have been diagnosed (Efron et al., 2014; Sayal et al., 2018), and children with subthreshold ADHD are likely to go unrecognized as a cohort of children at risk.
Although subthreshold ADHD may represent a milder phenotype in comparison to children full syndrome ADHD (Kirova et al., 2019), these children are also likely to be experiencing school difficulties in their upper primary school years. ADHD symptom thresholds for diagnosis may be less meaningful in the context of educational outcomes and children with elevated symptoms who fail to meet such thresholds remain at considerable risk. Greater emphasis should be placed on identifying primary school children with impairing levels of inattentive and or hyperactive-impulsive behaviors in the classroom irrespective of whether they meet criteria for a diagnosis. There remain numerous challenges to being able to identify children at risk of ADHD in upper primary school. Information on school achievement and performance may be hard to obtain, particularly if these children are excluded from testing, are frequently absent or move schools. Referral pathways between educators and health professionals may be unclear, and some parents may be reluctant to seek professional help for their child (Sayal et al., 2018).
Further obtaining access to funding for special educational services and supports remains challenging for children identified with ADHD in Australia, as the diagnosis itself is insufficient to meet criteria to obtain access to funding programs for students with disabilities and services (i.e., learning support teacher). Access to Individual Education Plans (IEPs) and Student Support Groups (SSGs) are at the discretion of individual school principals and often requires strong advocacy from parents. In Australia, only 4% of children have diagnoses that qualify them to access services, whilst 18% identified with emerging needs do not qualify (O’Connor et al., 2020). However, the Australian National Consistent Collection of Data (NCCD) is beginning to address this gap by having schools examine the type of adjustments that they make in the classroom for students based on student’s functional needs, as opposed to clinical diagnosis criteria. Some Australian states are also using this model to determine school funding, potentially enabling a closer match between student needs and school resources (Garvey et al., 2020).
Targeted academic intervention, as well as programs to assist children with ADHD in childhood to manage the increased academic demands of upper-primary school that is, organizational and homework skills programs (Langberg et al., 2011), are moderately effective in improving academic outcomes. Behavioral modification approaches such as the Daily Report Card, where daily behavioral goals (i.e., complete homework) are created for the child using tangible rewards and parental involvement can be effective in improving motivation and decreasing unhelpful behaviors. These interventions can be implemented effectively by school staff with minimal resources and cost (DuPaul et al., 2012). However, there is a paucity of information on accommodations, services, and interventions being accessed by children with ADHD in primary schools (Sayal et al., 2018). There remains a pressing need for education and health professionals to continue to collaborate on policies and programs aimed at addressing educational disadvantage for children with impairing ADHD symptoms before they transition to secondary school.
Conclusion
Results from two large cohorts of children in upper-primary school show children with ADHD and subthreshold ADHD languish behind their peers on a broad range of academic and non-academic educational outcomes. Early identification of educational difficulties, along with an integrated approach to policy and intervention, is needed to drive change. Developing a consistent set of educational outcomes measures could provide a mechanism to monitor the effectiveness of these programs. With better collaboration between health and education, measures could be obtained through existing data sources routinely collected in health and education settings.
Supplemental Material
sj-docx-1-jad-10.1177_1087054720972790 – Supplemental material for Examining the Educational Gap for Children with ADHD and Subthreshold ADHD
Supplemental material, sj-docx-1-jad-10.1177_1087054720972790 for Examining the Educational Gap for Children with ADHD and Subthreshold ADHD by Nardia Zendarski, Shuaijun Guo, Emma Sciberras, Daryl Efron, Jon Quach, Leanne Winter, Matthew Bisset, Christel M. Middeldorp and David Coghill in Journal of Attention Disorders
Footnotes
Acknowledgements
The authors gratefully acknowledge the participating families and teachers of the LSAC and CAP studies, as well as the research team who have collected and maintained the data.
Declaration of Conflicting Interests
The author(s) declared no potential conflicts of interest with respect to the research, authorship, and/or publication of this article.
Funding
The author(s) disclosed receipt of the following financial support for the research, authorship, and/or publication of this article: This study was commissioned by the Australian ADHD Professionals Association (AADPA) and funded through the Australian Government under the Department of Health Mental Health program awarded to AADPA. This Children’s Attention Project was funded by the Australian National Health and Medical Research Council (project grant no. 1008522). A/Prof Efron was supported by a Clinician Scientist Fellowship from the Murdoch Children’s Research Institute (MCRI). MCRI is supported by the Victorian Government’s Operational Infrastructure Support program. A/Prof Sciberras was funded by a National Health and Medical Research Council Career Development Fellowship (1110688) and a veski Inspiring Women’s Fellowship.
Supplemental Material
Supplemental material for this article is available online.
Author Biographies
References
Supplementary Material
Please find the following supplemental material available below.
For Open Access articles published under a Creative Commons License, all supplemental material carries the same license as the article it is associated with.
For non-Open Access articles published, all supplemental material carries a non-exclusive license, and permission requests for re-use of supplemental material or any part of supplemental material shall be sent directly to the copyright owner as specified in the copyright notice associated with the article.