



Abstract
Strong scientific evidence supports the potential for serious global impacts due to climate change. While mitigation efforts are essential to slowing the threat of climate change, adaptation practices to build resilience to and protection from environmental impacts should be accelerated. This paper presents a methodology to integrate adaptation efforts into the long range transportation planning (LRTP) process, and describes a tool, Climate Change Adaptation Tool for Transportation (CCATT) to assist planners. Using a decision theoretic approach that recognizes uncertainty, climate change scenarios are evaluated based on the LRTP timeline. Since climate change impacts vary geographically, the methodology is intended to be repeatable, relevant, and regionally applicable. A case study is developed for the Mid-Atlantic region based on a Metropolitan Planning Organization in northern Delaware. The case study results reveal the effectiveness of the methodology to a real world application and the need for transportation adaptation in response to climate change.
Introduction
Strong scientific evidence supports the potential for serious global impacts due to climate change (Stern, 2006). The Intergovernmental Panel on Climate Change (IPCC) released a statement in the Fourth Assessment Report that there is a 90% probability (very high level of confidence) that greenhouse gas emissions produced by human activities have caused most of the observed global warming since the mid-20th century (IPCC, 2007). Over the past 50 years, global warming has occurred at a rate of 0.13°C per decade, leading to observable environmental changes such as varying rainfall patterns, sea level rise, ice and snowmelt, and increase in intensity and frequency of extreme weather events (IPCC, 2007). As global warming continues, time is running out to stabilize and reduce greenhouse gas emissions in order to avoid the “devastating impacts on our planet” (Environment, Heritage, & Local Government, 2007).
A growing concern facing the transportation sector in the United States is the potential impact of climate change on land transportation. As scientific evidence on climate change continues to support the relationship between anthropogenic activities and global warming, greenhouse gas concentrations continue to rise at a rate of more than 2 parts per million each year (Stern, 2006). Therefore, much of the discussion and efforts related to transportation and climate change is focused on mitigation and reducing transportation’s contribution to climate change (Valsson & Ulfarsson, 2009). While mitigation efforts, defined as action to minimize greenhouse gas emissions throughout various aspects of society (Pew Center on Global Climate Change, 2009), are essential to slowing the threat of climate change, adaptation practices to build resilience and protection from environmental impacts should be accelerated (Stern, 2006). Adaptation to climate change, in the context of long range transportation planning, is defined as the development, modification, maintenance, and renewal of transportation infrastructure, operations, and policy to moderate the impacts of climate change. This includes infrastructure changes to support mitigation efforts such as the use alternative fuels. This broad definition is consistent with the role Metropolitan Planning Organizations (MPOs) play in long range transportation planning (LRTP), and efforts to recognize synergies between mitigation and adaptation (Kane & Shogren, 2000). Without evaluation and implementation of adaptation along with mitigation, there is the potential for ill-advised investments in transportation infrastructure and development decisions, and premature failure of existing infrastructure with significant economic impacts. Therefore, planning for adaptation in response to potential climate change impacts is needed to support more sustainable processes to protect the natural and engineered environments.
Transportation and climate change are inextricably linked. Transportation continues to contribute to climate change, and transportation infrastructure is impacted by changes in sea level, temperature, precipitation, wind, and more extreme weather events (Pew Center on Global Climate Change, 2009). Therefore, transportation agencies are under pressure to promote sustainable practices through modifying planning, design, construction, maintenance, and operational practices (Meyer & Weigel, 2011). By providing transportation agencies with tools to mitigate and adapt to climate change, transportation agencies can begin to integrate adaptation planning into the LRTP process, which provides opportunities for state and local agencies to access federal funds (Meyer et al., 2010).
The primary objective of this research is to develop a step-by-step methodology for constructing a decision-support tool for incorporating adaptation practices into transportation planning in response to climate change, the Climate Change Adaptation Tool for Transportation (CCATT), to address the needs of Metropolitan Planning Organizations (MPOs) and Departments of Transportation (DOTs) throughout the country. The methodology is intended to be repeatable (the same results are obtained with each application), relevant (recognizes ongoing and proposed mitigation activities and produces results that are useful to transportation agencies), and regionally applicable (recognizes differences between geographic locations). In addressing this primary objective, the following secondary objectives are achieved: a review and needs assessment of existing adaptation tools, a correlation between the LRTP time horizon and climate change projections, identification of adaptation practices in support of mitigation and potential climate change impacts, and a case study application to a specific region (Mid-Atlantic). The final contribution is a universally applicable methodology for constructing a climate change adaptation tool for land transportation throughout the United States.
The following section presents background material on climate change and transportation including a review of recent and ongoing related research. Building on the definition of adaptation presented, the subsequent section develops a methodology to integrate climate change adaptation into the transportation planning process. This methodology serves as a basis for the CCATT. The development of this tool for the Mid-Atlantic region is described in the next section. The tool is then applied to a case study in northern Delaware. The results from the case study and conclusions are then presented.
Climate Change and Transportation
Science shows that climates are changing and this change will continue to accelerate over future years, having a significant impact on the built and natural environment (Pew Center on Global Climate Change, 2009). With this knowledge, mitigation efforts, such as setting limits on emissions will not be sufficient, or timely enough to avoid all potential impacts of climate change (Pew Center on Global Climate Change, 2009). Therefore, in order to prepare and protect societies, economies, and the environment, adaptation efforts are required. These efforts, which are starting to emerge, require steps to improve planning, develop more climate-resilient infrastructure, and overall, provide better information to individuals on how they can respond (Stern, 2006).
Climate Change Adaptation
Climate change adaptation is defined by the IPCC (2007) “as the adjustment in natural or human systems in response to actual or expected climatic stimuli or their effects which moderates harm or exploits beneficial opportunities” (EPA, 2009). The adaptation process involves risk assessment, information sharing, decision-support tools, and collaboration (Pew Center on Global Climate Change, 2008). The need and capacity for adaptation, like climate change phenomena, varies throughout the country. The geography, economy, social and political structures, as well as many other factors will inevitably influence the capability of regions to adapt, also referred to as adaptive capacity. More specifically, it involves an evaluation of “What is feasible in terms of repair, relocation, or restoration of the system?” and “Can the system be made less vulnerable or more resilient?” (Pew Center on Global Climate Change, 2009). Adaptation of transportation infrastructure is intended to make the infrastructure more robust to climate change.
Our broad definition of adaptation “the development, modification, maintenance and renewal of transportation infrastructure, operations and policy to moderate the impacts of climate change”, including infrastructure changes to support mitigation efforts, is consistent with the work of the IPCC and the Pew Center on Global Climate Change. Effective implementation of adaptation strategies requires adaptive management, which refers to managing systems under the threat of abrupt change where policies are tested against the experience of implementation (Dewar & Wachs, 2006). The United Nations Development Programme defines the process as an Adaptation Policy Framework (APF) that includes scoping adaptation projects, assessing vulnerability, assessing future risks, formulating an adaptation strategy, and continuing the process (Burton, Malone, & Huq, 2004).
The need for and immediacy of adaptation are often questioned given the real barriers that exist. These barriers include constrained budgets, regulatory restrictions, policies, lack of supporting technologies and models, and the short-term nature of the planning horizon (UK Climate Impacts Programme, 2009). In addition to “real” barriers, there are perceived barriers related to the uncertainty associated with climate change including the mismatch between planning horizons and climate change projections, belief that the uncertainty is too great, lack of relevant precedents, and poorly understood risks (UK Climate Impacts Programme, 2009). Overcoming these barriers is a challenge; however, building a strong adaptive capacity through improved understanding of climate change, and evaluating associated risks and vulnerabilities is essential to successful adaptation.
Current Transportation Adaptation Efforts
Recently, climate change action has focused on mitigation to reduce the occurrence of climate change phenomena, by minimizing greenhouse gas emissions in transportation, industrial production, and energy consumption (Pew Center on Global Climate Change, 2009). Mitigation measures, although important to addressing the potential impacts of climate change, many times require and depend on adaptation of existing infrastructure (McNeil, 2009). Adaptation affects the costs and benefits of mitigation, which are not always addressed in climate change policy (Kane & Shogren, 2000). For example, the recent support of alternative fuels for transportation such as hydrogen, biofuel, and liquefied natural gas require significant investment in the production and distribution of these fuels. Therefore, existing infrastructure that is petroleum-based will have to adapt and change to producing, storing, transporting, and distributing alternative fuels.
Proactive and comprehensive adaptation planning within the United States is still in the early stages. Over the last decade, interest in mitigation and more recently adaptation have risen dramatically (McNeil, 2009). Adaptation legislation began to emerge around 2007 (Cambridge Systematics, 2009). While the concept is relatively new, as of August 2010, there were 74 congressional bills addressing climate change adaptation. These initiatives recognize the need for an approach to identifying at-risk systems (Pew Center on Global Climate Change, 2010). In addition, efforts to explore the relationship between transportation and climate change impacts are emerging. The Gulf Coast Study (U.S. DOT, 2011) is a regional analysis that focuses on identifying regional climate change impacts and developing risk assessment tools for transportation planners. In 2010, the Federal Highway Administration (FHWA) released a conceptual framework for assessing the impacts of climate change (U.S. DOT, 2010a). This framework encourages transportation agencies (Metropolitan Planning Organizations and State Departments of Transportation) to incorporate climate change issues into their Long Range Transportation Plans (LRTP) (U.S. DOT, 2010a). LRTP’s typically include an examination of forecasts in population, employment, housing, and travel in order to make investments toward transportation projects based on the short-term and long-term planning horizon (WILMAPCO, 2010). Therefore, the LRTP serves as a document that includes both policy and action items (WILMAPCO, 2010). In addition to FHWA’s efforts, Meyer and Weigel (2011) have promoted the use of an adaptive systems framework to manage transportation assets which is consistent with the steps outlined in CCATT. The National Cooperative Highway Research Program project 20-83(5) is developing tools and guides to support the evaluation of impacts and adaptation approaches. Other local efforts within agencies such as the Maryland Commission on Climate Change (2008) have developed a comprehensive strategy for addressing climate change vulnerability.
Despite these efforts, transportation agencies are largely not incorporating the concept of adaptation into transportation planning (ICF International, 2008a). Assessing and addressing climate change is challenging. First, while the debate over the occurrence of climate change has subsided in the scientific community, the debate continues in the political arena. There is rarely consensus that the problems exist and must be addressed. Second, the uncertainty surrounding the magnitude and the extent of estimates of climate change, and the lack of downscaled regional estimates that are specific to a facility, type of service, or network mean that we are unable to capture the impacts for a specific location and understand how these impacts relate to the transportation services being provided. Finally, transportation agencies are facing fiscal crises and lack resources for maintenance and improvement of existing facilities. Funding strategic improvements, particularly if the problem is not immediately visible, is challenging, and tends to be overshadowed by the demand for infrastructure improvements to meet current issues (ICF International, 2008b).
Given the evidence that climate change is occurring, and the long timeframes involved in transportation planning, there is value in exploring opportunities to react to the evidence of climate change using processes that are consistent with, and complementary to, existing transportation planning practices. While this approach focuses on regional solutions to a larger-scale problem, the process identifies projects that can then be input into the broader transportation planning process. This process then provides an opportunity for public and political scrutiny, and evaluation. This paper presents a tool for transportation planning agencies to generate candidate projects for the LRTP.
Globally, tools have been assembled to address adaptation at various scales with the goal of encouraging organizations, institutions, communities, and individuals to adapt to climate change. In 2007, a workshop was held in Geneva to discuss and share adaptation tools that were developed throughout the world (The World Bank et al., 2007). Drawing on this review of tools, such as the Adaptation Wizard (UK Climate Impacts Programme, 2009) and CRiSTAL (IISD et al., 2008), and considering newer models, such as Model for the Assessment of Greenhouse-gas Induced Climate Change (MAGICC) (UCAR, 2007), and ENSEMBLES (European Environment Agency, 2010), this research developed a list of needs for future adaptation tool development. Drawing on this list, effective tools for integrating climate issues into transportation planning have the following characteristics:
Includes discipline-specific processes and information (in this case, specific to transportation).
Analyzes future climate change scenarios in reference to typical planning horizons.
Evaluates the agency’s adaptive capacity in addition to the community based on existing barriers (UK Climate Impacts Programme, 2009).
Inventories existing infrastructure and facilities within a jurisdiction.
Analyzes future development to address potential at-risk projects.
Recommends potential adaptation activities in relation to transportation.
Given the range of options, the long planning horizon, and the uncertainties involved, a strategy for limiting the number of possible scenarios was considered. Robust decision analysis techniques (including the info-gap method, convex analysis, prediction-based analysis, maximum entropy, and traditional expected value) were rigorously evaluated as a way to assess the likelihood and potential outcomes of climate change scenarios including uncertainty. The info-gap method was selected (Ben-Haim, 2006). The info-gap method is useful in addressing decisions that incorporate severe gaps in knowledge or when probabilistic models of uncertainty are unavailable, unreliable, or inapplicable (Regan et al., 2005). The info-gap method maximizes the expected value while removing unacceptable outcomes, and is suggested based on an assessment of decision analysis tools and their applicability to climate change scenarios (Oswald, 2011).
A Methodology to Integrate Climate Change Adaptation Into the Transportation Planning Process
To begin to consider adaptation strategies for transportation infrastructure and services, a methodology is needed to provide transportation planners with adequate background, data, and knowledge to take action. The methodology is focused on developing a decision-support tool titled, CCATT. Since climate change impacts vary by region throughout the United States, the methodology is developed with the intentions of being repeatable, relevant, and regionally focused. The methodology presents a general structure for developing CCATT that includes four major components:
Evaluation of scenarios, adaptive capacity and impact assessment, recognizing ongoing and potential climate change, and possible mitigation efforts.
Inventory of existing transportation facilities to identify infrastructure “at-risk” to climate change impacts.
Assessment of proposed projects to reduce the potential risks from climate change.
Evaluation of existing mitigation practices promoted by the agency to identify supporting adaptation efforts. For example, if the agency is supporting new infrastructure (an adaptation effort) they should be simultaneously supporting the use of alternative fuel vehicles (a mitigation effort).
For each component, specific steps are described in detail with the purpose of allowing agencies to create their own jurisdiction-specific tool. Figure 1 displays the steps included for each of the four components.

Methodology for developing CCATT.
The steps are based on a review of adaptation management literature, such as the five step Adaptation Planning Framework (Burton et al., 2004), as well as global, international, national, and state efforts. While CCATT was developed independently from the FHWA’s conceptual Risk Assessment Models (U.S. DOT, 2010a), the principles and concepts used in CCATT are similar, and effectively, CCATT is an implementation of FHWA’s conceptual model. In general, the universal methodology of CCATT provides an innovative link between existing adaptation frameworks and addressing the needs of transportation agencies.
Each step displayed in Figure 1 is described below in terms of its overall content and purpose. The goal of providing an overview of the steps is to encourage agencies to use a similar methodology and apply CCATT to all regions throughout the United States. Oswald (2011) provides a thorough discussion of each of the 12 steps in terms of implementation.
1. Conduct a climate change scenario analysis
The uncertainties related to climate change include when climate change will occur (present, short, long term), the severity (low, moderate, severe), and possible actions (mitigate, adapt, both, and do nothing). This results in a total of 36 representative scenarios. The info-gap method evaluates a set of probabilities and consequences over a horizon of uncertainty for each scenario (Ben-Haim, 2006). The initial probabilities can be gathered using a climate change scenario tool such as the Model for the Assessment of Greenhouse-gas Induced Climate Change / A Regional Climate Scenario Generator (MAGICC/SCENGEN), which is a software program that combines gas-cycle, climate, and ice-melt models with the goal of comparing the global-mean temperature and sea level implications of a “reference” scenario and a “policy” scenario (UCAR, 2007). The output result is change in temperature over time and is compared to levels of severity associated with potential climate change impact based on the agency’s planning horizon (present 0 to 5 years, short term 6 to 15 years, and long term 16 to 40 years). The discrete levels of severity (high, medium, and low) are derived from the literature (Oswald, 2011). The probabilities (0-1) of being in each level of severity for each scenario are calculated using the change in temperature output from MAGICC/SCENGEN. Additional inputs are assessed (based on agency characteristics) including the probability of success (likelihood of an agency to successfully implement mitigation and adaptation actions), discount factor, and the specific timeframe for the agency’s planning horizon, in order to determine which actions lead to acceptable versus unacceptable outcomes based on expected value of consequence (Oswald, 2011).
Equation 1 displays the calculation for the expected value of the consequences for each type of action implemented in the short and long term for each value in the horizon of uncertainty. This relative value reflects the outcome based on an arbitrary scale defined such that larger values represent positive outcomes or consequences. The expected value must be greater than a threshold to be potentially an acceptable scenario. Each of the variables and their function in the expected value calculation are discussed following the equation.

Where:
EV= expected value of the consequences of the actions, EVcritical = minimum EV of consequences for acceptable outcome, i = type of action (do nothing, mitigate, adapt, and both mitigate and adapt), ST = short term, and LT = long term


vjk = consequence of severity state j occurring in time frame k, n = horizon of uncertainty = [−1.0, −0.9, −0.8 . . . 0.8, 0.9, 1.0], pjk = probability of the severity state j occurring in time frame k, j = severity state (high, medium and low), k = time frame (present, short term and long term), J = # of severity states, and K = # of time frames.
The expected value of the consequences is computed for each pair of short-term and long-term actions (iST/iLT), and for each horizon of uncertainty. These are the actions that the agency is willing to undertake, which become inputs into the MAGICC/SCENGEN model, as discussed previously. The expected value is based on the product of the probability (pjk) of the severity of climate change and the consequences (vjk) of that severity of climate change for all climate change severities and time frames represented by the parameters j (severity) and k (time frame).
The severity states are calculated based on the types of action the agency is willing to take. The timeframes are established based on agency inputs. The end result is a series of robustness curves—one for each pair of actions—each curve varying with the horizon of uncertainty, as shown in Figure 2 (where DN is do nothing, M is mitigate, A is adaptation, and B is both) over the planning horizon of short and long-term time frames. In the case of climate change scenarios, both underestimation and overestimation is evaluated. Therefore, a horizon of uncertainty from 1.0 (100% overestimated) to −1.0 (100% underestimated) in increments of 0.1 (10%) is applied to the original probability and consequence estimates to account for both over and under estimations of the original values (as shown in Equation 1). The probability is constrained to be between zero and one.

Sample results for scenario analysis.
Therefore, for each scenario (represented by a short-term and a long-term action), a total of 21 expected values were computed representing both the overestimation and underestimation situations, in addition to the original scenario. This yields a graphical representation of expected value of the consequences over the horizon of uncertainty spanning from −1.0 to 1.0. This scale for the horizon of uncertainty reflects complete uncertainty (100%) in both the overestimation and underestimation for each scenario with the midpoint at zero representing no uncertainty. If more discrete points are used (a total of 21 here) to represent the horizon of uncertainty, the relationship between the degree of uncertainty and climate change impacts is displayed at a higher resolution.
The critical value, or threshold for the expected value of consequences (EVcritical), is identified by the agency based on their input for the outcome acceptance threshold (using a semantic differential scale from “very negative” to “very positive” outcome) and sets the level of “acceptability” of climate change impacts. It is represented by a straight line over the horizon of uncertainty (Oswald, 2011). Since each agency has a unique level of “acceptability” the agency has to set the threshold at which outcomes resulting from specific actions are unacceptable or acceptable. The purpose of the robustness curves is to rule out any actions that lead to unacceptable outcomes (over the entire horizon of uncertainty), which occur when a curve is completely below the critical expected value (EVcritical). Any action below the EVcritical value is an unacceptable action and is not recommended for implementation. In Figure 2, DN/DN represents Do Nothing in the short term, and Do Nothing in the long term and is an unacceptable scenario. The expected value equation and robustness curve are discussed in more detail in Oswald (2011).
This step serves as the foundation for determining the scenarios to be considered and quantifies the need for a tool to consider adaptation strategies. Subsequent steps consider only those actions that the agency is willing to take in the short and long term. Although the scenario analysis is based on the practices of one agency, it is assumed that similar decisions across MPOs and DOTs would ultimately lead to representative climate change impacts. While mitigation must be global to be truly effective, adaptation is decidedly a local activity. The purpose of this step is to motivate and quantify the need for action and to encourage transportation agencies to recognize why CCATT is a valuable planning tool. Ideally, as climate models improve on the regional level, this scenario analysis process can be refined to the impacts specific to the jurisdiction.
2. Assess agency’s adaptive capacity
Evaluate the agency’s capability to adapt to climate change through first determining barriers to adaptation and then ideally addressing these barriers or at least recognizing their impact on successful adaptation integration. An agency’s adaptive capacity is based on economic resources, technology, information/awareness, skills/human resources, natural resources, infrastructure, and institutional support/governance (UK Climate Impacts Programme, 2009). The evaluation can be done by having the agency fill out a checklist to determine which barriers apply and then provide suggestions on how to address them, prior to completing the CCATT.
3. Assess regional climate change impacts (Regional Impact Assessment)
Complete an in-depth analysis of the potential impacts on the region based on topography, terrain, latitude, longitude, coastal proximity, and sea level. Regions in the United States have been classified as Northeast and Mid-Atlantic, West, Midwest, Great Plains, Southeast, Pacific Northwest, Alaska, and Hawaii and United States. Affiliated Islands on the basis of similar impacts of climate change (CIER, 2010). Impacts such as increased temperatures, increased precipitation, ice and snow melt, rising sea level, and increased frequency and intensity of extreme weather events (such as hurricanes and riverine flooding) are potential threats to regions within the United States (McNeil, 2009). In order to identify which impacts apply, the agency can select their region from a list of the eight previously mentioned regions and then the potential impacts can be shown to help them complete the remaining steps in the tool.
4. Assess jurisdictional climate change impacts (Jurisdictional Impact Assessment)
Conduct an in-depth analysis (quantitative and qualitative) of the potential impacts on the jurisdiction based on localized topography, land uses, proximity to waterways, wetlands, coastline, tunnels, bridges, and existing adaptation facilities. The agency can complete a list of questions based on these jurisdictional impacts. For example, for “existing adaptation facilities” the agency should enter what types of facilities are currently in place and where they are located. This encourages them to inventory some of the basic characteristics of their jurisdiction prior to assessing the impacts of climate change on their facilities.
5. Evaluate existing at-risk infrastructure
Complete an inventory of the existing infrastructure facilities based on the potential regional impacts (increased temperatures, rising sea level, increased precipitation, increased frequency and intensity of extreme weather events, and ice and snow melt) determined in step 3. For each of the potential impacts, a series of inventory assessments are required that address the needs of that impact. Geographic Information System (GIS) is recommended for determining vulnerabilities specifically for rising sea level, increased precipitation and increased frequency and intensity of hurricane events. For example, for sea level rise, inundation levels can be simulated using GIS, and a bathtub model (Poulter & Halpin, 2008) can be used to determine the infrastructure that is at risk. This allows for an inventory of all existing facilities at-risk to sea level rise based on appropriate inundation levels such as a rise of 0.5 meters in elevation. As spatial analysis models evolve, the ability to map potential impacts of sea level rise and precipitation for their joint effects is needed and should be adopted as a technique for this model. The same process should be done for each of the regionally specific climate change impacts.
6. Identify adaptive strategies to address existing at-risk infrastructure
Explore adaptation activities that address facilities determined as “at-risk” in step 5. Adaptation activities should be categorized based on the same regional impacts determined in step 3 and the activities can be identified from the literature, such as Adapting to the Impacts of Climate Change (National Research Council, 2010), and engineering knowledge. Specific activities include raising the elevation of facilities, relocating portions, abandoning development, or using heat-resistant materials (Oswald, 2011).
7. Evaluate proposed infrastructure projects
Complete an inventory of the proposed infrastructure projects to be completed within the agency jurisdiction based on the potential regional impacts (similar to step 5). The only difference between the two steps is that step 7 focuses on proposed projects (those that are not already in place), and the methodology for exploring regional impacts on the projects is identical. Since the infrastructure is not yet existing, proposed designs/plans are used to determine potential risks.
8. Identify adaptive strategies to address proposed infrastructure projects
This step is identical to step 6, addressing proposed facilities determined as “at-risk” in step 7. The only difference between the two steps is that step 8 focuses on proposed projects (those that are not already in place), and the methodology for determining adaptive strategies for the projects is identical. Since these projects are proposed, altering or eliminating projects completely may be an efficient and cost-effective option, not easily accomplished for existing facilities.
9. Review existing mitigation activities, if appropriate
Complete an evaluation of the existing mitigation activities implemented by the agency as well as other authorities throughout the jurisdiction. Mitigation actions can be distinguished based on two main goals: reduce energy consumption and reduce vehicle miles traveled (DNREC, 2009). In addition, a list of new mitigation activities should be explored using sources such as the TRB Special Report 290 (TRB Committee on Climate Change & Transportation, 2008) and the Transportation’s Role in Reducing Greenhouse Gas Emissions (U.S. DOT, 2010b). The agency responds to questions identifying which mitigation actions (based on those in the TRB [2008] and U.S. DOT [2010b] reports) they are supporting in order to then proceed to step 10, which relates their mitigation practices to supporting adaptation practices consistent with the definitions used in this paper.
10. Identify adaptive strategies in support of mitigation practices
Determine adaptation strategies and current progress to address the mitigation strategies identified in step 9 based on mitigation sources specified previously, and adaptation sources such as Adapting to the Impacts of Climate Change (National Research Council, 2010). For each of the mitigation actions, a list of the related adaptation activities should be provided. The agency can enter their progress (based on a scale from 0 “no progress” to 3 “completed”) in terms of how far along they have implemented the adaptation action.
11. Establish a monitoring plan
Develop a monitoring plan to update and refine CCATT as well as reevaluate the output from CCATT. The updating and refining of CCATT should reflect refinements to both the data (including changes to the infrastructure and projects that have been implemented) and the modeling process. CCATT must reflect changes in the infrastructure as well as changes in climate change science. As projections and probabilities are refined, the tool should be monitored and adjusted to reflect the improvements. Annual reviews are suggested and should be documented. The actual application of the tool and review of outputs should be consistent with the LRTP. The monitoring plan suggests that the usage and development of the tool is iterative but recognizes that implementation takes time.
12. Develop summary report
Construct a yearly summary report to highlight the main findings of the tool and to provide an output of the results. The results should document all steps completed throughout the process so that yearly trends can be made. Although the methodology consists of 12 steps, the process is not linear. It is recommended that if at any time throughout the development of CCATT new information regarding infrastructure, proposed projects, mitigation, or climate impacts, the steps should be repeated and updated. Once CCATT is developed and applied to the jurisdiction, the results should be analyzed from a feasibility standpoint and used to determine “next steps” in planning for transportation adaptation.
Developing the CCATT for the Mid-Atlantic
Using the methodology described above, the transportation adaptation tool, CCATT, was developed with the intention of applying it to a case study at the local scale consistent with the LRTP. CCATT is developed for the Mid-Atlantic coastal region to demonstrate the use of the tool by the Wilmington Area Planning Council (WILMAPCO), a Delaware MPO. Developing the tool for the Mid-Atlantic region focuses on the climate change impacts on land transportation specific to that region. These are (a) increases in very hot days and heat waves, (b) rising sea levels, and (c) increases in intense precipitation events (McNeil, 2009). The development of CCATT: Mid-Atlantic serves as an example of how to apply the general CCATT methodology to other regions and agencies with varying climate change impacts, other than those specified for the Mid-Atlantic region.
The tool is created in Microsoft Excel™ in order to provide a user-friendly environment for data entry and rapid prototyping. Within the Excel™-based tool, each worksheet represents another step in the process of evaluating transportation adaptation. Therefore, the twelve steps discussed previously are expanded into 18 Excel™ worksheets in order to allow for multiple worksheets for step 1-Scenario Analysis which has a number of user inputs and outputs as well as for a background and an introduction page which provide instructions on how to use the tool.
The regional impacts dictate the methods and strategies used to identify and address transportation infrastructure at-risk to climate change impact. For each of the three impacts specific to the Mid-Atlantic, methods are developed in the tool that address the issues specific to the climate change impacts. These methods are summarized below:
i. Gather Data: Collect GIS files of jurisdictional boundaries, housing data, and existing transportation facilities and plot in GIS.
ii. Create Inundation Layers: Using existing data from state agencies or using GIS, develop inundation layers for levels relevant to the region. For WILMAPCO, this is 0.5, 1, and 1.5 meters (based on local governmental agency sea level rise scenarios which does not include the 2.0 meter rise).
iii. Determine Vulnerable Areas: Using GIS, determine areas that will be vulnerable up to 2 meter rise level, if applicable.
iv. Divide into Profile Areas: Using GIS, divide the vulnerable area into smaller profile areas in order to analyze in detail.
v. Analyze Profile Areas: Complete the summary table for each individual profile area and enter cumulative values representing the entire jurisdiction.
For the facilities that are determined as at-risk to inundation, it is recommended that the agency evaluate possible strategies for adaptation based on the following list (National Research Council, 2010):
Elevate structures and resources
Build or raise seawalls/levees/dikes for protection
Provide storm surge barriers to protect vulnerable rivers and adjacent infrastructure
Retrofit to strengthen including tying down bridge decks and protecting piers against scour
Protect critical components-tunnels, bridges and electrical systems
Abandon, relocate, or move infrastructure
Raise bridge heights
The specific recommendations for each facility are determined by the agency and by using this step-by-step process, the possible options and areas of impact are rigorously evaluated. It is important to note that the results of the analysis are based on the accuracy of the topographic data and impediments to inundation, therefore, the scale at with the results are analyzed should be correlated to the original accuracy of the data files.
Increased intensity of precipitation events is recognized using similar methods to increased surge heights (Jacob et al., 2010). Since flooding associated with increased precipitation is a result of more localized effects, storm surge is used to reflect the temporary inundation after a storm. Therefore, a similar but more simplistic approach to NOAA’s Storm Surge Interactive Risk Maps of creating layers based on storm surge is used specifically for creating precipitation layers based strictly on storm surge height.
Since the Mid-Atlantic is categorized under the impact of increased precipitation events (and not increased frequency and intensity of hurricane events), storm surge models, such as SLOSH (Sea, Lake, and Overland Surges from Hurricanes), are not used in this tool (NOAA & National Weather Service, 2010). Rather a more generalized application of surge height is used for determining precipitation inundation levels that does not include forward speeds, landfall locations, storm tracks, storm sizes, storm intensities, and astronomical tides. However, as storm surge models become more localized, a SLOSH-like model for increased precipitation events should be used for a more realistic account of storm surge inundation. Also, if this tool is applied to a region that is designated with the impact of “increases in hurricane intensity” then SLOSH or a similar model that incorporates the SLOSH characteristics (forward speeds, landfall locations, storm tracks, storm sizes, storm intensities, and astronomical tides) should be used to account for the specifics of the given shoreline (WILMAPCO et al., 2010).
In order to correlate storm surge with a precipitation event, the equivalent storm surge height based on the Saffir-Simpson scale is used. The Saffir-Simpson scale is a classification for intense precipitation events including hurricanes, tropical depressions, and tropical storms for coastal areas. It includes five categories of storms based on wind, storm surge, and additional factors such as pressure. For the purposes of analyzing the Mid-Atlantic region, Category 5 storms can be eliminated as they are highly unlikely in the northern latitude (NOAA & National Weather Service, 2010).
Using the same methodology as rising sea levels, inundation layers in GIS are developed based on the storm categories: Category 1 = 1.5 meters, Category 2 = 2.5 meters, Category 3 = 3.5, and Category 4 = 5.5 meters. Once the layers are overlaid on the transportation network, vulnerable facilities are identified. Strategies similar to impact #2 are presented along with those related to reinforcing at-risk structures and protecting emergency evacuation routes.
In order to ensure that CCATT: Mid-Atlantic is accurate (correct representation of the issues), adequate (addresses the needs of a transportation system as well as transportation agencies), and appropriate (useful for transportation planning at the network-level) not only for application to a transportation network, but also for integration into a transportation agency’s planning process, these steps were implemented at WILMAPCO, an MPO in northern Delaware. The case study is a real world application that evaluates the agency and their facilities within the jurisdiction of New Castle County, DE.
Using CCATT: Case Study Results
The case study is essential to understanding the applicability of both the methodology and tool implementation. The results reflect the information provided by WILMAPCO and are used not only to further the adaptation efforts of that agency, but also serve as an example for future applications of the tool to agencies throughout the region.
The scenario analysis was applied to WILMAPCO using their planning time frame: Present = 4 years, Short term = 15 years, and Long term = 30 years. For the MAGICC/SCENGEN application and other scenario analysis inputs, default values were used (50% probability of success and a 7% discount factor) and the model parameters were left unchanged. Based on these inputs, the results showed that there is one unacceptable outcome. The Do Nothing/Do Nothing scenario (Short Term/Long Term) is not acceptable based on the robustness curve output. Therefore, this option for the type of action taken in the short and long term can be eliminated. WILMAPCO should, and already has, avoided this pathway since they are currently completing a vulnerability assessment and continue to include mitigation and adaptation measures in their Regional Transportation Plan.
The vulnerable facilities were evaluated using the inventory of existing facilities and the three impact categories. Based on the evaluation, impact #2 (rising sea level) is one of the most prominent in terms of assessed vulnerabilities. Using GIS, inundation layers were provided by Delaware Natural Resources and Environmental Control (DNREC) for 0.5, 1.0 and 1.5 meter inundation levels for New Castle County. Once the levels were created, the steps designated in the tool were used to determine the roadways, bridges, rail track, rail stations, and toll facilities that are inundated at 0.5, 1.0, and 1.5 meters using data from WILMAPCO et al., (2010).
For interstates, there are some portions, specifically the ramps that are impacted at all three inundation levels. For other roadways there are numerous arterial, collector and local facilities that are inundated, specifically within the City of Wilmington (Figure 3). The commercial, residential, and office park development along the Wilmington Riverfront as well as the Port of Wilmington are at-risk to inundation at each of the three inundation levels. In terms of bridges, 281 facilities were included in the assessment. Based on the results, there are 90 facilities inundated at 0.5 meters, 112 facilities at 1.0 meters, and 128 facilities at 1.5 meters (cumulative). In terms of railway, centerline miles were used to analyze the vulnerable rail track. Based on a base mileage of 118.11 miles analyzed, 4.12 miles are inundated at 0.5 meters, 6.56 miles at 1.0 meters, and 9.15 miles at 1.5 meters (cumulative).
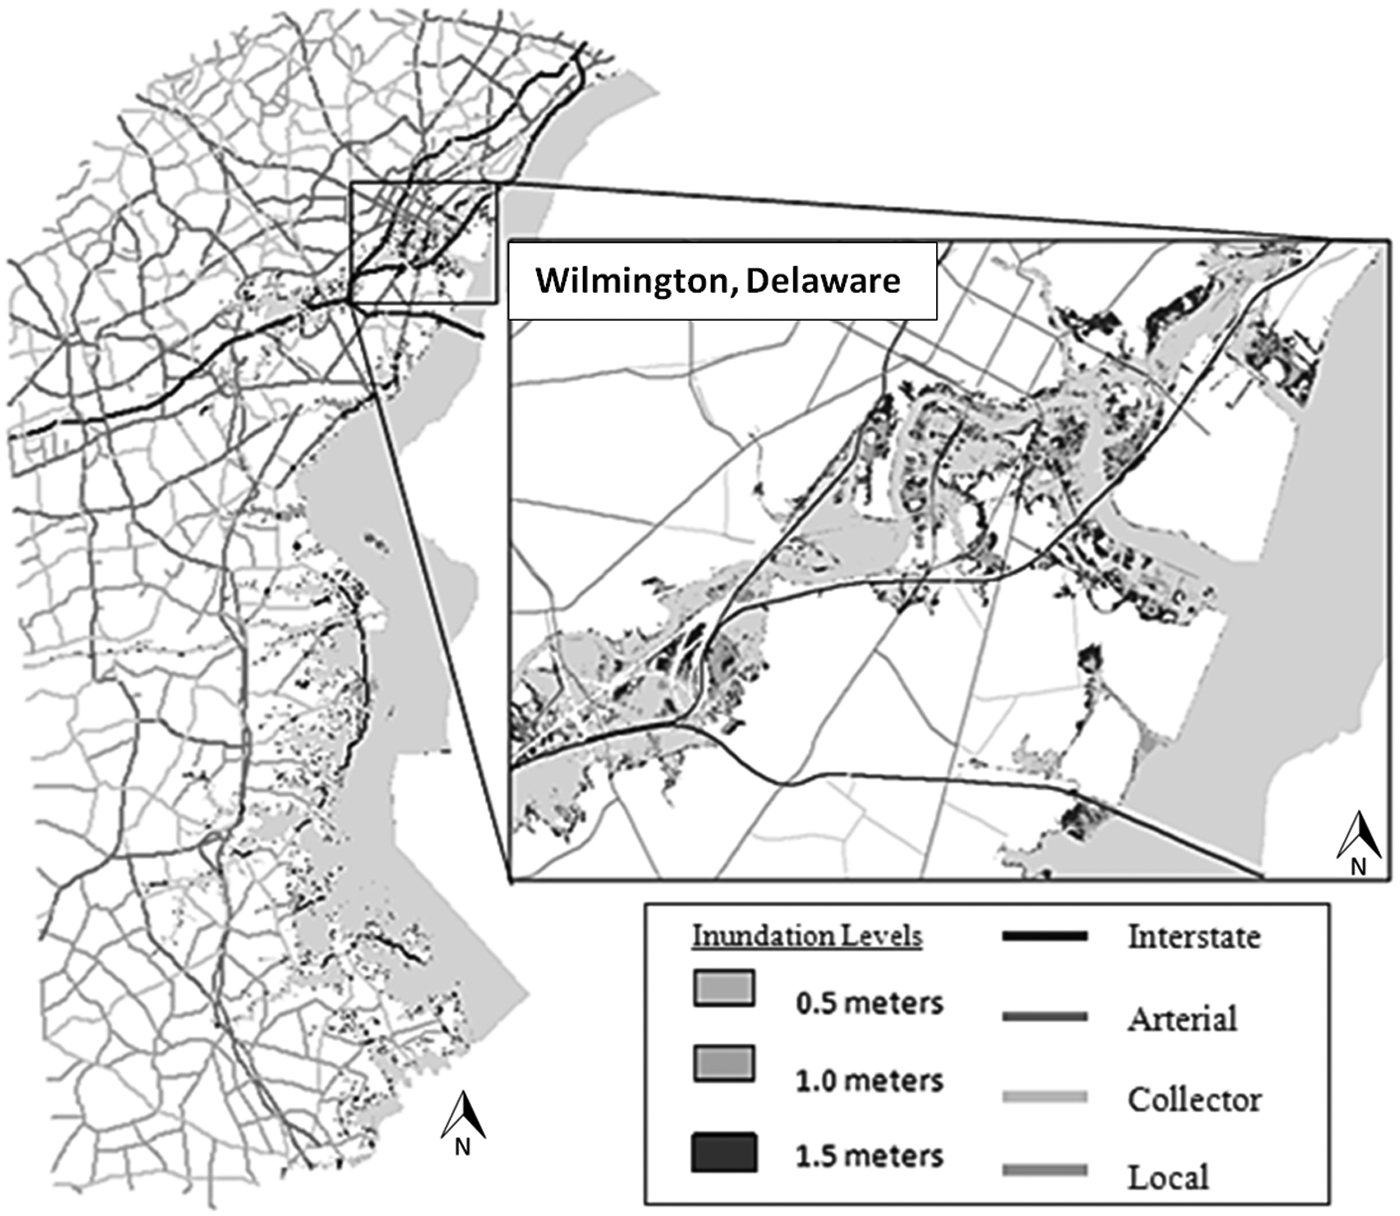
New Castle County Delaware sea level inundation analysis (source data from WILMAPCO et al., 2010).
As with most initial applications, limitations are recognized and assumptions are made throughout the case study. The case study was limited to a period of one month for data collection and analysis, and the case study area was focused on New Castle County, Delaware. The data collected during this period was applied and any information that was not gathered due to agency constraints was noted as a future data need. In terms of cost, the agency already was working on a sea level rise inundation analysis, and therefore, much of the data mining was already in process and few additional resources were required. One of the major challenges however, was collecting data from other agencies to fill the gaps due to missing data. It is recommended that over time the data collection process is streamlined across agencies. For example, one of the inputs WILMAPCO needed for step #5 was the breakdown of roadways by material type. Inputs such as these should be collected and shared throughout all agencies within the jurisdiction through a database rather than having each individual agency gather and synthesize the data year after year. Another example is the development of the sea level rise layers and determination of the inundation levels used for analysis. By having one agency develop the spatial layers and eventually integrate local storm surge effects into the model, agencies can share and implement this to evaluate their network and determine vulnerabilities that are consistent across the jurisdictions.
In general, the results of the case study analysis show that there is a significant need for evaluating opportunities for, and practicing adaptation within the WILMAPCO jurisdiction. Based on the sea level rise results, there are numerous highway and bridge facilities at-risk for inundation, even at a 0.5 meter rise. Therefore, beginning to implement the adaptation activities listed in the tool, as well as continuing to promote adaptation in support of mitigation, is essential for addressing vulnerabilities within this jurisdiction. WILMAPCO’s efforts in applying this tool and continuing a sea level rise vulnerability assessment suggests that this agency is progressive in addressing climate change issues, both related to mitigation and adaptation. Not only does this agency serve as an example for MPO’s but the results of this case study application also serve as a model for how to begin to address climate change adaptation from an MPO’s perspective.
Conclusion
The 12-step methodological process defined in this research can be applied in order to develop transportation adaptation tools similar to CCATT: Mid-Atlantic. Each of the steps can be applied universally to a variety of geographic locations, transportation agencies, as well as a variety of infrastructure types, not only land transportation. Therefore, it is recommended that agencies and/or research institutes follow the 12 steps to create adaptation tools for a diversity of applications. By using the tool on an annual basis, the agency can identify vulnerable infrastructure as well as opportunities for adaptation practices that can be incorporated into the long range transportation planning process, which includes evaluation and decision making.
The development of CCATT specifically for the Mid-Atlantic addresses the regional differences with regards to climate change impacts. The case study, applying CCATT: Mid-Atlantic to WILMAPCO, reflects the ability to apply the tool to a real world network. The results are useful at the local level; however, they also serve as an example for how the information from CCATT can lead to improved decision making across agencies.
Ideally, a tool such as CCATT: Mid-Atlantic would be developed for each region throughout the United States and would be expanded beyond land transportation to include maritime and aviation as well. As the tools are developed for specific locations and infrastructure types, they should be shared throughout the transportation planning community so that all agencies can benefit from the tools developed to prevent agencies from “recreating the wheel.” Lastly, as innovation and technology improves, the methodology and application of CCATT should be enhanced to further support transportation planning both in practice and in academia for years to come.
Footnotes
Declaration of Conflicting Interests
The authors declared no potential conflicts of interest with respect to the research, authorship, and/or publication of this article.
Funding
The authors disclosed receipt of the following financial support for the research, authorship, and/or publication of this article: This work was partially supported by the University of Delaware University Transportation Center under Grant Number DTRT06-G-0028 from the Research and Innovative Technology Administration of US Department and Transportation, and the Eisenhower Graduate Fellowship program. The authors acknowledge and appreciate the participation of the transportation practitioners at WILMAPCO who provided their valuable input to the case study.