
Abstract
The complete streets movement calls for streetscapes designed for safe and convenient walking, biking, and transit usage by all residents including children, the elderly, and the disabled. This study reviews state-level complete streets policies. Our research questions are: (1) In what ways do the states with a complete streets policy differ from the states without one? (2) Have complete streets policies become more comprehensive over time? (3) Does the type of policy—a law passed by a state legislature versus an executive-level policy—change the comprehensiveness of the policy? We find that urbanized states are more likely to have complete streets policies. Diffusion of the policy appears weakly associated with adjacency of adopting states. The type of policy was related to the comprehensiveness of early complete streets policies, but the differences diminish as these policies have gained traction in recent years. Over time, state-level complete streets policies have become more comprehensive in content.
Keywords
Introduction
For many decades, transportation planning has emphasized motorized vehicular traffic, an emphasis that has failed to meet the travel needs and preferences of large segments of the country’s urban population (Smith, Reed, & Baker, 2010). The complete streets movement deliberately expands the transportation paradigm beyond automobile dependence. It champions streetscapes designed for safe and convenient walking, biking, and transit usage by all residents including children, the elderly, and the disabled. Among its many supporters are urban planners seeking higher density urban living, advocates of walking and biking for health and fitness, and environmentalists concerned about fossil fuel emissions and climate change (Handy & McCann, 2011; McCann & Rynne, 2010; Smith et al., 2010). Complete streets, by emphasizing non-motorized options, may also increase mobility and access for low-income households and all others with limited access to automobiles (Handy & McCann, 2011).
The turn to complete streets is a major change in urban street design, as it fundamentally redefines what a street is intended to do, what goals a transportation agency is going to meet, and how the community will spend its transportation funds. Over the last decade, the state-level commitment to the design philosophy of complete streets has steadily grown. In fact, through 2014, 30 states have state-level policies that encourage adoption of a complete streets approach to transportation planning. The design elements of complete streets can vary based on context and project goals. But according to the National Complete Streets Coalition (NCSC), a complete street might include such pedestrian infrastructure as wide sidewalks, frequent and safe crossings (e.g., median islands, accessible pedestrian signals, curb extensions), bicycle lanes (or wide, paved shoulders) and bicycle parking, shared-use paths, traffic calming measures to lower automobile speeds and define the edges of automobile travel lanes, and public transit accommodations (e.g., accessible transit stops, bus shelters, dedicated bus lanes).
By introducing major transformation in street design and use, the turn to complete streets constitutes a critical shift in transportation policy. The complete streets approach forces a paradigmatic change not only in terms of project design and decision making but also in terms of policy and institutional change (LaPlante & McCann, 2008). The focus can no longer be on making decisions about individual roads or projects. Planning, design, and other decision processes must now routinely consider how a road or project incorporates the needs of all users and how the specific road or project integrates with the broader multi-modal transportation system.
The goal of this study is to better understand the diffusion and evolution of the approaches taken by the states to encourage complete street designs. Our research questions are threefold:
Complete streets is an innovative approach to street design. Research on the diffusion of innovative policies often finds that diffusion spreads geographically from state to adjacent state (Berry & Berry, 1994; Daley & Garand, 2005; Shipan & Volden, 2006). In a study of the spread of complete streets across communities, Moreland-Russell, Eyler, Barbero, Hipp, and Walsh (2013) found that diffusion spreads from one community to an adjacent community. In this study, we look at the spread of policies from state to state and over time to assess changes in the content of the policies. We connect diffusion to the changes in federal policy designed to encourage the adoption of complete streets and to indicators of urbanization including travel time to work, use of transit, and percentage of developed land.
In the next section, we briefly discuss federal influences on the complete streets movement and the implementation of complete streets policies. After describing the data and methods, we compare the states with complete streets policies with those without such policies on several dimensions. Then, we review the key components of complete streets policies and explore possible differences between statutory enactment and executive policies. We then discuss some of the ways in which complete streets policies have evolved over time. Finally, we conclude with a discussion of the need for future research on the linkages between complete streets policies and other urban development concerns or the performance of urban transportation systems.
Overview of the Federal Contribution to the Complete Streets Movement
Much of the interest in complete streets is fueled by federal policies providing increased funding and programmatic support for walking and cycling (Clarke, 2003; Cradock et al., 2009). Fields and Cradock (2014) organize federal policy related to the active approach to transportation into three eras: (a) the Interstate era with little emphasis on active transportation, (b) the Safe-T era that marked a turning point toward building more active transportation infrastructure, and (c) the emerging wave focused on sustainable and multi-modal transportation, including complete streets. The Safe-T era paved the path to complete streets, and in the current emerging era, complete streets has become more widely accepted as a component of transportation planning. The Safe-T era, beginning with the Intermodal Surface Transportation Efficiency Act (ISTEA) in 1991, includes subsequent federal transportation legislation: the Transportation Equity Act for the 21st Century (TEA-21) and the Safe, Accountable, Flexible, Efficient Transportation Equity Act: A Legacy for Users (SAFETEA-LU).
ISTEA included funding for pedestrian and bicycle infrastructure (Fields & Cradock, 2014; Handy & McCann, 2011; Weingroff, 2001; Yusuf & Mahar, 2014a). However, ISTEA was preceded by the U.S. Department of Transportation (USDOT) 1990 policy statement Moving America (Pucher & Buehler, 2006). ISTEA established a legal requirement that each state, with input from its metropolitan planning organizations (MPOs), produce a coordinated long-range transportation plan that considers walking and cycling needs (Clarke, 2003; Taylor & Schweitzer, 2005; Yusuf & Mahar, 2014a). ISTEA also required that every state DOT have a pedestrian/bicycling coordinator to facilitate non-motorized transport policies and planning. Subsequent legislations—TEA-21 and SAFETEA-LU—continued this and other related programs and increased the amounts of funding available for non-highway projects. TEA-21 even added several programs oriented toward safety, economic, environmental, and community needs (Yusuf & Mahar, 2014c). One example was the Transportation and Community and System Preservation Pilot Program developed in response to the smart growth movement, intended to support planning for environmentally friendly projects by emphasizing innovative strategies “that would improve the efficiency of the transportation system, minimize environmental impacts, and reduce the need for costly public infrastructure investment” (Yusuf & Mahar, 2014c, p. 1515).
TEA-21 introduced stronger safety programs for non-motorized users, and SAFETEA-LU continued the 10% funding set aside for transportation enhancement (TE) projects and included a new Highway Safety Improvement Program along with the Safe Routes to School program to encourage schoolchildren to walk or bicycle to school (Yusuf & Mahar, 2014b). The legislation also required each state to designate a full-time Safe Routes to School coordinator.
In short, the post-ISTEA era saw growth in federal emphasis on and funding for bicycle and pedestrian projects. By 1997, annual funding for bicycle and pedestrian projects increased to more than US$200 million (Pucher & Buehler, 2006), and by 2003, annual spending increased to more than US$400 million (Handy & McCann, 2011), compared with less than US$7 million prior to ISTEA. The most recent transportation authorization bill Moving Ahead for Progress in the 21st Century (MAP-21), passed in July 2012, incorporated several USDOT programs, including Surface Transportation Program (STP); Congestion Mitigation and Air Quality Improvement Program (CMAQ); TE; Transportation, Community and System Preservation (TCSP); Safe Routes to School; Recreational Trails; National Highway System; Highway Safety Improvement; High Priority Projects; and Equity Bonus (formerly Minimum Guarantee). These programs encourage use of many of the design features of complete streets.
Although there is no explicit overarching federal complete streets policy, there are several internal USDOT policies that support various elements of complete streets. For example, on March 15, 2010, USDOT issued an updated Policy Statement on Bicycle and Pedestrian Accommodation Regulations and Recommendation. This policy statement supports the inclusion of bicycle and pedestrians in federal-aid transportation projects; encourages community organizations, public transportation agencies, and state and local governments to adopt similar policies; and commits the agency to accommodating bicyclists and pedestrians (USDOT Policy Statement on Bicycle and Pedestrian Accommodation Regulations and Recommendation, http://www.fhwa.dot.gov/environment/bicycle_pedestrian/guidance/policy_accom.cfm). This policy statement also reemphasizes USDOT’s support for the development of fully integrated transportation networks and calls on transportation agencies and communities to go beyond minimum design standards and requirements. In addition, in the same year, USDOT issued a policy statement that transportation programs and facilities should accommodate a wide range of users, including non-drivers.
Complete streets design elements are also encouraged by the federal commitment to context sensitive solutions (CSS). CSS calls for public participation in design to ensure that roadways are appropriate for the local area (i.e., the context) in which a project is implemented. As defined by the Federal Highway Administration (FHWA) and the American Association of State Highway and Transportation Officials (AASHTO), CSS is a collaborative, interdisciplinary approach to highway location and design that involves all stakeholders in providing a transportation facility that fits its setting. CSS elements related to complete streets include early and frequent consultation and collaboration with stakeholders and the community during planning and design, and using communications tools, such as design visualization, that help citizens better understand project proposals; an emphasis on enhancing and retaining the sense of place or uniqueness of an area and its valued resources and features; consideration of multiple alternatives with the goal of building consensus on a final project; and minimization of disruptive impacts on the community.
In terms of specific complete streets legislation, federal bills were introduced in Congress as early as 2008 (HR 5951: Safe and Complete Streets Act of 2008; S 2686: Complete Streets Act of 2008), but all have failed to pass. The most recent variant of a complete streets bill was introduced in the House of Representatives in April 2015. The bill would require states and MPOs to incorporate, in all federally funded projects, complete streets principles to accommodate safety and convenience of all users.
Overall, the federal government is actively encouraging states and their cities to incorporate the design concepts associated with complete streets including a greater concern for the network of streets and the surrounding urban context. However, the federal government, while providing funding for the elements of complete streets, does not legislatively mandate complete streets.
Overview of the State-Level Contribution to Complete Streets
Beyond the federal government, states also play a role in encouraging and supporting complete streets. State-level policies are important because they have both direct and indirect effects on regional and local-level decisions (Handy & McCann, 2011, p. 28). There is general consensus that states, and their state DOTs, still largely control transportation funding decisions (Olson, 2000). Some research suggests there is state-level resistance to implementing complete street policies. Pucher and Buehler (2006) noted that “with a few exceptions, most state departments of transportation have only reluctantly cooperated with federal requirements and policy recommendations.” In their review of state planning for bicycle and pedestrian infrastructure, Wilkinson and Chauncey (2003) found that only 29 states had a specific plan element for bicyclists and pedestrians, and only 25 routinely accommodate bicycles in their highway projects. Yet, as of 2014, 30 states had explicit complete streets policies (NCSC, 2015).
We look at three factors likely to foster diffusion: spread from an adjacent state, adoption related to urbanization at the state level, and federal encouragement. Research on the diffusion of innovations finds a tendency for innovations to spread across state borders. But the willingness to embrace complete streets may be a function of a state’s urban development and other correlates of urbanization and infrastructure needs. Clearly, many of the design elements of complete streets are more appropriate in higher density urban locations. Thus, although federal encouragement applies to all states, the more urbanized may be more interested in complete streets as a design concept. In that case, urbanization would be more clearly associated with adoption than adjacency to a state with a policy. In the analysis, we will assess the history of adoption by adjacent states. We will then assess the role of urbanization by comparing states with and without complete streets policies along relevant dimensions such as commute times, use of public transportation, federal spending on roads and roadway conditions. We then shift our focus to analyzing only those states with complete streets policies. In doing so, we first compare the complete streets policy scores for states with legislative or statutory complete streets policies against states with executive-type complete streets policies. Finally, we compare complete streets policies according to their adoption dates and evolution of their content, organizing policies into three time periods (before 1999, 2000 to 2009, and 2010 and beyond).
Data and Method
At the state level, complete streets policies can take the form of statutes enacted by legislators or executive policies such as agency regulations or executive orders issued by governors. Statutes are the most prevalent, with 19 of the policies (in 16 states) taking this form. Some states have both a statute and an executive order.
Our data come from several sources. The NCSC has identified 10 ideal elements of a complete streets policy. The NCSC has also analyzed and scored the laws and executive orders in the states that have adopted a complete streets policy according to conformance with these 10 ideal policy elements (NCSC 2014, 2015). Table 1 lists and defines the elements along with the weight it receives according to the NCSC scoring. Each state complete streets policy was given a total weighted score, ranging from a low of 20.40 for South Carolina to a high of 84.80 for West Virginia (see Table 4).
NCSC 10 Ideal Elements in a Comprehensive Complete Streets Policy.
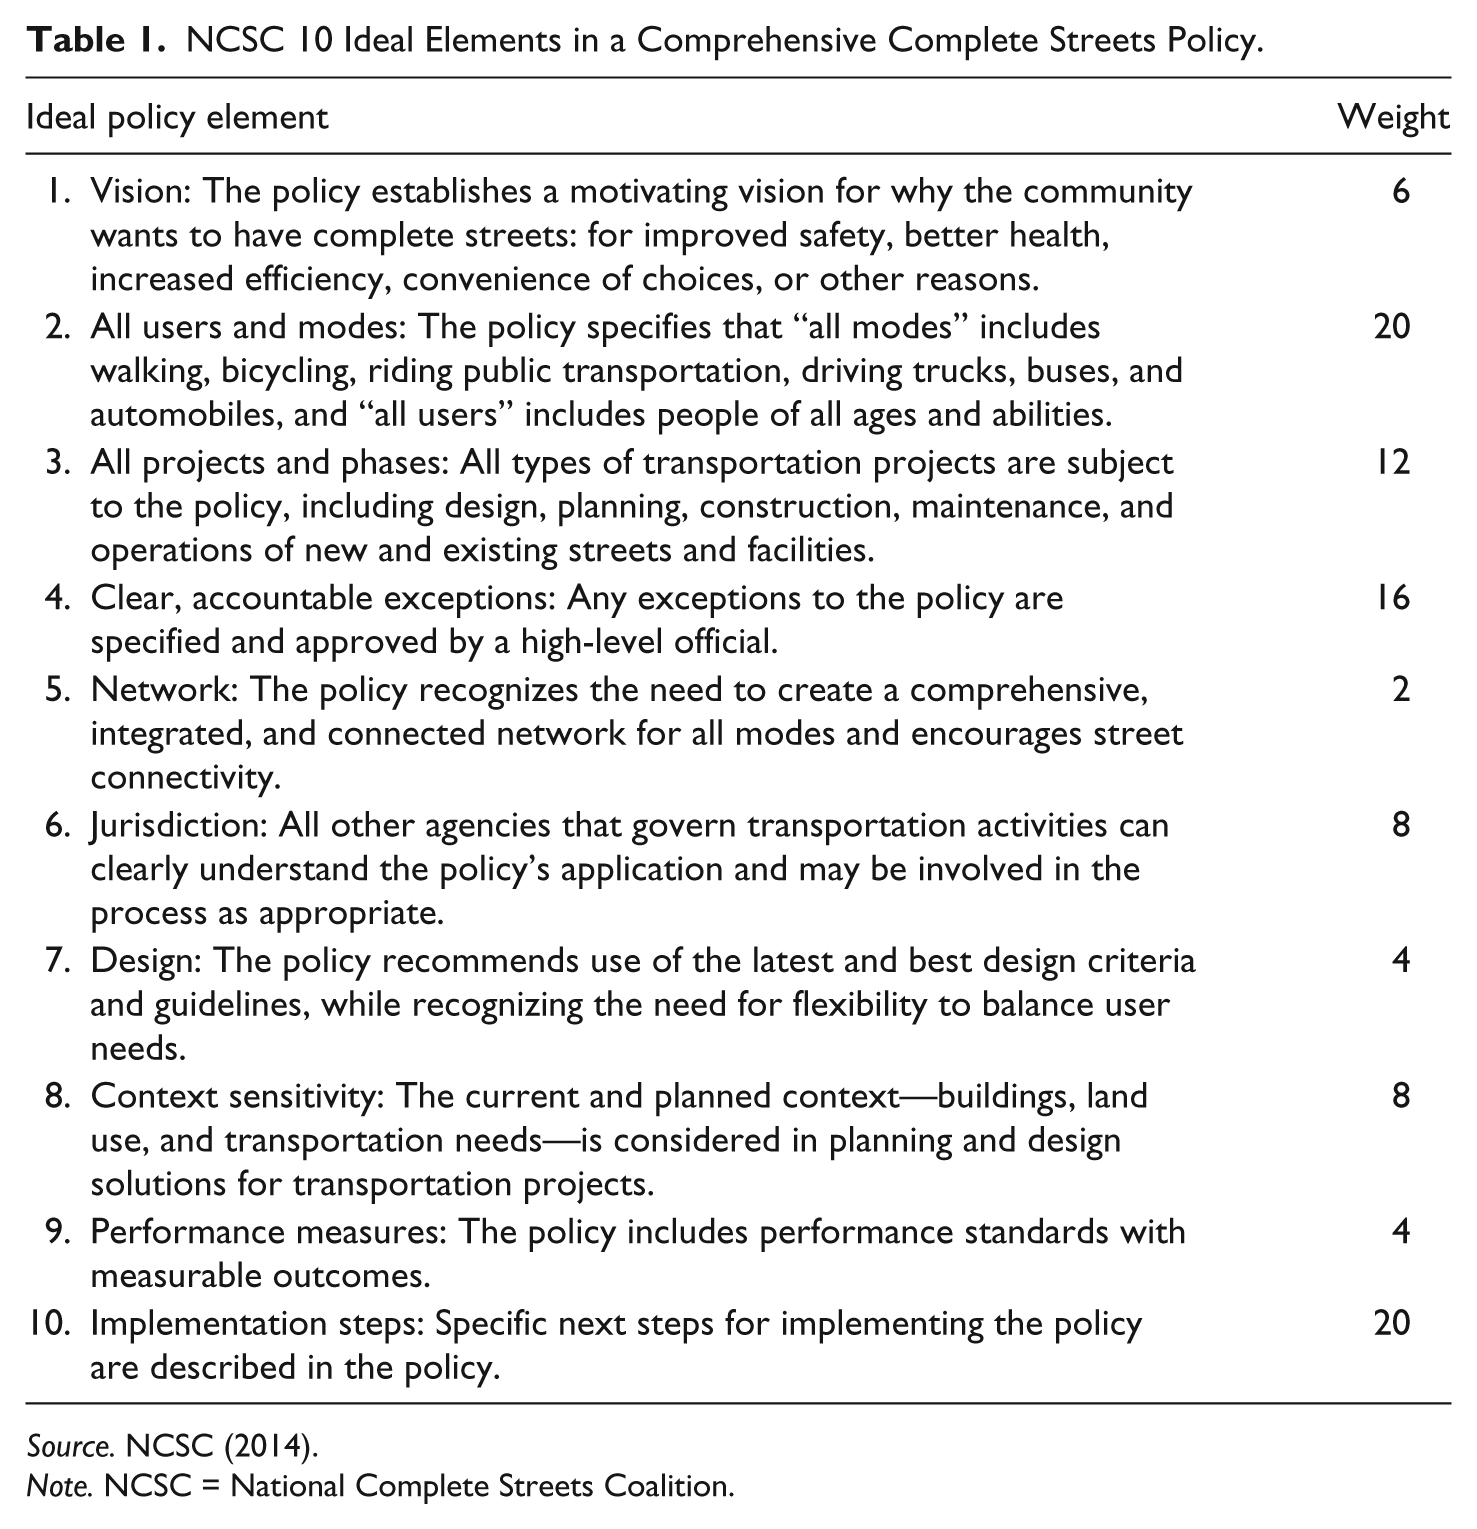
Source. NCSC (2014).
Note. NCSC = National Complete Streets Coalition.
We also obtained data from the USDOT, Census Bureau, and Department of Agriculture for other variables of interest, such as average travel time, commuter use of public transportation, developed land, number of licensed drivers, average state road condition, and the like. Table 2 provides variable descriptions and sources.
Variable Description and Source.
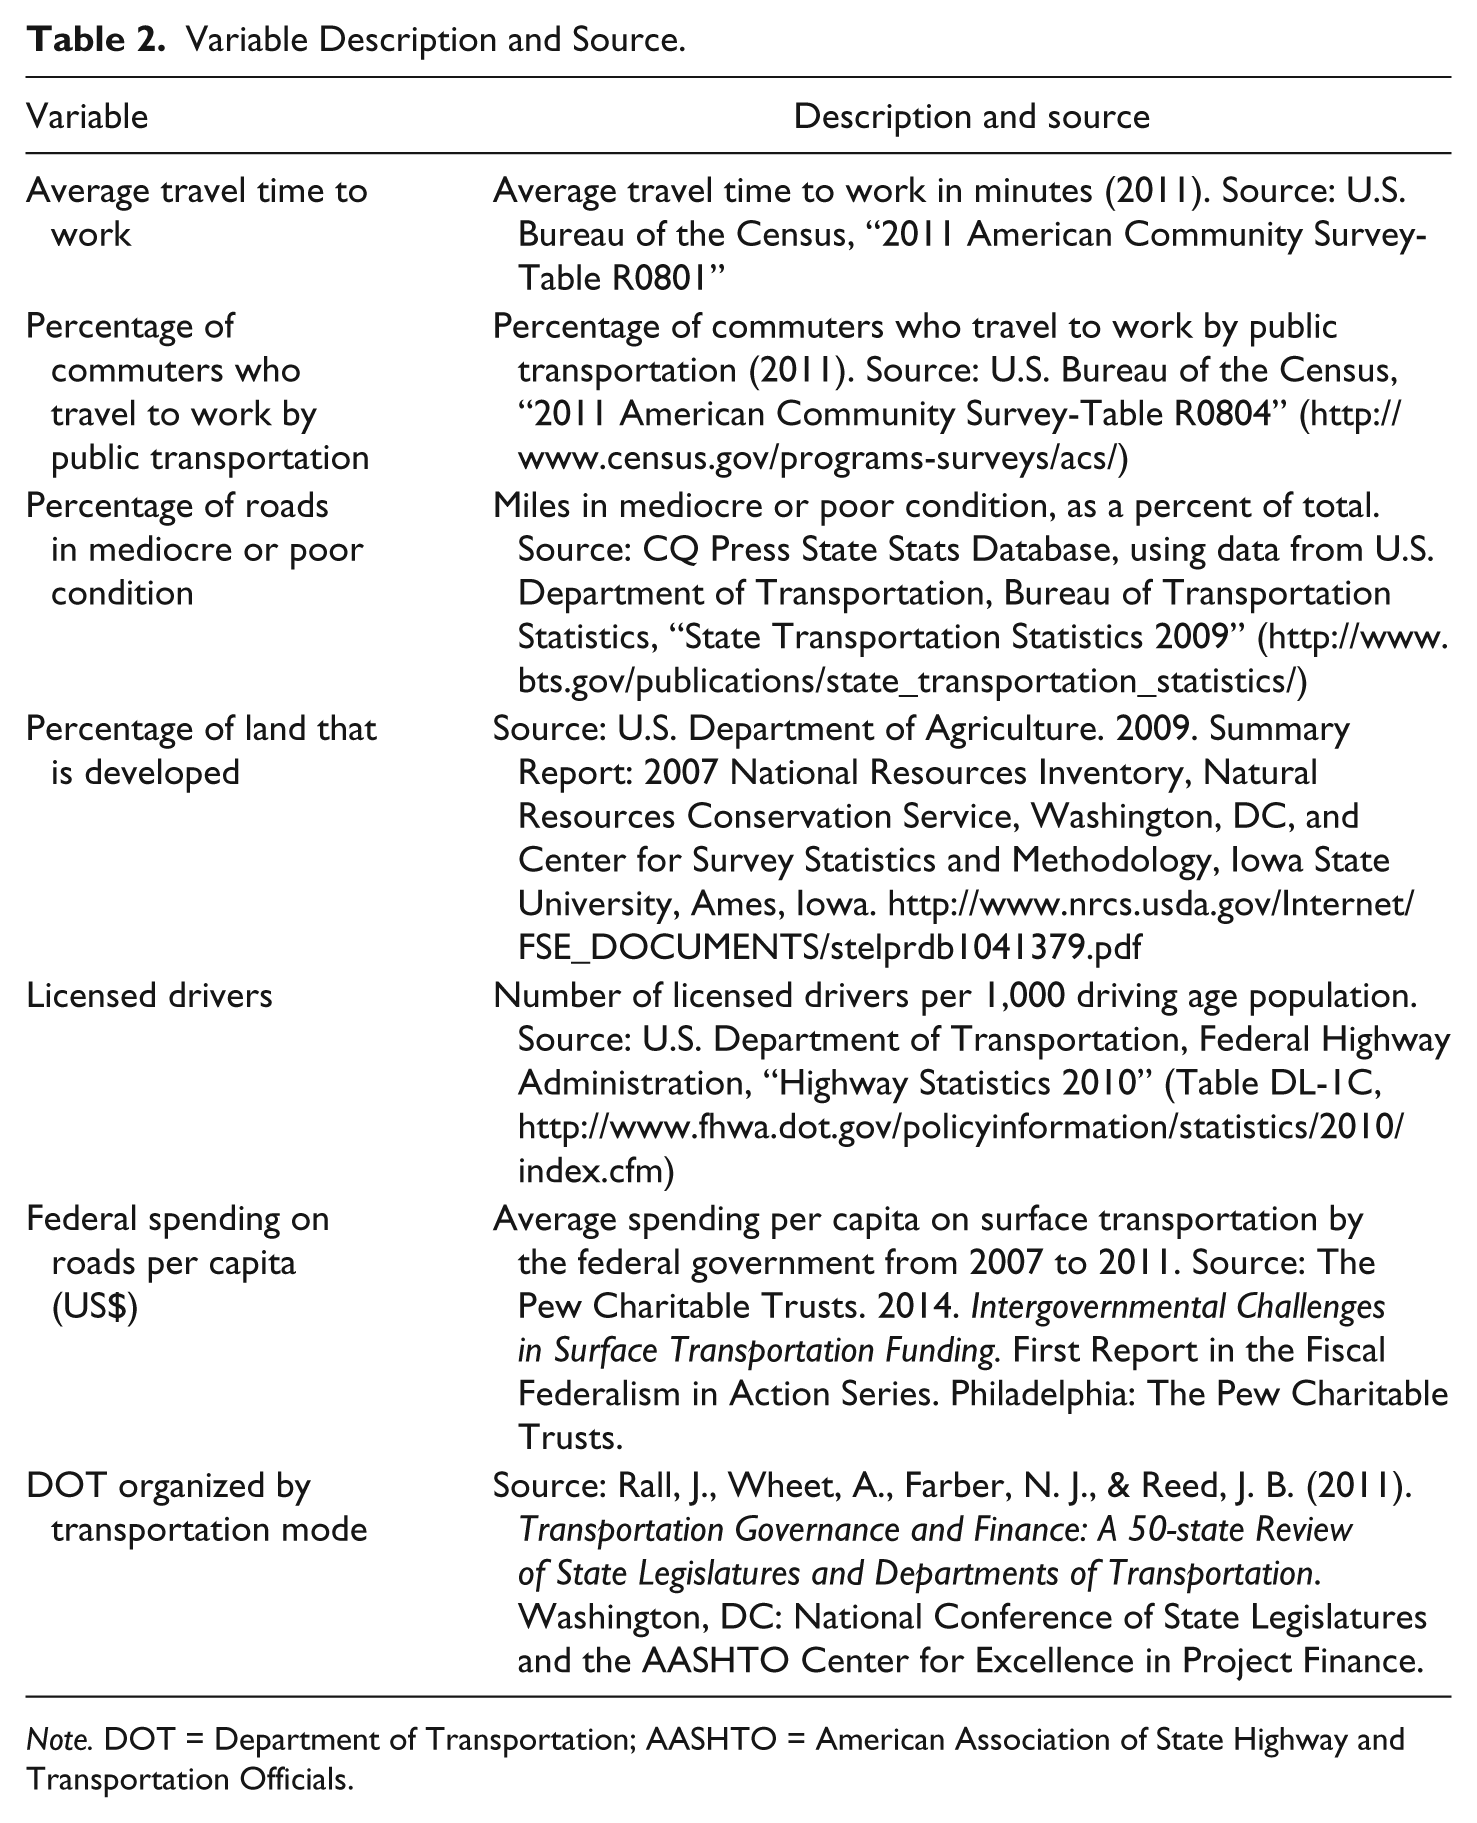
Note. DOT = Department of Transportation; AASHTO = American Association of State Highway and Transportation Officials.
To answer our three research questions, we first compare states with and without complete streets policies along relevant dimensions such as commute times, use of public transportation, federal spending on roads, and road conditions. We then shift our focus to analyzing only those states with complete streets policies. In doing so, we first compare the complete streets policy scores for states with legislative or statutory complete streets policies against states with executive-type complete streets policies. Finally, we compare complete streets policies according to their adoption dates, organizing policies into three time periods (before 1999, 2000-2009, and 2010 and beyond).
Results and Findings
States use two primary mechanisms for encouraging the adoption of complete streets policies: legislative statutes and executive policy (i.e., agency policy or executive orders from the Governor). Through 2014, 30 states have used one or more such laws or executive policies to enable adoption of complete streets approaches to designing and constructing transportation facilities. As shown in Figure 1, there are some geographic differences, with Midwestern, Southwestern, and Plains states less likely to adopt complete streets policies. In contrast, all east and west coast states, except New Hampshire, have adopted complete streets policies.
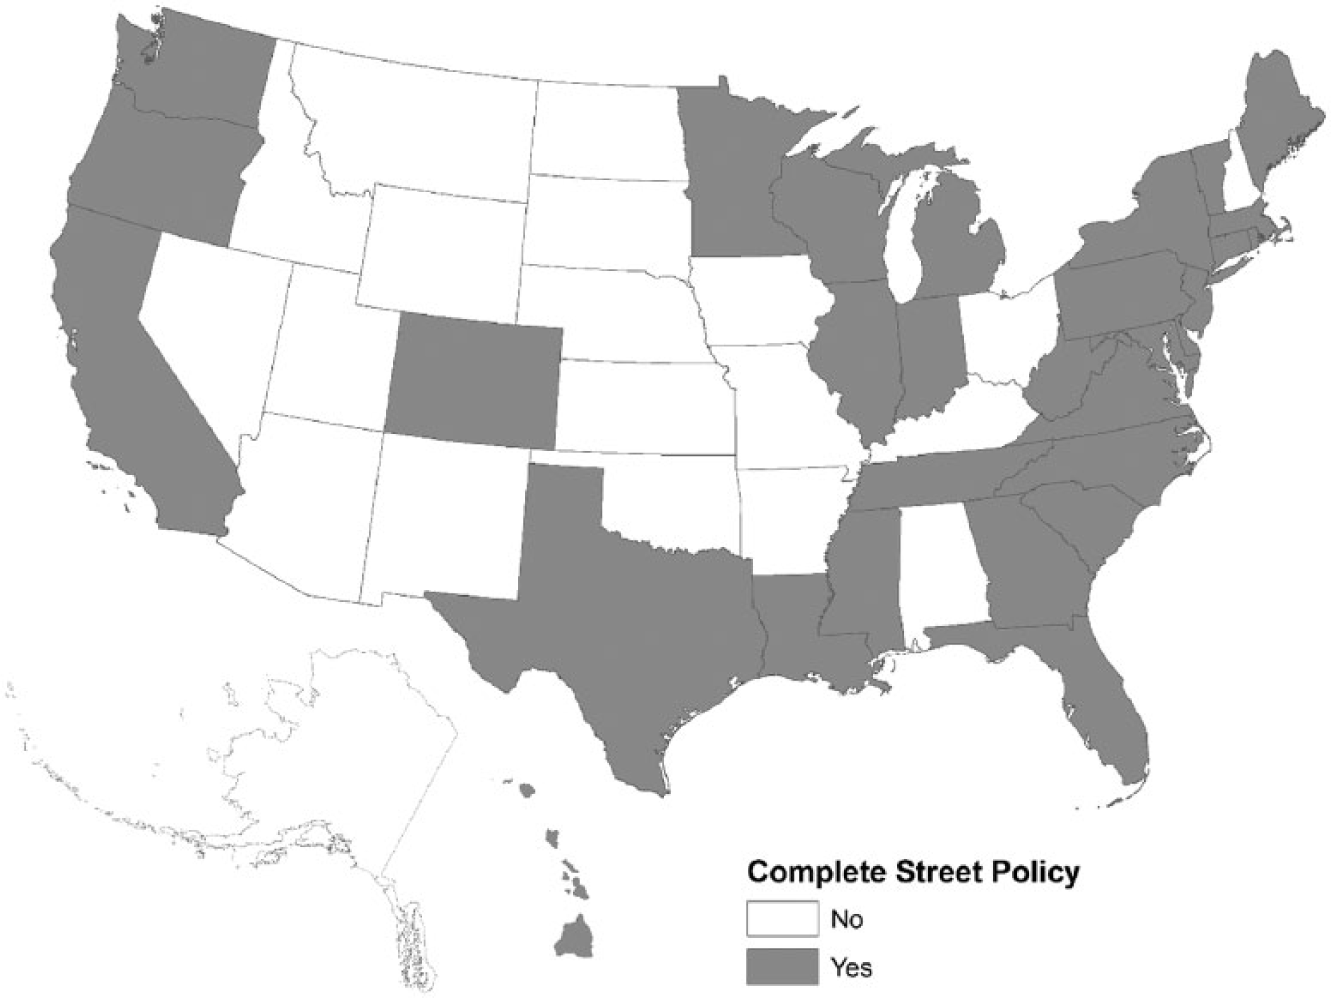
State complete streets policies—geographical analysis.
Figure 1 suggests some policy diffusion from state to state due to adjacency—a common mode of diffusion. However, as will be shown in Table 6, most policy adoptions occurred in the 2000s after the federal government began its support of complete streets. Adjacency, then, appears to have less impact than federal advocacy. For example, Oregon adopted complete streets in 1971, but California waited until 2008, and Washington did not adopt a complete streets policy until 2011. Massachusetts passed a law in 1996 and Rhode Island in 1997, but the other states adjacent to Massachusetts waited until 2008 (Vermont), 2009 (Connecticut), and 2011 (New York). Maryland adopted complete streets in 2000, but the adjacent states delayed adoption until 2004 (Virginia), 2007 (Pennsylvania), 2009 (Delaware), and 2013 (West Virginia). A block of Midwestern states adopted recently, which suggests some diffusion through adjacency: Illinois in 2007, Wisconsin in 2009, Minnesota and Michigan in 2010, but adjacent Indiana waited until 2014.
In What Ways Do the States With Complete Streets Policies Differ From the States Without Complete Streets Policies?
Table 3 provides a comparison of states with and without state-level complete streets policies on several key factors. The comparison suggests that complete streets policies are more likely to be present in the more urban states. For example, states that have adopted complete streets policies have longer average commute times, a greater percentage of commuters using public transportation, and more developed land. Interestingly, states with complete streets policies also receive less federal transportation funding per capita. Because the complete streets approach requires a more comprehensive or multi-modal approach to transportation planning, we expected to see differences in DOT organizational structure across states with and without complete streets policies. The results were in the expected direction but did not reach statistical significance. Fifty percent of states with complete streets policies were organized by mode (as opposed to being organized by function), while 35% of states without such policies were similarly organized. We also expected less commitment of resources to highway maintenance in the states with a policy. There was a small, but not statistically significant, difference in the percentage of roads in poor condition (19% compared with 15%).
Comparison of States With and Without Complete Streets Policies.
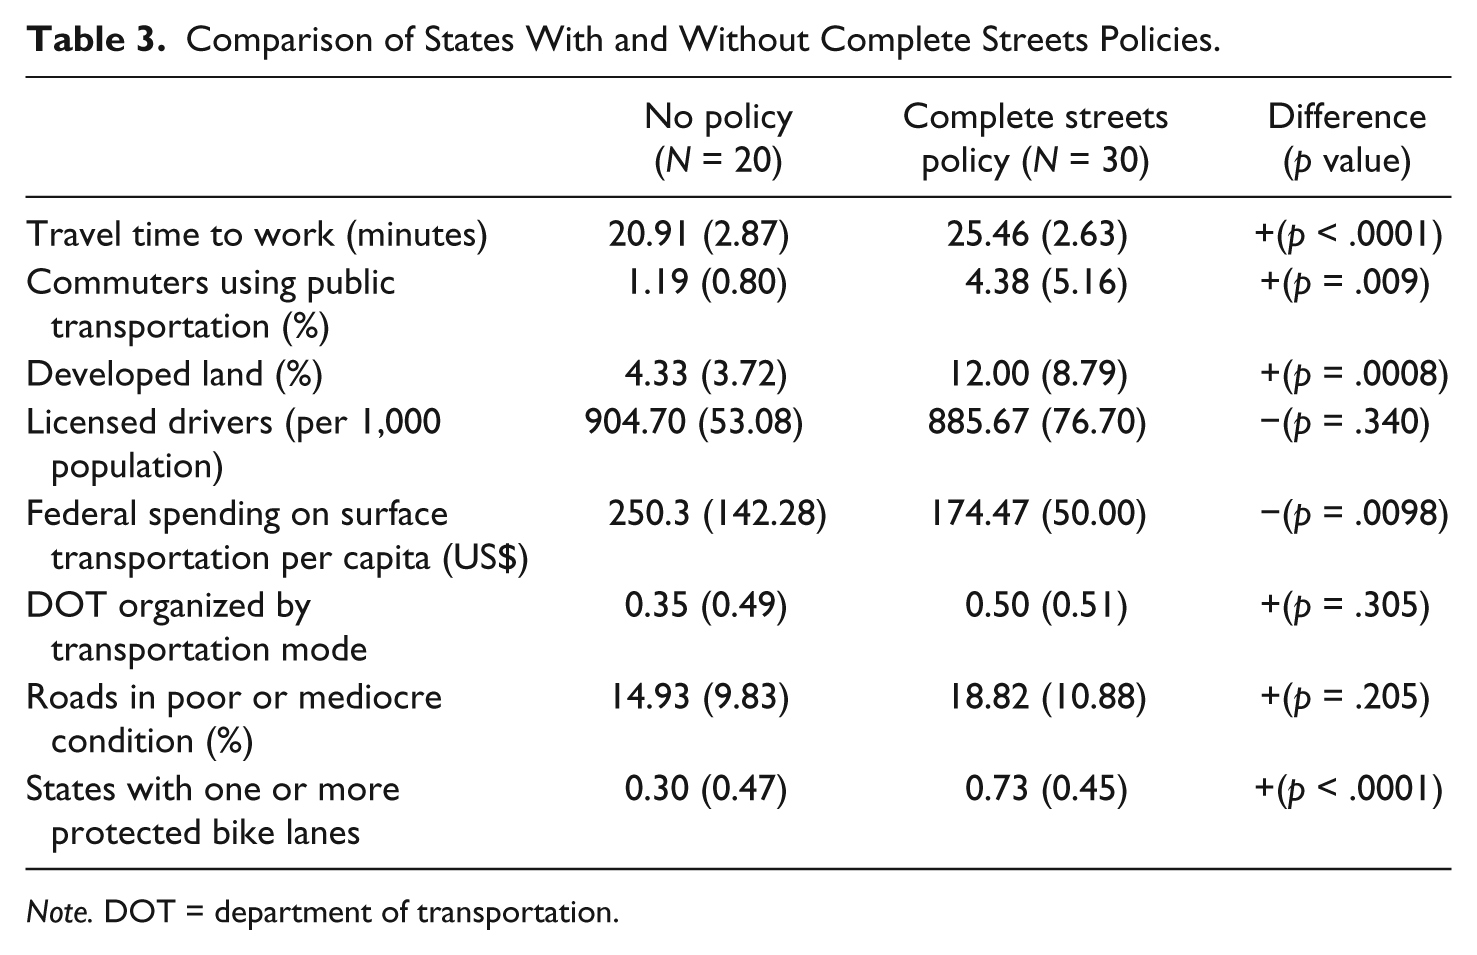
Note. DOT = department of transportation.
The extent to which the states with a policy actually adopt the design features of complete streets is an open question. But we have reason to think they are doing so. For example, protected bike lanes create barriers between bike riders and automobiles. They are far more expensive to build than painting bike lanes. States with a complete streets policy are significantly more likely than states without one to have built protected bike lanes (73% vs. 30%). According to an inventory of protected bike lanes by People for Bikes (http://www.peopleforbikes.org/green-lane-project/pages/inventory-of-protected-bike-lanes), states with complete streets policies have built 196 protected bike lanes, while the states without one have built only 11.
Have Complete Streets Policies Become More Comprehensive in Content Over Time?
The NCSC (2011, 2014, 2015) has identified 10 elements that contribute to an ideal complete streets policy (see Table 1 for the 10 elements, their definitions, and their respective weights). The comprehensiveness of a state’s complete streets policy or policies can be assessed according to the presence and strength of these elements as weighted by the NCSC.
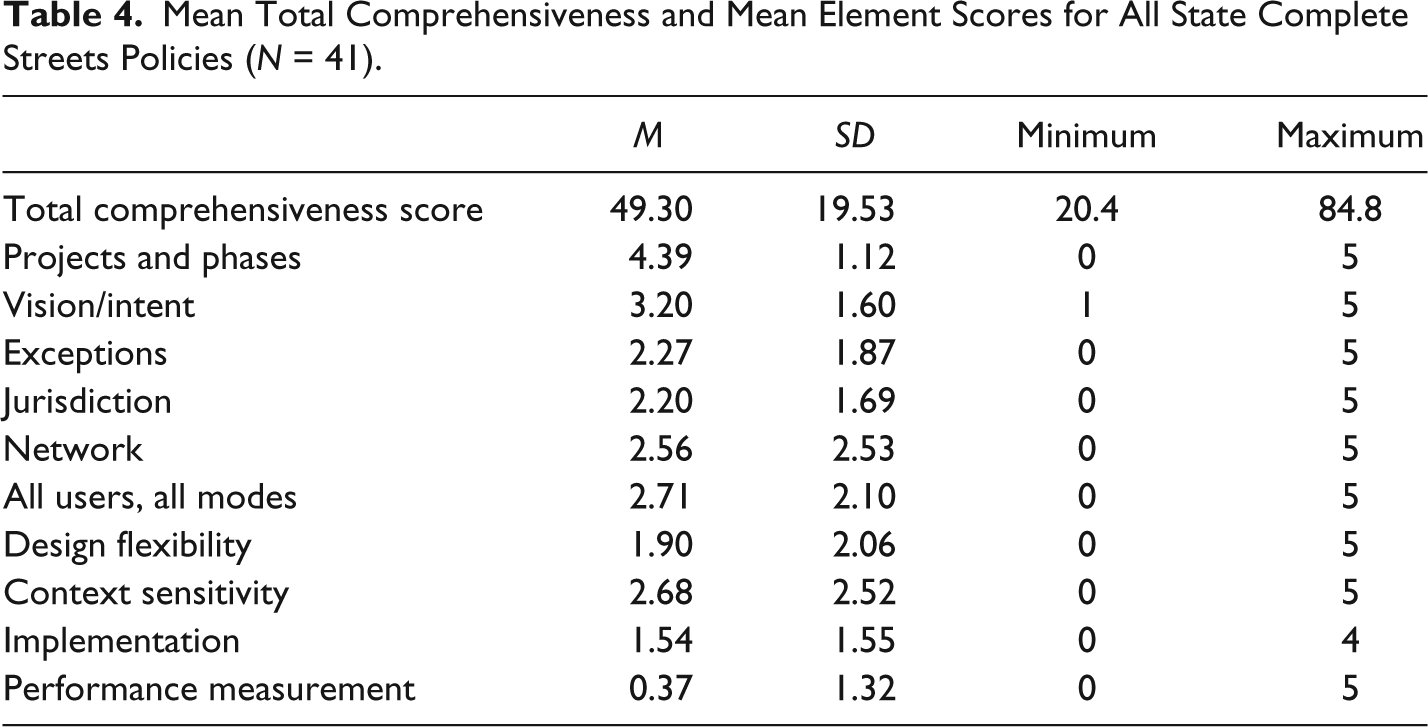
Table 4 presents summary statistics for all 41 state-level complete streets policies (across the 30 states that have adopted such policies). Note that some states have multiple complete streets policies. These scores are up-to-date as of 2014 and come from the NCSC (2015). As shown in this table, there is substantial variation across the state policies, with total scores ranging from a low of 20.4 to a high of 84.8. Some of the ideal policy elements are more likely to be in a state’s complete streets policy than others. For example, most state-level policies specifically apply to all projects and project phases and describe the policy vision or intent.
Mean Total Comprehensiveness and Mean Element Scores for All State Complete Streets Policies (N = 41).
As shown in Table 5, complete streets policies at the state level have grown substantially more comprehensive over time. The mean total comprehensiveness score has grown from 27.5 in the earliest period (1970-1999) to 48.5 between 2000 and 2009, and 53.8 in the most recent period (2010-2014).
Comprehensiveness and Policy Elements Over Time.
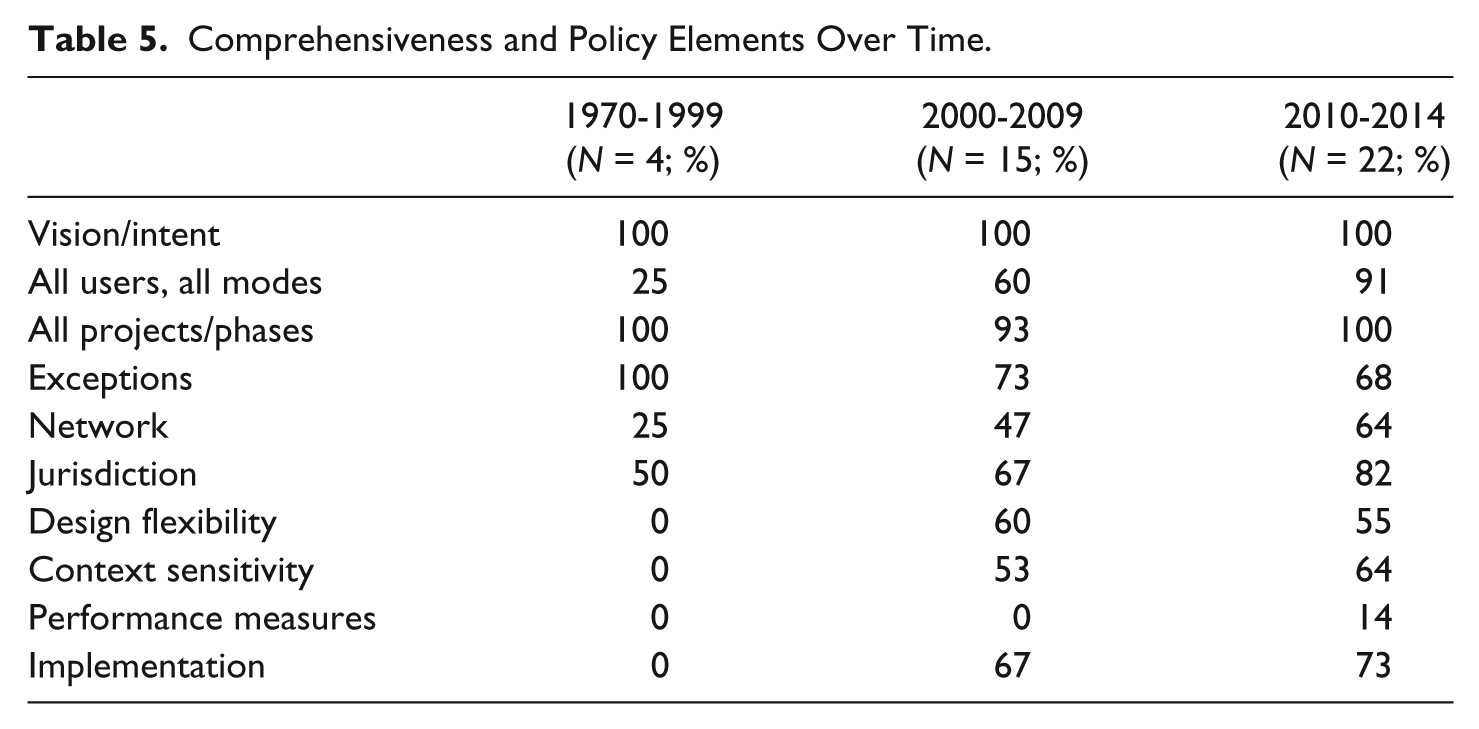
Table 5 also summarizes the trends in the adoption of the 10 ideal complete streets policy elements. While strong on projects and phases, vision/intent, and exceptions, the early complete streets policies did not at all address design flexibility, context sensitivity, performance measures, or implementation. The second phase of state policies, implemented between 2000 and 2009, saw more comprehensive complete street policies that addressed more of the ideal policy elements identified by the NCSC. However, performance measures were absent from all state-level policies. The most recent wave of complete streets policies (since 2010) are the most comprehensive, and some state-level policies have included performance measures, which were mostly absent in previous policies. Some of these more recent policies incorporated all 10 ideal elements.
Does the Type of Policy Change the Comprehensiveness of the Policy?
While the earliest state-level policy dates back to 1971, most complete streets policies are a recent phenomenon (see Figure 2). Furthermore, as shown in Figure 2, the early complete streets policies took the form of statutory law. Over time, more complete streets policies were introduced as executive policies, sometimes to supplement a previous complete streets statute. In general, executive policies have been more comprehensive than legislative statutes. However, over time, the differences in policy comprehensiveness across the two types of policy have diminished. Between 2000 and 2009, the average policy comprehensive score was 39.5 for legislative statutes and 56.4 for executive policy. This difference in score of 16.9 is statistically significant at p < .05. However, from 2010 onward, legislative statutes had an average policy comprehensiveness score of 48.8 compared with 57.3 for executive policies. This difference (8.5 points) is not statistically significant.
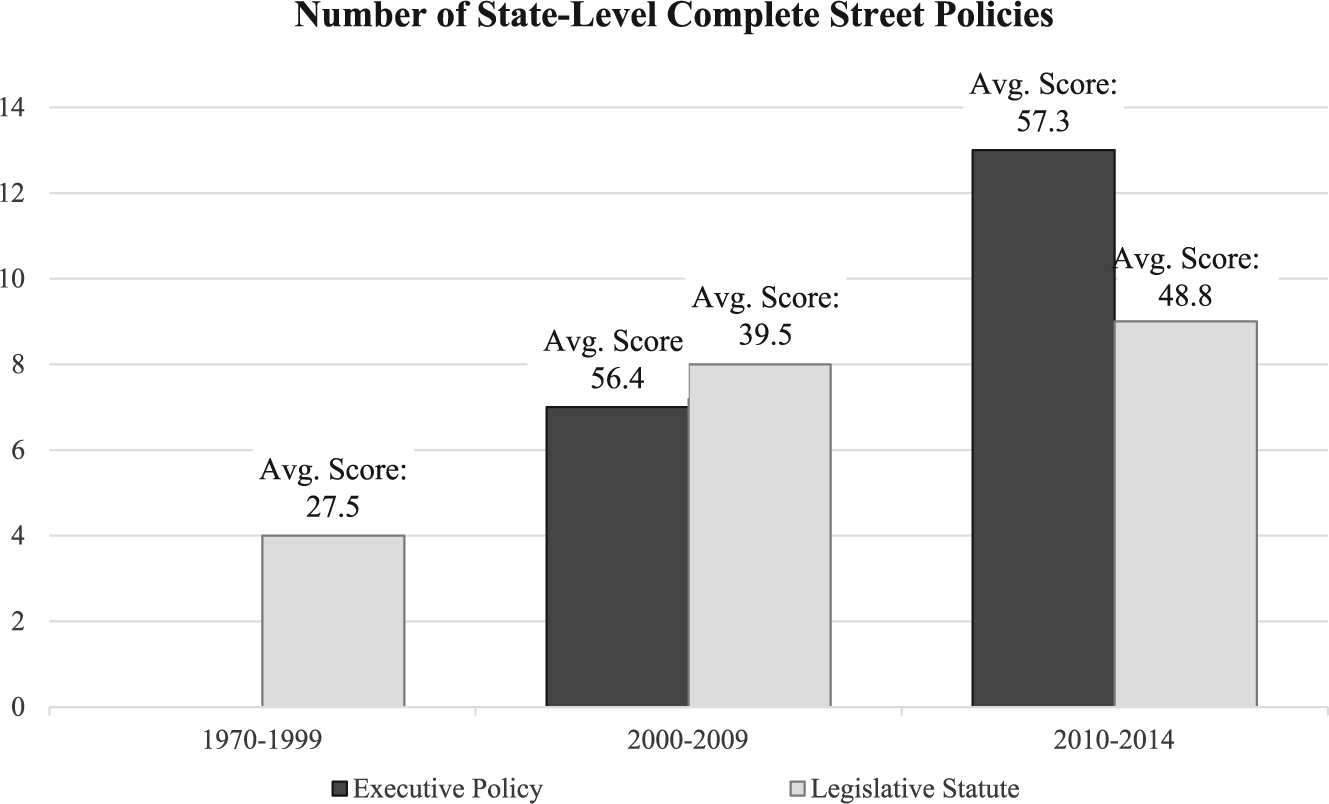
Number and comprehensiveness (average policy score) of state-level complete streets policies over time (by policy type).
Table 6 summarizes the complete streets policies for the 30 states. It shows the types of policy, policy adoption dates, policy scores, and changes in policy scores over time. Three states (Maryland, Rhode Island, and Vermont) have updated their initial complete streets statutes with more comprehensive statutes. Seven states (including Maryland) have further supplemented their initial complete streets laws with executive-type complete streets policies, which has increased the overall comprehensiveness of their commitment to complete streets. California simultaneously, in the same year, adopted legislative and executive policies for complete streets. In regard to the diffusion of complete streets as a policy innovation, it appears that it has occurred in multiple ways: with an executive policy (13 states), with a statute followed by an executive policy (eight states), with one statute (seven states), or with multiple statutes (two states).
Complete Streets Policies by State: Policy Type, Adoption Year, Comprehensiveness Score, and Changes in Score.
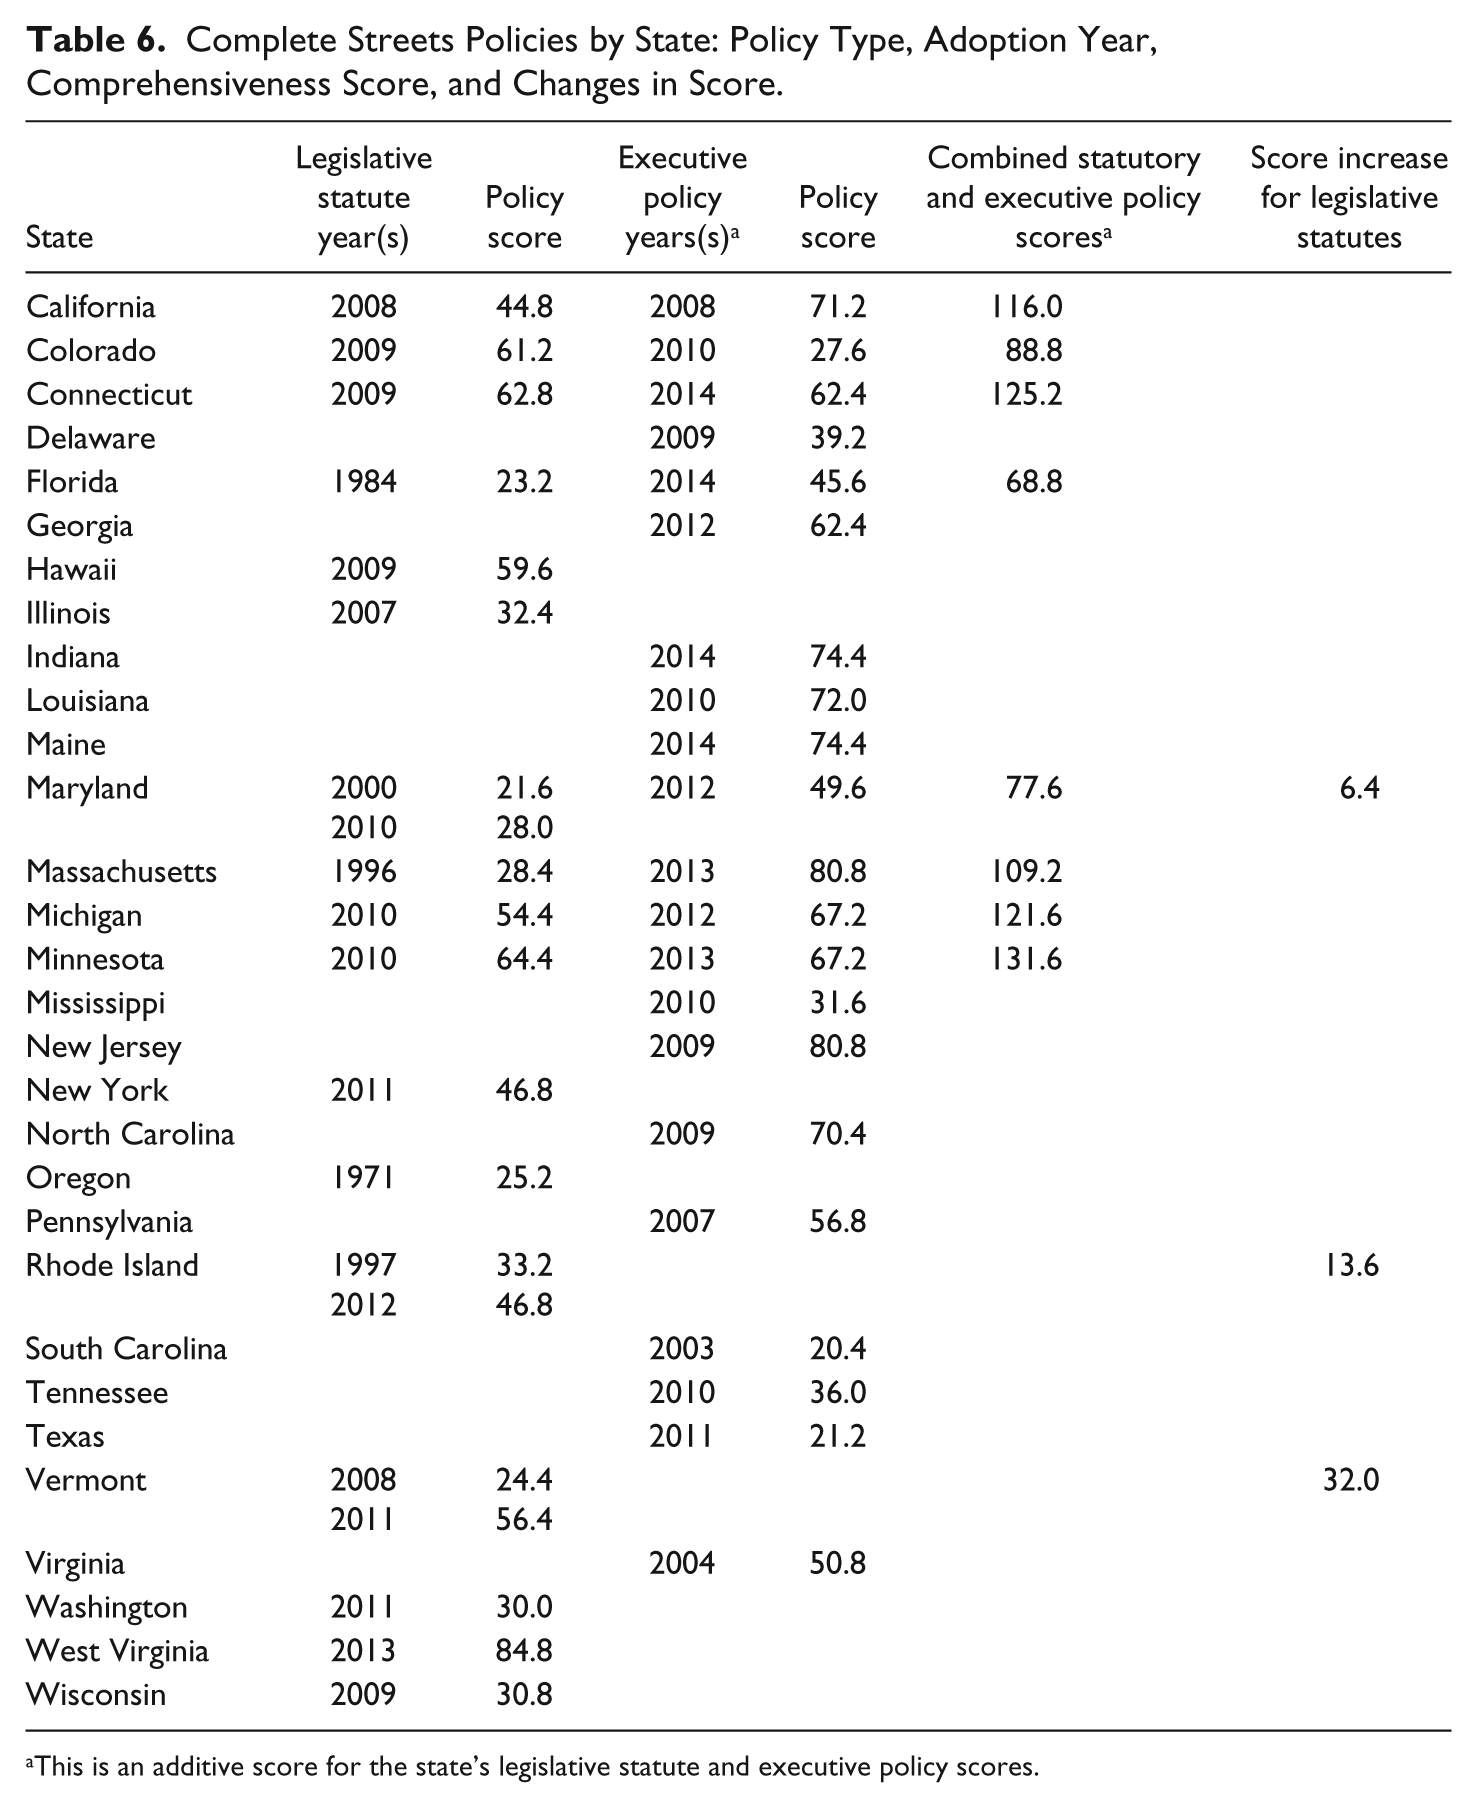
This is an additive score for the state’s legislative statute and executive policy scores.
Summary and Conclusion
Our examination of complete streets policies shows that more than half of the American states have a state-level policy to encourage adoption of complete streets. States have relied on two different approaches to adopting complete streets policies—a law passed by a state legislature or an executive-level policy such as a DOT regulation or an executive order issued by a governor. Both have become more comprehensive in content over time, which would indicate growing commitment to the concept of complete streets.
Ten states have supplemented their first complete streets laws and executive orders with additional laws or orders, which has increased the overall comprehensiveness of their commitment. Maryland, for example, adopted complete streets policies on three occasions. In 2000, their policy had a total comprehensiveness score of 21.6. That legislation was subsequently updated in 2010 and supplemented with an executive policy in 2012, increasing the total comprehensiveness score to 77.6. The current policy specifies coverage of all users and modes, with a greater emphasis on performance measures, jurisdictions, and exceptions.
Over time, states also seem to be paying more attention to actual implementation of the policies. More recent state-level complete streets policies have emphasized performance measurement and implementation steps—with stronger executive-level policy guidance (via agency policies such as handbooks, design guidelines, etc.) supplementing a statutory commitment to complete streets.
The diffusion of complete streets policies appears only weakly associated with geographic adjacency. This implies a second spur to its diffusion: the funding incentives in recent Federal transportation bills that call for more walking and biking. We find a third factor at work, the states with complete streets policies are more urbanized and developed than their counterparts that have yet to adopt complete streets policies. This finding is at odds with Moreland-Russell et al. (2013) and is probably due to the unit of analysis. Our study measured urbanization at the state level, while their study used city size. The more urban states are also more likely to build protected bike lanes. This suggests that they view complete streets as a viable approach to accompany efforts to address such urban issues as infill redevelopment, congestion, and transit. This connection between complete streets and other concerns should be explored in more depth in future research.
The shift to complete streets may pull resources away from the traditional state responsibility for roads and highways. Federal spending on roads per capita was significantly lower in the states with complete streets policies and a greater percentage of their roads were in poor or mediocre condition. However, the difference in the latter did not reach statistical significance. Future research can address this issue and examine how complete streets policy (both policy presence and comprehensiveness of content) may be related to transportation performance issues such as pedestrian or bicycle fatalities, investment in public transit, and vehicle miles traveled.
Footnotes
Declaration of Conflicting Interests
The author(s) declared no potential conflicts of interest with respect to the research, authorship, and/or publication of this article.
Funding
The author(s) received no financial support for the research, authorship, and/or publication of this article.