
Abstract
This study examines the influence of economic, political, and demand factors on the adoption of public–private partnerships (PPPs) from 2000 to 2016. State debt, urban travel demand, and state laws allowing unsolicited PPP proposals have a significant effect on PPP adoption. Counter to previous studies that suggest conservative state governments adopt PPPs at a greater rate than liberal governments, we find that the influence of political ideology on PPP adoption is contingent upon state legislative professionalism. For states with high legislative professionalism, a change in state government ideology in the liberal direction decreases the likelihood of PPP adoption. For states with low legislative professionalism, a change in state government ideology in the liberal direction increases the likelihood of PPP adoption. The results inform the study of politics of privatization by demonstrating how ideological preferences can be shaped by the legislative capacities of state governments.
Keywords
Despite the increase in government adoptions of public–private partnerships (PPPs) for improving public service delivery (Malatesta & Carboni, 2015; Riccio, 2014), 1 questions remain as to the motives of government in initiating and promoting the role of for-profit entities in the work of public administration (Andrews & Entwistle, 2015; Girth, 2014; Hodge & Coghill, 2007). This article investigates the factors associated with the decision to increase private sector participation in PPPs for infrastructure delivery—collaborative contracts where responsibilities that are typically divided up among separate contractors (or between a governmental and a private sector entity) are bundled into a single delivery mechanism. 2 PPPs dramatically transform public sector approaches to infrastructure delivery by involving the private sector in multiple components of project development, which can include the design, construction, financing, or operations of multi-million-dollar infrastructure facilities (Andrews & Entwistle, 2015; Boyer, Van Slyke, & Rogers, 2016; Hellowell, Vecchi, & Caselli, 2015; Reeves, Palcic, & Flannery, 2015).
The legacy of the New Public Management movement (Hood, 1991; Osborne & Gaebler, 1993) and related attempts to leverage market-based mechanisms for reforming government administration (Delmon, 2011; Grimsey & Lewis, 2007; Savas, 2000) have raised questions about the reasoning of outsourcing to private providers (Behn, 1998; Box, Marshall, Reed, & Reed, 2001; Hodge & Greve, 2017; Sclar, 2000) including questions of the economic, political, and demand-related drivers of PPPs. These questions gain traction in an era where state and local government managers face the dual pressures of underfunded infrastructure (ASCE, 2017), and declines in federal, state, and local funding for infrastructure investment (Cawley, 2013; DeCorla-Souza, Lee, Timothy, & Mayer, 2013; Engel, Fischer, & Galetovic, 2014). Much of the justification for the increased use of PPPs in the United States and abroad is the idea that tapping into private investment can allow public managers to do more with less, and to leverage industry innovations along the way (DeCorla-Souza et al., 2013; Garvin, 2010; Garvin & Bosso, 2008; Little, 2011; Resor & Tuszynski, 2012; Wang & Zhao, 2014).
Prior literature reveals tensions in understanding the influence of economic, political, and demand-driven factors in the adoption of various forms of privatization, highlighting a need for research on the influence of these factors on PPP adoption. This study addresses this research need by analyzing a comprehensive dataset on PPP adoption in the U.S. transportation sector, and revealing how financial, ideological, governance, and travel demand issues influence the development of infrastructure through PPPs. The research question guiding this study is as follows:
PPPs and Privatization
The World Bank defines PPPs as “a long-term contract between a private party and a government entity, for providing a public asset or service, in which the private party bears significant risk and management responsibility, and remuneration is linked to performance” (The World Bank Group, 2014, p. 14). This definition is sometimes referred to as “P3” in the North American context (Boardman, Poschmann, & Vining, 2005; Federal Highway Administration [FHWA], 2017; National Conference of State Legislatures, 2017; Vining & Boardman, 2008) and captures a host of public–private project configurations where technical and financial risks are transferred from public to private partners in ways not typically distributed in infrastructure development (FHWA, 2015).
In standard approaches to developing transportation infrastructure, the private sector assumes responsibility for only construction of an asset (in a configuration termed Design-Bid-Build) and the public sector designs the facility and operates and maintains it once construction is completed (Chasey, Maddex, & Bansal, 2012). In an effort to capture market innovations and to encourage private commitment to project quality, the private sector assumes greater responsibility and risk in PPPs. Private roles in PPPs can include construction and design (Design-Build) at the low end of the spectrum, or construction, design, finance, operations, and maintenance at the high-end (Design-Build-Finance-Operate-Maintain). While not the primary focus of this article, explanations of the particular financial and technical risks that are transferred in each of the variations of PPP is explained by other sources (Demirag, Khadaroo, Stapleton, & Stevenson, 2012; FHWA, 2012; Ni, 2012; Siemiatycki & Farooqi, 2012).
The use of PPPs reflects a wider trend toward contracting models that increase risk sharing between public and private sectors, involving incomplete contract specifications and public–private collaboration (Bertelli & Smith, 2009; Brown, Potoski, & Van Slyke, 2011; Ponomariov & Kingsley, 2011). The open-ended nature of contractual terms creates challenges for “governing” PPPs (F. S. Berry, 2012; Bevir, 2012; Carboni & Milward, 2012; Donahue & Zeckhauser, 2011; Milward & Provan, 2000; Morse, 2011; Poocharoen & Ting, 2015), which can make them a less straightforward decision for adoption. There are also many transaction costs associated with developing and implementing PPPs that require public sector capacity in long-term contract management (Brown & Potoski, 2003).
One question is the extent that the adoptions of PPPs are driven by the political ideology of elected leaders. Some research indicates that conservative political orientations are more supportive of privatization (Bel & Fageda, 2008; Lopez de Silanes, Shleifer, & Vishny, 1997) while other studies indicate that political ideology has little influence at all (Durant & Legge, 2002; Zullo, 2006, 2009). Most of this prior research has focused on contracting for specific, isolated services, such as motor vehicle maintenance or facilities maintenance (Bennett & Dilorenzo, 1983; Warner & Hefetz, 2012), the full sale of public services to a private provider (Battaglio, 2009; Battaglio & Legge, 2009; Bel & Fageda, 2008), or the introduction of fee-based tolls on U.S. roadways (Wang & Zhao, 2014). Research is lacking, however, on the ways that political factors influence more complex public–private collaborations, such as PPPs.
A second-related question is how prepared state legislatures are to develop and oversee PPPs. There has been a wealth of research on the human resource capacity required of effective contract management (Van Slyke, 2003)—particularly when contracting for complex products like infrastructure services, which assign multiple roles to private partners and delegate significant discretion to achieve market efficiencies (Boyer, 2016; Boyer et al., 2016; Brown, Potoski, & Van Slyke, 2015). Yet, state legislatures play a central role in specifying responsibilities for private partners through their policy making (Geddes & Wagner, 2013; Israte & Puentes, 2011; Pula, 2016), as well as through their oversight of the agencies that serve as public partners in PPPs (McCubbins & Schwartz, 1984). The amount of financial, staffing, and institutional support provided to state legislators can be considered in respect to legislative professionalism (Bowen & Greene, 2014; Dilger, Krause, & Moffett, 1995; King, 2000; Maestas, 2000; Miller, Ringsmuth, & Little, 2015; Mooney, 1995; Squire, 2007).
Of particular interest to the study of state-level adoption of PPPs is the variation of these capacities in state legislatures across the United States. Some states, such as California, offer annual salaries for legislators of up to US$95,000 and up to 17 support staff members per member, and their legislative sessions last up to 9 months per year (Miller et al., 2015). On the low end of the spectrum, states like South Dakota offer annual salaries of only US$6,000 per legislator and only one full-time employee for support staff on average; their legislative sessions last for 2 months per year (Hamm & Moncrief, 2012).
Variations in legislator salary influence the types of persons who are likely to serve in these deliberative bodies. Legislatures that provide low salaries attract members who have income and employment security outside of the legislature (Fiorina, 1994), and those with higher salaries are more likely to attract representatives who view public service as a career path or stepping stone along a political career (Maestas, 2000). We can expect that legislators who work within more professional legislatures will create different types of policies and exercise different oversight capabilities (Mooney, 1995). The longer the legislative sessions, the more time that representatives have to debate and discuss complex policy decisions. The larger numbers of support staff and job security also allow them to focus more of their attention on their policy-making duties and to invest more time and resources in researching policy issues. An unanswered question is how legislative professionalism influences state adoption of PPPs.
Theoretical Justifications for Model Specification
Dependent Variable
This section presents the reasoning for the inclusion of the dependent variable of the analysis. The theoretical interest of this study, again, involves an understanding of how economic, political, and infrastructure demand issues influence the adoption of PPPs for transportation infrastructure delivery. The dependent variable captures the extent that PPP’s are adopted in each state from 2000 to 2016 in the U.S. transportation sector, with independent variable data since 1998. The independent variables are considered for 2 years prior to adopted PPPs, to estimate the influence of state-level factors 2 years prior to the financial close of a PPP. This method is adopted as contract development typically takes up to 2 years for a project developed as a PPP (Reeves et al., 2015).
Independent variables
To examine the state-level factors that could influence the adoption of PPPs, we consider variables related to economic, political, and infrastructure demand issues.
Economic variables
Three variables are considered in respect to economic factors that could influence PPP adoption: real per capita deficit, real per capita outstanding debt, and real per capita gross domestic product (GDP). Much of the enthusiasm for privatization is the potential to deliver public services in a more cost-effective way (Delmon, 2011; Grimsey & Lewis, 2007; Savas, 2000). PPPs create potential for efficiencies in infrastructure delivery, due to the greater discretion provided to a private partner and associated market pressures on project outcomes (De Schepper, Haezendonck, & Dooms, 2015; Engel et al., 2014). Limited government budgets may also reduce pressure from public bureaucrats who would normally oppose any form of outsourcing (Niskanen, 1971). Many forms of PPPs also involve private financing—creating access to lending that the government may otherwise not have access to (Garvin, 2010).
Political variables
Four variables are considered in respect to political factors that could influence PPP adoption: state government ideology, the professionalism of state legislatures, the terms of state-level PPP laws, and the proportion of state-level employment that is unionized. State-level officials are the primary decision makers in the adoption of PPPs due to the influence of state government in U.S. transportation planning and due to the importance of state-level legislation for dictating the terms by which a transportation agency can contract with the private sector in PPPs. When state leaders support a project like a PPP, they often “stake their political reputation[s] on the success or failure of market-based reforms” (Battaglio & Legge, 2009, p. 46). Indianapolis Mayor Stephen Goldsmith, for example, based his management reform agenda on increasing contracting practices in city administration. Similarly, President George W. Bush spearheaded a dramatic reform of U.S. federal agencies through competitive sourcing (Dumas & Stephens, 2004). A pro-business policy preference typically aligns with interests in “shrinking the state” and a skepticism of the government’s role in a market economy (Warner & Hefetz, 2012). Legislators are also under pressure from interest groups for any policy-making decision (Lowi, 1972; Lowi & Ginsberg, 1998), and conservative legislators are typically more supported, and thus more influenced, by concerns of the business community (Fiorina, 1994; Zullo, 2006).
A related concern is the extent that legislators have the means and abilities to understand, and provide oversight on complex public–private collaborations. We consider these capabilities in respect to legislative professionalism, defined as the “capacity of individual members and the organization as a whole to generate and digest information in the policymaking process” (Squire, 2007, p. 211). The extent that legislators in a given state serve in a full-time capacity and with administrative support will reduce the transaction costs associated with governing PPPs.
State-level legislation also dictates the terms and conditions by which state and local leaders can engage the private sector in PPPs. A state-level legal framework for working with a private partner is an important prerequisite for PPP adoption (Geddes & Wagner, 2013), and the terms of PPP enabling legislation are determined at the state-level. While more than 33 states have adopted legislation to allow for the development of infrastructure with PPPs, only 24 have actually adopted them. An important distinction among PPP laws is whether or not a private provider can propose infrastructure projects to a local authority through unsolicited proposals. The extent that the private sector can recommend or “propose” projects as PPPs could influence the prevalence of PPPs, as more projects would be considered under this model than those identified by the public sector on their own.
Unions are also an important political variable in adopting PPPs. While the prevalence of collective bargaining is generally on the decline in the United States, union membership continues to hold significant sway in public management (Kearney, 2010). Public sector unions oppose many forms of contracting, in efforts to protect labor for their members (Bennett & Dilorenzo, 1983; Chandler & Feuille, 1991; Chandler & Feuille, 1994; Lopez de Silanes et al., 1997; Zullo, 2009). Union leaders often suggest that union-provided services are more cost-effective than those contracted out. Union membership by state can be expected to limit PPP adoption.
Infrastructure demand variables
The final set of variables address a number of demand-related measures of transportation delivery, including per capita lane miles of public roads, per capita passenger enplanements, per capita miles of public rail transit, urban vehicle miles traveled, and spending on transportation. Pressure for transportation expansion can influence PPP adoption, as a means to develop physical infrastructure beyond existing tools of public finance. A measure of prior experience with PPPs is also considered, as governmental entities learn from the policy successes and failures of other similar entities in a process of horizontal diffusion or learning (Mintrom & Vergari, 1998; Schneider & Ingram, 1988) and also from the experiences of governments at higher and lower levels, in a process known as vertical diffusion or learning (May, 1992; Shipan & Volden, 2006; Thompson & Burke, 2007; Weissert & Scheller, 2008).
Data and Method
In this study, we analyze data from the U.S. transportation sector to examine trends in PPP adoption. The U.S. transportation sector has seen more of this form of public–private collaboration than any other infrastructure sector, due largely to the potential for monetizing services on roadways and the established role of construction contractors in transportation delivery. As of 2014, the U.S. FHWA (2015) reports that 33 states in the United States have passed laws allowing for the development of transportation infrastructure as a PPP. Twenty-four states have experimented with at least some form of PPP (Public Works Financing, 2016), and more than 4% of U.S. roadways have been tolled (often involving a form of PPP) since the 1990s (Chasey et al., 2012).
We use multiple sources for the creation of our dataset, covering the years 2000 to 2016, with independent variables lagged to also include state-level predictors from 1998 and 1999. We also selected this time frame to achieve a perspective on some of the most recent state-level adoptions of PPPs in the U.S. context. We only consider state-level independent variable data from 1998, as data were missing for too many measures on some of the lagged independent variables reported earlier than 1998 to confidently impute the values without introducing bias in the analysis. Table 1 depicts the variables in the study, their coding, and data source where applicable. The unit of analysis is state-years, and there are 850 observations. The dependent variable, PPP, is dichotomous, taking on a value of 1 if the state began a PPP project in the respective year, and 0 otherwise. This measure is devised by consolidating the Public Works Financing 2013 and 2016 PPP project list scorecards on U.S.-based transportation PPPs. As our dependent variable measures when a state begins a PPP project, we produce a 2-year lag for relevant independent variables due to the previously noted time for contract development. Table 1 displays the variables used in this study.
Variables.

Note. PPP = public–private partnerships; GDP = gross domestic product.
Economic Variables
We first collected state budgetary data for the years 1998-2016, and transformed them into relevant measures for analysis. The Census Bureau publishes nominal values of economic variables for each year. To account for inflation, we create real values for the economic variables using an inflation calculator from the Bureau of Labor Statistics to convert each dollar figure into 2009 dollars. We divide these figures by the total population to obtain per capita values of these variables. 3 Together, these transformations yield real per capita economic measures. Lagged Deficit is the real per capita budget deficit for the state. We obtain this figure by subtracting the state’s general expenditures from its general revenues, account for inflation, and divide by the state’s total population. Thus, negative values for this variable indicate a deficit. Lagged Debt represents the real per capita outstanding debt of the state. Lagged GDP is the real per capita GDP for each state, obtained from the Bureau of Economic Analysis.
Political Variables
Lagged Ideology is a measure of state government ideology. We use measures developed by W. D. Berry, Fording, Ringquist, Hanson, and Klarner (2010). They calculate state government ideology scores based upon common-space NOMINATE scores of states’ Congressional members, along with accounting for the relative power of the chambers in each respective state and the party identification of the governor. 4 Lagged Professionalism is a measure of state legislative professionalism. Bowen and Greene (2014) score legislative professionalism on a work-intensive versus support-intensive scale, whereby positive scores (high professionalism) on this measure of professionalism denote legislatures with high staffing expenditures and short legislative sessions (support-intensive), while negative scores (low professionalism) denote legislatures with low staffing expenditures and long legislative sessions (work-intensive). 5
We believe that state ideology and state legislative professionalism provide an important interactive relationship concerning the adoption of PPPs. This means that the individual, marginal effect of state ideology may vary depending on a state legislative professionalism score, and vice versa (see Brambor, Clark, & Golder, 2006, and W. D. Berry, Golder, & Milton, 2012, for detailed explanations concerning interactive relationships in research). Therefore, we include the variable Lagged Interaction (Lagged Ideology × Lagged Professionalism). 6
We consider the relative ease of PPP adoption in states by including a series of dummy variables for their respective PPP laws. Unsolicit is a variable coded 1 if the state has a law allowing unsolicited PPP proposals, and 0 otherwise. Solicit is a variable coded 1 if the state has a law allowing PPPs, but through solicitation, and 0 otherwise. No Law is the reference category. It is coded 1 if a state has no PPP law, and 0 otherwise. Data on PPP laws and their years of enactment come from publications by Geddes and Wagner (2013), Israte and Puentes (2011), and Pula (2016). Lagged Unions measures the percentage of union members in the workforce of each state. This information is made available from the Current Population Survey.
Infrastructure Demand Variables
Lagged Lane Miles is the estimated number of per capita lane miles of public roads in each state. The U.S. Department of Transportation makes this data available annually. It helps to capture the current state of road infrastructure in states. To help capture road demand, we include Lagged Urban Vehicle Miles. Also available from the Department of Transportation, this variable measures the estimated number of vehicle miles traveled on urban roadways in each state. 7
As some of the PPPs in our dataset are influenced by airport improvements, we include a measure of airport use. Lagged Enplanements is the total number of per capita boarding passenger enplanements at every state airport offering commercial service. Lagged Rail Miles is the number of per capita directional route miles of public rail transit in each state. All forms of rail travel are included in this measure, including, but not limited to, light rail, subways, trains, and so on. Previous Experience is coded 1 if the state had enacted a PPP prior to the respective year’s PPP, and 0 otherwise.
Regression Model
To investigate the state-level factors that influence PPP adoption, we performed regression analysis. As the dependent variable, PPP, is dichotomous and coded 1 if the state began a PPP project in a particular year and 0 otherwise, we used a logit model. We first tested the model without the interaction term, and then included the interaction term to compare the results. Coefficients from logit models cannot be interpreted in the same manner as ordinary least squares (OLS) regression coefficients and we therefore present the percent change in the odds ratios (Table 3).
A statistically significant interaction term adds information to the causal model and implies that the constitutive terms’ coefficients vary based on the value of the other constitutive term. Graphing the marginal effects of the constitutive terms is the typical manner with which to understand the interactive relationship. We use a package in R, developed by Solt and Hu (2015), to depict the marginal effects of the state government ideology and state legislative professionalism measures.
A Note on Missing Values
Several of our variables contain missing values. Bowen and Greene’s (2014) data on state legislative professionalism are incomplete in that they were unable to fully collect data on all 50 states over the time period of their study. Even in our own data collection efforts of state budget expenditures, a few states had missing information or did not report their data. Therefore, we must account for the missing data in the following variables: Lagged Professionalism and Lagged Transport. One manner in which to deal with missing data is through listwise deletion, where observations with any missing values are omitted (Table 3: Models 1 and 2). 8
An alternative for dealing with missing data is multiple imputation. As our variables with missing values are measured at the interval level, we use the Amelia II package in R to impute the missing values. Honaker, King, and Blackwell (2011) developed Amelia II to avoid biases in the coefficients or inefficiency in the standard errors in multiple imputation. Amelia II performs multiple imputation through predictive mean matching using information from the variables with which observations are not missing to fill in missing values. Models with imputed data are presented in Table 3: Models 3 and 4.
Results
Descriptive Statistics
Table 2 shows the summary statistics for the variables in the analysis. We report the minimum value, maximum value, mean, median, and standard deviation of all the continuous variables. For the dichotomous variables, we calculate the percentage of cases that are coded as 1. As the data covers 17 years of state data, there are 850 observations. A total of 10.24% of observations (state-years) involved a state adopting a PPP in a particular year. The economic variables measuring deficit, debt, and GDP in per capita figures contain a great deal of variation.
Summary Statistics.
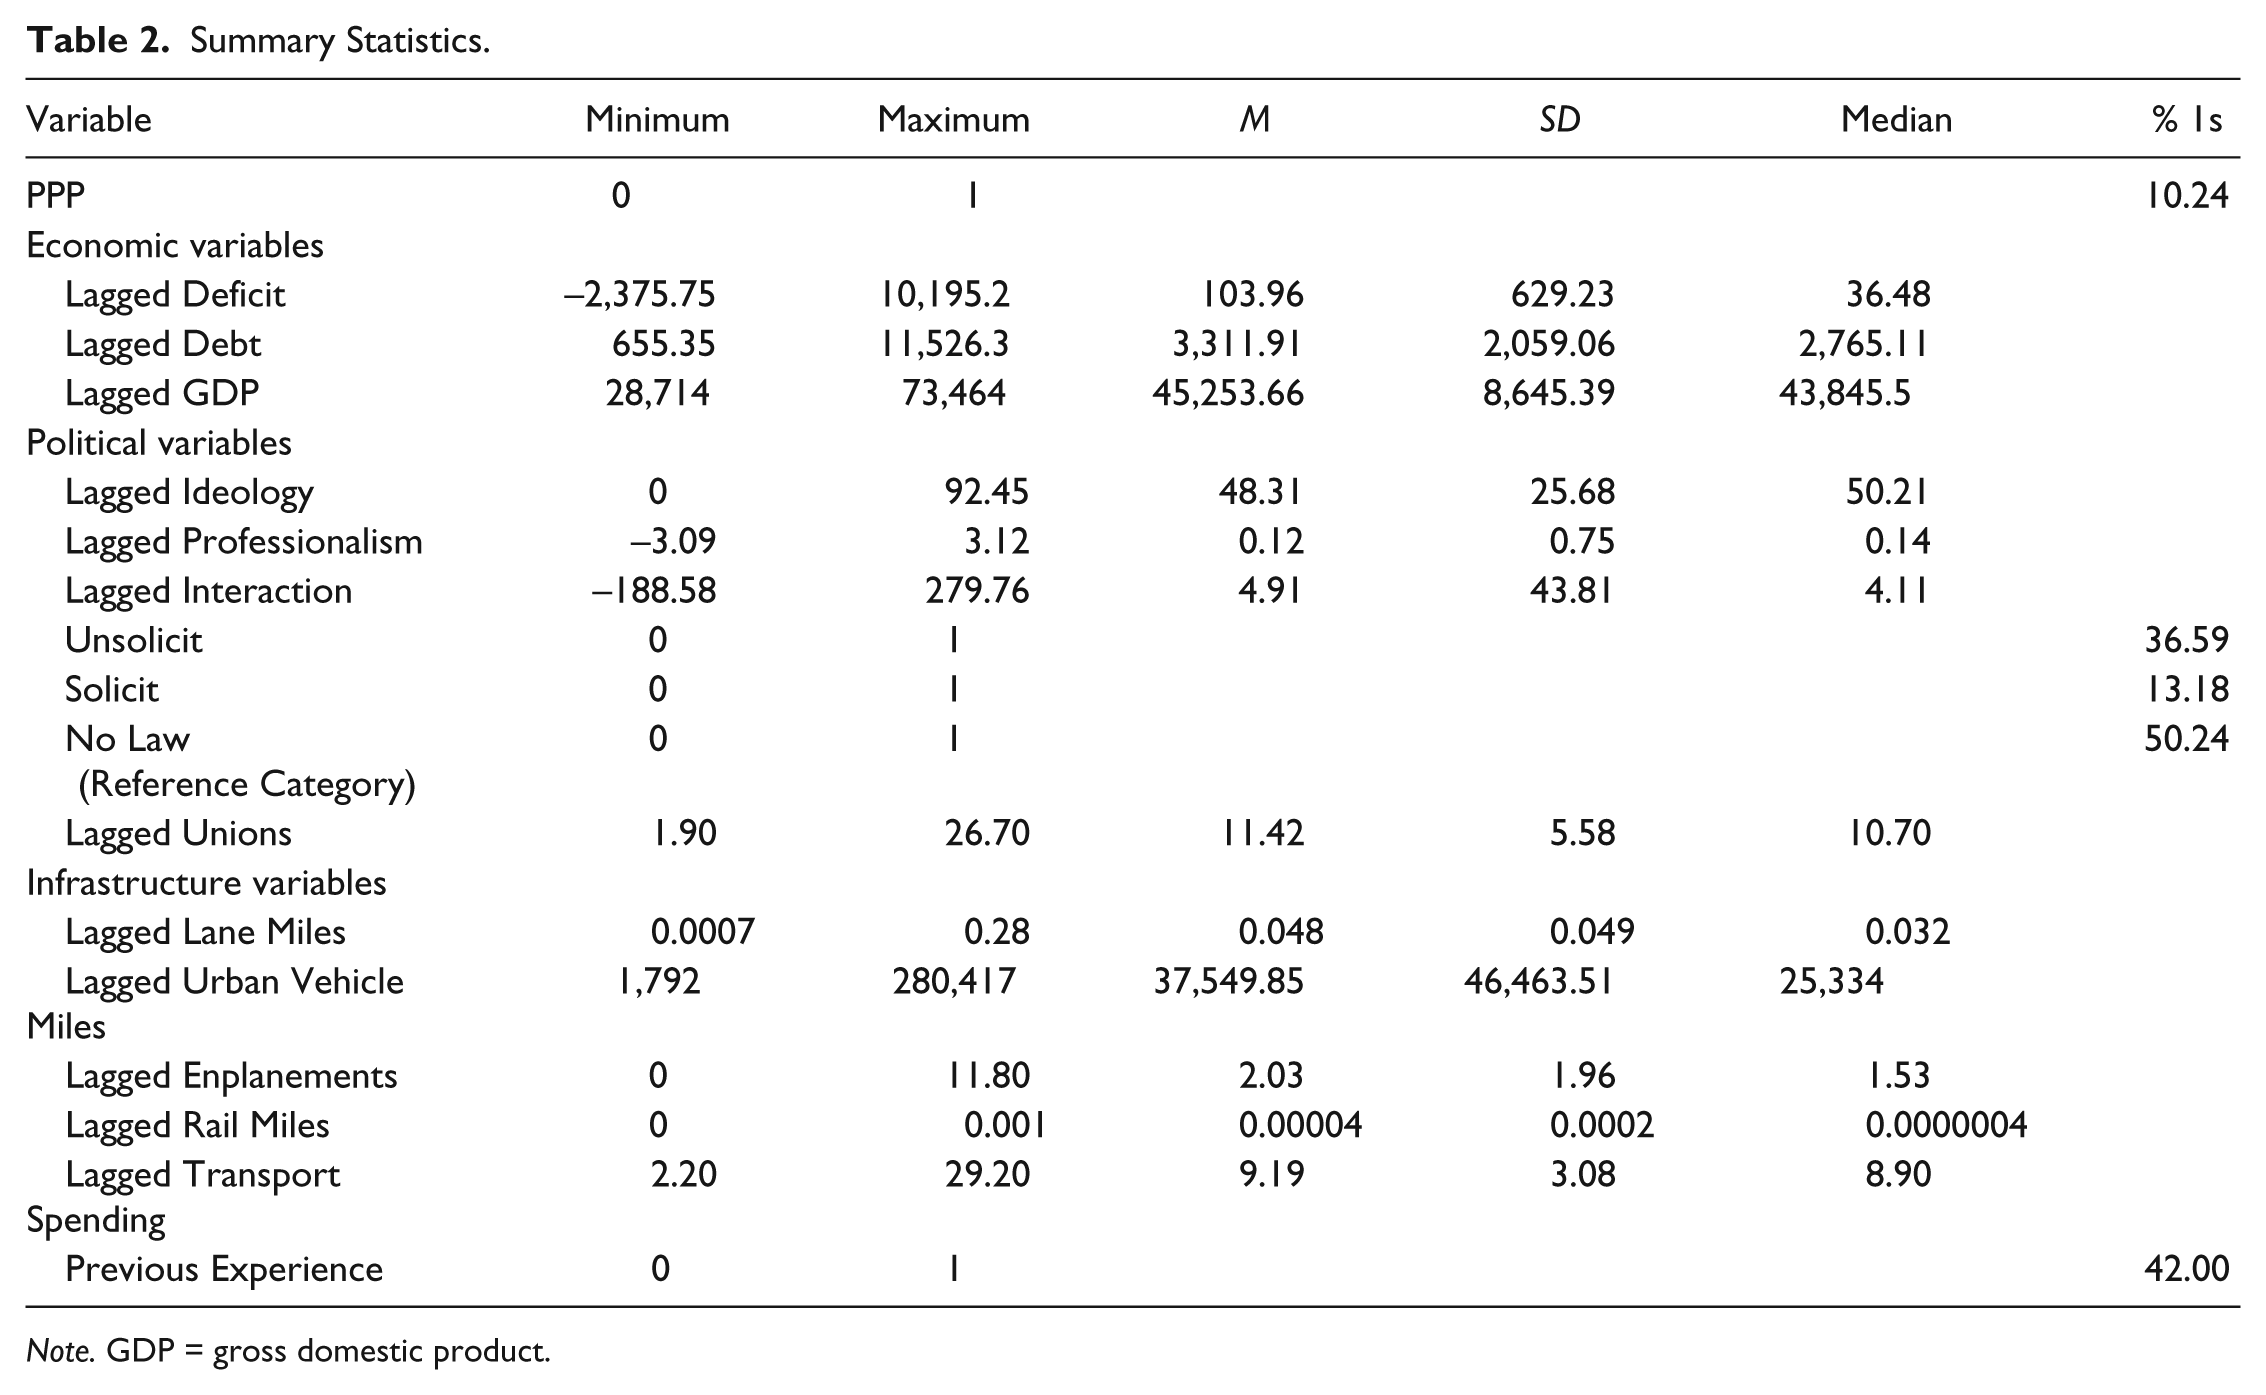
Note. GDP = gross domestic product.
The political variables are a bit less intuitive, but still display a large degree of variation. The mean and median of Lagged Ideology are 48.31 and 50.21, respectively. The ideology score can range from 1 (most conservative) to 100 (most liberal). 9 The mean and median reveal that the typical state government ideology in the dataset is very centrist. The professionalism score is also distributed fairly evenly. It ranges from –3.09 to 3.12 for the states in our years of study, with a mean and median of 0.12 and 0.14, respectively. These figures suggest that the typical state legislature is neither unprofessional nor professional. About one half of the years in our analysis contain observations where the state has no particular law that would make PPP adoption easier. Slightly over 36% of the observations occurred in state-years where the state allowed unsolicited PPP proposals.
The infrastructure variables show a wide distribution of transportation systems in the states. The Lagged Lane Miles figures are small as they measure lane miles per person. Lagged Urban Vehicle Miles has a wide range, reflecting large differences in urbanization across states. The minimum value for Lagged Enplanements and Lagged Rail Miles is 0. 10 Among the states that enacted a PPP, approximately 42% of the times they did so they had prior experience adopting PPPs.
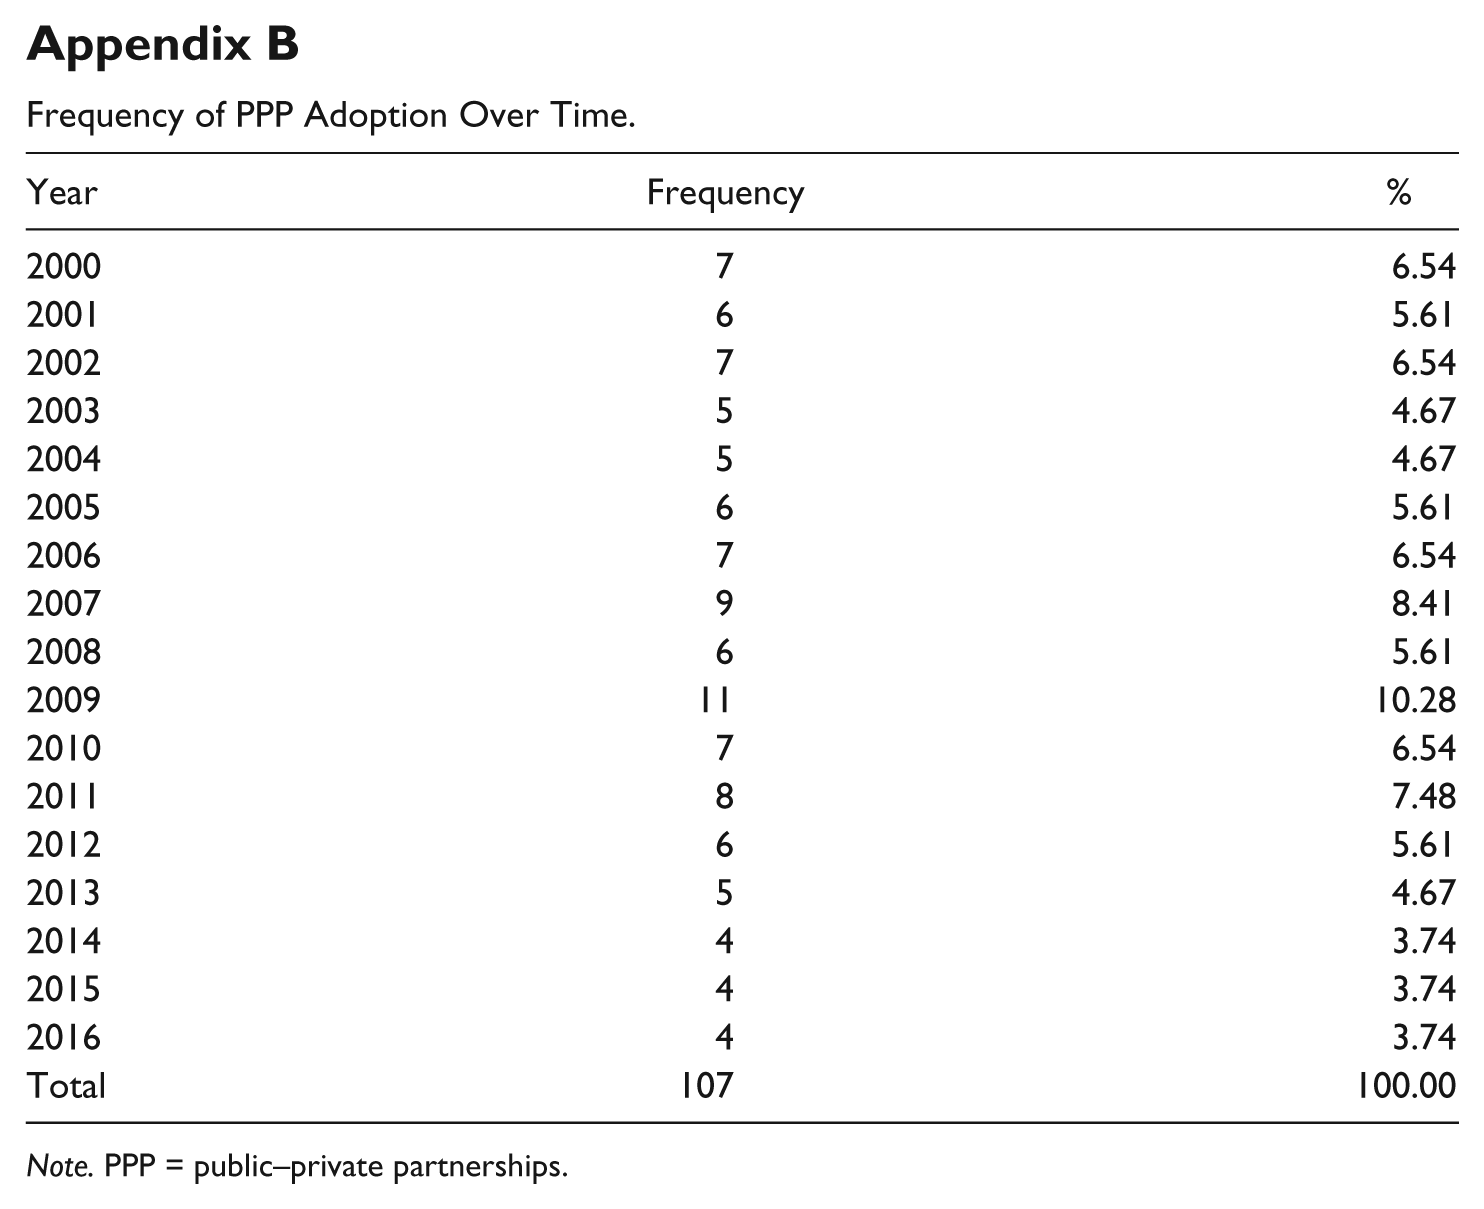
Preliminary analysis of the PPPs conducted over this time period also indicate that 24 states adopted PPPs over the time frame of the study and that 2009 was the year when the most PPPs were adopted (Appendices A and B). Consulting the tables in the appendices, we can also see that more than 50% of the PPPs conducted during this time were adopted within five states in the sample: Florida (17.76%), Texas (14.02%), Virginia (9.35%), California (8.41%), and North Carolina (8.41%).
Logistic Regression Results
Table 3 depicts the logistical regression coefficients for four separate models. We used the Zelig software available in R to conduct the regressions (Imai, King, & Lau, 2006, 2008). In Model 1 and Model 2, we use the original dataset with missing values omitted through listwise deletion. They are identical except that Model 2 includes the interaction term between Lagged Ideology and Lagged Professionalism. Model 3 and Model 4 include the imputed observations for the missing data, with Model 4 containing the interaction term. Table 3 shows that the results from the original dataset and the imputed dataset are robust. Imputing the 42 missing observations to obtain the results in Model 3 and Model 4 does not drastically change the coefficients or their significance, indicating minimal error resulting from listwise deletion. Results from Model 1 (missing data omitted) and Model 3 (missing data imputed) are notably similar, along with results from Model 2 (missing data omitted) and Model 4 (missing data imputed). Lagged GDP loses its significance from Model 1 to Model 3, but it was significant at only the 90% confidence level in Model 1. In the preferred model, Model 4, Lagged GDP loses significance altogether. Lagged Lane Miles becomes significant at the 95% confidence level in Model 3 compared with 90% confidence in Model 1, but returns to only 90% statistical significance in the preferred Model 4.
Logistic Regression Coefficients Change in Adopting PPP:
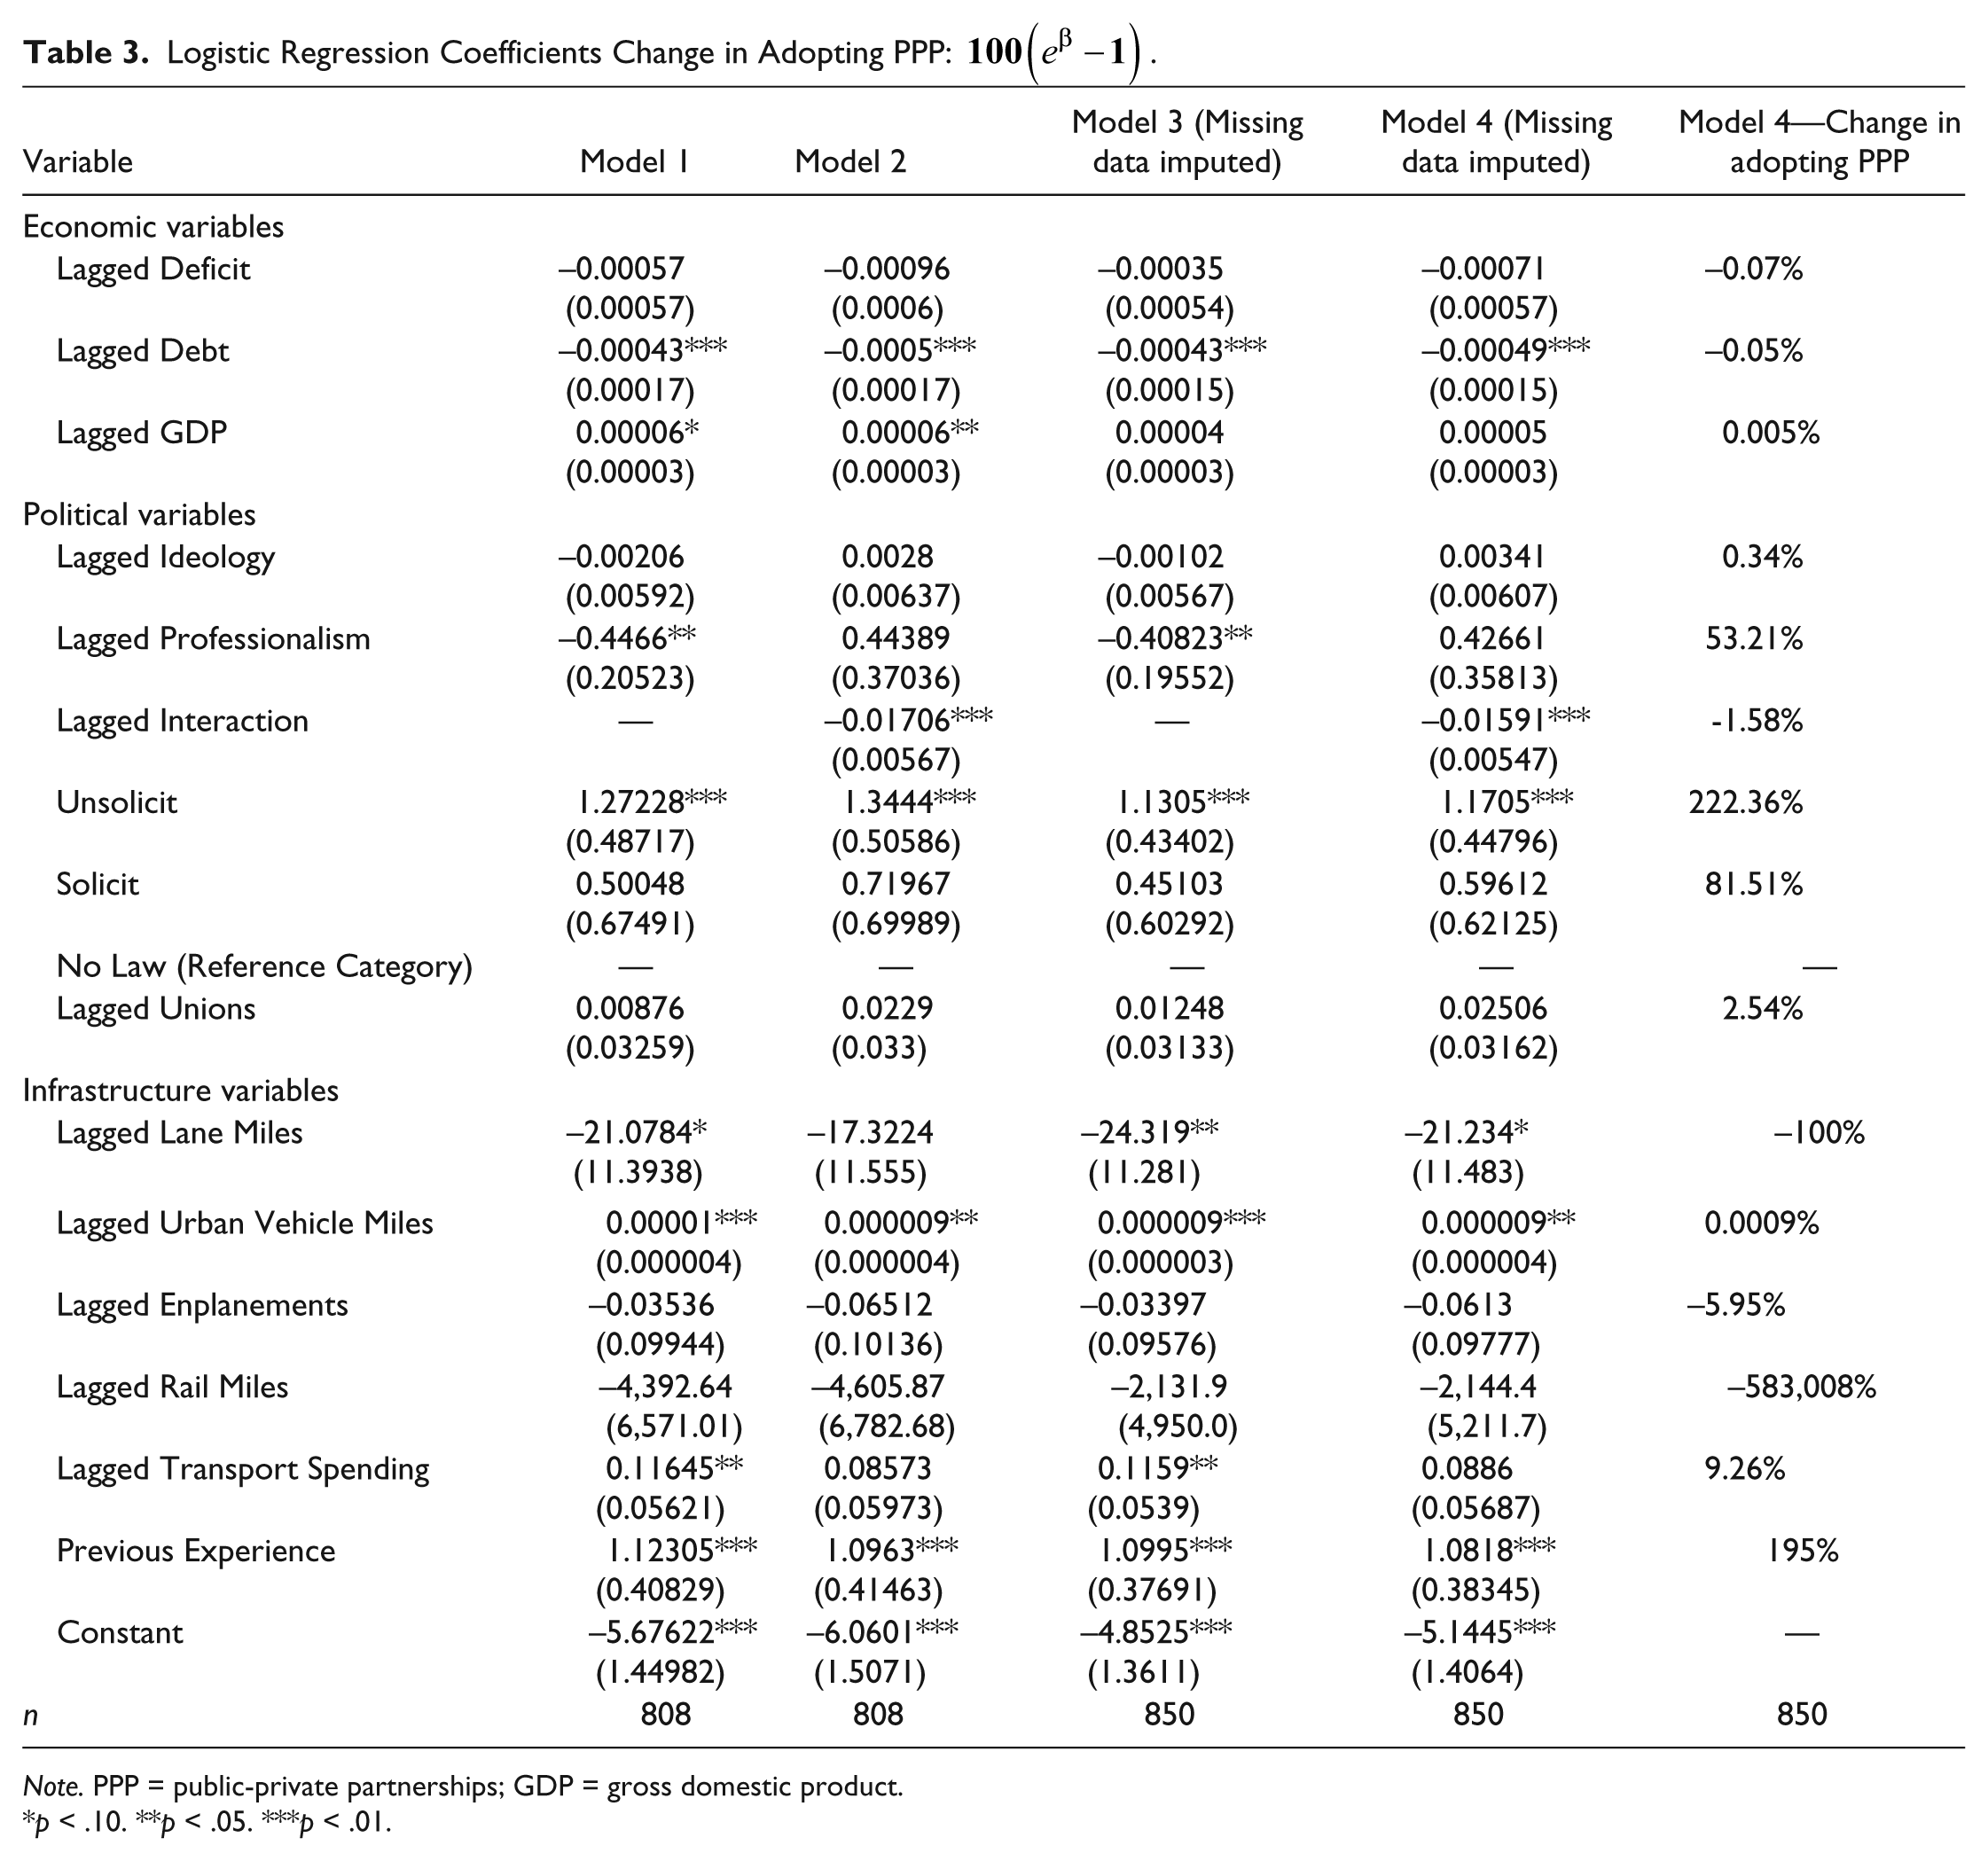
Note. PPP = public-private partnerships; GDP = gross domestic product.
p < .10. **p < .05. ***p < .01.
A common method to interpret logistic regression coefficients is to use them to compute odds ratios. The odds ratio for the variables is calculated using the following formula:
One can also calculate the percentage change in the odds of a state adopting a PPP using the following formula:
When discussing the effects of the independent variables on the likelihood of PPP adoption, we use the percent change in the odds ratio for the coefficients from Model 4, the regression model that best explains PPP adoption. These figures are presented in the final column of Table 3.
Across all of the models, the only significant economic variable is a state’s debt 2 years prior (Lagged Debt). As a state’s debt increases, the likelihood of adopting a PPP decreases. The coefficient is very small (–0.00049 in Model 4), because the variable is measured in terms of real per capita dollars. When converted to a percent change in the odds ratio, it becomes –0.05%. For each US$1 per capita increase in state debt, the odds of PPP adoption decrease by 0.05%. This effect may seem small, but given how it is measured, it is actually quite substantial if debt rises by US$100 per capita or even US$10 per capita. Some states in our dataset have per capita debt over US$10,000, so it is plausible to see a US$100 per capita increase in debt. One interpretation for why states are less likely to adopt PPPs as debt increases could be that as government debt increases, potential private funders of projects lose confidence in the state (Dailami & Klein, 1997).
Only the infrastructure variables dealing with roadways are significant, with the Lagged Urban Vehicle Miles variable significant at conventional levels. The variable measuring Lagged Lane Miles is significant at the 90% confidence level, and its negative coefficient indicates that the more lane miles of roadways in a state, the less likely a state is to adopt a PPP. In fact, each additional lane mile added per person in the state leads to a 100% decline in the odds of a state adopting a PPP. This result suggests that current roadway infrastructure supply has an effect on PPP adoption, albeit only with 90% confidence. More importantly, the Lagged Urban Vehicle Miles variable is significant at the 95% confidence interval and points to a positive relationship between urban vehicle miles traveled and the likelihood of PPP adoption. The coefficient is small due to the unit of measure in millions of urban miles traveled. The change in the odds ratio of 0.00009% indicates that an additional unit of vehicle miles traveled (an additional million) leads to a 0.00009% increase in the odds of PPP adoption. This figure may seem small, but if one considers a large U.S. city like Los Angeles or New York City that likely have over 1 million vehicles traveling in their jurisdiction in any given day, the figure actually suggests substantive significance. Over the course of a year, these millions of vehicles travel a substantial number of urban miles. Considering this fact, the effect of urban vehicle miles traveled has a large impact on state PPP adoption.
The statistical significance of our measures of Urban Vehicle Miles and Lane Miles indicate how infrastructure demand can influence PPP adoption. A common argument in favor of PPPs is the potential to accelerate infrastructure development beyond the constraints of public finance. The results here indicate that PPPs are, in fact, pursued when states face investment gaps—at least, in respect to travel demand. The positive relationship between Urban Vehicle Miles traveled and PPP adoption indicates that a higher density of travelers increases the probability of PPP adoption. The negative relationship of lane miles to PPP adoption is more complex, however, suggesting that the larger the existing road network in a state, the lower the likelihood of their adoption of PPPs. The implication is that PPPs are most likely in contexts where existing roadways do not satisfy travel demand, such as states or regions experiencing population growth.
Other infrastructure variables are not significant. All measures of the quantity of air and rail demand are not significant. Transportation spending as a percentage of the state budget also has no impact across the four models. In respect to the prior infrastructure variables, we infer that roadway expansion, more than related modes of transportation, are the primary drivers of PPP adoption.
The Previous Experience variable is significant across all four models. The coefficient is 1.0818, making the odds ratio 4.11, and the percent change in the odds of adopting a PPP at 195. States with previous PPP experience have a 195% increase in the odds of adopting a PPP. States with a history of PPP adoption learn from these experiences and are more likely to undertake them again.
The results from the political variables are the most unique and interesting, especially with the interaction term. In every model, the Unsolicit variable is significant, indicating that states that allow unsolicited PPP proposals are more likely to adopt a PPP compared with states with no law regarding PPPs. The percent change in the odds of adopting a PPP is 222.36. This means that states allowing unsolicited PPP proposals see a 222.36% increase in the odds of adopting a PPP. This finding makes intuitive sense—states that clear a pathway for PPP adoption by decreasing transaction costs are more likely to adopt PPPs. The same pattern does not hold for states that allow PPPs, but require a solicitation process. Such processes likely raise the transaction costs for potential private providers to engage in a PPP. 11
Given the privatization component of PPPs, one would expect that states with conservative governments engage in PPPs more often than those with more liberal governments. When treated as separate entities in Model 1 and Model 3, we find no significant effect of state political ideology, but a significant effect for state legislative professionalism. Yet, in Model 2 and Model 4, the interaction term is significant, suggesting than an interactive effect exists and that the interaction term needs to be included in our model. The significance levels of the interaction term and its constitutive terms cannot be taken at face value in a logistic regression as presented in Table 3 (W. D. Berry et al., 2012; Brambor et al., 2006). Even though state political ideology is not significant in Model 2 and Model 4, it could be significant for certain values of state legislative professionalism. A similar pattern may exist for the state legislative professionalism variable—it could be significant across a particular range of state government ideology values. To assess the independent effects of state government ideology and state legislative professionalism, producing marginal effects graphs is a common method.
Figure 1 graphs the marginal effect of the lagged state government ideology variable on PPP adoption across values of lagged state professionalism. A marginal effects graph depicts how the coefficient on one independent variable in the interaction term changes across values of the other independent variable in the interaction term. The coefficient may not be statistically significant across all values of the other variable in the interaction term; therefore, 95% confidence intervals are placed in the marginal effects graph to indicate where the coefficient is significant. Coefficients are statistically significant across values where the upper and lower bounds of the 95% confidence interval do not include, or straddle, the zero line. The graphs were estimated with a package developed by Solt and Hu (2015) for R statistical software.
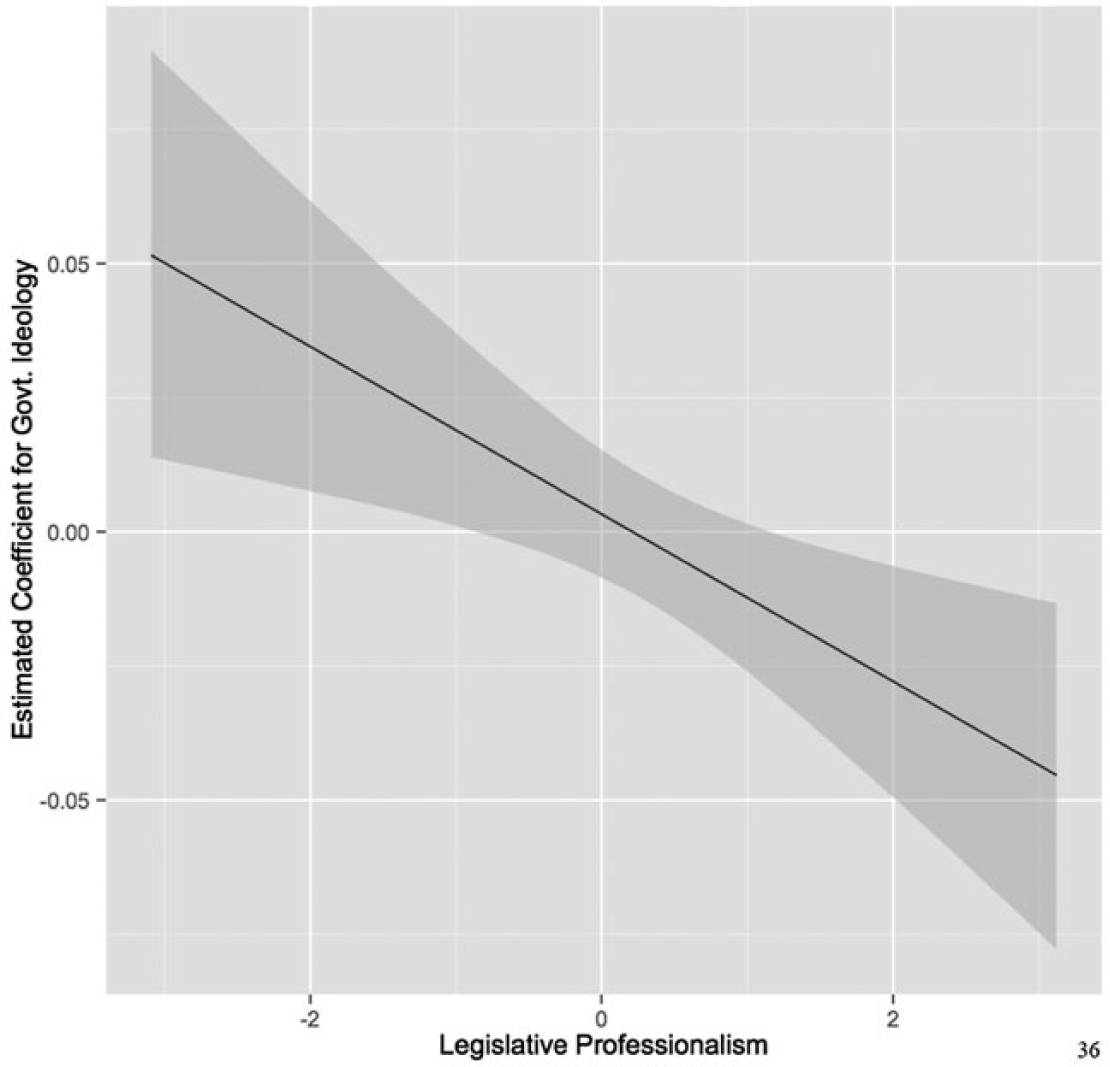
Marginal effect of government ideology on state PPP adoption.
As depicted in Figure 1, the effect of state government ideology on PPP adoption (the value of the coefficient on state government ideology) is positive for states with low levels of legislative professionalism (work-intensive legislatures), but negative for states with high levels of legislative professionalism (staff-intensive). Increasing the state government ideology score by one unit (becoming more liberal) increases the likelihood of PPP adoption for the least professional legislatures. This positive marginal effect diminishes until the legislature reaches a professionalism score of approximately –1 (a score of 0 would be neither an unprofessional nor professional legislature). The marginal effect of state government ideology is statistically insignificant, or no different than zero, for states with a legislative professionalism score of about –1 through about +1. At slightly above a professionalism value of +1, the marginal effect of state government ideology is statistically significant, but negative. Increasing state government ideology by one unit (becoming more liberal) decreases the likelihood of PPP adoption for the most professional state legislatures. In summary, for states with the lowest levels of legislative professionalism, a change in government ideology in the liberal direction actually increases the probability of PPP adoption. For states with the highest levels of legislative professionalism, a change in government ideology in the liberal direction decreases the probability of PPP adoption.
What exactly do these findings mean for politics and the adoption of PPPs? Previous research suggests that conservative state governments are more likely to adopt PPPs (Bel & Fageda, 2008; Lopez de Silanes et al., 1997). Digging further, we find a more complicated relationship between state government ideology and PPP adoption. As the region of statistical significance in the marginal effects plot in Figure 1 shows that the effect of state government ideology is statistically significant for the least and most professional state legislatures, we need to examine predicted probabilities to better understand the relationship between ideology and PPP adoption.
We identify the values of state legislative professionalism in our dataset that demarcate the bottom 25th percentile (low professionalism) and the top 25th percentile (high professionalism). We also identify the values of the state government ideology scores that give the bottom 25th percentile (most conservative) and top 25th percentile (most liberal). Using this information and setting all other independent variables to their mean values, we then calculate the predicted probability of PPP adoption in four scenarios: low professional-conservative state, low professional-liberal state, high professional-conservative state, and high professional-liberal state. Interestingly, the predicted probabilities do not significantly vary. For each scenario, the predicted probability of PPP adoption is between 3% and 4%. 12 Each of the four types of states has essentially the same likelihood of PPP adoption.
What does this tell us about the results from Figure 1? Contrary to previous studies, state government ideology, per se, does not necessarily affect the likelihood of PPP adoption. Predicting PPP adoption from state government ideology on its own—claiming that conservative states will adopt PPPs more than liberal states—does not accurately reflect the impact of ideology on PPP adoption. The influence of state government ideology on PPP adoption is dependent upon a state legislature’s professionalism. More specifically, it is the change in state government ideology that matters, not ideology in a static manner. Changing to a more liberal state government in states with low professional legislatures increases the likelihood of PPP adoption. Changing to a more liberal state government in states with high legislative professionalism decreases the likelihood of PPP adoption.
We also include the marginal effects graph of state legislative professionalism across levels of state government ideology. Figure 2 shows how the coefficient on state legislative professionalism varies across different values of state government ideology scores. In Figure 2, we see that for the most liberal state governments, increasing legislative professionalism decreases the likelihood of PPP adoption. The relationship becomes statistically significant when the state government ideology score becomes slightly larger than 50. A score of 50 indicates a centrist state government. Therefore, for most liberal state governments, increasing the legislature’s professionalism to more staff-intensive actually has a negative effect on the likelihood of the state adopting a PPP.
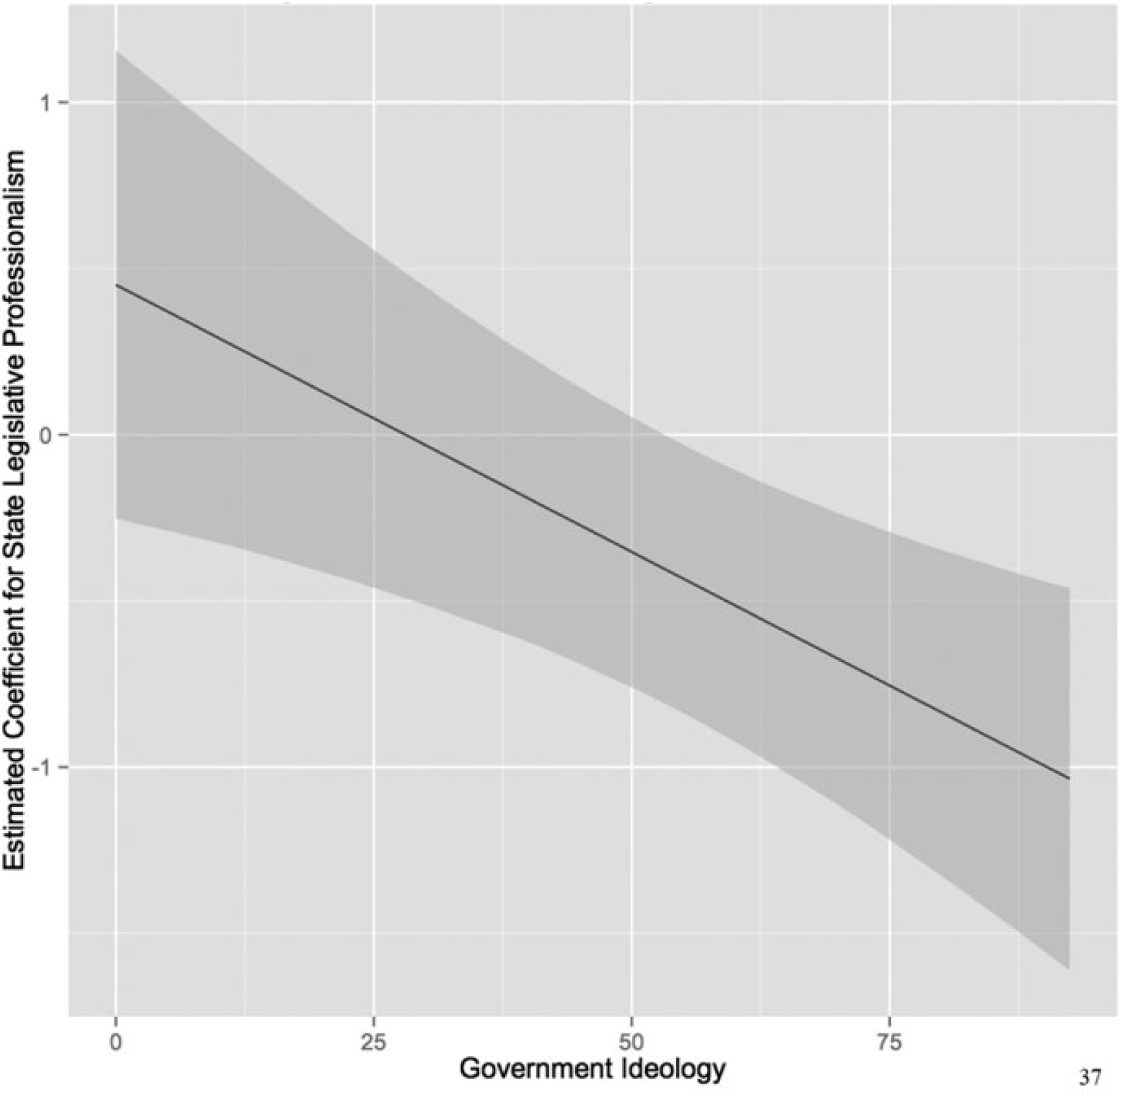
Marginal effect of state legislative professionalism on state PPP adoption.
The results from Figure 1 and Figure 2 confirm that the effect of state government ideology is much more nuanced in PPP adoption than previously thought. Increasing government liberalism in states with the least professional legislatures increases the likelihood of PPP adoption. For the most professional states, increasing liberalism decreases the likelihood of PPP adoption. These results call into question previous findings that conservative-majority states are the states most likely to adopt PPPs. Wang and Zhao (2014) identify liberal political ideology as an “obstacle” to PPP adoption (p. 695), and Geddes and Wagner (2013) argued that state conservatism increases the likelihood of the state passing PPP enabling legislation. We find that the effect of a state’s political ideology is more nuanced and must be considered along with a measure of state legislative professionalism. As such, we are one of the first researchers to include the interaction of ideology and professionalism in PPP research. Our adopted measure of state legislative professionalism indicates that the influence of political ideology on PPP adoption is contingent on the professionalism of state legislatures, whereby conservative political affiliation is a necessary but insufficient condition for PPP adoption (they are more likely when they are conservative and professional) and liberal political affiliation is actually associated with PPP adoption when those legislatures are not professional.
Discussion and Conclusion
The findings indicate that economic and infrastructure demand variables predict state adoption of PPPs. Levels of state debt levels and infrastructure demand were found to impact PPP adoption. Potential economic benefits of PPPs are often one of the most prominent reasons given for their justification (Delmon, 2011; Garvin, 2010; Grimsey & Lewis, 2007), and the results presented here generally support those findings. Multilateral aid organizations often justify PPPs in low-income countries, for example, as national governments with limited tax revenues may have no other alternatives for investing in infrastructure (Asian Development Bank, 2008; International Finance Corporation, 2009; Public-Private Infrastructure Advisory Facility, 2013; United Nations, 2009). Access to private capital and finance can open the door to projects in the midst of limited public financing alternatives. Our findings suggest, however, that these concerns are not the only drivers of PPP adoption. In this way, the conclusions provide further evidence that fiscal limitations are not the only driver of privatization (Chandler & Feuille, 1994; Zullo, 2009).
Perhaps the most significant finding of this research is the interdependent nature of state government ideology and legislative professionalism in respect to PPP adoption. Prior research highlights the tendency for political leaders to support privatization policies such as PPPs when they are conservative (Bel & Fageda, 2008; Dubin & Navarro, 1988; Rudolph & Popp, 2009), and empirical studies in the U.S. context indicate that conservative legislative majorities are more likely to pass state laws in support of PPPs (Geddes & Wagner, 2013). This study does not refute these findings. The results do, however, demonstrate the interdependent nature of political ideology and legislative professionalism. We find that when state governments become more liberal, they are less likely to adopt PPPs—but only when they are operating under conditions of low legislative professionalism. We also note that when state governments become more liberal under conditions of high legislative professionalism, the likelihood of PPP adoption decreases. 13
One interpretation of these findings is that that a change in ideology from an election brings in a new guard of politicians with a different view of policy. This change can ignite new state policies that did not exist before. Within states with low levels of legislative professionalism, ideologically liberal politicians (who are typically resistant to pro-market reforms like PPPs) may be more inclined toward PPPs upon being elected to demonstrate that they are active in promoting policy change or activism. In state governments with high levels of legislative professionalism, legislatures and state government are better equipped to be policy activists and to make and implement policies like PPPs. In the more professional contexts, liberal politicians may have less pressure for policy activism and may instead lean more heavily on ideological preferences for state-run policies. One question is why conservative governments are less inclined to adopt PPPs when they assume power under low levels of legislative capacity and support. This area could be addressed through further research. The summary implication is that when government changes in a more liberal direction, it is more likely to pursue PPPs when the legislature has fewer tools for oversight and governance. A change in the conservative direction leads the state government to pursue them when they have this support in place.
The findings also indicate that state PPP laws allowing for the private sector to submit unsolicited proposals are associated with PPP adoption. Prior research has hypothesized the relationship between the business “favorability” of PPP laws and private investment in infrastructure (Geddes & Wagner, 2013). This research confirms this relationship, and indicates that the more flexibility that potential partners have in shaping what projects will be selected for PPPs, the more PPPs will be adopted. The presence of a state-level law allowing for unsolicited bids also indicates some preexisting public and political support for private sector involvement in infrastructure—this loosening of restrictions would not be present in states with greater political scrutiny and skepticism of PPPs. The significance of previous experience in predicting PPPs provides another indication that political feasibility is a primary driver of PPPs. The first PPPs are likely to be the most controversial in a given state, and the acceptance of at least one can help to dispel negative assumptions for future related projects.
The aim of this research was an examination of the state-level economic, political, and infrastructure demand factors that influence the adoption of partnerships with the private sector for infrastructure development that transfer more technical and financial risks to the private sector than typical approaches to government contracting (design-bid-build). The advantage of our approach is that it explains the adoption of a host of innovative approaches to developing infrastructure, where technical and financial risks for large-scale projects are shared with the private sector. One limitation to our approach, however, is that some subcategories of PPPs transfer greater risk to the private sector than others. For example, a Design-Build project transfers no financial risk to the private sector, while a Design-Build-Finance project does. Additional research could examine the extent that the specific structure of risk sharing is influenced by the state-level factors investigated here. Additional research could also examine the extent that state-level factors predict other characteristics of PPPs, such as their budget size. While more than 75% of the PPPs within this study’s time frame were budgeted below a billion dollars, the largest PPPs cost as much as 1 to 5 billion dollars. Further research could examine the influence of state-level factors on the selection of such high cost PPP options. A final limitation is that our study includes only post-millennium PPP adoptions due to data availability for independent variables in the 1990s. If scholars are able to obtain this information, likely located in bounded volumes in the archives of government departments, then we can learn even more about PPP adoptions. Our results generalize for the years 2000-2016. Generalizability would improve if the analysis can extend further back into state PPP history.
With the continued implementation of PPPs across the United States and around the world, there is a need for understanding the rationales for PPP adoption and the associated skills and abilities of state leaders involved in their selection. This research provides a small step in this direction, indicating the factors that support the political feasibility for this form of privatization and the influence of legislative professionalism in influencing political party support for PPPs.
Footnotes
Appendix
Frequency of PPP Adoption Over Time.
| Year | Frequency | % |
|---|---|---|
| 2000 | 7 | 6.54 |
| 2001 | 6 | 5.61 |
| 2002 | 7 | 6.54 |
| 2003 | 5 | 4.67 |
| 2004 | 5 | 4.67 |
| 2005 | 6 | 5.61 |
| 2006 | 7 | 6.54 |
| 2007 | 9 | 8.41 |
| 2008 | 6 | 5.61 |
| 2009 | 11 | 10.28 |
| 2010 | 7 | 6.54 |
| 2011 | 8 | 7.48 |
| 2012 | 6 | 5.61 |
| 2013 | 5 | 4.67 |
| 2014 | 4 | 3.74 |
| 2015 | 4 | 3.74 |
| 2016 | 4 | 3.74 |
| Total | 107 | 100.00 |
Note. PPP = public–private partnerships.
Acknowledgements
The authors thank the editor and anonymous reviewers for helpful comments on the manuscript. They also thank Jacqueline DeMeritt, Greg Goelzhauser, Anthony Kassekert, and Carlisle Rainey for assistance and comments on the methodology. Finally, thanks to Frederick Solt and Yue Hu for assistance with their R package.
Declaration of Conflicting Interests
The author(s) declared no potential conflicts of interest with respect to the research, authorship, and/or publication of this article.
Funding
The author(s) received no financial support for the research, authorship, and/or publication of this article.