
Abstract
The equitable distribution of docked bikeshare is an important issue for transportation decision-makers. Gini coefficients and Lorenz curves can be used to study transportation inequality. This study used these methods to achieve three outcomes. First, this study identified a gap in bikeshare equity literature and provided a more nuanced measure of bikeshare supply to better evaluate how well bikeshare meets demand. Second, the updated measure of distributional equity was used to evaluate bikeshare equity in Washington, DC. Third, using historical trip data, the Gini coefficient calculations indicated which trip types are better served. Comparison of the results highlighted a potential conflict in program goals: equity versus supporting existing bikeshare members. Policy feedback may bias this trade-off in favor of members, reinforcing spatial inequalities. Overall, this paper further demonstrated how Gini coefficients and Lorenz curves can be useful tools for evaluating inequality in transportation systems.
Introduction
The equitable distribution of transportation is an issue with which many in transportation are concerned. Given that resources are finite, transportation decision-makers must decide who benefits and who does not, a challenge for transportation researchers and practitioners alike. Bikeshare is a particularly important mode for which to consider equity as it provides the environmental, health, and spatial efficiency benefits of cycling without the need of accessing a personal bicycle (Fishman & Allan, 2019). Docked bikeshare is worth special consideration because, unlike its dockless cousin, the supply of docked bikeshare is relatively fixed, meaning the placement of stations are the result of conscious longer-term decisions around who should get access to the system. While bikes can move between stations, the fixing of stations concentrates the location of bikes. The placement of bikeshare stations is important as previous research has suggested the location of docked bikeshare has a direct impact on who can and who does use the system (Fishman et al., 2013; Fishman et al., 2014; Ogilvie & Goodman, 2012; Willberg et al., 2021). Consequently, the placement of docked bikeshare stations generate a real equity concern, a concern that, although shared by dockless bikes, is not as significant when operational locations are not fixed (Mooney et al., 2019; Qian et al., 2020). This equity concern is known to bikeshare operators who have identified station siting as a common way to address equity (Howland et al., 2017). Gini coefficients and Lorenz curves are a method adapted from economics to study transportation inequality. Traditionally used to measure income inequality between or within countries, Gini coefficients are a useful tool for comparisons between and within groups (Wang & Lindsey, 2017). Over the last decade, researchers have demonstrated these tools are effective at diagnosing both horizontal and vertical inequality in transportation. Horizontal equity is the distribution of impacts between groups that are equal in ability and need while vertical equity is the distribution of impacts between groups with differing abilities or needs (Litman, 2016). This paper adapts this evaluation method to evaluate docked bikeshare equity in Washington, DC. There are three goals for this paper: 1. Adapt Gini coefficients and Lorenz curves to the evaluation of docked bikeshare systems. 2. Use census data to evaluate horizontal and vertical equity for the Washington, DC Capital Bikeshare system. 3. Evaluate whether Gini coefficients and Lorenz curves can be used for better understanding bikeshare trip segmentation.
Through evaluation of two forms of bikeshare demand, census population 1 and historical trips, this paper establishes both whether inequalities exist as well as if and how program goals potentially conflict. While this paper is not the first attempt at developing Gini coefficients and Lorenz curves for docked bikeshare (see (Wang & Lindsey, 2018)), this paper evaluates bikeshare in a different geography, performs more extensive evaluation of bikeshare supply, and, using both trip history data and census data, provides a more nuanced evaluation of bikeshare demand that allows for a comparison of program goals. Through this evaluation transportation practitioners and researchers can obtain a better understanding of who bikeshare serves well and who is underserved. After providing a brief background on the bikeshare system in Washington, DC, Capital Bikeshare (CaBi), this paper provides a review of the literature, describes the methodology and data, and explains the results with some discussion before concluding.
Docked Bikeshare in Washington, DC
Beginning operation in 2010, Washington, DC’s CaBi was one of the first publicly owned docked bikeshare systems in the United States (US). Initially available in Arlington, VA and Washington, DC, the system has since expanded into Alexandria, Falls Church and Fairfax in Virginia as well as Montgomery County in Maryland with over 4500 bikes and almost 700 stations (Lyft, 2021a). Figure 1 shows how the CaBi stations are dispersed through Washington, DC (as this paper focuses on Washington, DC, stations outside of the district are not shown). Stations within Washington, DC are owned by the District Department of Transportation (DDOT) with system operations, including maintenance and rebalancing, managed by Motivate LLC (Lyft, 2021a). Expansion and siting decisions are also under DDOT’s purview (Kittelson & Associates, 2020). Capital Bikeshare locations in Washington, DC (made by author using Government of the District of Columbia, 2022).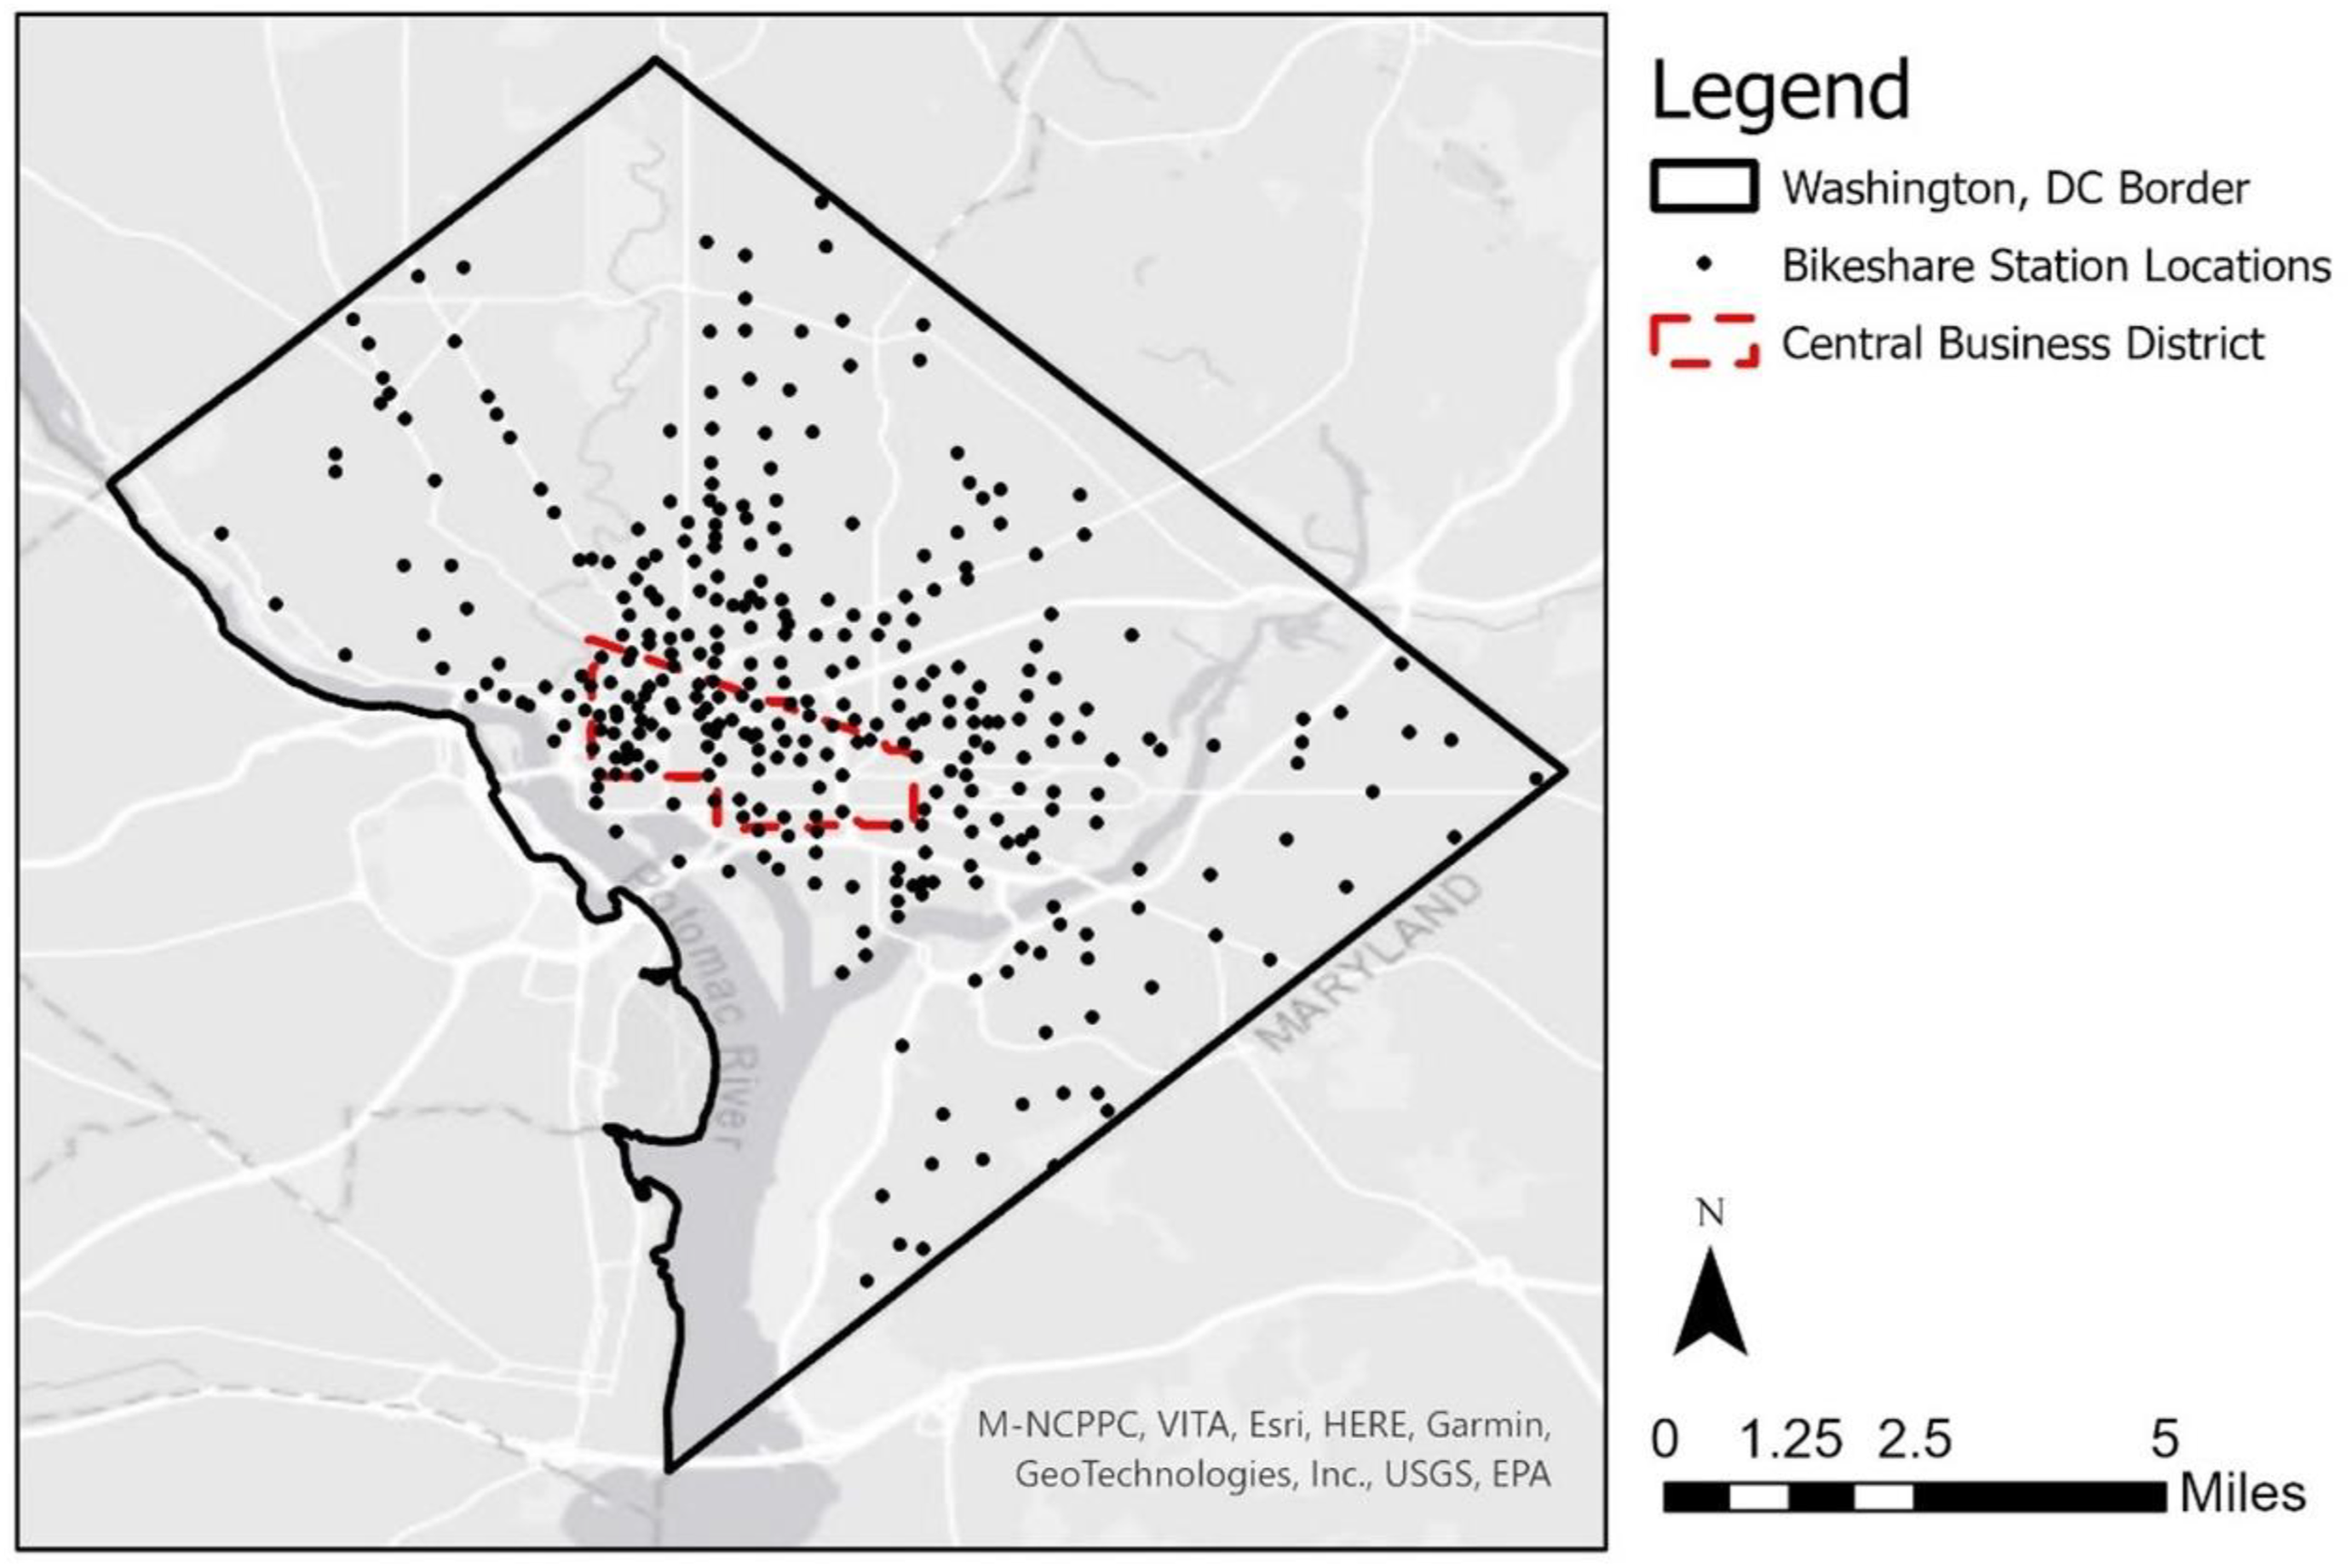
Equity is an important goal for the system, as outlined in DDOT’s draft bikeshare development plan (Kittelson & Associates, 2020). However, the inequity of the system has been the subject of past analysis and criticism. In 2019 the Urban Institute (Su & Wang, 2019) performed a spatial analysis of CaBi where researchers evaluated how bikeshare varied across the city. The study showed census tracts with higher white populations and higher incomes had higher average station counts and recorded higher bikeshare use. A survey of CaBi members also found users were more likely to be white, male, younger, and without access to a personal vehicle (LDA Consulting, 2017). Finally, a study by Virginia Tech (2012) also found CaBi users were more likely to be white and more likely to be better educated compared to Washington, DC census data. These results provide some indication as to how the current system may be inequitable.
Literature Review
Summary of Bikeshare Equity Literature.

aData was identified and available but not used in the evaluation of docked bikeshare.
This gap is an important limitation as it somewhat masks how supply varies with demand. Previous work generally focused on whether bikeshare supply existed, not how much supply existed or if it was adequate for the adjacent population. As a basic example, a bikeshare station with capacity for 10 bikes might be insufficient for a population of 30 people but it might be adequate if it were replaced with a bikeshare station with capacity for 40 bikes. The number of stations does not change but the bikeshare supply does. Much of the previous work does not capture these differences. Understanding how bikeshare supply varies with population can be key for understanding differences in usage, as discovered with research on London’s bikeshare system that found a connection between bikeshare supply in low-income areas and bikeshare use (Goodman & Cheshire, 2014; Ogilvie & Goodman, 2012). Overlooking bikeshare station capacity may consequently underestimate equity concerns.
Gini coefficients, a statistical measure of distribution that represents the degree of inequality in a resource distributed among a population, can highlight these equity limitations. The measure of supply can be designed to account for both bikeshare station accessibility as well as station capacity. Previous transportation research has used Gini coefficients and Lorenz curves to measure inequality in transit (Bertolaccini & Lownes, 2013; Delbosc & Currie, 2011; Hörcher & Graham, 2020; Lope & Dolgun, 2020) and bicycling (Wang & Lindsey, 2018; Wang & Lindsey, 2017). Wang and Lindsey have particularly focused on using these tools in bicycling. The authors have used Gini coefficients to evaluate access to bicycling facilities (Wang & Lindsey, 2017) as well as access to bikeshare stations (Wang & Lindsey, 2018) (see Table 1). Although their bikeshare research was subject to some of the same limitations around supply described earlier, their work is an important contribution to the use of Gini coefficients in transportation on which this paper builds.
Overall, while bikeshare equity literature is well-established, there are some limitations to existing methods that encourage additional research. By leveraging related research in transit, Gini coefficients and Lorenz curves can overcome these limitations to provide insight into both vertical and horizontal equity. This paper adds to bikeshare literature by filling a gap in bikeshare equity research and expanding on previous work on the use of Gini coefficients in bikeshare equity evaluation by using a more robust calculation of bikeshare supply. The paper also evaluates new data for understanding equity in bikeshare trip types as well as a more in-depth analysis of the CaBi system. Finally, comparing the two analyses might provide more insight into why some bikeshare inequalities exist.
Methodology and Data
Lorenz curves and Gini coefficients describe how a resource is distributed among a population using cumulative measures of supply and demand. Although these methods are primarily used for evaluating horizontal equity, previous transportation research has demonstrated that these methods could be used for vertical equity. As Wang and Lindsey (2017) put it, “for vertical equity, potentially disadvantaged or vulnerable groups should be provided with a higher quality or quantity of services than other advantaged groups.” These authors compared Gini coefficients among historically disadvantaged groups including zero car households, percentage of African Americans, percentage below the poverty level, and percentage of people younger than 18 or older than 65 years of age. Other transportation research has also used Gini coefficients to evaluate vertical equity. Lope and Dolgun (2020), for example, compared Gini coefficients to describe differences in tram accessibility for people with disabilities compared to the general population. Gini coefficients have also been used to show relative differences in income distribution between different country populations (see (OECD, 2011) e.g.). This paper uses Gini coefficients in a similar way, comparing coefficients to show relative differences between different populations.
For this paper, both supply and demand are estimated at the census block group level within Washington, DC’s borders. Gini coefficients are influenced by data granularity, the paper uses the smallest available geographic scale for the demand data. As Table 1 showed, some previous bikeshare research has also been performed at this scale. The following sections describe what data were used and how the results were calculated. To support the Lorenz curve and Gini coefficient results, multiple linear regression was used to show how bikeshare varies based on different attributes, with particular attention paid to historically disadvantaged populations.
Supply Data
Capital Bikeshare station data was obtained from Washington, DC’s open data portal (Government of the District of Columbia, 2022). These data are a snapshot of CaBi supply, including the location of a bikeshare station as well as its capacity (number of docks). The dataset includes 679 bikeshare stations with 344 accessible to Washington, DC residents. Bikeshare stations are assumed to be accessible within a quarter mile of the station, consistent with previous work (Bhuyan et al., 2019; Cohen, 2016; Qian & Jaller, 2020; Qian et al., 2020; Wang & Lindsey, 2018) as well as assumptions used by CaBi (Lyft, 2021b). These data were used to calculate a bikeshare supply index (BSI), a spatial measure of bikeshare supply. Equation (1) shows how BSI was calculated. Figure 2 provides an example of how BSI was calculated. Example supply score calculation with three bikeshare stations.
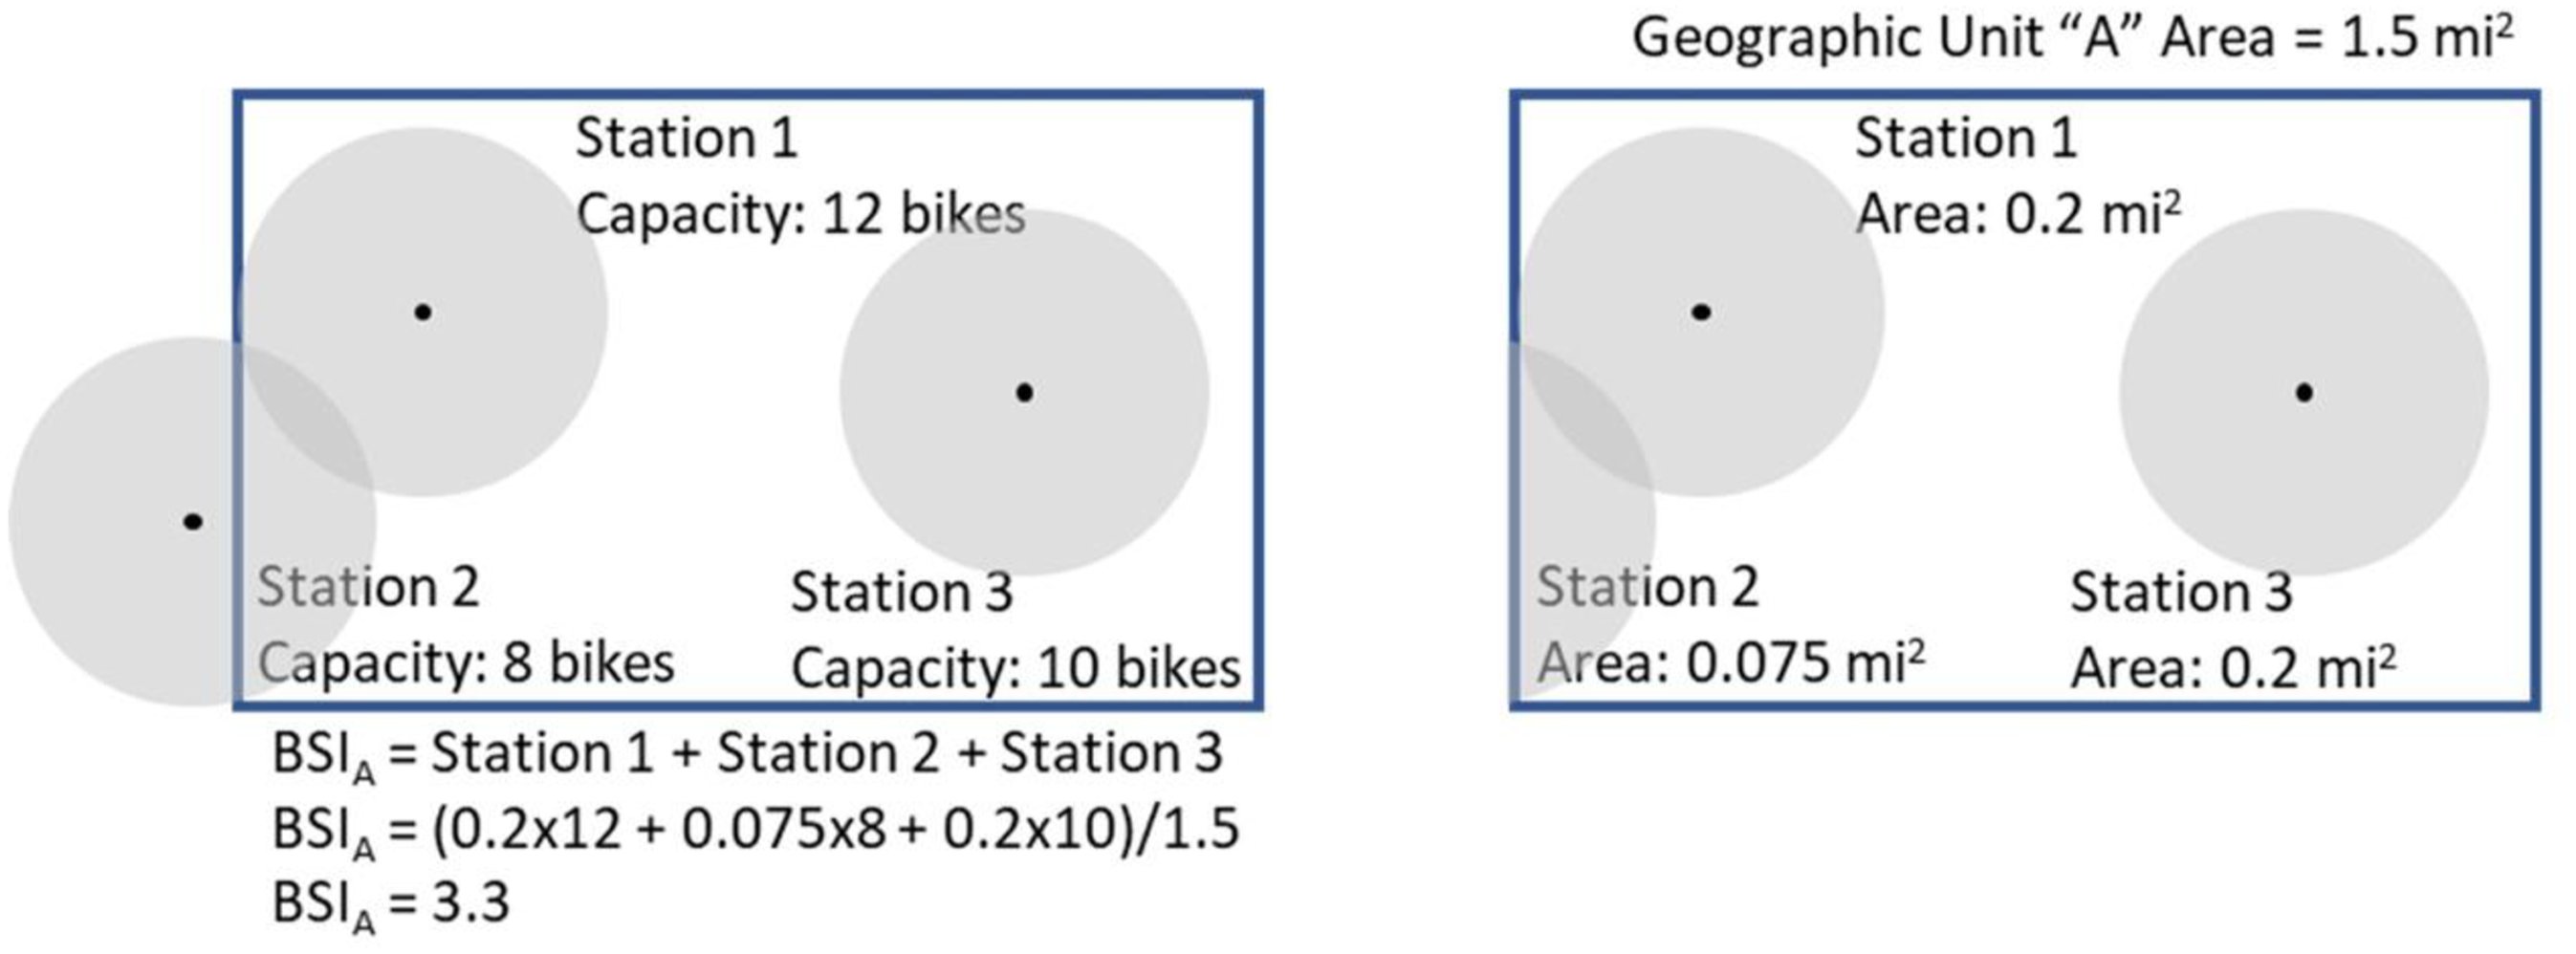
Coverage is calculated using .25 mile buffers around a bikeshare station. Importantly, a bikeshare station does not have to be within a GU for its coverage area to extend into that GU, as Station 2 in Figure 2 demonstrates. As previously mentioned, Wang and Lindsey (2018) have also calculated Gini coefficients and Lorenz curves for docked bikeshare. While this previous work used the same walk buffer, the authors used bike share stations as their measure of supply without accounting for the number of docks per station (effectively meaning all
Capital Bikeshare Trip Data Summary.
Demand Data
Two types of demand data were used for this evaluation. 2019 American Community Survey (ACS) 5-year Estimates were obtained at the census block group level, its most granular level, to ascertain which populations have more or less access to docked bikeshare. Specifically, in addition to total population, data were gathered for race, poverty level, and cars per household. These data allow us to see how bikeshare is distributed across historically marginalized populations including Black or African American populations, low-income residents, and zero car households. For the purposes of this study, low-income is defined as below 150% of the US poverty level. This threshold was used to reflect the fact Washington, DC’s median income is almost 70% higher than the national median income and is consistent with how low-income populations are defined by the Metropolitan Washington Council of Governments (MWCOG) Transportation Planning Board (TPB), the metropolitan planning organization (MPO) in which Washington, DC is located.
The second form of demand data is trip history data available from the CaBi data webpage (Lyft, 2021b). Trip history provides a form of revealed preference demand, allowing us to see how supplied bikeshare can serve different types of trips. There are three purposes to evaluating the distribution of bikeshare trips against the supply of bikeshare. First, a horizontal equity evaluation of trips against bikeshare supply can give a high-level understanding of the inefficiency of station siting. A higher Gini coefficient might indicate some bikeshare stations have more capacity than is needed while other bikeshare stations are underserved, suggesting changes to existing bikeshare infrastructure, or the siting decision process, might be required. Second, the comparison of Gini coefficients can provide a relatively quick and simple assessment of how well a program is meeting its goals. For example, if a program goal includes designing a system around shorter trips, then comparing Gini coefficients for different trip lengths can help us understand how well station siting is helping to meet that goal. Third, the evaluation of trip data against bikeshare supply can help us better understand user behavior. For example, a significantly different Gini coefficient for trips made during peak travel periods compared to off peak travel periods can help program administrators understand how and, to an extent, why their system is being used. This can inform both operational decisions, like rebalancing strategies, as well as future siting decisions. Understanding these differences could also help with program goals while helping program administrators understand why some horizontal inequities might exist. Finally, by repeating these evaluations over time, Gini coefficients provide a succinct indication of whether the efficiency of station siting and the achievement of program goals is improving.
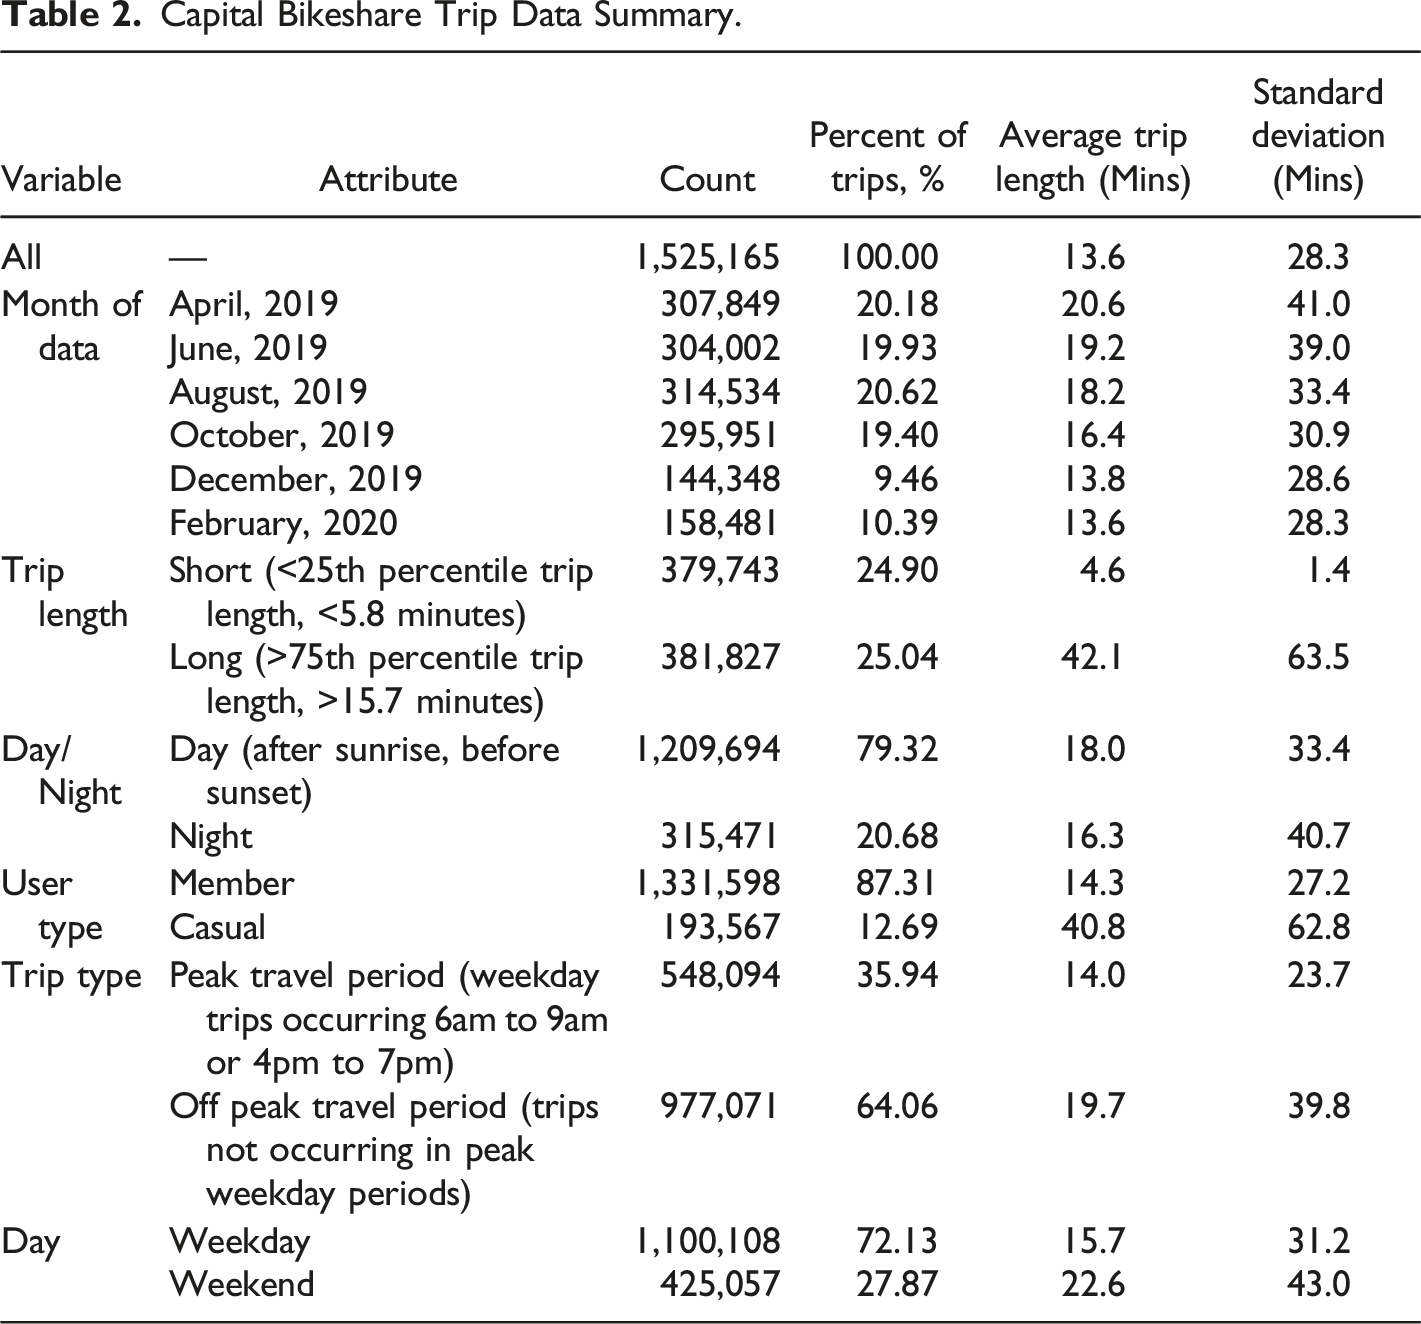
The trip dataset includes trip start time, end time, duration, starting station, ending station, and member type. This research uses every second month from April 2019 to February 2020, giving six months of pre-pandemic data, accounting for possible seasonal variations. The six months of data provided 1,734,029 trip records. As the study’s focus is Washington, DC, trip records were removed if they could not be matched to a bikeshare station or if the trip did not begin in the District, leaving 1,526,165 records. Because of the large number of records, the data was able to be split into five different trip characteristics. These trip characteristics are summarized in Table 2. Finally, after disaggregating data by trip characteristic, data were spatially joined to census block groups based on the location of the trip’s starting station to show where the bikeshare demand was concentrated. A limitation of these data is that they do not show unmet demand. However, the complementary analysis using census data fills this gap.
Lorenz Curve and Gini Coefficient Calculation
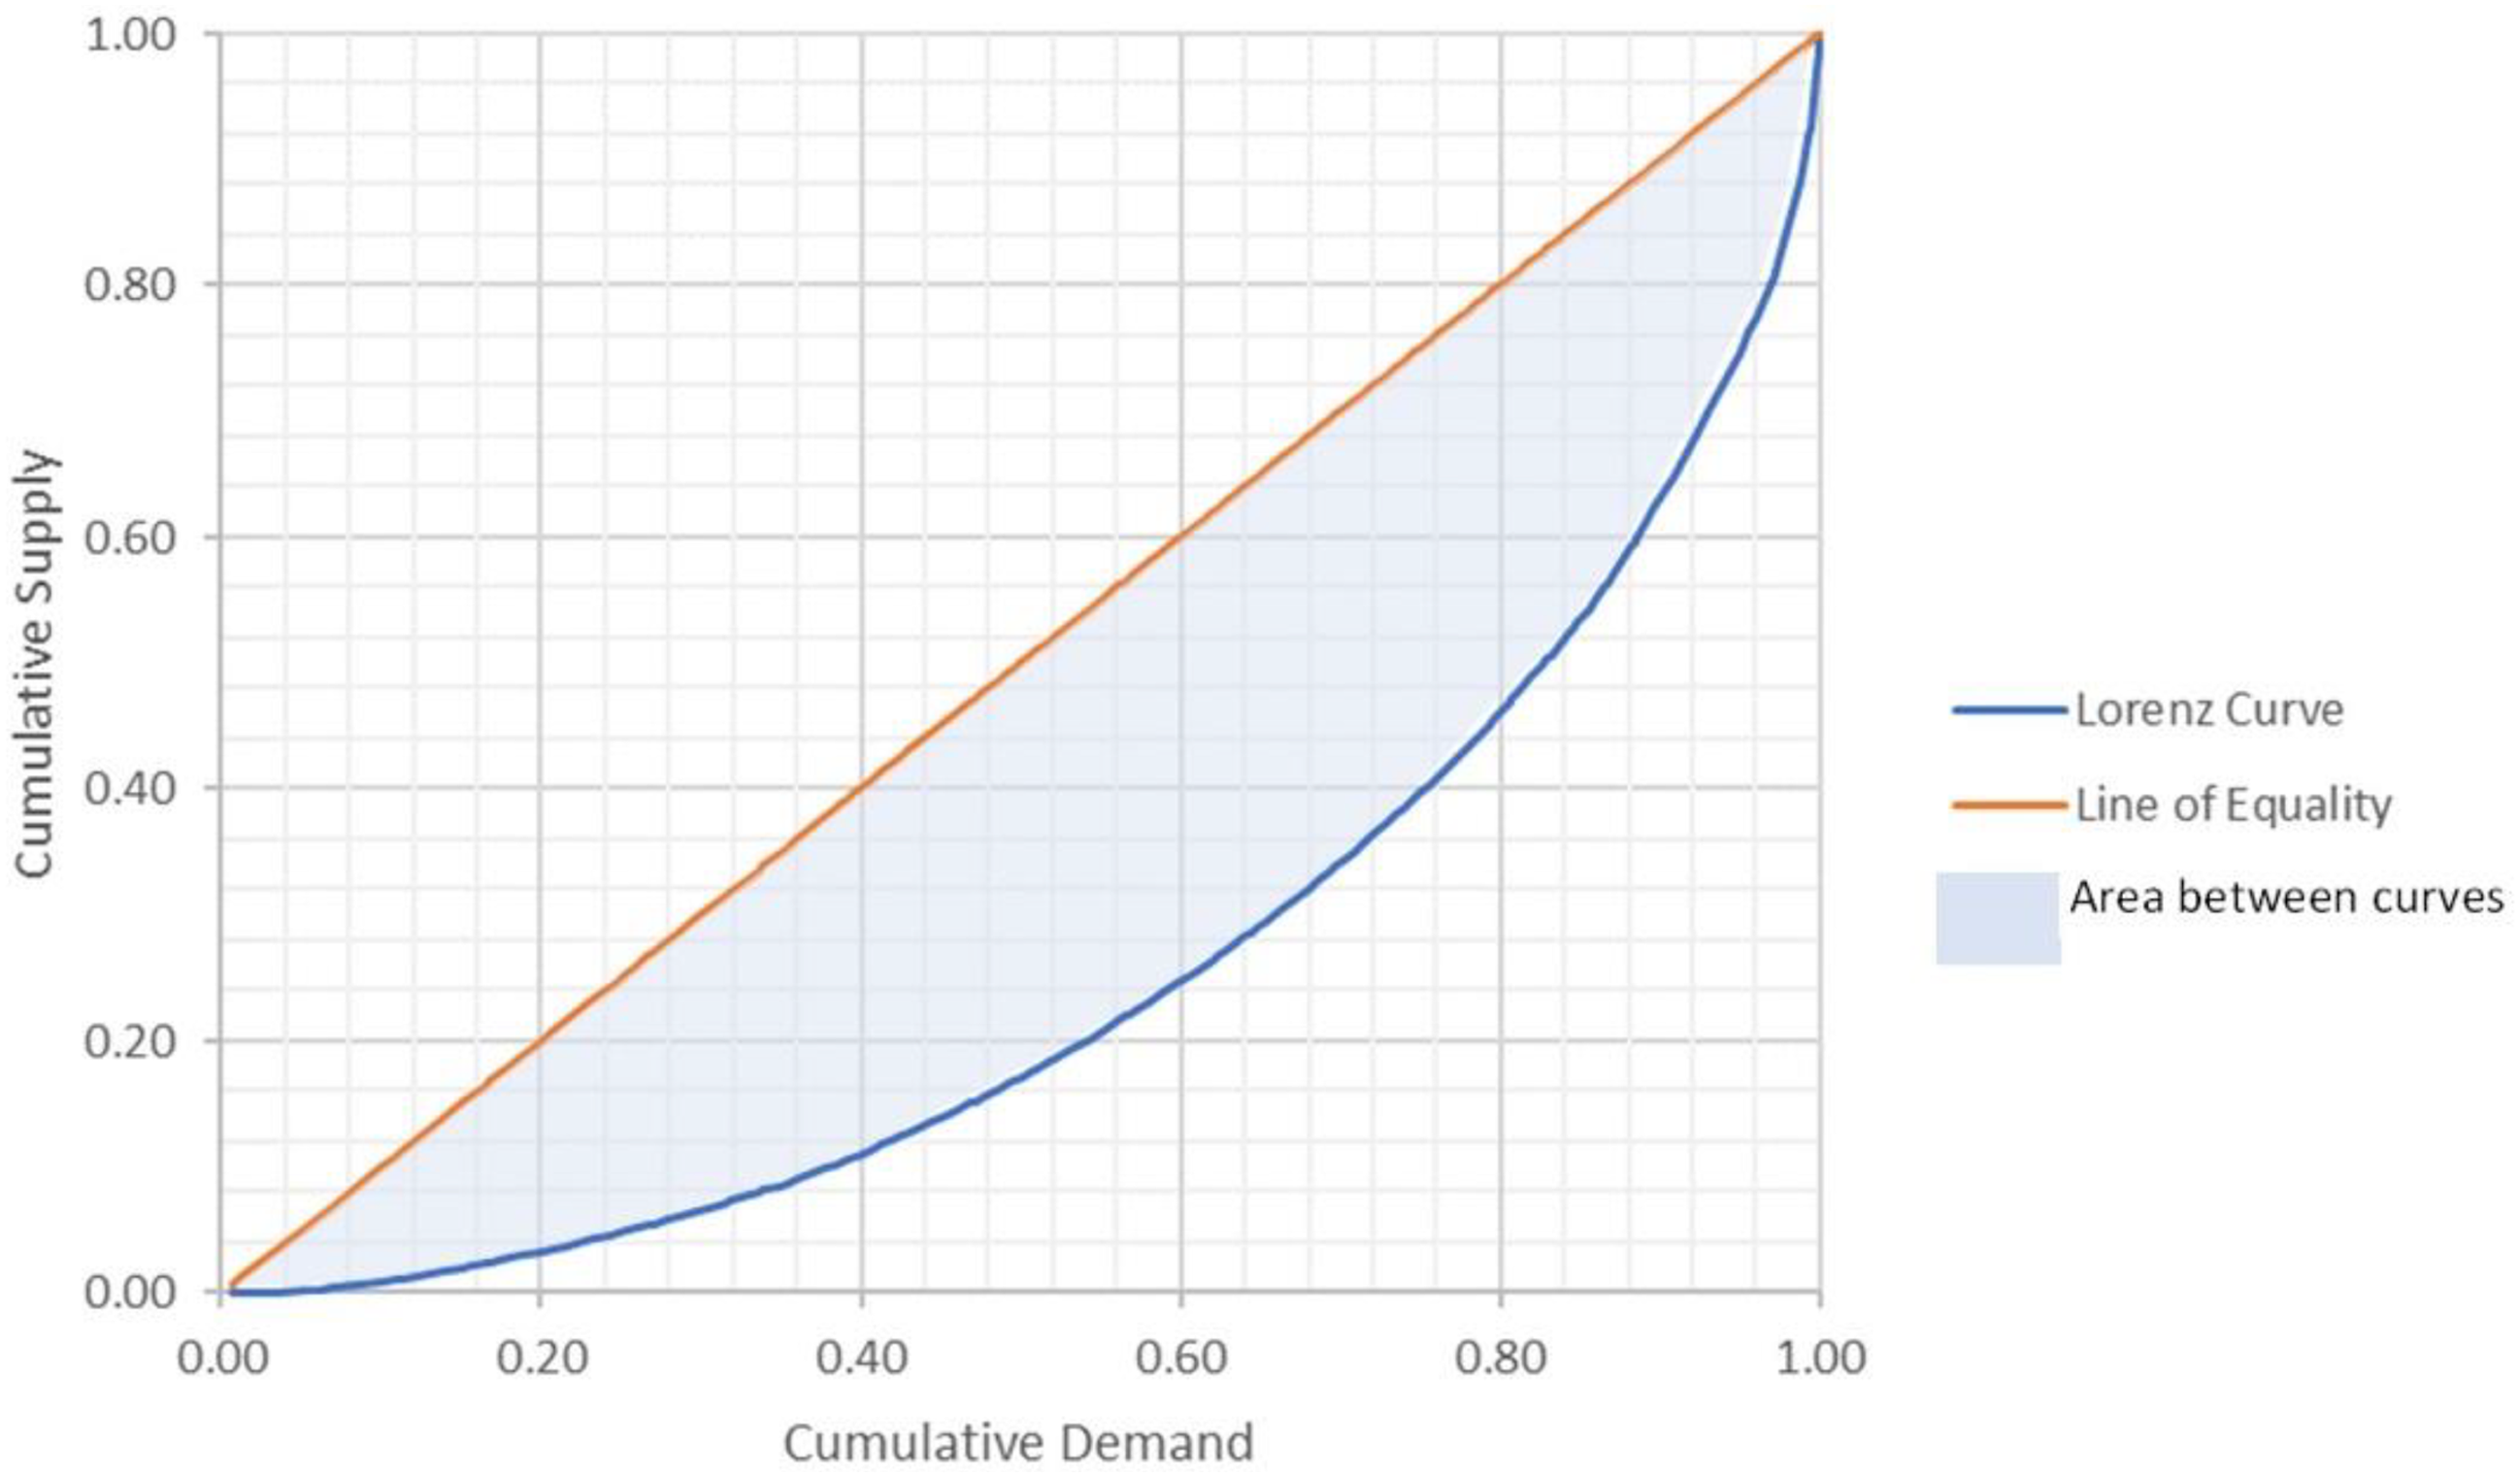
Once the BSI and demand data has been estimated for each block group, Lorenz curves can be generated. The supply and demand values are first sorted from smallest to largest. Next, each row of BSI data, which represents the supply data for a specific block group, is divided by the sum of BSI for all block groups. This gives the proportion of BSI for a specific block group. This is repeated for the demand data. Following this, cumulative supply data is calculated by creating a new column with each row summing the proportion of BSI for a specific block group with all of the block groups with smaller proportions of BSI. This process is repeated for the demand data to get cumulative demand. Finally, a Lorenz curve is created by plotting the cumulative proportion of bikeshare demand against the cumulative proportion of supply. These curves are interpreted by identifying a point on the line and reading it as X% of demand receives Y% of supply. Looking at the example in Figure 3, 60% of demand receives 25% of supply. Lorenz curves plotted against a line of equality, where cumulative demand matches cumulative supply, provides us with the information needed to calculate Gini coefficients. Equation (2) shows how Gini coefficients are calculated. Example Lorenz curve.
Multiple Linear Regression

Regression Variables.

Results and Discussion
The bikeshare supply index (BSI) was calculated for every census block group in Washington, DC and plotted in Figure 4. The graphic shows the highest scores appear around central Washington, DC, near the central business district and many of the major tourist attractions. The lowest BSI scores are observed on the periphery of the city. Medium-low scores were also observable to the north as well as the east and south where there are higher Black or African American populations. While there are small differences for BSI per capita, the general trends described do not change. These visual results support some of the previous empirical work evaluating bikeshare equity in Washington, DC. BSI by census block group for Washington, DC.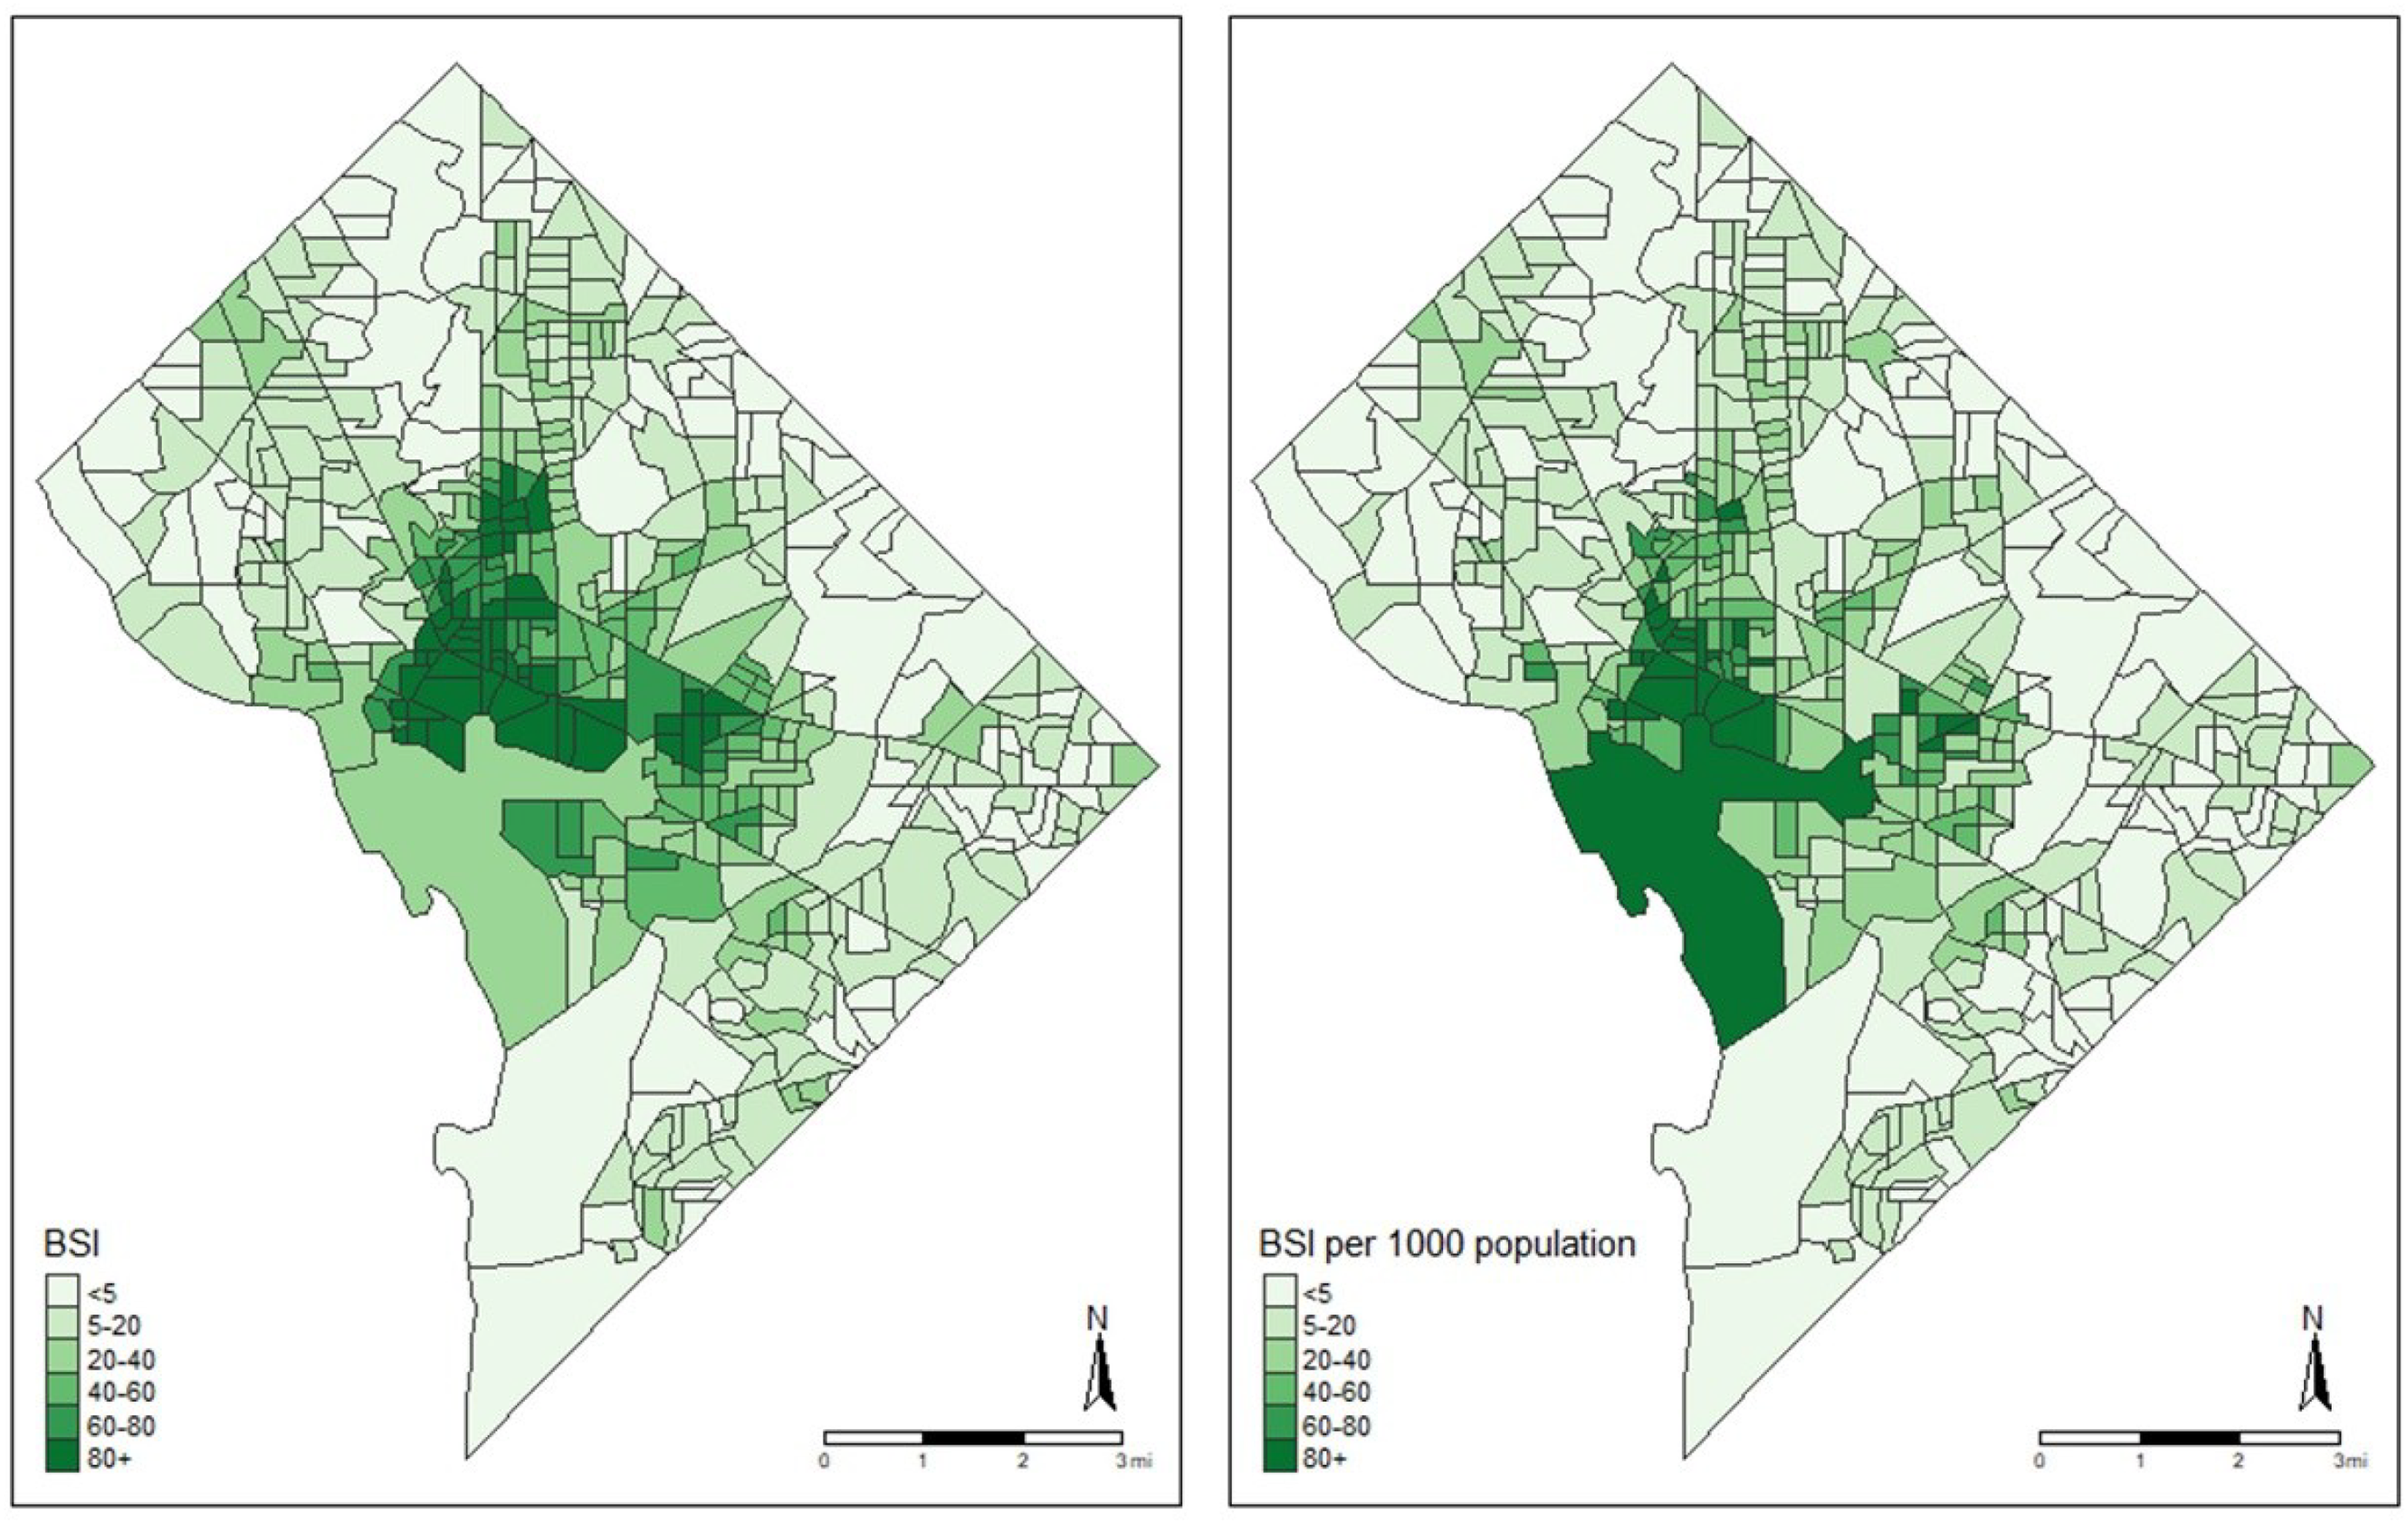
Lorenz curves were graphed for four population measures: total population, Black or African American population, low-income population, and zero car households, as shown in Figure 5. The difference between supply (BSI) and demand (population) indicates where there are bikeshare supply distributional inequalities. Table 4 shows the Gini coefficients for these curves, which indicate the degree of distributive inequality. To demonstrate the limitations with previous equity calculations highlighted in the literature review, Gini coefficients were calculated based on both station capacity (“Using Docks”) and just stations (“Using Stations; ” Lorenz curves for census populations. Gini Coefficients for Census Data.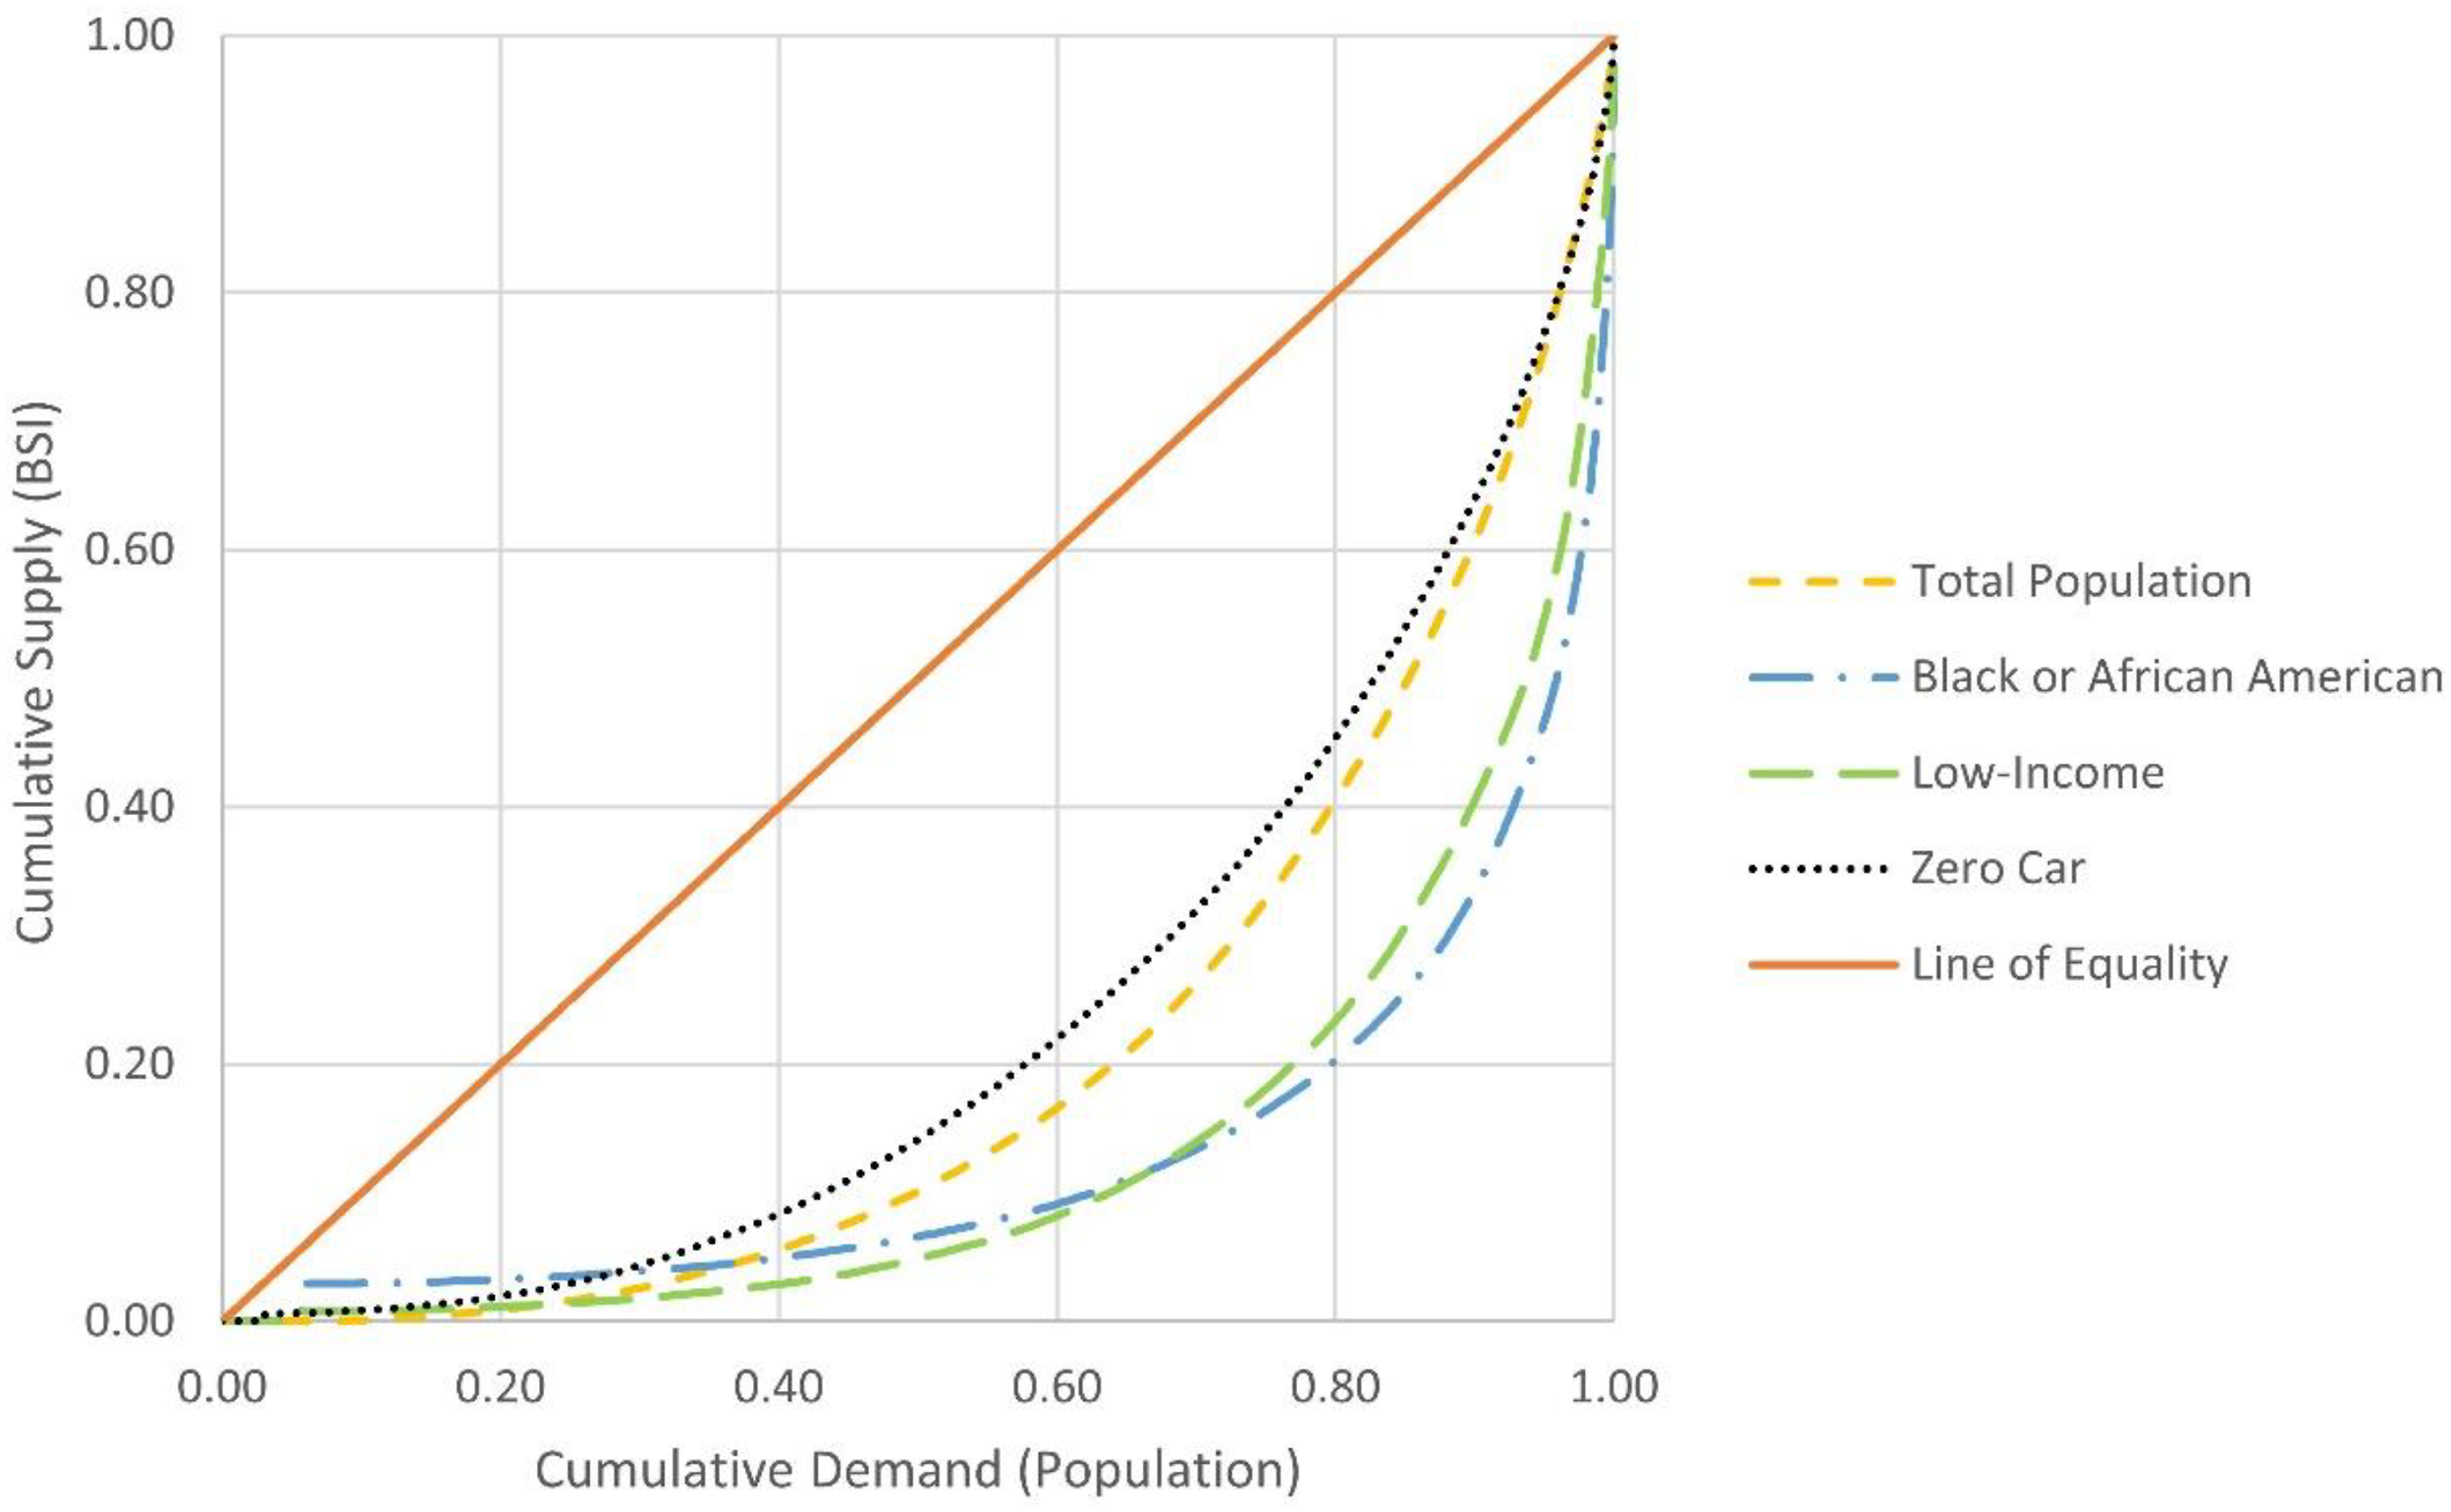
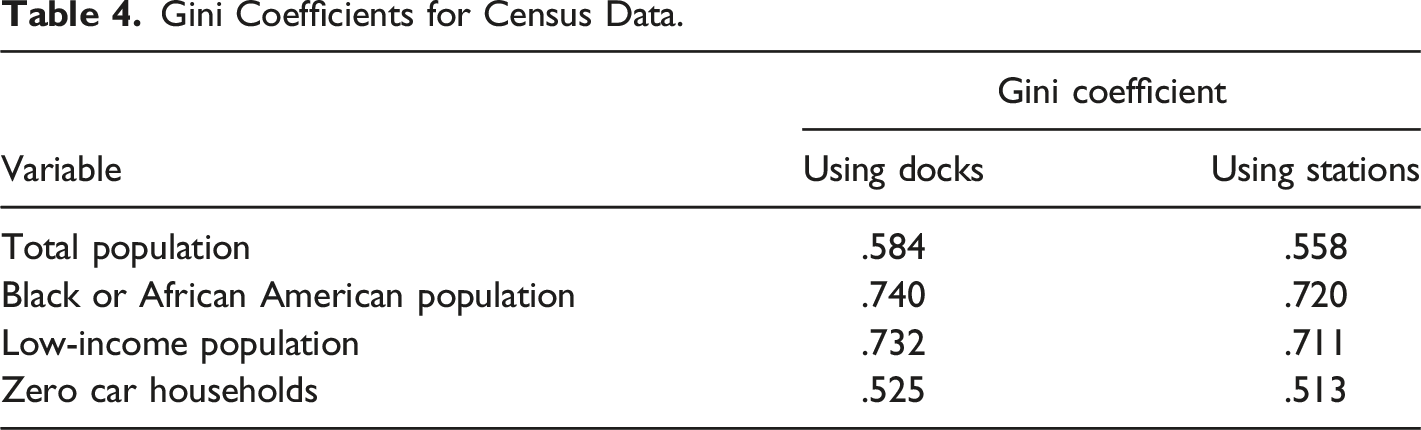
As Table 4 shows, using bikeshare stations rather than using station docks results in lower Gini coefficients (meaning more equitable bikeshare distribution). This indicates that focusing on stations rather than a more granular measure, like docks, might underestimate distributional inequity. In this case, using just stations underestimates Gini coefficients by about 2–5%, depending on the specific population. This is a useful finding because, in addition to showing limitations with how equity is measured, these results indicate distribution equity might be improved by increasing docks per station or strategic rebalancing policies, rather than the more time and resource intensive decisions around where a docking station should be placed.
Focusing on just the more nuanced measure of station capacity, Table 4 shows that the general population had a Gini coefficient of .584. Looking at the Lorenz curve in Figure 5, 60% of the total population had access to just 16% of bikeshare supply. As a majority of the population only has access to a small portion of bikeshare supply, these results indicate low horizontal equity.
As described earlier, vertical equity requires some groups have different quality of bikeshare supply due to differences in ability or need. For example, this may mean groups that are vulnerable or historically marginalized should be provided with more bikeshare supply than other groups (Delbosc & Currie, 2011). The Lorenz curves and Gini coefficients indicate how bikeshare is distributed among different vulnerable or historically marginalized groups in Washington, DC. As Table 4 and Figure 5 show, docked bikeshare in Washington, DC distributed differently across different populations. Although bikeshare supply is distributed better among zero car households than the general population, low-income populations and Black or African American populations have relatively less equitable distributions. While 60% of the general population has access to about 17% of bikeshare supply, 60% of low-income households have access to 8% of supply while 60% of the Black or African American population only has access to 9% of supply. The results for low income and Black or African American populations are consistent with the previous work (Su & Wang, 2019; Ursaki & Aultman-Hall, 2015). Conversely, 60% of zero car households have access to 22% of supply. The comparatively better result for zero car households is consistent with previous research (Wang & Lindsey, 2018). Overall, in addition to low horizontal equity, these results indicate low vertical equity for bikeshare in Washington, DC.
Comparison of BSI per Capita.
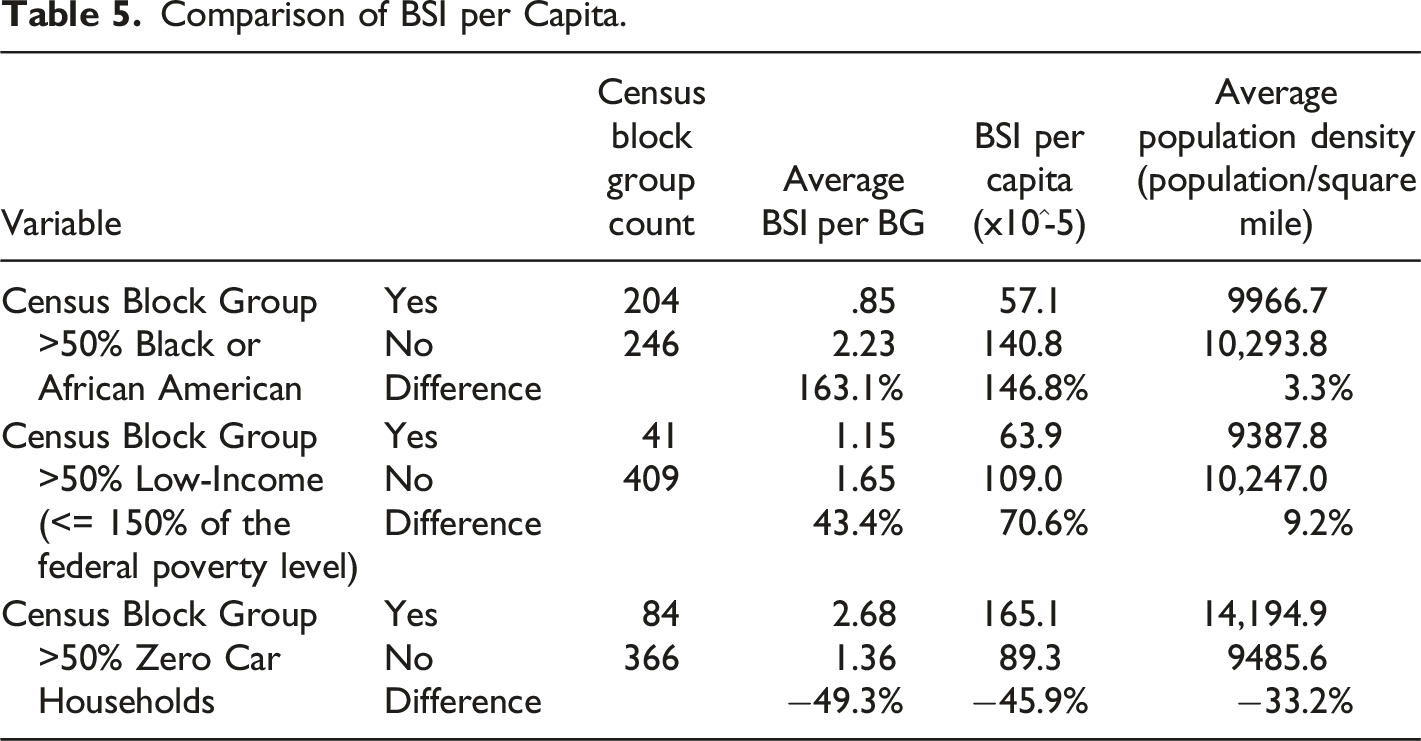
It is reasonable to think docked bikeshare might be sited in places with higher population density, meaning some of these differences might be explained by density. For example, zero car households might be benefitting from bikeshare supply because they tend to be in the densest residential areas of Washington, DC, areas that are well served by public transportation where a car is less needed. Population and employment density is also the principal component of high ridership estimates in the draft CaBi development plan (Kittelson & Associates, 2020). Consequently, calculations for average block group population density were also included in Table 5. As the results show, the magnitude of the differences is much smaller than for bikeshare per capita for census BG with majority Black or African American populations or majority low-income populations. This suggests that, while population density might play some role, it cannot explain the large differences in inequitable BSI distributions.
Some of these findings might also be due to docked bikeshare’s role as a first/last mile connection. For example, siting bikeshare stations near rail transit provides an opportunity for people using bikeshare to access train stations or complete their trips from a train to their final destination. These types of trip patterns are observed in CaBi member surveys with over 70% of respondents stating they use bikeshare to access transit (LDA Consulting, 2017). The colocation of bikeshare stations and WMATA Metrorail stations has been cited as a strength of the current system (Kittelson & Associates, 2020). However, while siting bikeshare near transit facilitates first/last mile connections, and may therefore be useful for generating trips, it may not be as conducive to achieving equity goals considering transit-accessible neighborhoods tend to be whiter and wealthier, especially neighborhoods near rail (Mckenzie, 2015). Thus, these results may be reflecting trade-off decisions between bikeshare productivity and equity.
Regression for Census Block Group Bikeshare Supply Index.
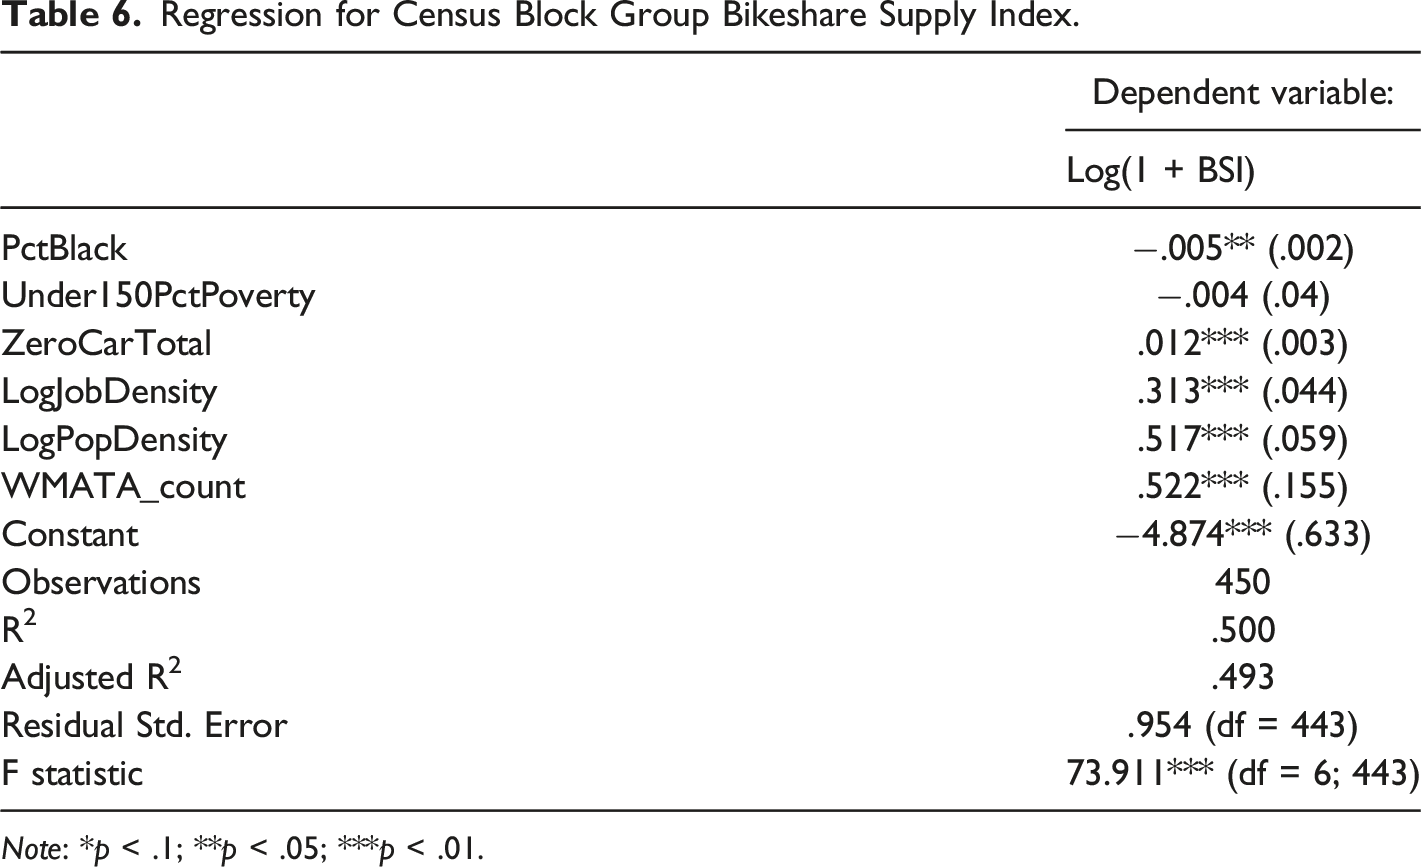
Note: *p < .1; **p < .05; ***p < .01.
As Table 6 shows, all variables except the poverty measure are statistically significant to the 5% level or better. As expected, the model shows changes in zero car households, job density, population density, and WMATA Metrorail stations are all positively correlated with changes in the BSI. The presence of WMATA Metrorail stations has the largest coefficient and is thus potentially the most useful for understanding changes to BSI. Changes in the proportion of Black or African American residents are correlated with a decrease in the change in BSI, aligning with the Lorenz curves and Gini coefficient results. Although the poverty variable coefficient was in the expected direction, it was not statistically significant, indicating it might be less useful for explaining differences in BSI. Poverty might have a lower correlation with BSI in the regression because of the inclusion of Black or African American populations who tend to have some of the lowest incomes in Washington, DC (DC Health Matters, 2021). Thus, some of the observed trends in the poverty Lorenz curves might be partially reflecting racial trends. The closeness of the poverty and Black or African American Lorenz curves in Figure 5 supports this explanation. Overall, the model explains about 50% of BSI variance while generally supporting the trends identified using Lorenz curves and Gini coefficients.
Gini Coefficients for Bikeshare Trip-Generated Demand.
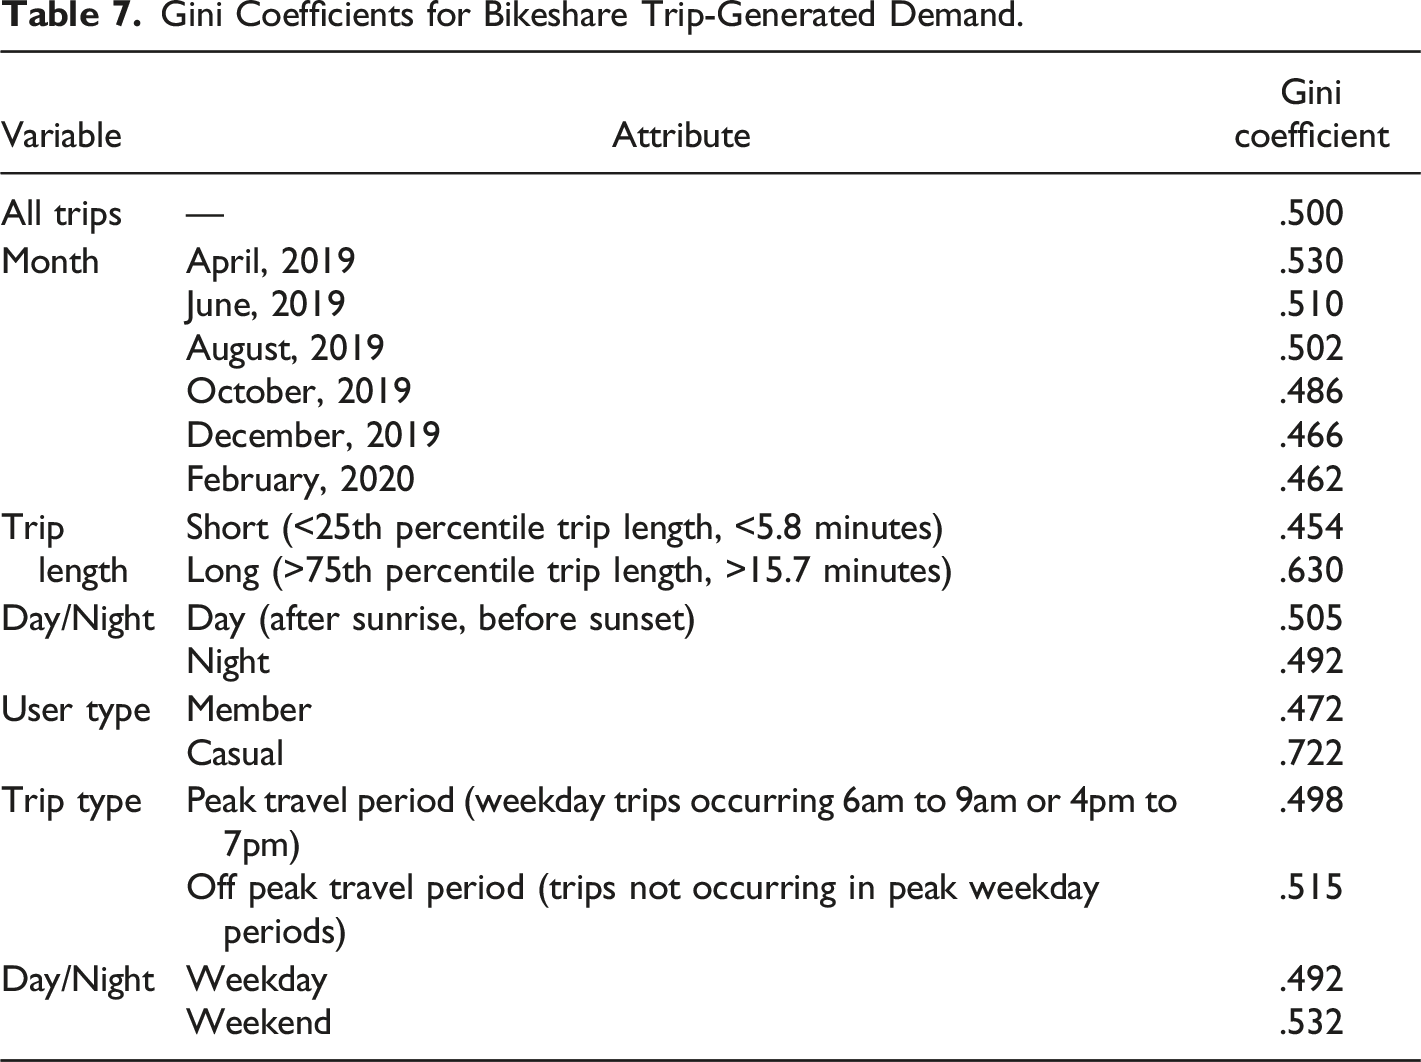
Overall, like with census data, there appears to be some horizontal inequality concerns with the trip data. However, as the months of data in Table 7 demonstrate, the distribution of BSI across trips is becoming more equitable over time, relatively speaking. An inspection of the data indicates this is possibly because more bikeshare stations were being installed over time. While April 2019 trip data connected to 291 unique bikeshare stations, February 2020 data included 305 unique bikeshare stations, although not all April 2019 bikeshare stations are reflected in the February 2020 dataset. As previously mentioned, the bikeshare location dataset did not include installation data so it was not possible to tell when bikeshare stations become available for use or stopped being used. While this data gap somewhat limits what can be learned from the results over time, the results do indicate that the changes in station siting are correlated with a better distribution of trips across bikeshare stations.
Looking at different trip characteristics, the results in Table 7 suggest CaBi supply is better distributed for people making shorter trips relative to longer trips. As the bikeshare program incentivizes shorter trips with its pricing strategy (LDA Consulting, 2017), these results indicate the siting of physical infrastructure support program goals around trip length. The average trip lengths in Table 2 reinforce this postulation. As Table 2 shows, average trip length decreases over the different months of data indicating the change to station siting appears to be making it easier for people to make shorter trips.
In addition to trip length, Table 7 shows CaBi provides a more equitable distribution of bikeshare supply for trips started during the night relative to day. This is somewhat unexpected as Table 2 showed almost 80% of trips occur during the day. However, the difference is small, suggesting there might not be much difference between trips at night and trips during the day. Trips taken during weekdays do have a more equitable distribution of bikeshare supply relative to trips on weekends, as expected. However, like with day and night, the difference is small. Finally, bikeshare supply is more equitably distributed for trips made during peak periods relative to trips made outside of peak commuting periods. As rebalancing information was not available, this analysis just used bikeshare station capacity without accounting for rebalancing differences. This could impact how many bikes are available, especially during peak travel periods. Overall, these three sets of results appear to indicate when bikeshare trips begin is not a significant factor in the equitable distribution of bikeshare supply.
As expected, Table 7 indicates trips made by CaBi members receive a better distribution of bikeshare supply relative to trips taken by casual CaBi users. As shown in Table 2, 87% of trips were made by members. This result also aligns with public statements from CaBi officials who have stated the program’s emphasis was on members, not casual users like tourists (Chester, 2013). As Table 2 also indicates, CaBi members have a significantly shorter average trip length than casual users. Thus, overall, these results suggest that CaBi bikeshare supply has been better designed to support trips made by members than casual users.
Although the two types of Gini coefficients cannot be directly compared, the summary results of the two types of demand data analyzed demonstrate that the distribution of CaBi bikeshare supply produces both horizontal and vertical equity concerns in Washington, DC, yet does not disproportionately impact system members. Rather, the results suggest that, over time, the system is being better designed for members who tend to make shorter trips. Thus, there appears to be a program conflict between achieving equity goals and serving the program’s members. This contrast is hinted at in CaBi member surveys which indicates members are “much more likely to be Caucasian” (LDA Consulting, 2017), even though this research has demonstrated areas with higher Black or African American populations receive a disproportionately low share of bikeshare supply. The propensity maps in the CaBi draft development plan (Kittelson & Associates, 2020) support the fact that goals focusing on ridership and revenue result in a different geographic emphasis than a focus on “public need,” where historically marginalized groups are counted. Thus, the persistence of bikeshare inequities in Washington, DC, even after over a decade of operation, may be partially explained by program goal conflict. One potential cause of goal conflict is the relationship between DDOT, who owns the bikeshare stations, and Motivate, who is in charge of system operations. Contracting out costs to a private organization might provide an incentive to focus on improving cost efficiency rather than social equity. Alternatively, goal conflict may be reinforced by policy feedback where people benefiting from the program might provide feedback to program administrators, either through their activities or through involvement in participatory processes, to shape a program in a way that further benefits them (Campbell, 2012). For example, program administrators may aim to support existing members with good bikeshare supply by upgrading bike capacity at stations with higher member use, which might in turn be good for member satisfaction and encouraging membership renewal. However, such a decision may draw limited resources away from areas with higher concentrations of historically marginalized groups, reinforcing spatial inequalities. In terms of Gini coefficients, it might mean that decreasing Gini coefficients for member trips might mean increasing Gini coefficients for Black or African American populations.
While past membership surveys and the results described from this research have indicated a clash between serving marginalized groups and serving program members, this does not necessarily need to be the case. As mentioned in the introduction, the placement of bikeshare stations has a direct impact on who can and who does use the system (Fishman et al., 2013, 2014; Ogilvie & Goodman, 2012; Willberg et al., 2021). Increasing BSI in Washington, DC, especially in census block groups with higher concentrations of historically marginalized groups, can expand accessibility, likely use, and potentially diversify what a CaBi member looks like. As a result, focusing on members after expanding coverage in areas with higher marginalized populations might not negatively impact equity goals as significantly.
Conclusion
The equitable distribution of docked bikeshare is an important issue for transportation decision-makers to consider. Unlike dockless bikeshare, the placement of docked bikeshare can have longer term community and user equity impacts. This study began with three goals to try and better diagnose and evaluate equity in docked bikeshare systems. First, while some work had been done using Gini coefficients in docked bikeshare, this study adapted the transit supply index from transit literature to provide a better measure of bikeshare supply (BSI). This more nuanced measure of bikeshare supply revealed previous evaluations of bikeshare using just bikeshare stations may have understated the severity of equity concerns. Second, this updated measure of BSI was used in the calculation of Lorenz curves and Gini coefficients to demonstrate bikeshare horizontal and vertical equity in Washington, DC. While horizontal equity concerns were demonstrated across the city, the lack of comparative access for low-income and Black or African American populations showed there are vertical equity concerns too. The supporting regression analysis particularly emphasized that increases in Black or African American populations are associated with a statistically significant decrease in bikeshare supply. Finally, Gini coefficients were calculated using trip data to better understand how the system is used. Over time, it appears horizontal inequity for bikeshare trips has been decreasing. With trips segmented into five different trip characteristics, this paper also demonstrated bikeshare in Washington, DC better serves short trips and trips made by members. No significant difference was found for trips made during peak travel periods, during night or day, or during weekdays or weekends.
Comparing the results for the two types of study populations suggests there may be conflicts between designing a system for members and designing a more equitable bikeshare system, especially for Black or African American residents living in Washington, DC. Policy feedback driven by current members could potentially reinforce spatial inequalities, making change more difficult. However, increasing bikeshare supply in neighborhoods with higher concentrations of historically marginalized populations can help to address this difference by helping to change what a CaBi member looks like. Overall, this paper further demonstrated how Gini coefficients and Lorenz curves can be useful tools for evaluating inequality in transportation systems.
Although this paper offers a more robust evaluation of bikeshare supply, it has limitations. First, in the study, bikeshare station capacity was assumed to be an adequate measure of bikeshare station supply. While this gives a more accurate sense of bikeshare supply than just the existence of a bikeshare station, as this paper has demonstrated, it does not reflect bicycle rebalancing efforts. Because of travel patterns, bikes can end up concentrated in some areas (Fishman et al., 2013), furthering inequality concerns, meaning rebalancing is a key equity activity. Consequently, a more accurate but more complicated evaluation would incorporate rebalancing throughout the day into the supply calculations. Second, the demographics of census block groups do not necessarily translate to the demographics of bikeshare users, especially as users many times do not look like the typical resident. This might indicate that the presence of bikeshare might sometimes not be enough, that there may be more than just physical barriers to access. Consequently, this work could be complemented by research that focuses more on demand equity (e.g., (Grasso et al., 2020)).
In addition to addressing these limitations, there are several avenues for future work. First, as electric bikes are becoming more ubiquitous, this type of evaluation could incorporate multiple types of bike power in the analysis. Second, while this paper focused on geographic equity, the literature review demonstrated there is also a need to look at bikeshare equity across programs. Third, this analysis could be repeated to see how equity varies over time with the potential to evaluate the effects of the COVID-19 pandemic on bikeshare. Fourth, while this paper has provided some evidence of a tradeoff between economic feasibility and equity in docked bikeshare programs, more research needs to be done in this area. Finally, due to the relative simplicity and accessibility of these methods, there is an opportunity to incorporate these methods into bikeshare siting decisions made by municipalities.
Footnotes
Acknowledgements
The author would like to thank Ralph Buehler and three anonymous reviewers for their insightful feedback.
Author Contributions
The author confirms sole responsibility for the following: study conception and design, data collection, analysis and interpretation of results, and manuscript preparation.
Declaration of Conflicting Interests
The author(s) declared no potential conflicts of interest with respect to the research, authorship, and/or publication of this article.
Funding
The author received no financial support for the research, authorship, or publication of this article.