
Abstract
Relative to studies of U.S. homicide trends, few have investigated cross-national trends. We explore hidden heterogeneity across a sample of 82 nations between 1980 and 2010, and examine (a) what distinct latent trajectories are represented among these nations? and (b) what structural factors characterize these latent trajectory groups? World Health Organization mortality data were used for the trajectory analyses wherein three distinct groups were identified. Structural characteristics of each group are compared to determine which factors account for their trajectories. Characteristics that predicted group placement include a development index, divorced males, female labor force participation, and Latin American region.
While the dramatic decline in crime during the 1990s garnered a great deal of scholarly attention in the United States (Baumer, Vélez, & Rosenfeld, 2018; Blumstein & Wallman, 2006; LaFree, 1999; Levitt, 2004), only recently have patterns of crime outside the United States been closely examined. In the 1990s, rates of homicide, burglary, robbery, and other serious crimes fell throughout the United States (Zahn & McCall, 1999; Zimring, 2007; see also Baumer et al., 2018). During the ensuing decade in which scholars widely debated the seemingly unique American crime patterns (see Farrell, Tilley, & Tseloni, 2014; Levitt, 2004; McCall & Hendrix, 2015), it slowly became apparent that declining rates of crime spanned across much of the Western world (Eisner, 2008; Rosenfeld & Messner, 2009; van Dijk, Tseloni, & Farrell, 2012; Zimring, 2007). As scholars turn their attention toward the broader cross-national context of the 1990s crime decline, it is necessary to outline the diverse patterns of crime across global regions for both substantive and theoretical understanding of trends in violent crime.
Although scholars have begun to identify cross-national patterns in homicide over the past few decades, criminological knowledge is still limited. Initial evidence suggests that the 1990s decline in homicide in the United States was mirrored by a similar pattern across Western Europe, Australia, Canada, and New Zealand (Eisner, 2008; LaFree, 2005; Zimring, 2007). The decline in homicide during this period was matched by declines in other crimes, including theft, burglary, assault, and auto theft (Tseloni, Mailley, Farrell, & Tilley, 2010; Zimring, 2007). However, outside of the highly developed Western democracies, there is evidence of disparate trends. Some nations have shown increases in homicide rates over this same period (Alvazzi del Frate & Mugellini, 2012; Ferreira, 2016; Tremaria, 2016) and scholars have noted distinctive trends in homicide rates organized by region (Baumer & Wolff, 2014; LaFree, Curtis, & McDowall, 2015; Rogers & Pridemore, 2017; Weiss, Santos, Testa, & Kumar, 2016) and by level of economic development (LaFree et al., 2015). While a few scholars have analyzed the crime decline in Western Europe and the United States (Buonanno, Drago, Galbiati & Zanella, 2011; LaFree et al., 2015; Rosenfeld & Messner, 2009), there is little in the extant literature examining the contours and causes of homicide trends in Africa, Southeast Asia, and Central and South America (see Rogers & Pridemore, 2017).
The current study is an attempt to build upon existing knowledge about homicide rate trends since the 1980s. Most notably, given evidence of disparate trends outside of wealthy Western democracies (Alvazzi del Frate & Mugellini, 2012; Baumer & Wolff, 2014; LaFree et al., 2015; Rogers & Pridemore, 2017), the current study examines homicide data from a total of 82 nations. Using latent trajectory/group-based trajectory models to expose “hidden” heterogeneity among nations from 1980 to 2010, the analyses below outline distinct trajectories of homicide rates across nations. By outlining trajectories and analyzing variation between nations within each latent grouping, this study demonstrates significant differences in homicide trends across this period. Overall, findings suggest that classic structural predictors and regional variation have influenced homicide trends across nations from 1980 to 2010. Before presenting the findings of this analysis, we briefly review the literature on historical homicide patterns.
Homicide Trends in Historical Context
Trends in Highly Developed Western Democracies
Beginning with post-World War II trends in homicide in the United States, two abrupt trend-reversals have been widely debated. The first, a sudden increase in homicide and other “street crimes,” occurred in the 1960s and 1970s (Cohen & Felson, 1979; LaFree, 1998), perplexing scholars of the era (Wilson, 1975). Homicide rates in the United States effectively doubled within the 20 years between 1960 and 1980 (Zahn & McCall, 1999). Anti-poverty and anti-discrimination legislation of the era suggested that the “root causes” of crime were being addressed. However, rises in crime persisted, contradicting popular explanations linking poverty and disadvantage to criminality (Wilson, 1975). From the mid-1970s to the early 1990s, rates of violent crime vacillated and then peaked in the United States.
The increase in crime during the 1960s and 1970s was followed by a second trend reversal during the 1990s which culminated in a precipitous decline in the rate of violent crime. The 1990s crime trends are now referred to as the “great American crime decline” (Zimring, 2007). Initially, the increase in homicide rates (during the 1960s and 1970s) and decline in homicide rates (during the 1990s) were interpreted as a uniquely American phenomenon (cf. Gurr, 1981). Explanations of the decline in crime are pervasive, but most early explanations offered by American scholars focus on historical circumstances specific to the United States (see Blumstein & Rosenfeld, 2009; Farrell et al., 2014; Levitt, 2004; McCall & Hendrix, 2015, for reviews).
It gradually became apparent that the pattern in American homicide trends is not entirely unique. Although the national homicide rate in the United States is elevated in comparison with its Western European counterparts (Messner & Rosenfeld, 1994), the contours of homicide trends in the post-World War II era are quite similar across Western democracies (Eisner, 2008; LaFree et al., 2015). Just as in the United States, homicide rates in Western Europe began to increase in the 1960s and 1970s (Eisner, 2008; LaFree et al., 2015). Rates of homicide remained elevated throughout the 1970s and 1980s, only to peak and then fall precipitously in the 1990s throughout the “Western world” (Baumer & Wolff, 2014; Eisner, 2008; LaFree et al., 2015; van Dijk et al., 2012; Zimring, 2007). The decline in the 1990s has been followed in the 2000s by a generally stagnating or gradually declining trend across most Western nations (Baumer & Wolff, 2014; LaFree et al., 2015), although it should be noted that this trend has not been universal (Killias & Lanfranconi, 2012).
This instance of “elite convergence” in homicide trends among highly-developed Western democracies (LaFree, 2005) suggests that similar shifts in structural factors common to these nations contribute variation in homicide over time. The limited cross-national research on the 1990s crime decline suggests improving economic conditions, shifts in population demographics, and increases in imprisonment, and increasing security measures may have led to declines in crime. Improving economic conditions—including declining rates of consumer inflation (Rosenfeld, 2014), improving consumer sentiment (Rosenfeld & Messner, 2009), and reductions in poverty (Baumer & Wolff, 2014)—contributed to the declining rates of crime. In addition, there is some indication that an aging population and declines in urbanization are associated with declining rates of homicide from the late 1980s to the 2000s (Baumer & Wolff, 2014). There are inconsistent findings concerning rising rates of imprisonment, as scholars have noted declines in both property and violent crimes attributed to rising rates of incarceration in Western Europe and the United States (Buonanno et al., 2011; Dolliver, 2015; Rosenfeld & Messner, 2009), although there have been some disparate findings across larger samples (Baumer & Wolff, 2014). Finally, in very limited samples of nations, there is some indication that increasing security measures have contributed to declines in property crime during this period (Farrell, Tseloni, Mailley, & Tilley, 2011). Overall, limited research suggests that Western democracies experienced a decline in homicide rates due to similar structural changes across the past few decades.
Trends Outside of Western Europe
Shifting our attention outside of the highly-developed West, an overarching narrative on homicide trends becomes much more tenuous. For some nations, like Japan, homicide rates have been declining continuously since the 1950s and are among the lowest in the world (Roberts & LaFree, 2004). In other nations, such as several in Central and South America, homicide rates are chronically high (Nivette, 2011) and have even exhibited increasing trends in recent years (Ferreira, 2016; LaFree et al., 2015; Peres & Nivette, 2017; Tremaria, 2016). Some researchers have suggested that many non-Western nations exhibited similar homicide patterns during the 1990s (Alvazzi del Frate & Mugellini, 2012), but it is not entirely clear what is driving patterns of homicide in less economically developed nations.
The most convincing evidence concerns nations experiencing a sudden societal transition, such as those in Eastern Europe. Nations experiencing a transition from autocratic to democratic political systems have higher rates of homicide (LaFree & Tseloni, 2006), which is especially pertinent to post-Soviet nations in Eastern Europe. In both Russia (Kim & Pridemore, 2005) and other former Soviet nations (Stamatel, 2009), rates of homicide began to rise during the late 1980s and continued to rise into the mid-to-late 1990s. Surprisingly, the expected structural covariates of homicide, such as age-structure, income inequality, and divorce rate, did not exert a significant influence on the rising rates of homicide during this period across Eastern Europe. Instead, nations experiencing more dramatic economic and political reforms had more dramatic increases in homicide (Stamatel, 2009). In the late 1990s and early 2000s, rates of homicide in Eastern European nations began to decline, nearly a decade later than their Western European counterparts (LaFree et al., 2015).
Trends in Southeast Asia, Central and South America, and Sub-Saharan Africa are less clear. There has been some suggestion that there was not a consistent decline in homicide during the 1990s across these regions (Baumer & Wolff, 2014); in fact, nations in Southeast Asia and Central and South America have exhibited a distinct increase in homicide during the early decades of the 21st century (LaFree et al., 2015; see also Rogers & Pridemore, 2017). Recent nation-specific analyses of homicide trends in specific Latin American nations demonstrate that Brazil, Mexico, and Venezuela have experienced spikes in homicide, seemingly stemming from social disorganization, political ineffectiveness, and institutional illegitimacy (Ferreira, 2016; Peres & Nivette, 2017; Tremaria, 2016). Due to data limitations, it is unclear what homicide patterns exist in sub-Saharan Africa (see Rogers & Pridemore, 2017). Overall, there is relatively little research on cross-national trends in homicide in less economically developed nations.
Latent Trajectory Analyses of Crime Trends
To more effectively examine longitudinal variation in crime across a variety of national contexts, latent trajectory analysis can act as a tool to distinguish underlying patterns of homicide. Latent trajectory analysis allows researchers to categorize nations into groups based on pattern similarities over time by producing estimates of a nation’s likelihood of selection into a specific trajectory group. Subsequently, differences in patterns between groups can be assessed in relationship to theoretically driven covariates.
Latent trajectory techniques made their way into criminological analysis through examinations of distinctive offending patterns across the life course (D’Unger, Land, McCall, & Nagin, 1998; Nagin & Land, 1993). By separating juveniles by their offending patterns over time, researchers were able to distinguish between different typologies of offenders and examine differences in juveniles’ characteristics across offending groups. Recently, scholars have applied these techniques to aggregate data. An analysis of 157 U.S. cities from 1976 to 2005 documented differences across four distinctive groups of cities in the United States, showing higher rates of homicide across cities experiencing greater structural disadvantage (McCall, Land, & Parker, 2011). Additionally, scholars examining an increase in the aggregate homicide rate in Brazil have noted considerable variability across municipalities. The overall homicide rate in Brazil increased substantially from 1991 through 2010; however, municipalities with higher levels of social disorganization (lower socioeconomic status, greater family disruption, ethnic heterogeneity, etc.) experienced greater increases in homicide rates. Some municipalities with less social disorganization actually experienced homicide rate declines over the period (Peres & Nivette, 2017).
Inspired by previous research on latent trajectories in crime research, scholars have recently examined cross-national variation in homicide trends. Weiss and colleagues (2016) applied latent trajectory analysis to a sample of 53 nations with homicide data spanning from 1990 to 2005. The authors uncovered hidden heterogeneity within the sample and documented four distinct trajectories. There was evidence of a (slight) decline in homicide rates across the three lower rate trajectories, while nations in the highest trajectory exhibited a stable to increasing trend. Although the authors highlight the diversity of trends across these nations, there is little indication of what factors, other than world region and homicide rate, resulted in nations being selected into specific trajectory groups.
Expanding on Weiss et al. (2016), the current analysis contributes to the literature on cross-national homicide trends in at least three ways. First, we employ a larger sample that includes 82 nations, capturing homicide trends from a wider variety of countries and regions than most cross-national studies of homicide trends (see Nivette, 2011). Second, we examine the 31 years from 1980 and 2010, which is longer than most other homicide trend analyses. Finally, we examine structural covariates that distinguish among trajectory groupings and provide further information on the correlates of distinctive homicide trends during this period.
Data and Method
Homicide Rate Trends
Below, we explore hidden heterogeneity in homicide trends within a sample of 82 nations from 1980 to 2010. Annual data for total intentional homicides used in the latent class trajectory procedure (also referred to as growth curve modeling) are derived primarily from the World Health Organization’s (WHO; 2017) mortality statistics, which is regarded as the most reliable source of homicide cause-of-death data for cross-national comparison (Kanis, Messner, Eisner, & Heitmeyer, 2017; LaFree & Tseloni, 2006). 1 While recent research suggests that other sources of homicide data, such as estimates derived from the United Nations, are equally valid and reliable in recent years, WHO data have proven to be the most reliable over time and are therefore well-suited for time-series analyses (Andersson & Kazemian, 2017). The original sample of nations for which WHO mortality data were available included 92 countries, but missing data for explanatory variables reduced the sample to 82 countries.
Efforts were made to obtain uninterrupted time series; therefore, we supplemented missing WHO data with data from the United Nations Office on Drugs and Crime’s (UNODC; 2013) Annual Survey on Crime Trends and Operations of Criminal Justice Systems and with the National Research Institute of Legal Policy’s Comparative Homicide Time Series (NRILP-CHTS). We used UNODC data for 69 missing data points (2.7% of total sample), NRILP-CHTS for 14 country-years (0.6%), and linear interpolation for 27 cases (1.1%) for which single years were missing within a series. The UNODC source is comprised of information retrieved via surveys of criminal justice officials regarding criminal offenses reported to the police and other court and correction figures. Unlike WHO cause-of-death mortality data, “intentional homicide” data collected by the UNODC represent offense rather than victim counts. The NRILP-CHTS source is compiled from publicly available national and international sources for public health and crime. More comparable with the WHO data than the UNODC, data retrieved from the NRILP-CHTS for this study are based on cause-of-death data and reflect completed intentional homicides by victim. 2
Of the 2,542 country-years represented for our sample of 82 countries across 31 years, 1980-2010, there are 165 years (6.5%) for which we were not able to complete the homicide time series data—the most problematic are the years before 1985 wherein 3.4% of the total cases are missing. Fortunately, the trajectory procedure allows the inclusion of countries despite an interrupted time series. Because homicide is a rare event with periods of extreme high or low homicide rates, 3-year moving averages of the homicide rate trends were computed and used for the trajectory analyses. To the extent that data were available for 1979 and 2011, these data were used when the 3-year moving averages were calculated to retain cases for our 31-year time frame. This results in 2,280 country-years for the trajectory analyses. Because of the skewed distribution of these homicide rates, the 3-year moving averaged homicide rates are transformed using the natural logarithm.
Structural Indicators
The structural covariates employed in this study are well-established in the cross-national homicide literature (Baumer & Wolff, 2014; LaFree, 1999; LaFree & Tseloni, 2006; McCall & Brauer, 2014; Messner & Rosenfeld, 1997; Nivette, 2011) as well as a measure of the shadow economy, or underground economy, which has not been widely used in this literature (Elgin & Oztunali, 2012). These classic covariates of homicide represent such theories as Durkheim’s (1933) modernization, Cohen and Felson’s (1979) routine activities perspective, Merton’s (1938) strain/anomie (absolute and relative deprivation), and social disorganization and include total population (demographic control), GDP per capita in constant U.S. dollars (modernization), infant mortality rate (absolute deprivation), percentage of the population which are males ages 15 to 29 (routine activities), Gini index of income inequality (relative deprivation), female labor force participation rate (routine activities), percentage of males age 15 and above who are divorced (social disorganization/family disruption), sex ratio (demographic control), percentage of the total population living in urban areas (modernization), and net migration (social disorganization). In addition, we attempt to assess the impact of the shadow economy in nations as an indicator of limited legitimate labor market opportunities and of illicit trade. The measure of the shadow economy (also known as the “black market”) accounts for all goods and services traded outside of the official, government sanctioned, economy. The shadow economy is estimated as total economic output taking place outside of the official economy as a percentage of GDP (Elgin & Oztunali, 2012). The size of the shadow economy has been used as a proxy for problems associated with institutional illegitimacy (Tuttle, 2017), hypothesized to increase violence as individuals lacking legitimate means of redress are theorized to be more likely to use violence to resolve disputes (Black, 1983).
Theoretically, all covariates outlined in the previous paragraph, with the exception of GDP per capita, are posited to have positive associations with the homicide rate, with caveats. Despite the well-documented propensity of males (vis-á-vis females) to commit violent crime, several cross-national analyses have documented a negative association between homicide rates and the sex ratio (Messner, Rafflalovich, & Shrock, 2002; Messner & Rosenfeld, 1997; Pratt & Godsey, 2003; Pridemore, 2008; Weld & Roche, 2017). The negative association between the sex ratio and the homicide rate in aggregate research may be due to greater family disruption in locales with more females-to-males (Messner & Sampson, 1991). Therefore, without an adequate control for family disruption, the sex ratio may be negatively associated with homicide rates. In addition, despite a long-standing hypothesis that urbanization is associated with higher rates of crime (Wirth, 1938), the effect of urbanization on homicide is not clear in the cross-national literature, as scholars have found both positive and negative associations between percent urban and homicide rates, as well as no significant relationship (Trent & Pridemore, 2012). Finally, while traditional social disorganization theory predicts that net immigration causes homicide rates to increase, recent theory and research in the United States suggests that immigration may contribute to crime rate declines (Ousey & Kubrin, 2009, 2018), possibly due to increased informal social control exerted by a greater number of two-parent families among immigrant groups (Ousey & Kubrin, 2009).
We also include a dummy region measure for Central American, South American, and Caribbean Island nations because many of these countries have extremely high homicide rates (Nivette, 2011). In addition, because Columbia’s homicide rates are much higher than many other Latin American countries in this time series, we multiply Columbia’s homicide rates by .5 to bring these values closer to other Latin American countries’ rates for the purposes of efficiently determining unique trajectory groups. 3
The sources for the covariates employed in this study include the World Bank; World Development Indicators (World Bank link); Health, Nutrition and Population Statistics (World Bank link); United Nations Statistics Division; United Nations University–World Institute for Development Economics Research’s (UNU-WIDER; 2015) World Income Inequality Database (WIID3c); and Elgin and Oztunali (2012). The appendix provides details on these sources and measurement of the covariates. Structural covariates are used in the second stage of our analyses wherein logistic regression techniques are employed to determine which social and economic forces determine country membership in different trajectory groups. For these purposes, each covariate is averaged across the 31-year sample period to create the measures employed in those analyses. In our efforts to retain as many countries as possible, countries were included if they had at least one valid data point for each variable. The most problematic measures regarding missing data were the Gini index, the shadow economy, percent divorced males, and female labor force participation rates. There are 17 countries that had at least one variable with no valid cases which resulted in 65 countries available for the logistic regression analyses. 4
Preliminary analyses revealed high bivariate correlations among the covariates—a common feature of aggregate-level analyses (Land, McCall, & Cohen, 1990). Efforts to find model specifications which provided stable, robust findings led to our employment of principal components analyses to reduce regressor space and problems associated with collinearity. These efforts resulted in our creation of an index, labeled “development index,” which reflects characteristics of developing countries—that is, high values on our index indicate lower levels of economic development. Factor scores associated with the component indicators included positive values for the Gini index, percent males 15 to 29, infant mortality rate, shadow economy, and a negative factor score for GDP per capita. The development index is an additive index of these five variables weighted by their factor score. 5 It is not theoretically satisfying to replace these classic covariates with this index because we are unable to assess the unique contributions of each of these components in our analyses, but for this collection of countries and for this time frame, it was methodologically required. The need to employ this index may have been fortuitous in that the second stage of our analysis involved limited sample sizes, thus restricting the degrees of freedom. In addition to the homicide rate, the total population variable is also transformed using the natural logarithm because of its nonlinear association with the homicide rate.
In the first stage of the analysis, we use Stata’s (version 12 SE) “traj” procedure by Jones and Nagin (2013) for group-based modeling of longitudinal data. This procedure allows us to determine whether there is evidence of hidden heterogeneity among the countries in our sample with respect to the magnitude of and temporal trends in homicide rates. We can also ascertain the number and nature of latent groups or classes of countries that emerge by using this procedure. This technique has primarily been applied to micro-level studies, though it is increasingly being applied to aggregate-level analyses across neighborhoods (Stults, 2010), cities (McCall et al., 2011), and municipalities (Peres & Nivette, 2017). In this study, the procedure is used to determine the nature of time trajectories among nations over time (Baumer & Wolff, 2014) and to identify the number and nature of trajectories of cross-national homicide rates in relation to the crime decline (Weiss et al., 2016). The second stage of the analysis employs binary logistic and ordered logistic regression techniques to identify those covariates which determine the placement of countries into distinct trajectory groups. The results from our analyses are described in the following section.
Results
Figure 1 displays the overall average homicide rate trend and the average regional homicide trends for our sample of countries resulting in the following regional representations: (a) the Americas (including Central America, South America, Canada, the United States, and the Caribbean Islands), (b) Western Europe and the Middle East, (c) Eastern Europe and the Russian Federation, and (d) Asia and Pacific nations. 6 Note that we have divided the homicide rates for the American region by .5 so the variation in the lowest homicide trend regional group is not totally masked by the scale required by the high-rate American group.
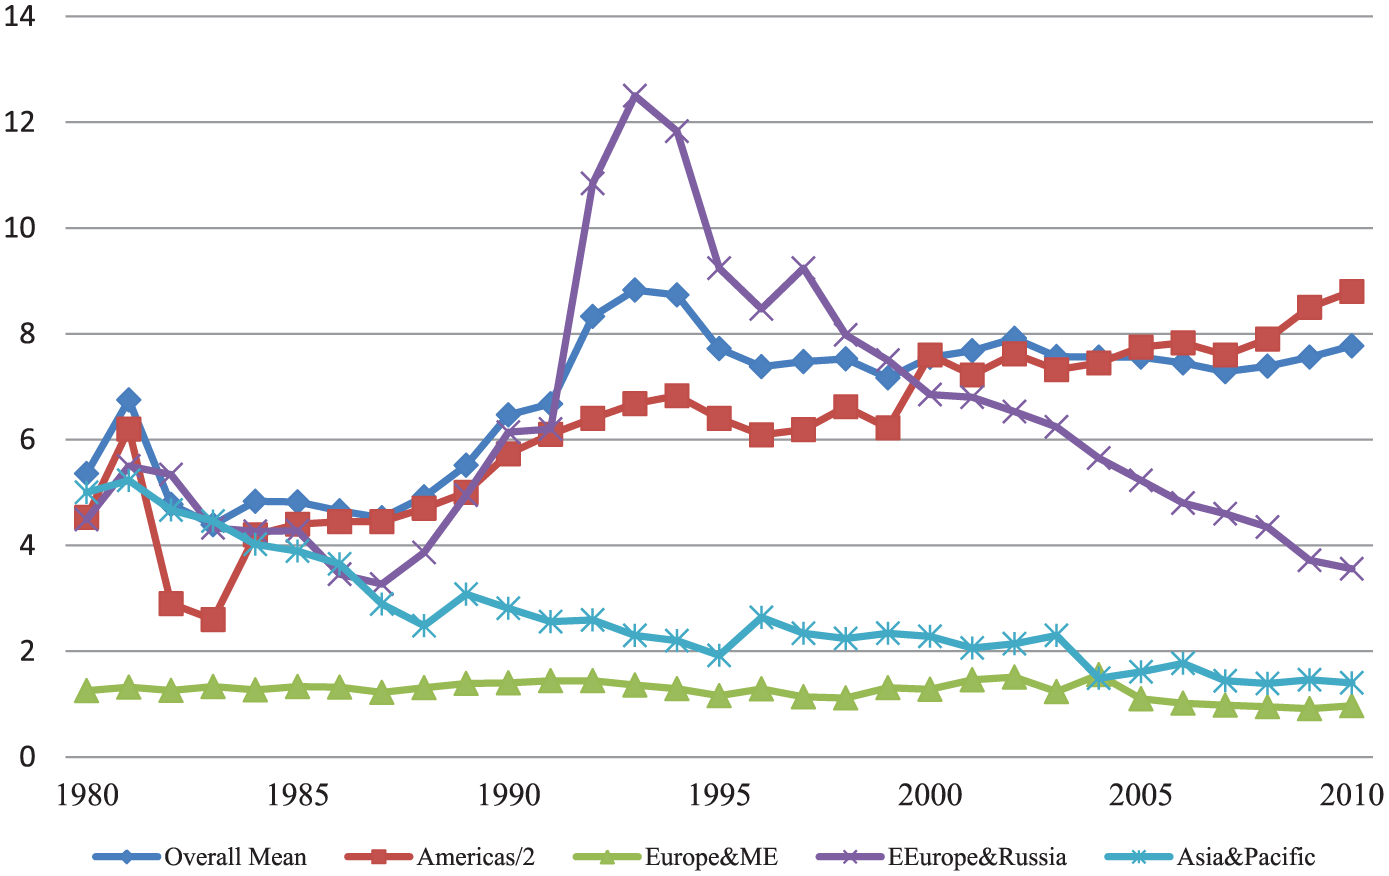
Average homicide trends by region and overall.
Focusing first on the overall homicide trend, there is initial variability—up then down around six homicides per 100,000 population—in the early 1980s after which the trend peaks in 1993 with a homicide rate around 9. The trend then drops until 1996 to around 7.5 homicides per 100,000 population and then vacillates between 7.5 and 8 until 2010. The patterns by region are quite distinct from one another although most begin the series with a homicide rate of approximately 5. This figure demonstrates the diverse nature of global homicide trends among our sample of nations particularly before the mid-1990s. The general trend pattern across these regions is a decline after 1995, with the exception of the trend for the American region, which plateaus or increases in recent decades. The trajectory procedure described next will reveal latent groupings of countries that share similar homicide rates and trends over time.
Latent Class Trajectory Analysis
Table 1 presents the parameter estimates generated by the trajectory procedure for annual national homicide rates with a three-trajectory model specification and polynomials of the second, fourth, and fifth orders in time (2 4 5) for the low- to high-rate trajectories, respectively. That is, a quadratic term for the low-rate group, quartic term for the medium-rate group, and a quintic (fifth order polynomial) term for the high-rate group best mirrored the observed rate trajectories for these three groups. The model was selected based on the statistical significance of the highest order polynomial, the Bayesian information criterion (BIC) statistic, and those predicted homicide rates which most closely modeled the observed rates. Among the four three-group models that were compared, the best fitting models were one with a (2 4 4) polynomial configuration with a BIC value of −1684.2 and the model (2 4 5) selected (displayed in Table 1) and graphically shown in Figure 2 which has a BIC value of −1685.6. Among the predicted homicide rates generated by these four trajectory models, those produced by the chosen (2 4 5) model more closely mirrors the observed rates than do those generated by the other model specifications. The difference between these BIC values is 1.4 which, according to Raftery’s (1995) guidelines, falls in the category of “not worth more than a bare mention” (p. 129; relative to larger discrepancies between BIC values considered “positive,” “strong” and “it is decisive” that the difference between the models is theoretically important). It should be noted that among the four models that were compared, all of the models assigned the same countries to the same three trajectory groups; therefore, there would be no substantive differences unique to which of these models we used and implemented in the logistic regression analyses.
Time Predictors Associated With Latent Group Membership With Low to High National 3-Year Moving Averaged Homicide Rates From 1980 to 2010 With Parameter Estimates and T-Values (in Parentheses), N = 82.
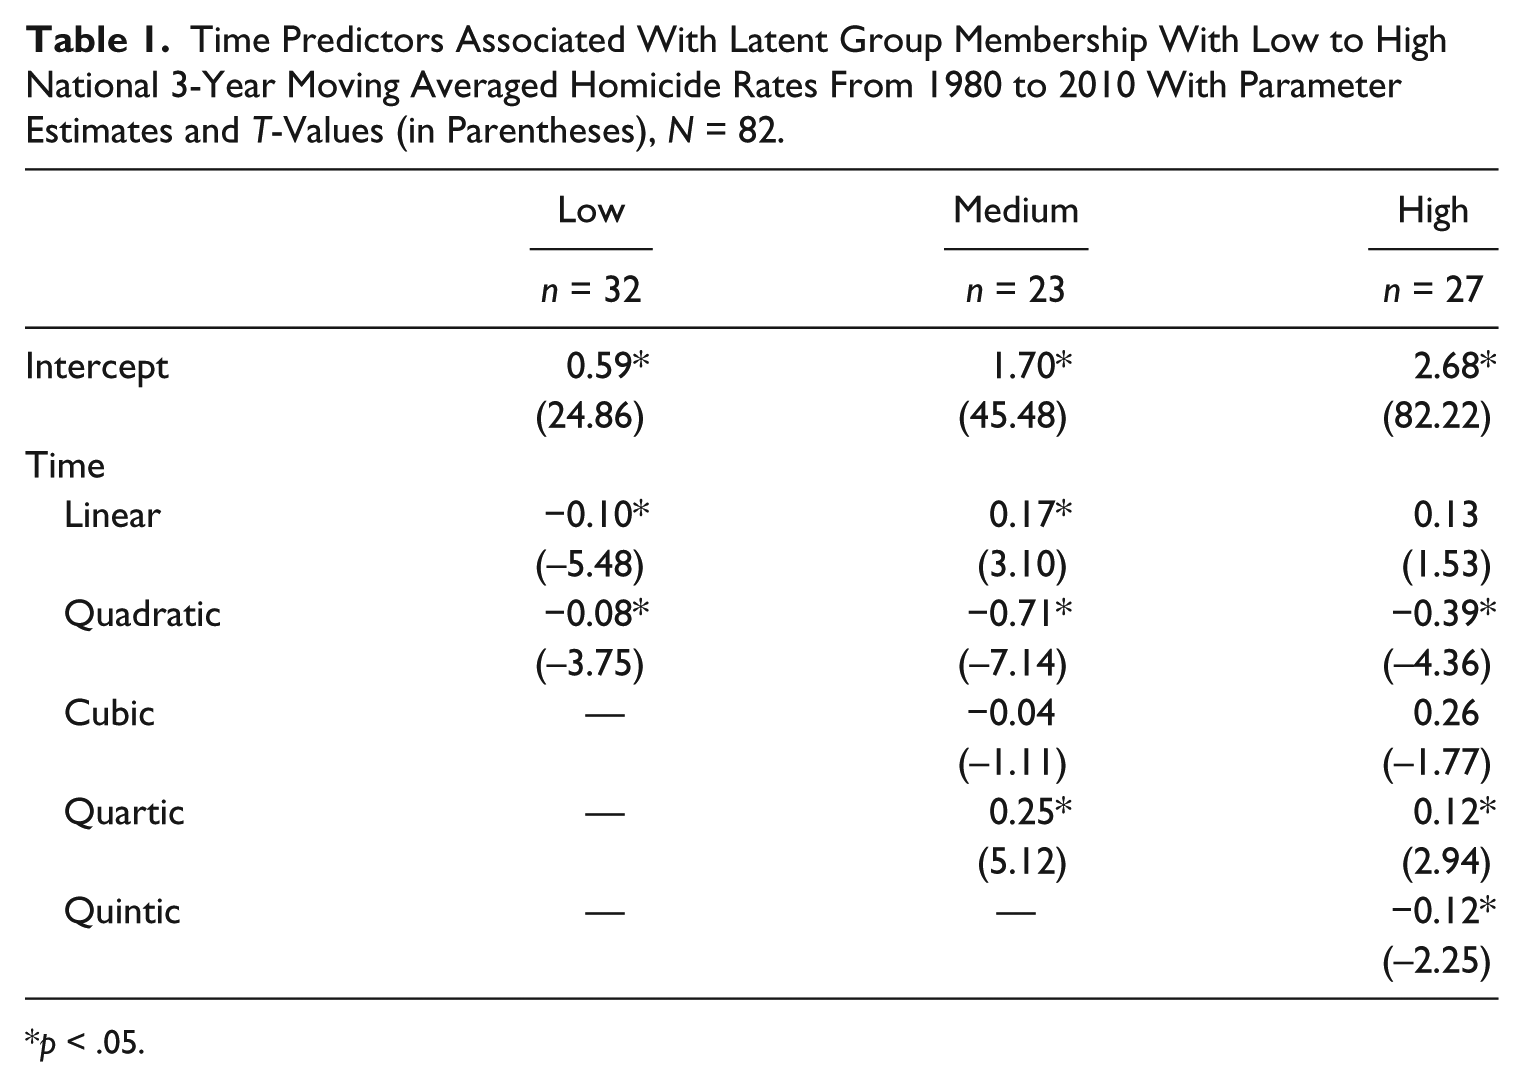
p < .05.
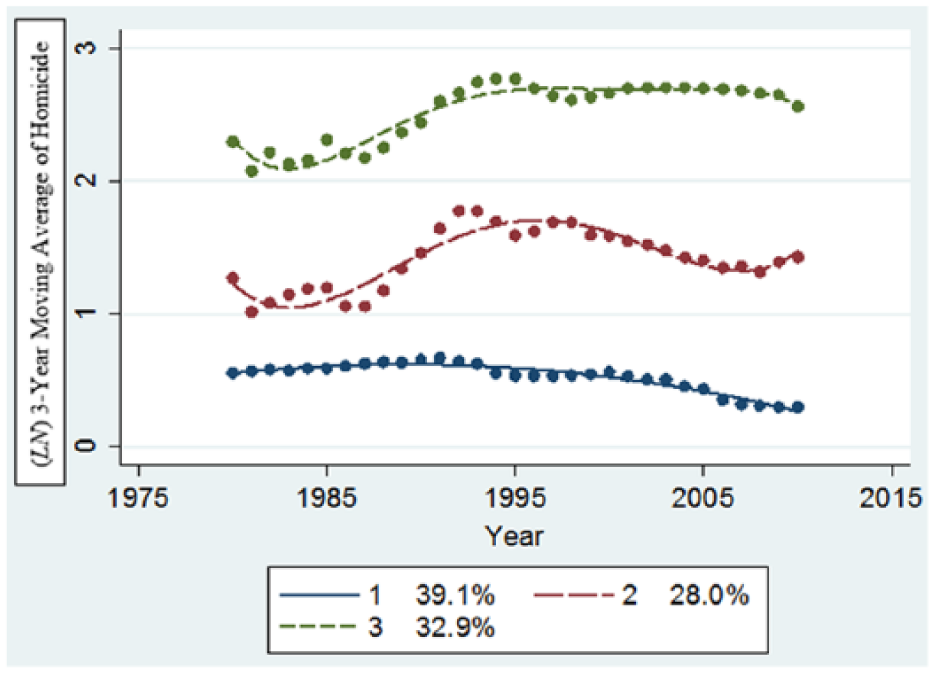
Average predicted and observed homicide rates for three-group quadratic, quartic, and quintic models, 82 nations, 1980-2010.
Figure 2 displays the three trajectories’ predicted (smoothed) and observed (dotted lines) average homicide rates among the countries within each trajectory group. Besides the obvious difference in the magnitude of the homicide rates among these three trajectory groups, some similarities emerge. All three groups share the same increase in homicide trends leading up to the early 1990s when they peak and then begin to decline. All three trajectories also share another increase beginning about 5 years later at different time periods—1998 (low-rate group), 1995 (medium-rate group), and 1999 (high-rate group). After the second peak, which occurs about 3 years after that increase, the low- and medium-rate groups begin a long decline, but the high-rate group maintains a fairly flat trend until the last year of the observation period when it drops. The medium-rate group ends its series with an increasing trend during the last 2 years and the low-rate group continues the decline until the last year when it plateaus. Although there are some parallels in the general shapes of these trajectories, particularly between the medium- and high-rate group trajectories, there are some notable distinctions. The high-rate group maintains a much higher rate than the other two groups’ trajectories after the first peak in 1993, the medium-rate group differs with its increasing trajectory after its 10-year decline through 2008, and the low-rate group reveals a fairly steady decline throughout the last 10 years of the series.
The countries comprising these three trajectory groups are listed in Table 2 along with the number of missing years’ worth of data for each country. The low homicide rate group is largely comprised of Western European, Middle East, and Asian countries. The medium-rate group contains nations located in Eastern Europe, the Caribbean Islands, and Latin America. The high-rate group is primarily comprised of Latin American, Eastern European, and Caribbean Island countries. This high-rate group also includes the Russian Federation and the United States. This trajectory group comparison elicits the question of how the component countries’ social and economic forces shape these trajectories.
Country Composition of Groups Identified From Latent Class Trajectory Analysis, 1980-2010, N = 82, Number of Missing Country-Year Homicide Data in Brackets.

Descriptive Review of Trajectory Group Homicide Rates and Covariates
As a preliminary analysis, we briefly review the three trajectory group means for the homicide rates, covariates, and components of the index included in those analyses. Table 3 displays the low-rate group in the first column, followed by the medium- and then high-rate groups in the second and third columns. The overall mean homicide rate for the low-rate trajectory group across all years and countries in the group is 1.3, that for the medium-rate group (5.1) is over 3½ times larger than the low-rate group, and the high-rate group’s mean homicide rate (17.1) is over 12 times larger than the low-rate group. When examining the homicide rates over time, the patterns reflected in Figure 2 are evident: the low-rate group decreasing over time from 1980 to 2010 from 1.3 to 0.9; the medium-rate group increasing over time from 2.7 to 6.1; and the high-rate group increasing between 1980 and 1995, from 16.7 to 20.7, and then decreasing slightly by 2010 to 16.9.
Group Means a and Standard Deviations for Homicide Rates for Various Years, Covariates, and Index Components Included in Logistic Regression Models.
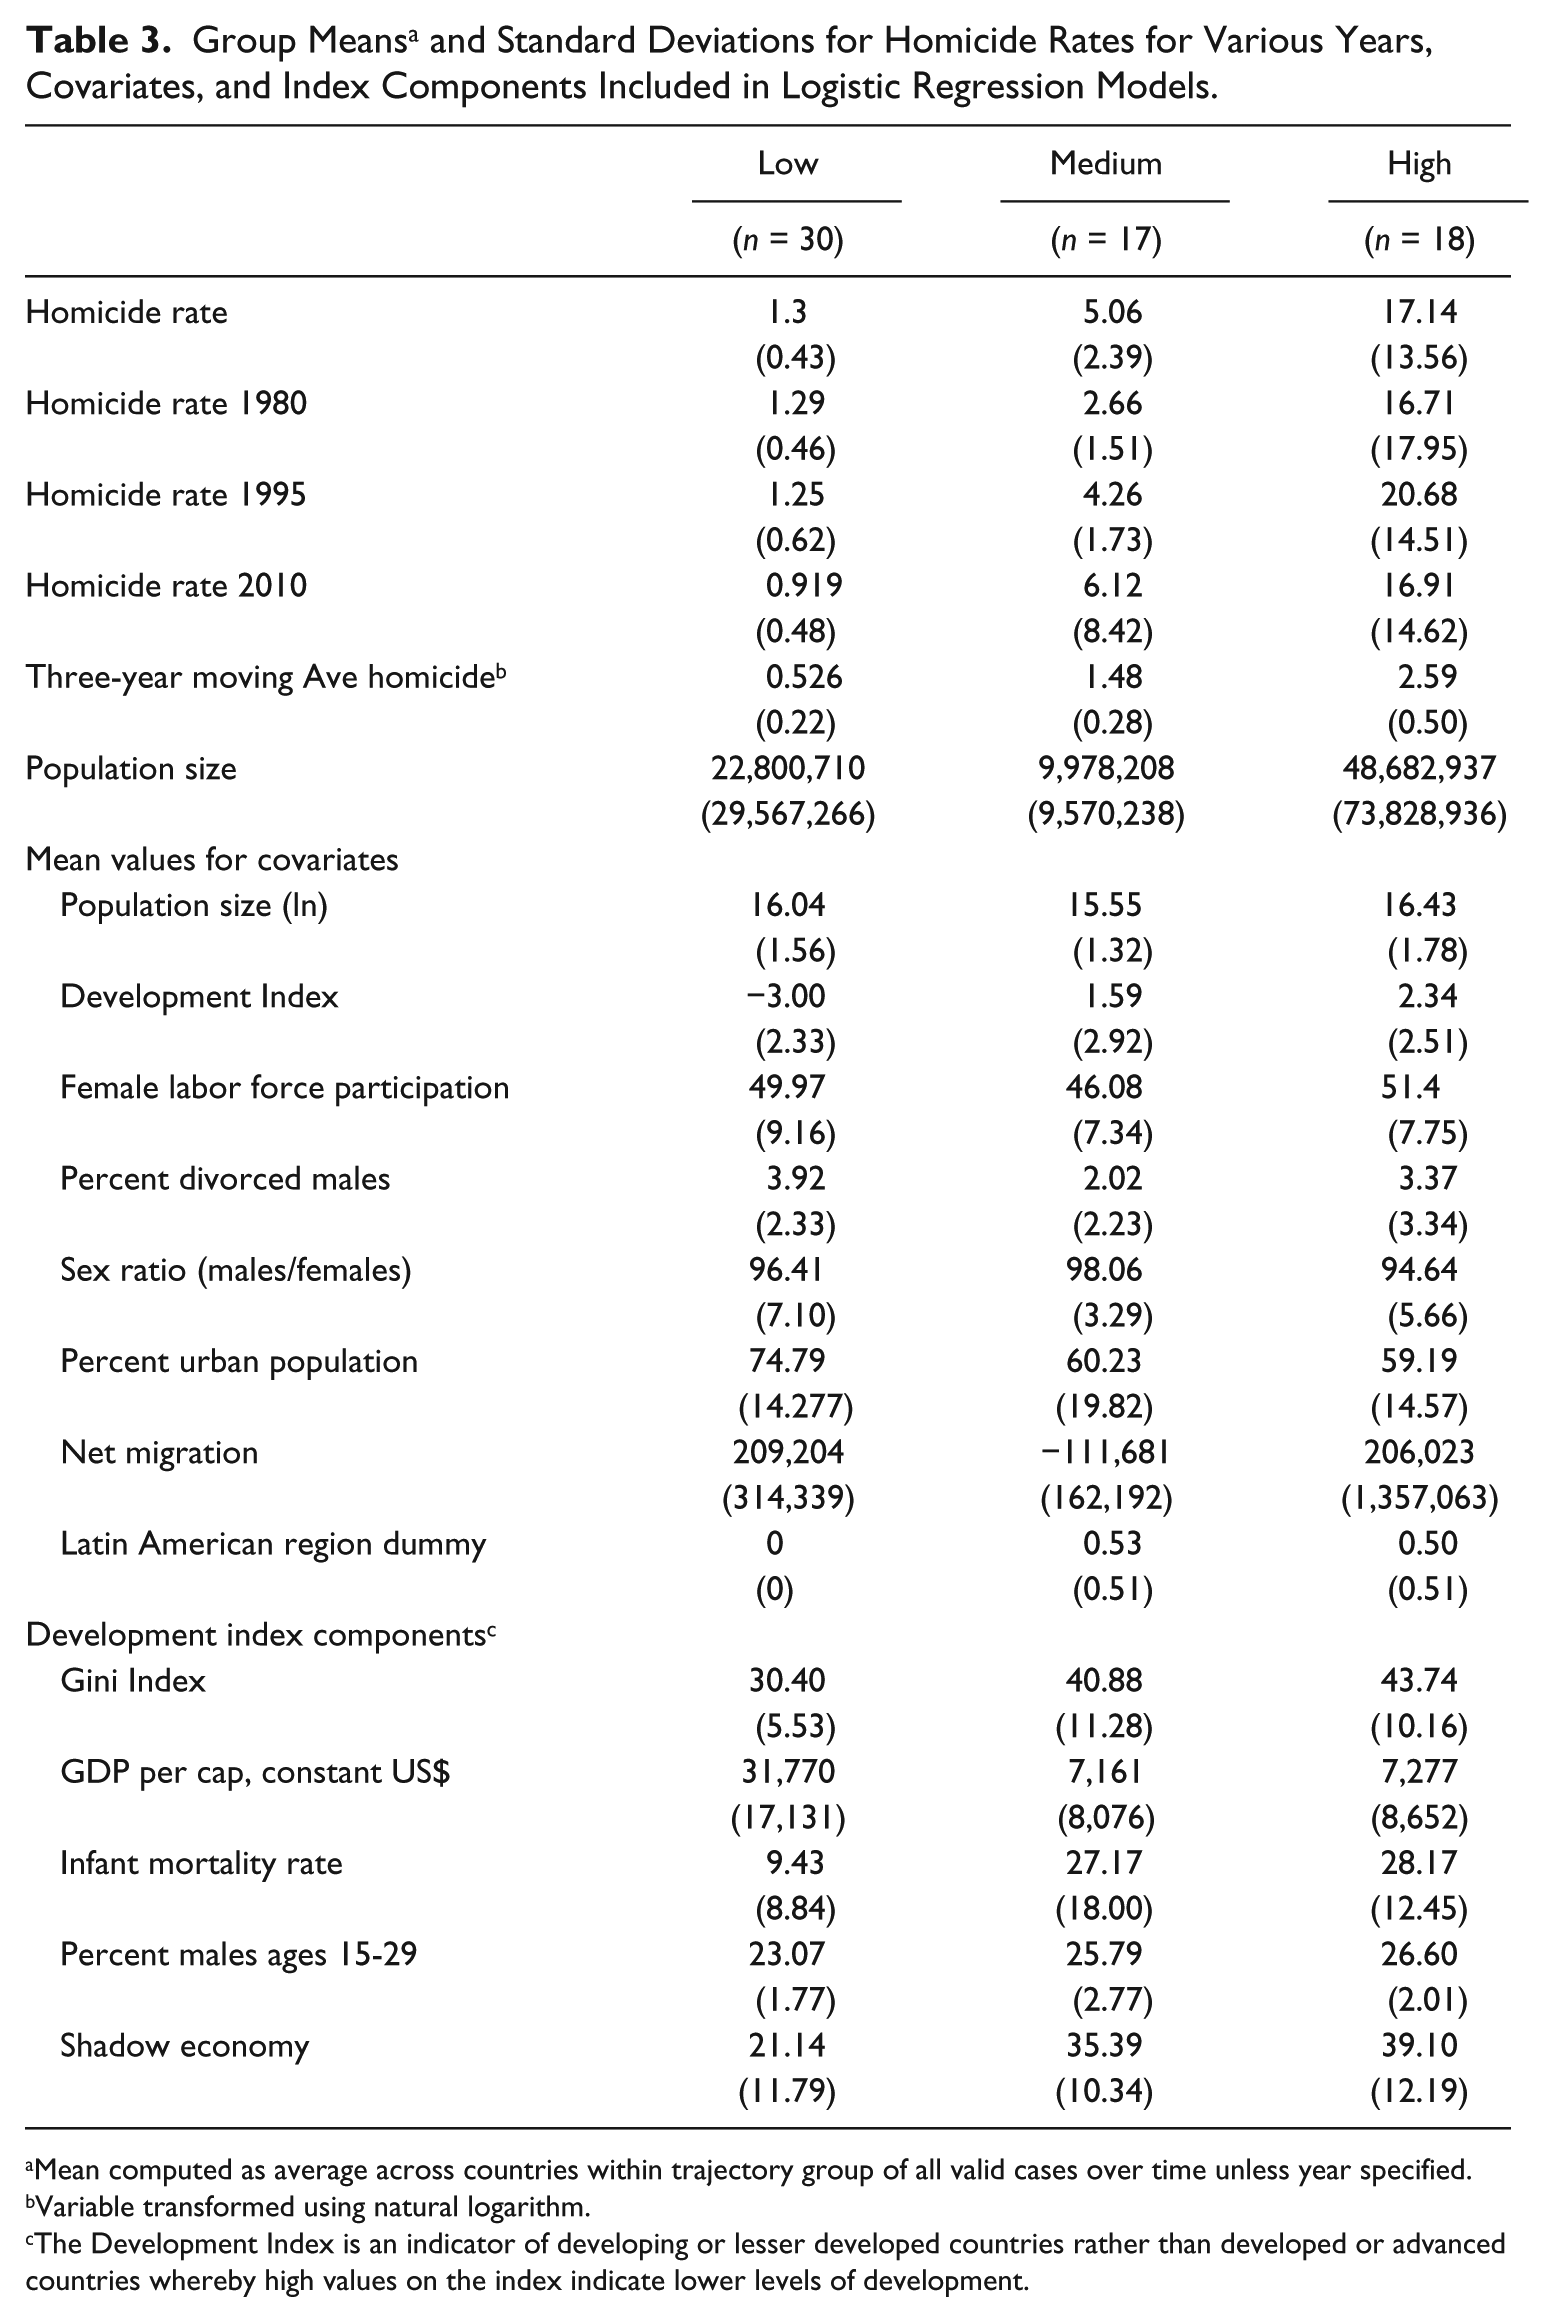
Mean computed as average across countries within trajectory group of all valid cases over time unless year specified.
Variable transformed using natural logarithm.
The Development Index is an indicator of developing or lesser developed countries rather than developed or advanced countries whereby high values on the index indicate lower levels of development.
Among the covariates, the hypothesized higher values are located in the high homicide rate group for most of the covariates. The development index and some of its components including the Gini index, percent males ages 15 to 29, and the shadow economy are highest in the nations of the highest homicide rate group. Another variable that conforms to expectations is the percentage of the countries within each group that are located in Latin America (see Nivette, 2011). Inconsistent with theoretical predictions, however, several covariates do not increase in mean value from the low homicide rate group to the high-rate group. Rather, the highest mean values for a number of our covariates are found among the low homicide rate group, including logged population size, female labor force participation rate, percent divorced males, percent urban population, and net migration. The goal for the next stage of our analyses is to identify which covariates of homicide are associated with the placement or membership of countries in one group versus another.
Logistic Regression Analyses
We ascertain which covariates are associated with component countries’ membership in their respective trajectory groups relative to other groups using binary logistic regression as well as analyzing the three groups in ordered logistic regression. First, we present a series of binary logistic regressions comparing the low-rate group trajectory versus the medium-rate group, the medium-rate group versus the high-rate group, and low-rate group versus the high-rate group. Recall, these models are estimated using the over time mean for each covariate. Each dependent variable is coded 1 for countries in the higher homicide rate group and 0 for the lower of the two (e.g., comparing the low-rate trajectory group, coded 0, vs. the medium-rate group, coded 1).
Table 4 presents the results (odds ratios) of the binary logistic regression analyses using the covariates averaged over the time period. 7 The various two-group comparisons are shown in Models 1 through 3. The number of countries included in each of these logistic models was limited to between 47 and 49 depending on the number of countries in each trajectory group and the number of missing cases for the covariates. Because of these limited sample sizes, we restricted the number of covariates in the final model to approximately one per 10 cases—a conservative restriction in our attempts to maintain the degrees of freedom. Therefore, the covariates comprising the final models shown in Table 4 do not represent all the covariates employed in these analyses. The restricted and final model (Model 4) was derived by systematically deleting the covariate with the weakest coefficient as determined by the t-score and then re-estimating the model until there was no more than one regressor per 10 cases.
Binary and Ordered Logistic Regression Odds Ratios, Likelihood That Covariates’ Mean Over-Time Variables Predict Homicide Trajectory Group Membership.

Index includes Gini, GDP per cap, infant mortality, % male ages 15-29, and shadow economy.
p < .05. **p < .01. (one-tailed tests). Robust standard errors used.
Substantively, we find that the development index is associated with membership in the medium-rate trajectory group relative to the low-rate trajectory group, as well as the high-rate vis-à-vis the low-rate trajectory group, notably higher in the latter regression with an odds ratio of over 5 times for membership in the high-rate group. Therefore, those less-developed countries are associated with membership in the higher homicide rate groups (low vs. medium and low vs. high). The other covariate with higher mean values associated with higher homicide trajectory group membership is the percent divorced males (low vs. high). Contrary to our expectations, countries with a higher sex ratio were less likely to have membership in higher homicide rate group (medium vs. high) and nations with a greater (percent) urban population are less likely to be in the high-rate group versus the medium-rate group. However, high sex ratios and a greater percent urban population are associated with higher homicide rates in some previous research (Messner et al., 2002; Messner & Rosenfeld, 1997; Messner & Sampson, 1991; Pratt & Godsey, 2003; Pridemore, 2008; Trent & Pridemore, 2012; Weld & Roche, 2017). We will address these anomalies in the “Discussion and Conclusion” section. Although statistically significant, net migration (higher immigration than emigration) is associated with membership in the low-rate group versus the medium-rate group and in the high-rate group versus the low-rate group with odds ratios near 1. Remarkably, countries in the Latin American region were over 57 times more likely to be in the high rather than medium-rate group. Note that this comparison was not possible for the low-rate group with the medium- and high-rate groups because there were no Latin American countries in the low-rate group. The pseudo R2 show that 76% of the variation in trajectory group membership in Model 3 was explained by this model specification, greater than the explained variance in Model 1 (47%). Less impressive was Model 2 with 33% of the variation explained by its covariates. These differences are due to the ability of the respective covariates to predict membership in one trajectory group versus another. To determine the robustness of these binary logistic regression findings, we estimate ordered logistic regression models which provide us with more cases to explore the covariates that determine group membership among these three trajectory groups.
As with the binary logistic analyses, ordered logistic regression models were estimated using the mean values over time for the covariates. 8 The findings for the final model are shown in the Model 4 column of Table 4. Like the binary logistic regression analyses, the ordered logistic regression analyses did not contain the same covariates because the limited number of cases (65) required that we remove covariates that were contributing least to explained variation with the remaining model containing approximately one covariate per 10 cases.
Overall, Model 4 reveals similar results as found in the binary logistic regression models and demonstrates the robust nature of these findings. For example, countries with higher logged population size, characterized as “developing” (higher in the development index), with higher female labor force participation and a higher percentage of divorced males are more likely to be in a higher homicide rate group. Contrary to our expectations for covariates in this model, countries with a higher sex ratio and countries with higher percentage of their population in urban areas are less likely to be in higher rate trajectory groups. Finally, yet remarkably, countries in the Latin America region are over 139 times more likely to be in higher homicide rate groups. The net migration measure had the weakest association with the ordered trajectory groups, therefore was omitted from the model. The substantive implications of these results are reviewed and discussed in the following section. 9
Discussion and Conclusion
Recent interest in global crime trends has led scholars to examine heterogeneous patterns and underlying causes of those trends. Most studies have sought to identify underlying covariates of crime within the United States (Blumstein & Rosenfeld, 2009; Farrell et al., 2014; Levitt, 2004; McCall & Hendrix, 2015; Zimring, 2007), although a few scholars have addressed the extent to which crime trends are shared across countries (Baumer & Wolff, 2014; Buonanno et al., 2011; Rosenfeld & Messner, 2009). In spite of shared global forces, research has documented the divergence of cross-national crime trends (Baumer & Wolff, 2014; LaFree et al., 2015; Rogers & Pridemore, 2017). Scant research has pursued the question of how national crime trends may share similar patterns and what factors contribute to those various patterns.
The present study attempts to identify unique hidden heterogeneity of homicide rate trajectories among a group of 82 countries for the time period 1980-2010. To do so, latent trajectory analyses are conducted in the first stage of our study, and three groups with distinct trajectories are identified—a low-rate group trajectory which declines over the 31-year-period (average homicide rate of 1.3), a medium-rate group which declines during the 1990s, but subsequently increases during the later years of the period (mean of 5.1), and a high-rate group which increases until the mid-1990s and then slightly decreases until the end of the observation period (averaging 17.1). These distinct trajectories confirm previous research demonstrating that there are many (primarily economically advanced) counties which have witnessed a declining crime trend in recent decades (Eisner, 2008; Rosenfeld & Messner, 2009; van Dijk et al., 2012). However, many other nations do not share this declining trend and have instead experienced increasing trends over this same time frame. Overall, these analyses confirm extant research that the crime decline of the 1990s was not a universal phenomenon. Only the lowest homicide rate trajectory group experienced a sustained decline in homicide beginning in the 1990s. The medium-rate homicide trajectory group also experienced a decline in homicide during the 1990s, but the trend had been reversed by 2010. Nations in the trajectory groups experiencing the decline were more highly developed (higher GDP per capita along with lower levels of income inequality, infant mortality, percentage of males ages 15-29, and a smaller shadow economy), thereby documenting an “elite convergence” (LaFree, 2005) among highly developed nations.
In the second stage of the analyses, classic covariates of cross-national homicide rates were assessed in their ability to predict countries’ group membership into three latent class homicide trajectories. To do so, we conducted a series of binary logistic regression models contrasting membership into the three latent classes (low-rate vs. medium-rate, medium-rate vs. high-rate, and low-rate vs. high-rate) to examine the likelihood that covariates of homicide predict countries’ membership into one group versus another. Due to missing data for some of the covariates, the largest number of cases included in these regression analyses was 49 countries. For the three binary logistic regression comparisons, the mean for each covariate over the three decades was used. In addition, we estimated an ordered logistic regression model to establish the robustness of the binary logistic regression findings. There were 65 countries with available covariate data for the ordered regression models.
Many of the social and economic indicators provided support for theoretically predicted relationships with membership in higher rate homicide trajectory groups in the logistic regression models. Among the four binary and ordered logistic regression models, coefficients supporting the hypothesized relationships include population size (significant in one model), female labor force participation (significant in one model), percentage divorced males (supported in two models), an index indicating (less) development comprised of positive factor scores for infant mortality, inequality, percentages of young males, shadow economy and a negative factor score for GDP per capita (significant in three of four models), and a Latin America region dummy measure (significant in the two models in which it was included). Three indicators—sex ratio, percentage of the population located in urban settings, and net migration (measured as immigration minus emigration)—either had inconsistent findings (positive and negative coefficients for net migration) or coefficients with signs opposite to that hypothesized (see Nivette, 2011). As noted above, these analyses were limited with small sample sizes which may have contributed to the fact that each was not statistically significant in every model and each may not have been included in every model.
To make substantive sense of the negative association between urbanization and the higher homicide rate group placement among this sample of countries, urbanization could be considered as an aspect of modernization and development rather than of social disorganization. Although there are disparate findings in the extant literature (see Trent & Pridemore, 2012), highly economically advanced countries tend to have large proportions of their population located in urban centers near industry. Western European and Asian countries have some of the most urban populations in our sample, which may have produced the negative relationship between percent urban and higher homicide rate trajectories. Conversely, many of the countries with a lower percentage of urban inhabitants include Latin American and Eastern European countries, which have some of the highest homicide rates.
In addition, the findings contrary to our expectations concerning the sex ratio in two of four models are not unprecedented. Whereas the sex ratio is typically used as a demographic control in cross-national studies of homicide, it is rarely statistically significant, and sometimes significant in the direction opposite to that theorized (Messner et al., 2002; Messner & Rosenfeld, 1997; Messner & Sampson, 1991; Pratt & Godsey, 2003; Pridemore, 2008; Weld & Roche, 2017). It has even been suggested that this measure may be irrelevant to homicide at the national level (Nivette, 2011).
Finally, the impact of net migration could arguably be related to disruption in population stability and weakening of informal ties leading to higher crime, but our results reveal that countries with higher levels of net migration are less likely to find membership in higher rate homicide trajectories in at least one model. This finding might be explained by the attraction that residents of lesser developed countries would have for moving to wealthy nations where possibilities of employment and a better quality of life might be found—such as some of the migration patterns witnessed between Eastern and Western European countries in recent decades. Because many of the wealthier countries in our sample have lower homicide rates, this might explain why we find that net migration is associated with lower homicide rate trajectories (see also Ousey & Kubrin, 2009, 2018).
This analysis also indicates (see Figure 1) that most Latin American nations (included in the ‘American’ region) only had a small decline in homicide trends during a few years of the mid-1990s that then plateaued or increased through the remainder of the time frame (see also LaFree et al., 2015). Even after accounting for population structure, economic development, and other classic correlates of aggregate homicide rates, nations in Latin America are significantly more likely to be assigned to the highest homicide rate group, which experienced no sustained decline in homicide during the 1990s. Not a single Latin American nation is located in the lowest homicide rate group and it is evident in Figure 1 that this is the only region (included in this study) to experience a significant increase in homicide during recent decades. Further research is needed to understand the dynamics of crime trends in Latin America because neither dominant cross-national theories of crime (i.e., Messner & Rosenfeld, 1994) nor commonly used predictors of homicide utilized in this study account for the substantial variation in homicide rates in this region. The large likelihood ratios for the Latin American region dummy measure suggest there are other factors that are captured with this region indicator and should be included in these models, such as drug trafficking, gang activity, and political upheaval. Until reliable measures for these factors are available, it will be difficult to determine the forces shaping violent crime in this region.
Like much cross-national multivariate research, the present study was restricted in a number of ways, including the availability of measures for this relatively large sample of countries that would allow for tests of major theoretical perspectives. For example, we were not able to test Institutional-Anomie (Messner & Rosenfeld, 1994, 1997) or Social Support (Cullen, 1994) theories—both of which have found empirical traction in this body of literature (McCall & Brauer, 2014; Messner, Thome, & Rosenfeld, 2008; Thames & McCall, 2014)—because of the absence of commensurate measures across this sample of countries. Then again, measures for social support likely would have been highly correlated with GDP per capita and may have become another component indicator in the development index. Neither were we able to test for the social control efforts of law enforcement or the deterrent effects of incarceration, implicated in the U.S. crime decline (Levitt, 2004), because such measures were not available for many countries across these three decades. Although, the support for incarceration in cross-national homicide research is somewhat mixed in the extant literature (compare Baumer & Wolff, 2014 and Dolliver, 2015).
The collinearity problem found among our collection of covariates has been a double-edged sword for the present study. To address these problems, we were forced to reduce the shared regressor space among several covariates and create the development index. 10 Whereas the employment of this index aided in our ability to include more regressors in the model in light of the limited number of cases in our sample, this prevented our ability to assess the unique contribution of each of the index’s component indicators on the outcome measure. Therefore, we were unable to determine the distinct ways in which some of these classic concepts (such as income inequality) were linked to countries’ membership in the homicide trajectories. Another limitation was the number of regressors (or consistent model specification) we were able to include in each of the logistic regression models because of the restricted sample size. Although our purpose was not to conduct a longitudinal analysis, such a research design would provide more degrees of freedom and allow for more variables to be included in each model providing for systematic comparisons of the relative contributions of covariates across models. In addition, countries characterized by internal strife, civil war, or political upheavals may result in high death rates which are recorded as homicides and, in turn, may spur an exodus of citizens to more tranquil neighboring countries.
Given these limitations, our results provide some preliminary support for explaining recent homicide trends. There is some indication that social disorganization/lack of informal social control and routine activity influences were greater in nations in the higher homicide rate groups, as the estimated regression effects for divorced males and female labor force participation were somewhat higher in nations outside of the low homicide group. In addition, our findings demonstrate the importance of modernization/economic development in shaping homicide rates (Ouimet, 2012; Pridemore, 2008), as group membership in the low-rate group versus the two high-rate groups is strongly predicted by economic development. Future research should clarify these findings, explore additional social and economic characteristics that account for variation among these countries, and examine divergent crime patterns outside of wealthy Western democracies.
Footnotes
Appendix
Declaration of Conflicting Interests
The author(s) declared no potential conflicts of interest with respect to the research, authorship, and/or publication of this article.
Funding
The author(s) received no financial support for the research, authorship, and/or publication of this article.