



Abstract
Objective. Sample size and statistical power calculation should consider clustering effects when schools are the unit of randomization in intervention studies. The objective of the current study was to investigate how student outcomes are clustered within schools in an obesity prevention trial. Method. Baseline data from the Food, Health & Choices project were used. Participants were 9- to 13-year-old students enrolled in 20 New York City public schools (n = 1,387). Body mass index (BMI) was calculated based on measures of height and weight, and body fat percentage was measured with a Tanita® body composition analyzer (Model SC-331s). Energy balance–related behaviors were self-reported with a frequency questionnaire. To examine the cluster effects, intraclass correlation coefficients (ICCs) were calculated as school variance over total variance for outcome variables. School-level covariates, percentage students eligible for free and reduced-price lunch, percentage Black or Hispanic, and English language learners were added in the model to examine ICC changes. Results. The ICCs for obesity indicators are: .026 for BMI-percentile, .031 for BMI z-score, .035 for percentage of overweight students, .037 for body fat percentage, and .041 for absolute BMI. The ICC range for the six energy balance–related behaviors are .008 to .044 for fruit and vegetables, .013 to .055 for physical activity, .031 to .052 for recreational screen time, .013 to .091 for sweetened beverages, .033 to .121 for processed packaged snacks, and .020 to .083 for fast food. When school-level covariates were included in the model, ICC changes varied from −95% to 85%. Conclusions. This is the first study reporting ICCs for obesity-related anthropometric and behavioral outcomes among New York City public schools. The results of the study may aid sample size estimation for future school-based cluster randomized controlled trials in similar urban setting and population. Additionally, identifying school-level covariates that can reduce cluster effects is important when analyzing data.
Cluster randomized controlled trials are designed to evaluate interventions that operate at a group level (Campbell, Fayers, & Grimshaw, 2005; Murray, Varnell, & Blitstein, 2004) and are commonly used in education, public health, medical, and social science studies (Amorim, Bangdiwala, McMurray, Creighton, & Harrell, 2007; Resnicow et al., 2010). Individuals within clusters may enter the study with greater similarity than individuals randomly selected from the general population (Resnicow et al., 2010); this needs to be considered when designing such trials. The similarity between participants within the same cluster is typically captured by the intraclass correlation coefficient (ICC; Murray & Blistein, 2003).
Clustering occurs commonly in education and health research. For example, children in the same school often have similar achievement levels (Hedges & Hedberg, 2007). This can be problematic in intervention studies, particularly when the intervention under study is randomly assigned to whole schools instead of individuals. This clustering effectively increases the standard error of a treatment impact estimate. When clustering has not been taken into account in the design of the study, tests of the treatment effect can be severely underpowered (Murray & Blistein, 2003; Murray, Varnell, et al., 2004), and any analysis that ignores the ICC will have an inflated Type I error rate (Murray, Phillips, Bimbaum, & Lytle, 2001; Murray, Varnell, et al., 2004). Therefore, a cluster-randomized study requires more participants and more complex analysis than an individually randomized trial (Campbell, Grimshaw, & Elbourne, 2004; Janega et al., 2004). Estimating the ICC for a sample size calculation when designing a study and considering cluster effects when analyzing data are both important. ICCs help investigators interpret the results of the trial and explain how school and environmental characteristics are related to study outcomes (Krolner et al., 2009; O’Malley, Johnston, Delva, Bachman, & Schulenberg, 2007; Richmond & Subramanian, 2008).
Research has indicated that minority populations living in disadvantaged urban neighborhoods are at high risk for obesity (Drewnowski & Specter, 2004; Schuster et al., 2012). In New York City (NYC), for example, there are higher rates of obesity in low-income minority neighborhoods than in more affluent and predominantly White neighborhoods (Gordon et al., 2011; Karpati et al., 2004). Schools are often the implementation unit in intervention studies because researchers can reach a large number of students at once, and students spend the majority of their daytime at school on weekdays. Additionally, many interventions are best implemented at the school level. Working with schools within low-income minority neighborhoods on nutrition and physical activity may reduce risks of childhood obesity and narrowing health disparities in urban settings.
Targeting children’s changes in energy balance–related behaviors (EBRBs) has been a strategy to address childhood obesity in school-based intervention studies. Providing ICCs for obesity-related behavioral (i.e., energy-dense processed packaged snack consumption) and physiological measures (i.e., body mass index [BMI] or percentage body fat) may help investigators accurately estimate sample size and power studies to achieve optimal effects.
School-based studies with nationally representative samples have indicated that ICCs for BMI vary by age or grade (O’Malley et al., 2007; Richmond & Subramanian, 2008; J. G. Wang et al., 2013). One study with over 16,000 middle school students and over 14 years of data indicated that the average ICCs for BMI of 8th, 10th, and 12th graders were .03 (range .02-.045), .023 (range .019-.033), and .036 (range .013-.06), respectively (O’Malley et al., 2007). Another study with children in 1,280 schools across the United States showed an ICC of .064 for BMI when they were in fifth grade and remained nearly constant, .065, when they had become eighth graders (Y. Wang, Xue, Chen, & Igusa, 2014). School factors that reduced ICCs in those studies included school-level socioeconomic status (SES), household income level, ethnicity, and type of school (public vs. private), yet it seems that there are also factors that uniquely contribute to school variance. The variance may be due to such factors as different degrees of wellness policy implementation in schools, school food environment differences, or neighborhood environment differences. A study conducted in North Carolina found a BMI ICC of .01, while another study of six different U.S. regions showed an ICC for BMI up to .16 for males and .21 for females, suggesting that ICCs for BMI vary based on geographic region.
In terms of EBRBs, only a few studies have reported ICCs for behavioral outcomes in schools (Murray, Catellier, et al., 2004; Murray et al., 2001; Rovner, Nansel, Wang, & Iannotti, 2011). One cross-sectional study using a national probability sample of students in nine Census regions of the United States reported ICCs on dietary intakes (Rovner et al., 2011). The ICCs for four dietary behaviors were estimated for Grades 6 to 8 (younger) and Grades 9 to 10 (older) from 222 public and 5 private schools (n = 8,743). For fruit and vegetable consumption, younger grades had an ICC of .068 and older grades had an ICC of .018. ICCs for sweets (defined as chocolates and/or other candies) were .046 in younger grades and .031 in older grades; for soft drinks, ICCs were .081 for younger and .062 in older grades; and for chips, they were .085 in younger grades and .136 in older grades. This study found that adjusting for school poverty index and vending machines as covariates reduced ICCs by 25% to 72%. One study in an urban setting, Twin Cities, Minnesota (Murray et al., 2001), reported an ICC of .034 for fruit and vegetable consumption among 20 middle schools. The Trial for Activity in Adolescent Girls, a multicenter cluster randomized trial in six sites across the United States reported ICCs of physical activities behaviors: .02 for minutes of moderate and vigorous physical activity and .005 for metabolic-equivalent minutes.
To our knowledge, no study in NYC has reported ICCs for obesity-related physiological or behavioral outcomes of school-based interventions. The current study is the first study to report ICCs on various BMI indicators (e.g., absolute BMI, BMI percentiles for age and gender, BMI z-scores), percentage body fat, and EBRB outcomes among NYC public elementary schools. We estimated ICCs using baseline data from a school-based cluster randomized controlled trial of fifth-grade elementary school children in low-income NYC neighborhoods. EBRBs include fruit and vegetable consumption, physical activity, recreational screen time, sweetened beverage consumption, processed packaged snack consumption, and fast food consumption. In addition to estimating ICCs for these indicators, multilevel regression models were tested with school-level covariates, such as percentage of students eligible for free or reduced-lunch price, as a measure of SES, to examine changes in the ICCs after adjustment for covariates.
Thus, the objectives of the study were to estimate ICCs for each obesity-related physiological and behavioral outcome of a school-based obesity prevention trial with 20 NYC public elementary schools and to examine changes in the ICCs when school-level covariates were adjusted in the multilevel regression models. Since outcomes that are measured with self-report assessment tools often have higher ICCs than those estimated from objective measures (Campbell et al., 2005), we hypothesized that ICCs for behavioral outcomes would be higher than ICCs for anthropometric measures. We also hypothesized that adjusting for school-level covariates in the models would reduce the variances between schools, indicated by reductions in ICCs as compared to unadjusted models.
In this article, we follow the guidelines for ICC reporting established by a group of researchers and statisticians with an interest in cluster trials (Campbell et al., 2004). Specifically, these researchers call for (1) description of the data set and the outcomes, including demographic distribution of cluster, description of outcome, prevalence of outcome, and description of intervention; (2) information on the calculation of ICC, including method of calculation, software program used, adjustment (or not) for covariates, and data used for calculation; and (3) information on the precision of the ICC, including confidence intervals, number of clusters, average cluster size, and range of cluster sizes. These descriptors were used to guide the current study.
Method
Study Design and Participants
The present study is a cross-sectional study using baseline data from the Food, Health & Choices study, which was a school-based obesity prevention trial using a cluster randomized controlled design conducted in the 2012-2013 school year. Fifth-grade students (n = 1,387) from 20 NYC public elementary schools participated in the study. Of the enrolled students, 1,165 (84.0%) completed the height, weight, and body fat measurements, and 1,241 (89.5%) completed the survey measurements at baseline (Figure 1). For power analyses to determine the adequacy of the sample size, an ICC of .03 for the primary outcome, mean BMI, was used. This estimate was derived from nationally representative samples of U.S. schools and students (O’Malley et al., 2007). Using the Optimal Design software (Raudenbush et al., 2011), with a cluster size of 20 and ICC of .03, a minimum detectable effect size with 80% power was 0.28; with 90% power, the minimum detectable effect size was 0.32.

Baseline data flow diagram: Food, Health & Choices randomized controlled trial.
Data from the only 14-year-old respondent and five students deemed body fat outliers based on the Tukey’s procedure (Boneva-Asiova & Boyanov, 2011) were excluded from the analyses. Other missing data were due to absenteeism or because students were taken out of the classroom for other activities. For data analysis, therefore, 1,159 student anthropometric cases and 1,235 survey cases were included. Table 1 shows the baseline characteristics of the study setting and participants. The mean age of the students was 10 years and 49.3% of the students were male. The majority of students were eligible for the free and reduced-price lunch program (86%) and Hispanic (58%) or Black (30%). The study was approved by the Institutional Review Boards of Teachers College Columbia University and the NYC Department of Education.
Participant Characteristics at Baseline of a School-Based Randomized Controlled Trial, Food, Health & Choices.

Note. BMI = body mass index (kg/m2).
Proficiency score ranges from 1 to 4.5: The first digit corresponds to the student’s performance level (1 being well below proficient to 4 being above proficient) and the following digits indicate how close the student is to another proficiency level.
Anthropometric Measures
Baseline data for the anthropometric measurement were collected between September 2012 and January 2013. Height was measured in centimeter with a portable stadiometer (Seca model 213), and weight in kilograms and % body fat were measured with a Tanita® body composition analyzer (Model SC-331s). This Tanita model uses tetrapolar foot-to-foot bioelectrical impedance technology; the method has been tested in different populations with relatively and consistently valid results (Chouinard et al., 2007; J. G. Wang et al., 2013).
The data collection manager scheduled the date of the measurement with each school, and four to six data collection staff brought the equipment to the school on the day of the measurement. To have consistent measurements, data collection was performed early in the morning before lunch when possible, and all data for one school were collected on the same day. Research data collection staff were graduate-level nutrition program students who were trained prior to the assessments based on a standardized protocol, which was modified from the National Institutes of Health Manual of Procedures for Height and Weight Measures with additional information from the Tanita body fat measurement manual. All measurements were repeated twice, or until there were two measures for height that were within 1.0 centimeter of each other and for weight that were within 0.1 kilogram of each other. The average of the two measures was used as the final data point. BMI was calculated with height and weight (kg/m2) and BMI percentile for age and BMI z-score by gender were calculated based on the Centers for Disease Control and Prevention growth charts (Kuczmarski et al., 2000; Kuczmarski et al., 2002). There were no missing data in any anthropometric measurements.
Behavioral Measures
EBRBs, including fruit and vegetable consumption, physical activity, recreational screen time, sweetened beverage consumption, processed packaged snack consumption, and fast food consumption, were measured by a self-report frequency questionnaire, using an electronic Audience Response System (Lee et al., 2013). Food item choices for the questionnaire were driven by data from Food, Health & Choices pilot studies with 24-hour recalls and school lunch observations. Some items were adopted from the Beverage and Snack Questionnaire (Neuhouser, Lilley, Lund, & Johnson, 2009), Physical Activity Questionnaire–C (Moore et al., 2007), and the School Physical Activity and Nutrition Questionnaire (Thiagarajah et al., 2008). The frequency of each behavior was asked with the stem “In the past week, I ate . . . (or I did . . .)” and the response options included “0 times,” “about 1 to 2 times,” “about 3 to 4 times,” “almost every day,” and “2 or more times every day.” Scales were developed for each EBRB. The fruit and vegetable scale consisted of eight food items (e.g., apples, grapes, and oranges), and the physical activity scale consisted of three items (i.e., light, medium, and heavy activity). Two individual items (TV viewing and video game behaviors) were used to measure screen time. The sweetened beverage scale included fruit drinks and sweetened iced teas and sodas (two items), and the processed packaged snacks scale included chips, other salty snacks, candy, donuts and pastries, baked goods (e.g., cookies), and ice cream (six items). Two cognitive testing sessions were conducted to ensure students’ understanding of the survey questions. Cronbach’s alpha values for the internal consistency test ranged from .60 to .88 for the scales. Test–retest reliability correlation coefficients ranged from .53 to .87.
For survey questions, the range of the percentage missing data was from 7% to 26% depending on scales. Little’s (1988) missing completely at random test showed that there is not enough evidence to suggest that the missing pattern was not completely at random (χ2 = 15664.427, p = .065). Missing data were deleted listwise during the data analyses.
School-Level Demographics
School-level information on percentage of students eligible for free and reduced-price lunch, percentage Black and Hispanic students, and percentage English language learners (ELLs) were obtained through publically available data from the NYC Department of Education. All data were from the 2012-2013 school year databases.
Statistical Analyses
When there is clustering, one way to analyze the data is to use a hierarchical linear model. This analog to an analysis of variance model decomposes a student’s observed outcome (Yij) into three components: an average outcome (γ), a school residual shared by all students in the same school (uj), and a student specific residual (eij). The model is as follows:

In this model, the total variation in the outcome (Yij) can be decomposed into two parts: the variation of school means across schools, V(uj) = τ2, and the variation in student scores within schools, V(eij) = σ2. The ICC is defined as follows:
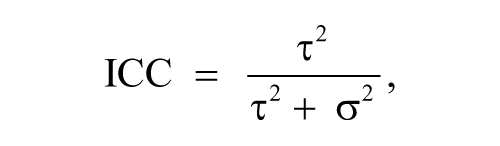
which is the proportion of the total variation due to between-school differences (Snijders & Bosker, 2012). The ICC affects the precision of the estimate of a treatment effect (or other regression coefficient), and its effect can be summarized through a design effect (DEFF):

where m is the average number of students per school (Snijders & Bosker, 2012). The square root of the DEFF is the inflation in the standard error of the treatment impact estimate due to clustering. For example, if the ICC is .05 and the average number of students in the study per school is m = 50, the standard error would be nearly 85% larger than if there was no clustering (i.e., √DEFF = √3.45) = 1.85). In this article, we estimate these variance components and ICCs using the HLM software with data collected at pretest (HLM for Windows© Version 7.01, Scientific Software International, Inc., Lincolnwood, IL, 2013). We calculate the ICCs and 95% confidence intervals based on the Smith formula given by Donner and Wells (1986).
Since the ICC can have a large effect on statistical power—the ability to detect a treatment effect in an intervention study—one way to improve power is to explain part of the ICC using known factors, typically school-level variables. In this study, we provide both ICCs and covariate-adjusted ICCs, where we adjust for school demographic variables, including (1) percentage of eligible students in the free and reduced-price school lunch program, (2) percentage of Black, (3) percentage of Hispanic, and (4) percentage of ELL students. After adding these covariates, changes in ICC were examined and represented as % ICC change (covariates model − unconditional model)/unconditional model * 100; Resnicow et al., 2010).
Results
The ICCs for obesity indicators at baseline of the Food, Health & Choices study are as follows: .041 for absolute BMI, .031 for BMI z-score, .026 for BMI percentile, .037 for percentage body fat, and .035 for percentage overweight or obese (Table 2). When school-level covariates were included in the model, the ICCs ranged from .001 to .010, which were reduced 86% on average (71% to 95% reduction) after the adjustment with the covariates.
Intraclass Correlation Coefficients of the Obesity Indicators of the Food, Health & Choices at Baseline.

Note. BMI = body mass index (kg/cm2); ICC = intraclass correlation coefficient; CI = confidence interval. The framework for describing intraclass correlation coefficients based on Campbell, Grimshaw, and Elbourne (2004). School-level covariates include percentage of students eligible for free or reduced-price lunch, percentage Black, percentage Hispanic, and percentage English language learners.
Table 3 shows ICCs for all behavior outcomes in Food, Health & Choices. The ICC range of each of the 6 EBRB categories in the study is as follows: (1) .008 to .044 for fruit and vegetables, (2) .013 to .055 for physical activity, (3) .031 to .052 for recreational screen time, (4) .013 to .091 for sweetened beverages, (5) .033 to .121 for processed packaged snacks, and (6) .020 to .083 for fast food.
Intraclass Correlation Coefficients of the Behavioral Outcomes of the Food, Health & Choices at Baseline.

Note. ICC = intraclass correlation coefficient; CI = confidence interval.
Response options: 1 = 0 times, 2 = about 1-2 times per week, 3 = about 3-4 times per week, 4 = almost every day, 5 = 2 or more times every day. bResponse options: 1 = 0 times, 2 = about 1-2 times per week, 3 = about 3-4 times per week, 4 = almost every day. cResponse options: 1 = I didn’t eat this, 2 = less than small, 3 = small, 4 = medium, 5 = large, 6 = more than large. dResponse options: 1= less than half an hour, 2 = half an hour to 1 hour, 3 = two hours, 4 = three hours, 5 = more than three hours. eResponse options: 1 = never, 2 = rarely, 3 = sometimes, 4 = always.
Figure 2 illustrates the variable list sorted by high to low ICCs based on the unadjusted models. ICCs in the unadjusted models ranged from .008 (95% confidence interval [CI: −.010, .025]) in fruit size (p = .125) to .121 (95% CI [.044, .199]) in frequency of eating candy (p < .001). When school-level covariates were adjusted in the models, ICC changes in behavior outcomes varied by variables (Table 3). Some of the variables that were significantly clustered in school level became no longer significantly clustered. Those were vegetable size, heavy physical activity, frequency of drinking milk, and frequency of eating salad, apples, or a fruit cup at a fast-food restaurant. Percentage ICC changes in the Table 3 indicate the magnitude of ICC change before and after adjusting for school-level covariates in the model, which varied by different variables as well.

Intraclass correlation coefficients of the Food, Health & Choices baseline data, sorted from high to low in the unadjusted models.
ICCs for the following variables increased on average 29% (+4% to +85%) after adjusting for school-level covariates: “fruit at breakfast,” “fruit at lunch,” “vegetables at lunch,” “frequency of fruit and vegetables,” “physical activity duration,” “physical activity frequency,” “light physical activity frequency,” and medium physical activity frequency.” ICCs for all other obesity indicator and behavior outcomes reduced when the models were adjusted for school-level covariates. On average, ICCs reduced 29% with school-level covariates (range −7% to −95%).
Discussion
The unadjusted ICC estimates for BMI z-score, % body fat, and other obesity indicators ranged from .026 to .041, and school-level covariates (school SES and ethnicity/cultural factors) largely explained the between-school variances. This finding is consistent with studies featuring nationally representative samples (O’Malley et al., 2007; Richmond & Subramanian, 2008). Adjusting for the same covariates when calculating sample size and for data analysis would help with reducing large clustering effects in future studies with a similar setting and population, thus improving statistical power.
Behavioral outcome variables had a wide range of ICC (.008-.121), especially frequencies of drinking sweetened beverages and eating processed packaged snacks, and fast food data were highly clustered within schools. Regarding questions asking about the foods mostly consumed at school, “vegetables at lunch,” “fruit at lunch,” “fruit at breakfast,” and “milk” had the lowest ICC values, implying that consumption of these foods may not be very different across schools. Similar to the obesity indicators, if the variance of behavior outcomes were highly dependent on school-level covariates, the % ICC changes after adjusting those variables must be negative and large. Unlike the obesity indicators, degrees of % ICC changes varied by behavior with a wide range (−85% to +85%), and the ICC for some variables increased instead of decreasing, indicating that other factors (e.g., if the school has a salad bar or the “Breakfast in the Classroom” program) may contribute to school variance. Even after adjusting the school-level covariates, most behavior outcomes were significantly clustered within schools, also indicating that there are unknown factors explaining variance in these behaviors. This potentially means that there is an increased chance of failing to detect an intervention effect that is present (Type II error). Therefore, discovering other factors influencing food and activity choices in and around schools that make students behave similarly within schools but different between schools is key to minimizing the ICCs’ impact on study power. The remaining variance may be due to differences in food availability around the schools and/or in how each school establishes and implements nutrition and physical activity policies. Over the past decade, NYC has established new citywide food policies (i.e., calorie labeling on restaurant menus) and has made efforts to improve the food environment in certain low-income neighborhoods. For example, the NYC Department of Health and Mental Hygiene established the Health Department’s District Public Health Offices in high-needs neighborhoods, where the most health disparities were observed (Karpati et al., 2004), to provide resources and assist activities to improve community health. How schools responded to such city- or community-wide policy changes might also contribute to school-level behavioral differences observed in the current study.
Similarly, Rovner et al. (2011) examined the ICCs for fruit and vegetables, sweets, soft drinks, and chips, using a national probability sample of schools (n = 154) in the United States and separating schools into a younger group (6th-8th grades; 95 schools, 3,692 students) and an older group (9th-10th grades; 59 schools, 2,238 students). The ICCs in the younger group were .05 for sweets, .08 for soft drinks, and .09 for chips, indicating that the ICCs from the current study were slightly higher for sweet snacks, such as candy (.07-.12), lower for sweetened beverages (.06), and similar for chips (.08). The ICC for the frequency of fruit and vegetable consumption in the current study was lower (.04) than that from the national probability sample (.07). Other studies in different regions have shown the ICC ranging from .02 to .08 for fruit and vegetable intake (Baranowski et al., 1997; Krolner et al., 2009; Murray et al., 2001). Overall ICC for frequency of physical activity in the current study was .03, similar to two U.S. middle school studies reporting ICC ranges of .02 to .03 (Murray, Catellier, et al., 2004; Murray et al., 2001). It is important to note, however, that instruments used to measure behaviors and units of measures are inconsistent across studies, which makes it challenging to compare ICCs among studies in the same way that physiological measures are compared (i.e., BMI z-score). When the primary outcomes of a trial are behaviors, more careful sample size calculation and power analysis might be required. Because behavior outcomes have consistently been highly clustered at the school level, determining significant school-level covariates that can be added to the analysis model would be key to reducing the chances of making Type II errors.
Study limitations include using self-reported measures for behavior outcomes. In addition, our findings cannot be generalizable to other settings or populations. Despite these limitations, this is the first study reporting ICCs for obesity indicators and EBRB outcomes among NYC public elementary schools (5th grades). Reporting ICCs for multiple behavior scales (total of 26 scales including frequencies and sizes/durations of behaviors) is also strength of this study, which might help investigators select ICCs of specific outcomes for sample size and power calculation. In addition, we reported all ICC descriptors recommended for a cluster-randomized trial (Campbell et al., 2004).
Conclusions
School-level SES, ethnicity, and cultural indicators largely explained between-school variances in BMI, % body fat, and obesity rates among public elementary schools in NYC low-income neighborhoods. A wide range of ICCs was found in EBRBs; large proportions of between-school variances remained unexplained after school-level covariates were adjusted, indicating that a large sample size might be required when conducting school-based behavioral-change interventions related to obesity in NYC. If not possible, it is important to identify and account for school-level covariates that are highly associated with primary study outcomes when analyzing data, in order to control for cluster effects.
Footnotes
Declaration of Conflicting Interests
The authors declared no potential conflicts of interest with respect to the research, authorship, and/or publication of this article.
Funding
The authors disclosed receipt of the following financial support for the research, authorship, and/or publication of this article: This research was supported by Agriculture and Food Research Initiative Grant from the USDA National Institute of Food and Agriculture (Grant No. 2010-85215-20661).