
Abstract
We study the differential effects of tax reforms on actual and observed net income inequality in a laboratory experiment where participants first supply effort and then make a tax reporting decision. We show that for a group with relatively homogeneous levels of true gross income, higher taxes increase both actual and observed inequality but have a larger effect on actual inequality. We decompose the effect of tax rates into a mechanical tax effect and two behavioral (effort and evasion) effects. Our results indicate that the mechanical and effort effects on actual inequality are larger than on observed inequality while the evasion effect is generally larger on observed inequality. We also find that the size of the effects, relative to each other, depends on the measure of income.
It is widely acknowledged that tax evasion has distributional implications (Roine 2006; Borck 2009; Johns and Slemrod 2010; Alm and Finlay 2012; Traxler 2012). If some taxpayers underreport parts of their true gross income, then both the level of, and effect of taxes on, the distribution of actual net income are likely to be different from that of observed net income. 1 Identifying these differences is important, especially in the evaluation of tax reforms, which usually have distributional effects. For example, “flat” tax reforms are often avoided in some countries because of their potential impact on inequality (Fuest, Peichl, and Schaefer 2008; Keen, Kim, and Varsano 2008).
This article adds to the identification and understanding of the distributional implications of tax evasion in two ways: after reporting differences between actual and reported income inequality, we first examine the effect of tax rate changes on income inequality in a setting with tax evasion and a fairly equal distribution of pretax income, and identify the extent to which the effect on reported income inequality differs from the effect on actual inequality.
Second, we decompose the effect of tax rates into its mechanical and behavioral components; the mechanical channel captures the effect of tax rates holding behavioral responses constant and the behavioral channel captures real responses such as labor supply and other responses such as tax evasion holding the mechanical effect constant. This allows us to shed light on the size of each channel and to determine whether each channel has differential effects on observed and actual inequality. While the existing literature acknowledges that these channels exist (Alm, Lee, and Wallace 2005; Poterba 2007), we are among the first to decompose the behavioral channel into its labor supply and evasion components. Our research approach allows us to identify the tax-induced behavioral response, evasion or labor effort that has the larger effect on inequality, and whether the behavioral responses have differential effects on actual and observed inequality.
Since hidden income is not observable, it is difficult to study our research questions with observational data. We therefore conduct a laboratory experiment in which all participants first undertake a real-effort task over several rounds. Earned income is taxed at a proportional tax rate that varies across rounds and some subjects are given the opportunity to underreport income. The experiment is designed such that true gross incomes depend on performance in the effort task and are relatively equally distributed across participants. Laboratory experiments have been used widely to study tax evasion (e.g., Graetz, Reinganum, and Wilde 1986; Fortin, Lacroix, and Villeval 2007; Alm, Jackson, and McKee 2009) and labor supply (e.g., Dickinson 1999; Abeler et al. 2011; Gill and Prowse 2012). 2 Using a laboratory experiment is advantageous in that it allows us to observe evasion and exercise full control over the institutional setting and the parameters of interest.
As expected, we observe that in a setting with homogeneous pretax income, observed inequality, as measured by the Gini coefficient, is approximately twice as large as actual inequality. The reason is that evaders have low observed net incomes, whereas their actual net incomes are closer to those who either cannot or do not underreport. We additionally find that the tax rate has a positive effect on both types of inequality but a larger effect on actual inequality. We argue that this is due to evasion. As the tax rate increases, it reduces the actual net income of those with little or no evasion relative to those who evade a lot, thus resulting in higher actual net income inequality. Similarly, the gap between the observed net income of evaders and non-evaders widens as the tax rate increases, thus leading to increased observed net income inequality. If the responsiveness of evasion is large enough, the change in the tax rate will have a relatively larger effect on actual net income inequality than on observed net income inequality.
We explore these differences more carefully by decomposing the change in inequality into three important channels: one mechanical and two behavioral; evasion and effort. First, holding hidden income and effort supply constant, an increase in the tax rate implies that those with little or no hidden income will pay a relatively higher tax bill, which reduces their actual net income relative to those who evade more. This mechanical effect causes observed and actual inequality to increase.
Second, we observe that taxes affect labor effort. Holding the share of evaded income as well as the tax rate constant, this behavioral effort response has a relatively larger effect on actual inequality than on observed inequality. However, the sign of the effect depends on the “tax reform” being studied. Finally, tax evaders increase the share of hidden income, as the tax rate increases. Now, holding effort supply and the tax rate constant, this behavioral evasion effect has a positive effect on both types of inequality but a relatively larger effect on observed inequality.
Understanding the differential effect of taxation on actual and observed inequality is an important policy issue because distributional effects are a prominent consideration in most tax reforms. Our results show that tax reforms induce behavioral and mechanical responses that are likely to have differential effects on reported and actual income inequality—even within one small segment of the pretax income distribution. Policy makers ought to account for these differences when discussing the distributional implications of tax reforms. This is especially important in developing countries where tax evasion and shadow economic activity are prevalent.
To our knowledge, we are the first to examine the distributional implications of tax evasion in an experimental setting and to do so for a group of individuals whose true gross incomes are almost equally distributed. However, a few studies exploit observational data to differentiate between observed and actual income inequality. For example, Johns and Slemrod (2010) find that actual net income inequality is slightly higher than observed net income inequality using US tax return data. Examining Greek unaudited income tax returns, Matsaganis and Flevotomou (2010) find that actual progressivity is lower than statutory progressivity. Duncan (2012) finds that the Russian flat tax reform had a larger effect on observed net income inequality than actual income inequality employing household-level data from the Russian Longitudinal Monitoring Survey. Finally, Duncan and Sabirianova Peter (2012) exploit country-level variation for the period 1981 through 2005 and find evidence that structural progressivity has a larger effect on observed net income inequality than actual income inequality.
We are also among the first to decompose the behavioral channel into its evasion and effort components. The existing literature either focuses on the US PIT system (e.g., Alm, Lee, and Wallace 2005; Poterba 2007) or simulates the effect of hypothetical flat tax reforms in Western Europe (e.g., Fuest, Peichl, and Schaefer 2008). These studies focus on direct and indirect effects but do not identify the channels of the indirect effect. Other articles have identified parts of the productivity effect but not the evasion effect (e.g., Altig and Carlstrom 1999; Gramlich, Kasten, and Sammartino 1993). An exception is Duncan (2012), who uses household survey data to identify the mechanical and behavioral effects and to decompose the behavioral effect into productivity and evasion responses. Unlike Duncan, we are able to observe both reported and actual income. This allows us to cleanly identify the level and responsiveness of evasion and its contribution to the distributional effect of tax rate changes.
Besides utilizing laboratory rather than observational data, we deviate from these studies in that we analyze inequality in a group with relatively homogeneous true pretax incomes. This allows us to cleanly identify the distributional impact of tax evasion in the absence of large pretax income differences. Our work is particularly relevant for understanding inequality within a small segment of the income distribution. For example, one might consider the distributional effect of taxes within the middle of the income distribution where pretax incomes are relatively homogeneous, but access to evasion is heterogeneous. 3 Studying a homogeneous segment of the pretax income distribution necessarily implies that observed inequality will be larger than actual inequality 4 and that the responsiveness of labor effort to varying tax rates is likely to be less heterogeneous than for the entire “real-world” income distribution. Therefore, the result we wish to emphasize here is the relative impact of behavioral responses on measures of income inequality within a small segment of the income distribution. We do not intend to infer conclusions about the level of actual versus observed income inequality or behavioral responses over the entire distribution of incomes in the “real world.”
The article proceeds as follows: we describe the experimental design in the second section. The results are presented and discussed in the third section, and we briefly conclude the article in the fourth section.
Experimental Design
Setup
We design an experiment where subjects earn income by completing a real-effort labor task and pay taxes on their income. 5 Participants are randomly assigned to two groups that are identical in every respect except for access to evasion. Participants in group A are able to evade taxes by underreporting while participants in group B cannot. All subjects play one practice round and ten paying rounds. The tax rate is set at 15 percent in rounds 1 through 3, 35 percent in rounds 4 through 6, 50 percent in rounds 7 through 9, and 15 percent in round 10. This variation allows us to identify the distributional impact of taxes in the presence of evasion. Subjects were told that the tax rate may change in future rounds. We did not tell them the future rates or the number of times the rate would change. In other words, subjects only knew the tax rate for the round they were playing and, conditional on observing one rate change, they did not know if the rate would change again.
Each round played by group A has two stages. First, subjects earn money by completing a real-effort task, which involves positioning a set of forty-eight sliders on a computer screen (Gill and Prowse 2012). 6 The number of correctly positioned sliders is taken as a measure of effort. While the maximum effort attainable in the task is forty-eight per round, subjects only managed to position an average of 19.25 sliders per round. Subjects earn experimental currency units (ECU) for each correctly positioned slider. They then report an income amount between zero and true gross income in the second stage. The reported amount is taxed at the round’s prevailing tax rate, which is revealed at the beginning of each round. These subjects also face an exogenous audit probability and pay a fine if audited. The audit probability of 10 percent and fine rate of twice the evaded taxes are exogenous and fixed across rounds (Alm, Jackson, and McKee 2009). 7 Subjects in group B complete the same labor task as group A, but are not given a reporting decision. Instead, their tax liability is simply withheld and they are informed of their net income for the round.
Gross income in each round consists of two parts: earned labor income and nonlabor income. Nonlabor income is fixed at five ECU per round, and the wage rate is six ECUs for every correctly aligned slider. Net income in each round is a function of gross income, the tax rate, and, in group A, reported income and audit outcome. Subjects are paid their net income for one randomly chosen round to avoid wealth effects, satiation, and irrational decisions that occur once a certain expected payoff is achieved (see Blumkin, Ruffle, and Ganun [2012] for a similar payment structure). The total ECU for the selected round is converted to euros using an exchange rate of 1 ECU to €0.10. A show-up fee of €2.50 is added to the subject’s net income to determine the final payment. Final payment ranged from €2.50 to €25.20 with an average of €12.80 in group A and €10.66 in group B. It was public information that all tax revenues plus fines (in total €237.91) would be donated to the Red Cross.
External Validity
We rely on data generated in a laboratory setting to answer our research question because it is difficult to answer questions related to tax evasion with observational data. While this approach allows us to address our research question, there are limitations on the extent to which the results can be generalized to the real world. Nonetheless, our experimental design mimics the “real world” in two important aspects.
First, we require participants to earn their taxable income in a real-effort task. Making income endogenous in this way induces a sense of “ownership” of one’s income in the experiment. We argue that participants are more likely to make reasonable and “realistic” decisions in a situation with endogenous incomes, relative to a situation with an exogenous endowment. 8 Alm, Jackson, and McKee (2009), for example, also require participants to earn income through a real-effort task before making their tax reporting decisions in order to increase comparability to actual tax payment situations. Although the labor task does not perfectly match the real world, it captures the essence of most labor markets in that subjects are required to exert effort in order to earn income. Additionally, since the choices between effort and hours worked are isomorphic in many ways (Charness and Kuhn 2011) and share many characteristics, we argue that choices in the real-effort experiment can serve as a good proxy for actual labor supply.
Second, we do not provide an evasion opportunity to all participants in our experiment. This feature of our design is also similar to the “real world”; recent research shows that many employees who are subject to third-party reporting are not able to cheat on their taxes (Slemrod 2007; Kleven et al. 2011).
We acknowledge that our design is different from the “real world” in that pretax labor income is relatively homogeneously distributed. Although artificial, this setup allows us to observe after-tax inequality while abstracting from large pretax income differences. As discussed before, our experiment hence allows us to draw conclusions about the distributional implications of tax evasion within small segments of the pretax income distribution. 9
Organization
We ran three sessions for each group with fifteen participants per session for a total of ninety subjects. The experiment was conducted in the Cologne Laboratory for Economic Research in Germany. Subjects were mostly undergraduate students from different fields at the University of Cologne. They were about twenty-four years old on average, 40 percent were male, and roughly 75 percent were German natives (see summary statistics in appendix A). Invitations to the experiment were sent out using the recruitment software Online Recruitment System for Economic Experiments (Greiner 2004). Neither the content of the experiment nor the expected payoff was stated in the invitation e-mail. The experiment was programmed utilizing z-Tree software (Fischbacher 2007).
Results and Discussion
Income Concepts
We are interested in inequality in actual gross income as well as actual and observed net incomes. Actual gross income consists of income earned in the effort task plus nonlabor income. Observed net income is defined as reported income minus taxes paid, while actual net income is observed net income plus the amount of underreported income. Observed net income is equal to actual net income for subjects who either cannot evade or do not evade. Since audits lead to the detection of true gross income, observed and actual net income are also equal for evaders who are audited. The distribution of each income measure is summarized by the Gini coefficient 10 for the full sample and separately for groups A and B. We use net income inequality interchangeably with income inequality from here on.
Inequality and the Effect of Tax Rates
Observed and Actual Income Inequality
Table 1 shows that gross income for the full sample is fairly equally distributed with a Gini coefficient of 0.136. This is not surprising since subjects have fairly homogeneous labor effort. Also not surprising is the fact that the Gini for observed net income is larger than the Gini for actual net income. This difference is due to the presence of tax evasion, which ranges from 60 percent to 70 percent in our sample. 11 Evaders have relatively low observed net incomes, whereas their actual net incomes are closer to those who either cannot or do not underreport. As a result, observed net income inequality is relatively high compared to actual net income inequality. An even larger difference between actual and observed inequality is observed in group A where evasion is possible. This is due to heterogeneous evasion behavior within this group. Whereas a few participants evade large shares of their gross incomes, others do not evade at all. As a result, those who evade have very low observed net incomes although their actual incomes are very similar to those who do not evade.
Income Inequality.

Note: Evaded is the average share of gross income that is underreported in group A, and effort is the average number of correctly positioned sliders. Gini coefficients are based on true gross income and actual and observed net income, respectively. Number of observations is 360 for the full sample and 180 for groups A and B.
Effect of Tax Rates
In order to analyze the distributional implications of changes in tax rates, we calculate the observed and actual net income for each individual in each round. We then find the average of each income measure of each individual by tax rate to produce a data set with four observations per person; that is, the data are collapsed from ten rounds to four periods. 12 We then calculate the Gini coefficient for each income measure by period and present the results in table 2. These results are similar to those in table 1; gross income inequality is very small and observed net income inequality is significantly larger than actual net income inequality in every round.
Tax Rates and Income Inequality by Period.

Note: Summary statistics by period, where each period represents rounds over which the tax rate is constant. The tax rates 15, 35, 50, and 15 percent correspond to periods 1, 2, 3, and 4, respectively. Evaded is the average share of gross income that is underreported in group A and effort is the average number of correctly positioned sliders. Δ indicates the percentage change between two periods. Gini coefficients are based on true gross income and actual and observed net income, respectively. E denotes the elasticity with respect to the tax rate derived from regressions on tax rates controlling for a logged time trend (p is the p value). Number of observations is 360.
More importantly, we observe that an increase in the tax rate increases both types of net income inequality but has a significantly larger effect on actual inequality. This can be seen by comparing period-by-period changes between the two types of net income inequalities and is supported by the elasticity estimates presented in the last two rows of table 2. We find that a 1 percent increase in the tax rate increases actual inequality by 0.354 percent and observed inequality by 0.135 percent. 13
Two important questions arise from table 2; why does an increase in the tax rate increases income inequality and why is the effect relatively larger on actual inequality? We argue that the answer to both questions is evasion. As the tax rate increases, it reduces the actual net income of those with little or no evasion relative to those who evade a lot thus resulting in higher actual net income inequality. This is consistent with Duncan and Sabirianova Peter (2012), who use a simple theoretical decomposition to show that the tax rate and actual income inequality may be positively correlated in the presence of tax evasion. The positive effect on observed inequality is due to the fact that individuals have fairly homogeneous gross income and evasion increases with the tax rate. As the tax rate increases, the gap between the observed income of evaders and non-evaders widens thus leading to increased observed inequality. 14
The elasticities presented in the second and fourth columns of table 2 suggest that the relatively larger effect on actual inequality is also driven by evasion. In particular, we find an evasion share elasticity of 0.043 compared to an effort supply elasticity of 0.003. In other words, the responsiveness of the evasion share to tax rate changes affects the gap between actual and observed inequality and also the impact of tax rates on these measures of inequality.
We find results that are qualitatively similar when we look at the data separately for group A in panel A of table B1 in appendix B; Gini is higher for observed net income and the effect of tax rates on income inequality is positive for both measures of income but larger for actual net income. The results for group B in panel B are varied; the effect is both positive and negative for rate increases and positive when the tax rate falls. This effect is driven solely by heterogeneity in the responsiveness of labor effort to tax rate changes. Nonetheless, we take the differential effect of taxes on inequalities between panels A and B as additional evidence that the distributional impact of taxes is strongly determined by evasion.
Additionally, the results in table B1 highlight that the elasticity of effort with respect to taxes is larger for the evading group relative to individuals who cannot evade (see Doerrenberg and Duncan [2012] for a more detailed discussion of this result). This finding suggests that access to evasion not only provides an extra margin along which to respond to varying tax rates, namely the evasion margin, but also increases the effort margin. We argue that this further emphasizes the distributional implications of evasion.
Decomposition of the Effect of Tax Rates
The results described earlier imply that tax rates affect income distribution via three distinct channels: one mechanical and two behavioral: evasion and effort. However, we have not been able to say much about their relative magnitudes. This section of the article extends the previous analysis to determine the relative magnitude of each channel.
Method
The mechanical channel results directly from the change in the tax rate holding behavioral (evasion and effort) responses constant. It is identified by finding the difference between income inequality in period t and the counterfactual net income that each individual would have if their gross income (reported income for participants in group A) in period t was taxed at the tax rate in period t + 1 (Alm, Lee, and Wallace 2005; Poterba 2007). Using the equivalent technique, the evasion effect is obtained by calculating the counterfactual net income that each individual would have in period t if the share of income hidden in period t was equal to the share hidden in period t + 1, all else equal. Finally, the effort effect is obtained by calculating the counterfactual net income that each individual would have in period t if the level of effort in period t was equal to the level of effort in period t + 1, all else equal. The difference between these counterfactual net incomes and the net income in period t is the value of the respective effect. These calculations may be summarized as
where Φ is the Gini coefficient, y is effort, π is evasion share, τ is the tax rate, and superscripts d, e, and h indicate counterfactual net income for direct, effort, and evasion effects, respectively. The results from this exercise are reported in Tables 3
–5 for the full sample and groups A and B, respectively. The tables report the Gini in each period Φ
t
, the counterfactual Ginis Φ
i
, and the percentage change in the Gini that can be attributed to each channel:
Decomposition of the Effect of Tax Rates.

Note: Summary statistics by period, where each period represents rounds over which the tax rate is constant. The tax rates 15, 35, 50, and 15 percent correspond to periods 1, 2, 3, and 4, respectively. Counterfactual Ginis and percentage change are calculated as in equation (1). Percentage change indicates the percentage change in the Gini due to either the direct, effort, or evasion effects, respectively. Number of observations is 360 in each panel.
Decomposition of the Effect of Tax Rates: Group A.
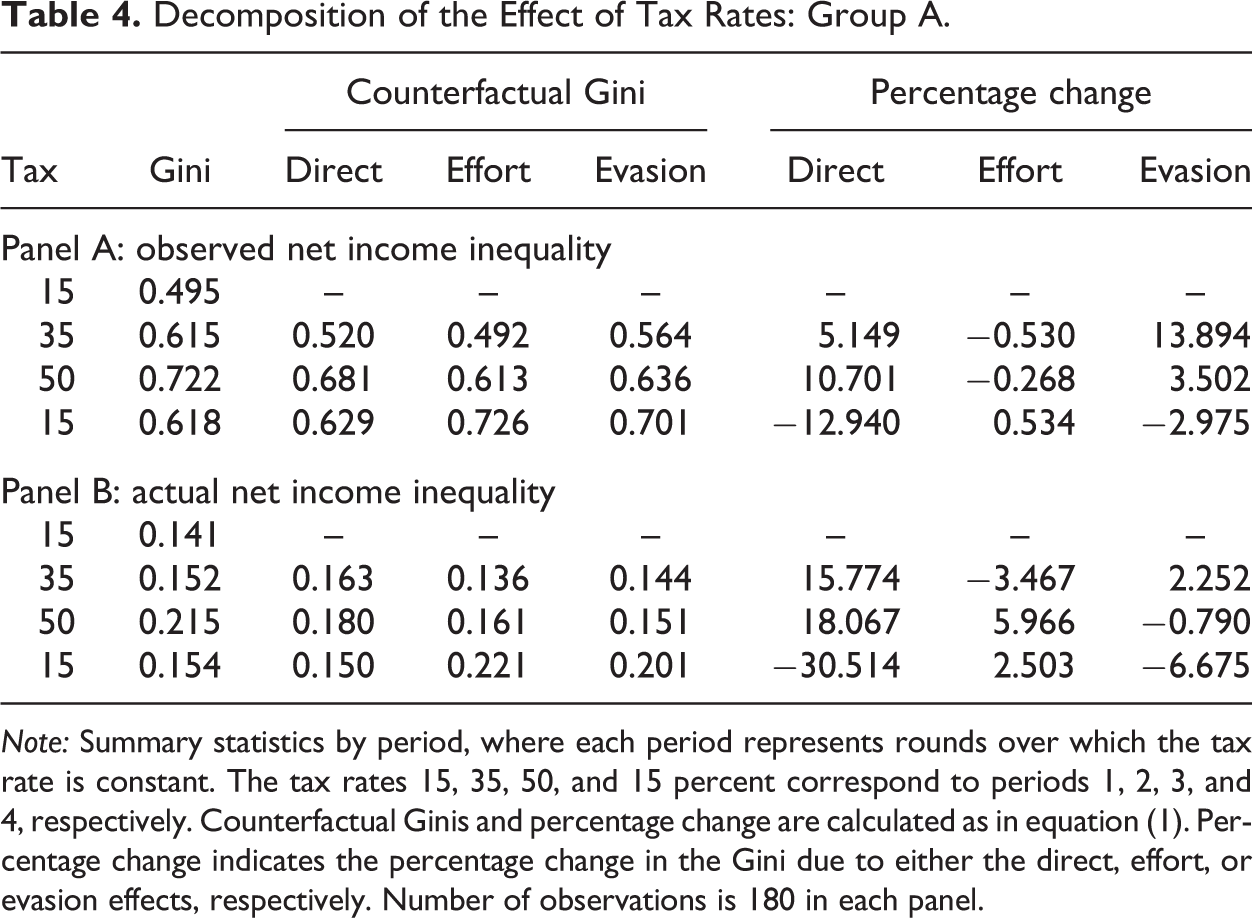
Note: Summary statistics by period, where each period represents rounds over which the tax rate is constant. The tax rates 15, 35, 50, and 15 percent correspond to periods 1, 2, 3, and 4, respectively. Counterfactual Ginis and percentage change are calculated as in equation (1). Percentage change indicates the percentage change in the Gini due to either the direct, effort, or evasion effects, respectively. Number of observations is 180 in each panel.
Decomposition of the Effect of Tax Rates: Group B.
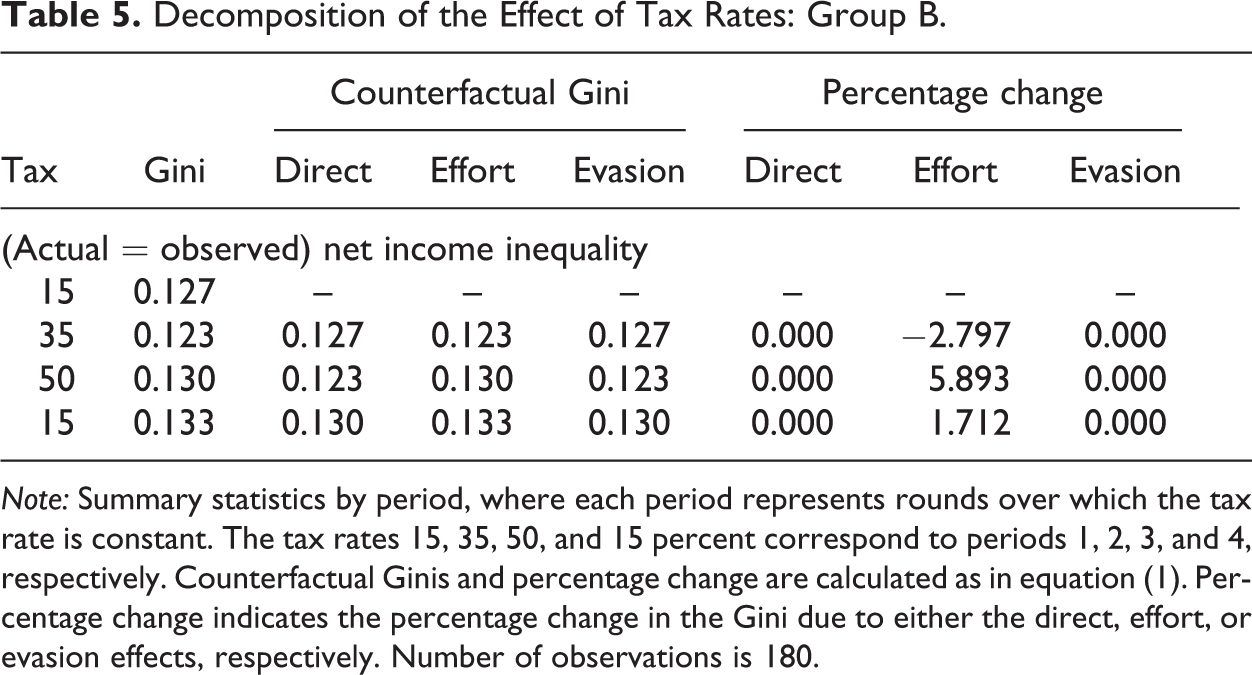
Note: Summary statistics by period, where each period represents rounds over which the tax rate is constant. The tax rates 15, 35, 50, and 15 percent correspond to periods 1, 2, 3, and 4, respectively. Counterfactual Ginis and percentage change are calculated as in equation (1). Percentage change indicates the percentage change in the Gini due to either the direct, effort, or evasion effects, respectively. Number of observations is 180.
Full Sample
The results in panel A of table 3 show that an increase in the tax rate increases observed net income inequality via the mechanical effect and that this is reinforced by the evasion effect. Similarly, a decrease in the tax rate reduces inequality via the mechanical and evasion effects. The effort effect, on the other hand, moves in the opposite direction; it reduces (increases) observed inequality when tax rates rise (fall). 15
Another interesting finding in panel A of table 3 is the relative size of the three channels. The absolute size of the effort effect is unsurprisingly small compared to the mechanical and evasion effects. We also find that the direct effect is larger than the evasion effect except for the second period when tax rates increased from 15 percent to 35 percent. Conceptually, the direct effect should always be zero for the Gini measure of observed net income inequality in a proportional tax system. However, this is not the case here because the penalty paid by an evader who is audited is a function of the tax rate. In other words, the tax rate paid by evaders who are caught is higher than the tax rate paid by non-evaders and evaders who are not caught. As a result, the structure of the tax rate is not proportional when evaders who are caught are included in the data set. Excluding evaders who are caught from the analysis leads to direct effects of zero and evasion effects that are larger than effort effects. 16
We find qualitatively similar mechanical effects in panel B where we report the effect of tax rate changes on actual income inequality; positive when tax rates increase and negative when tax rates decrease. However, the mechanical effect on actual inequality is much larger than on observed inequality. This is due to the heterogeneous effect of tax rate changes on non-evaders, evaders who are caught, and evaders who are not caught. To see this more clearly, write down observed net income as
and actual net income as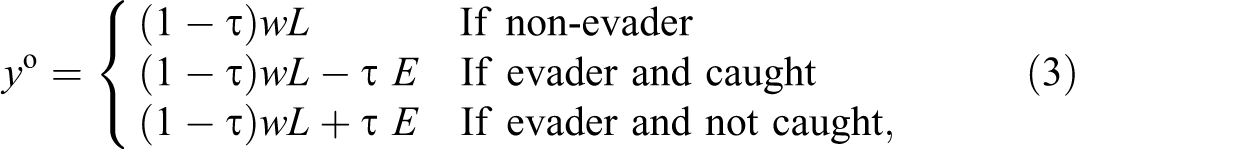
where w is the wage rate, L is effort, τ is the tax rate, and E is hidden income. It is clear that, relative to non-evaders, an increase in the tax rate has a larger negative effect on evaders who are caught and a smaller negative effect on evaders who are not caught, all else equal. This is true for both measures of net income. It is also clear that this differential effect is larger for actual income because every dollar of hidden income increases actual net income by τE for evaders who are not caught and decreases actual net income by τE for evaders who are caught. 17 Finally, the mechanical effect on actual income inequality is also more dominant than the evasion and effort effects.
The results also indicate that the increase in tax rates from 15 percent to 35 percent increases actual inequality via the evasion effect but reduces actual inequality via the effort effect. However, the absolute magnitude of the two effects is similar. The results are strikingly different when the tax rate increases from 35 percent to 50 percent; evasion effect is very small (−0.753 percent) compared to the effort effect of 3.635 percent. This is consistent with the magnitudes of the behavioral responses observed in table 2; percentage change in effort is more than twice the percentage change in hidden income when the tax rate increases from 35 percent to 50 percent. The sign and size of both effects is fairly comparable in the last period when rates fall from 50 percent to 15 percent. This is also consistent with observed changes in effort and evasion. Both evasion and effort fall among the evader group while effort increases in the non-evader group. As a result, the actual net income of non-evaders increases while that of evaders decreases thus reduces the inequality in actual net income.
By Group
We find qualitatively similar mechanical and evasion effects in table 4 where we look at group A only. The mechanical effect is positive when tax rates increase, negative when rates fall, and larger than both effort and evasion effects; this is true for both measures of income. Similarly, the evasion effect is positive when tax rates increase (except when rates increase from 35 percent to 50 percent for actual inequality), negative when rates fall, and larger than the effort effect for observed inequality; the effort effect on observed inequality is negative when rates increase, positive when rates fall, but very small. On the other hand, the effort effect on actual inequality is larger than the evasion effect, in absolute value, except when tax rates decrease from 50 percent to 15 percent.
Looking at group B only in table 5, we see that there are no direct or evasion effects in this group since there is no opportunity to evade and the tax is proportional. The results presented in tables 4 and 5 show that the large effort effect found in panel A of table 3 is mostly due to effort response among non-evaders. The results provide additional evidence that evasion has nontrivial distributional effects and that this effect depends on the level and responsiveness of evasion.
Conclusion
Although the distributional impact of tax evasion is widely acknowledged, there is very little empirical evidence on the exact nature of its effect. There is also very little information on the relative size of the various channels through which taxes affect the distribution of income. We design an experiment that allows us to explore these issues. In our experiment, true gross income is fairly equally distributed among participants. We find that for such a homogeneous group, observed net income inequality is approximately twice as large as actual net income inequality. This is explained by heterogeneity in the level of evasion; evaders have low observed net incomes, whereas their actual net incomes are closer to those who either cannot or do not underreport. Our results also show that tax reforms affect observed inequality differently than actual inequality. In particular, we find that tax increases have a larger effect on actual net income inequality than on observed net income inequality.
This is one of the first studies to decompose the effect of tax rate changes on income inequality into a mechanical effect and two behavioral effects; evasion and labor effort. Our results show that the mechanical and effort effects are larger for actual inequality than observed inequality, while the evasion effect is larger for observed inequality. This makes sense since hidden income is very responsive to the tax rate and is not included in observed income. We also find that the mechanical effect is larger than the effort and evasion effects for both type of income and that the evasion effect is larger than the effort effect for observed inequality.
Of course, we are cautious in extrapolating these results to the “real world” since our data were gathered in an artificial environment with a group of mostly undergraduate students (Levitt and List [2007] and Falk and Heckman [2009] discuss the external validity of lab experiments). Nonetheless, we argue that our results are significant, as they highlight the importance of evasion when analyzing the inequality within a fairly homogeneous segment of the pretax income distribution. Additionally, understanding the differential effect of taxation on actual and reported inequality is an important policy issue because distributional effects are a prominent consideration in most tax reforms. Our results show that tax reforms are likely to have differential effects on reported and actual income inequality—even within one small segment of the pretax income distribution. When evaluating tax reforms policy makers should obviously focus on actual net income inequality since this reflects the distribution of disposable resources. However, because actual income is usually not observable outside an artificial lab experimental world, we conclude by proposing that policy makers strive to minimize tax evasion opportunities to reduce differences between observed and actual net incomes.
Footnotes
Appendix A
Appendix B
Appendix C
Acknowledgments
We would like to thank the editor, two anonymous referees, Andreas Peichl and Justin Ross for helpful comments and suggestions. We are grateful to David Gill and Victoria Prowse for providing their experimental real-effort task and sharing z- Tree code (Gill and Prowse 2011, ![]() ).
).
Declaration of Conflicting Interests
The author(s) declared no potential conflicts of interest with respect to the research, authorship, and/or publication of this article.
Funding
The author(s) disclosed receipt of the following financial support for the research, authorship, and/or publication of this article: This work is financially supported by the Deutsche Forschungsgemeinschaft (DFG) for the Cologne laboratory.