
Abstract
We examine the fiscal impact of legalized casino gambling, including Indian casinos. Our study examines the impact this legalization had on counties where casinos were located. Using county-level data between 1987 and 2007 and difference-in-differences estimation, we examine the impact of casino openings on county area government revenues, expenditures, sales tax revenues, and education expenditures. Our results indicate that casinos did not have a statistically significant impact on per capita government expenditures and revenues. However, this was due to differential impacts between commercial and Indian casinos and revenue-sharing legislation between states and counties. There is minimal evidence of a net impact on sales tax revenues in the counties where new casinos opened and some evidence, albeit weak, that Indian casinos are associated with lower county education expenditures. The results are robust when using propensity score matching results accounting for the endogeneity of casino location and spatial lag and error regressions.
Casino gambling has always been a controversial issue for national and subnational governments due to their complex socioeconomic impact. The US Congress enacted the National Gambling Impact Study Commission Act in 1996 to study the social and economic aspects of gambling in the United States. The Commission’s final report included a number of recommendations that would significantly limit gambling activities in the United States. 1 Despite those recommendations, the spread of casino gambling has been remarkable over the last two decades. In 1987, only Nevada counties and Atlantic City in New Jersey had legalized commercial casinos. In 2007, the number of states with legalized casinos, including Indian casinos, has spread to thirty-three. Figure 1 shows the distribution of counties with legalized gambling in 2007. 2 The expansion has been controversial, with the benefits versus costs of casino gambling being heavily debated. Jurisdictions legalizing gambling frequently reference the increase in tax revenues, jobs, and other economic development initiatives, or the loss of those to a neighboring state, as the driving force behind legalization.
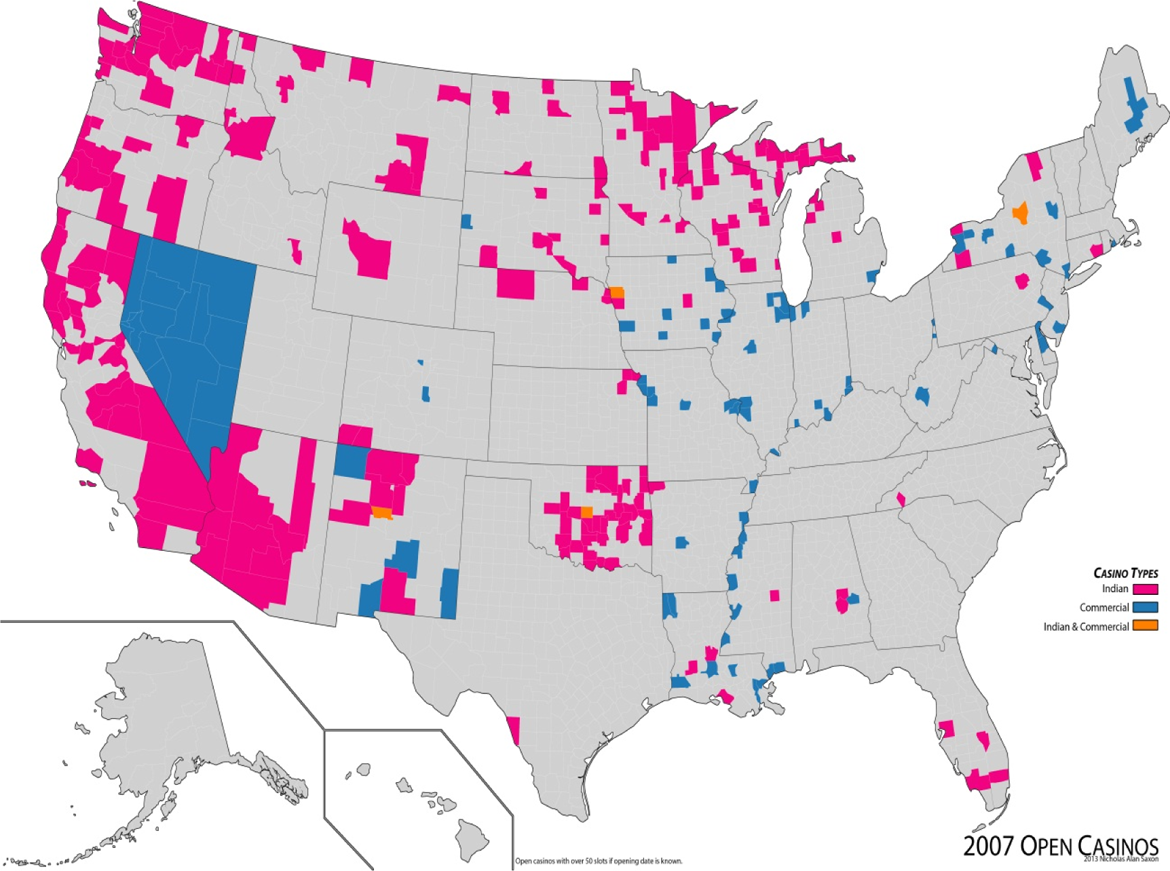
Counties with casinos in 2007.
In this article, we examine the fiscal impact legalized casino gambling, including Indian casinos, has on counties where casinos are located. We use panel data on all counties for the period 1987 through 2007 and difference-in-differences (DID) estimation to identify the impact from before to after casino legalization. We specifically look at fiscal indicators including county government revenues and expenditures, sales tax, and education expenditures. The basic DID analysis is expanded to a comparison of states that have revenue-sharing requirements with the counties in which commercial casinos operate versus states where no such revenue-sharing requirement exists. In addition, we account for the endogeneity of casino location using propensity score matching to select a set of matched control counties. Finally, we estimate our model allowing for spatial lags and errors.
Our results indicate that commercial casinos increase county government expenditures and revenues. Interestingly, however, commercial casinos’ positive impact occurs primarily in those states that have revenue-sharing agreements between state and county governments. In states where no such agreements exist, there is no statistically significant increase in county government revenues. This has important policy implications, particularly if counties where casinos are located incur costs to host casinos. In addition, there is some evidence to suggest that county government revenues, expenditures, and education expenditures decrease with the opening of Indian casinos, though this effect is diminished when comparing Indian casino counties with other Indian reservation counties that do not operate casinos.
The article is structured as follows: in the next section, we review the literature on casino impacts, focusing on studies that examined fiscal impacts. We provide a description of data and our empirical model in the third section. In the fourth section, we present our empirical results from a regression analysis as well as robustness checks using propensity score matching to account for potential bias due to nonrandom casino site selection and a spatial regression model to account for spatial lags and errors. We summarize our results and provide a discussion with our concluding remarks in the final section.
Previous Studies
Tax revenue generation and cross-border competition are frequently cited as motives for legalizing or expanding gambling. Alm, McKee, and Skidmore (1993) and Erekson et al. (1999), for example, demonstrate that fiscal stress is a key determinant in a state’s decision to legalize a lottery. Stover (1990), Davis, Filer, and Moak (1992), and Alm, McKee, and Skidmore (1993) also refer to border competition as another significant motive for lottery adoption. To date, only a few studies have examined the motive for casino legalization. Furlong (1998) identifies economic development and political feasibility (gambling taxes preferable to others) as motives but not fiscal stress. In a more comprehensive and recent study, Calcagno, Walker, and Jackson (2010) demonstrate that fiscal stress, specifically higher long-term debt and increased revenue generation, is a significant motive for casino adoption. 3
Despite the fact that fiscal stress or tax revenue generation is a major motivator for the legalization of casino gambling, there are few studies that have addressed the fiscal impact of casinos. Mason and Stranahan (1996) show the likely fiscal impacts of casino gambling in a model of state tax revenues. Although their analysis points to ways that total state tax revenues can increase with casino gambling, they also show factors that would limit the revenue increase or even decrease it, including the negative impact on state lottery revenues, Indian casinos, and competition between states. They also indicate that the negative impact on lotteries could in turn hurt the government programs that the lottery revenues are earmarked for, such as education. Empirically, Siegel and Anders (2001), Elliott and Navin (2002), Fink and Rork (2003), and Walker and Jackson (2008) show that casinos and lotteries “cannibalize” each other. Extending the analysis to aggregate state government revenues (net of federal government transfers) rather than only lottery revenue, Walker and Jackson (2011) examine multiple forms of gambling and find that casinos and greyhound racing, measured by total revenue and amount wagered, respectively, are associated with decreases in a state’s net government revenue, consistent with casinos diverting money away from other taxable sources, such as the lottery or taxable sales, and offsetting any tax revenue generated by the casino. Lotteries and horse racing, in contrast, are associated with an increase in a state’s government revenue.
Anderson (2005) and Anderson (2013) provide an excellent overview of different taxes and fees generated from casino operations including a detailed list of specific revenue sources across the states. 4 Anderson (2013) and Vaughan Williams and Paton (2013) also provide broader theoretical arguments related to the taxation of casinos. Eadington (1999) and Kearney (2005) note that there are potential direct and indirect positive revenue impacts from casinos to the extent that they are taxed by state and local governments and generate an economic impact, that is, create jobs, raise income, and promote tourism. Eadington (1999), Anderson (2005), and Kearney (2005) also point to the potential negative impacts of casinos in the form of social impacts (crime, bankruptcy, and problem gambling) and substitution among different gambling products and other taxable expenditures within and across states. 5 Siegel and Anders (1999) find that casinos in Missouri reduced sales tax revenues generated by entertainment and amusement establishments. There is also evidence that Indian casinos in Arizona drew resources away from other taxable expenditures in different communities (Anders, Siegel, and Yacoub 1998). Popp and Stehwien (2002), examining taxable gross receipts in New Mexico, show that the impact from Indian casinos depend on the number of casinos, with the opening of a single casino reducing county tax revenue by 1 percent and a second casino reducing county tax revenue by 6 percent.
Data and Empirical Methodology
This study uses county-level data for all counties in the continental United States. County-level data on income and population for the years 1987 to 2007, as well as other demographic data including the male, Caucasian, and elderly (over sixty-five years of age) population are from the US Census Bureau. County-level income and unemployment data for the same period are from the Bureau of Economic Analysis and the Bureau of Labor Statistics, respectively.
County area government finance data, specifically total expenditures and total revenues, are available between 1987 and 2007 in five-year intervals. These data are from the Annual Survey of Local Government Finances from the US Census Bureau and refer to the sum of finances of all local governments within a county including the county, city, township, special district, and school district governments. 6 All pecuniary data, county-level income, county government revenues, and county government expenditures are adjusted for inflation using the CPI and expressed in 2007 dollars.
To analyze the fiscal impact casinos had at the county level, the following DID regression is estimated:
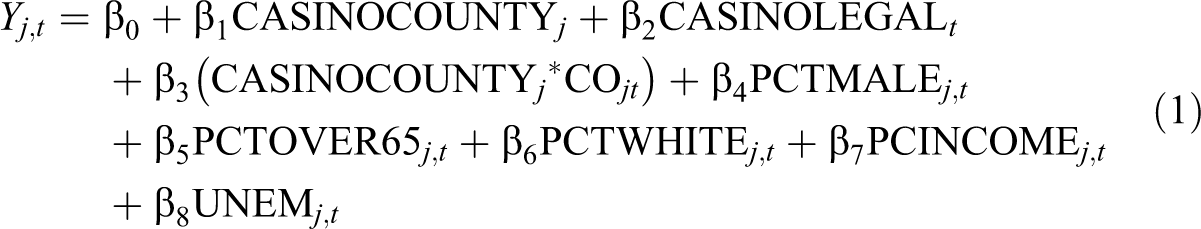

In equation (1) Yj,t represents either the log of real per capita government revenues, the log of real per capita government expenditures, the log of real per capita sales tax revenues, and the log of real per capita education expenditures for county j at time t. CASINOCOUNTY j is a dummy variable equal to one for those counties that have casinos, irrespective of whether the casinos were legal at time t, and zero for counties without casinos. This variable captures the possible differences between casino and non-casino counties prior to the opening of a casino. In our sample, 10.4 percent of our observations are casino counties, with 6.9 percent being Indian casino counties and 3.7 percent being commercial casino counties. 7 CASINOLEGAL t is a dummy variable equal to one for all years when casino gambling is legal in the state and zero for all years prior to legalization. This variable captures the changes in Yj ,t for all counties located in the state that would have occurred over time in the absence of casinos being legalized. CO j,t is a dummy variable equal to one if county j had a casino operating within its borders at time t, zero otherwise. 8 The coefficient β3 therefore captures the change in Yj,t occurring over time in counties that opened a casino relative to those that did not. 9 PCTMALE j,t , PCTOVER65 j,t , and PCTWHITE j,t are the percentage of the total population that is male, over sixty-five, and Caucasian, respectively, in county j at time t, and are included to capture possible impacts of demographic differences and changes over time on government revenues and expenditures. For example, population aging and the rising elderly population could increase certain county services (e.g., services provided to senior citizens) while at the same time having a potentially negative impact on other expenditures such as education (Honadle, Costa, and Cigler 2004; Tosun, Williamson and Yakovlev 2012; Wallace 2012). On the revenue side, both income tax (through tax breaks for the elderly) and the property tax are expected to be impacted by rising elderly population (Brunori 2007, 2011; Skidmore and Tosun 2011; Wallace 2012). Similar arguments can be made for race and gender variables both of which may impact government expenditures and revenues through differences in skill composition, school-age children, labor force participation, and demand for local services to name a few factors. Demographic differences and changes may also impact county revenues and expenditures indirectly through political participation of specific demographic groups and their influence on state and local policy making. PCINCOME j,t is real per capita income in county j at time t and UNEM j,t is the unemployment rate in county j at time t. These variables are included to account for economic variation across counties and time. 10 Finally, county j is a set of county dummy variables, whereas year t is a set of year dummy variables.
Empirical Results
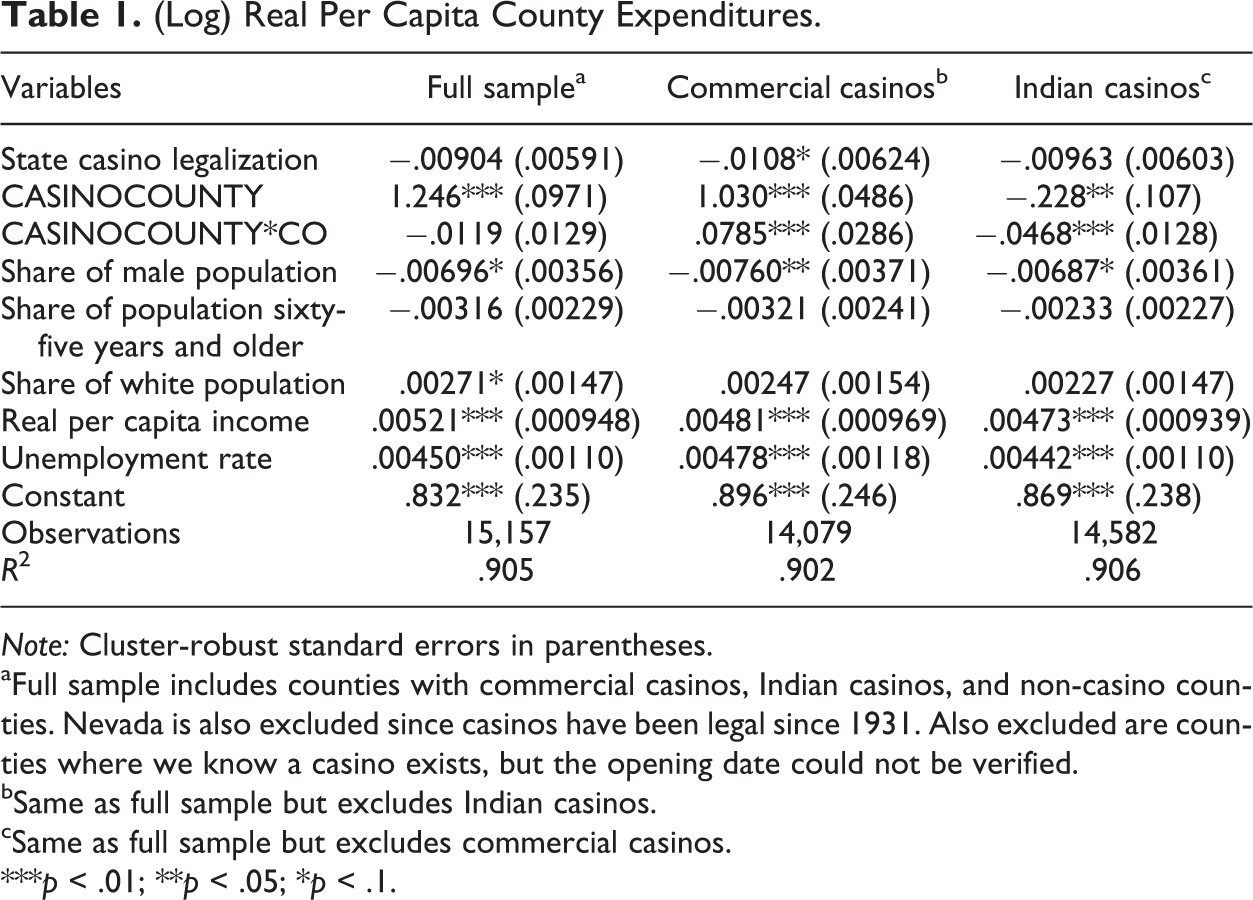
Tables 1 and 2 provide estimates of equation (1) for the log of real per capita expenditures and revenues over the 1987–2007 period. Standard errors are clustered at the county level and therefore cluster robust. In addition, it should be noted that Nevada and Atlantic City, New Jersey, are excluded from the analysis since casinos were open prior to 1987, resulting in perfect collinearity between CASINOCOUNTY j , CASINOLEGAL t , and CASINOCOUNTY j *CO j,t . 11
(Log) Real Per Capita County Expenditures.
Note: Cluster-robust standard errors in parentheses.
aFull sample includes counties with commercial casinos, Indian casinos, and non-casino counties. Nevada is also excluded since casinos have been legal since 1931. Also excluded are counties where we know a casino exists, but the opening date could not be verified.
bSame as full sample but excludes Indian casinos.
cSame as full sample but excludes commercial casinos.
***p < .01; **p < .05; *p < .1.
(Log) Real Per Capita County Revenues.
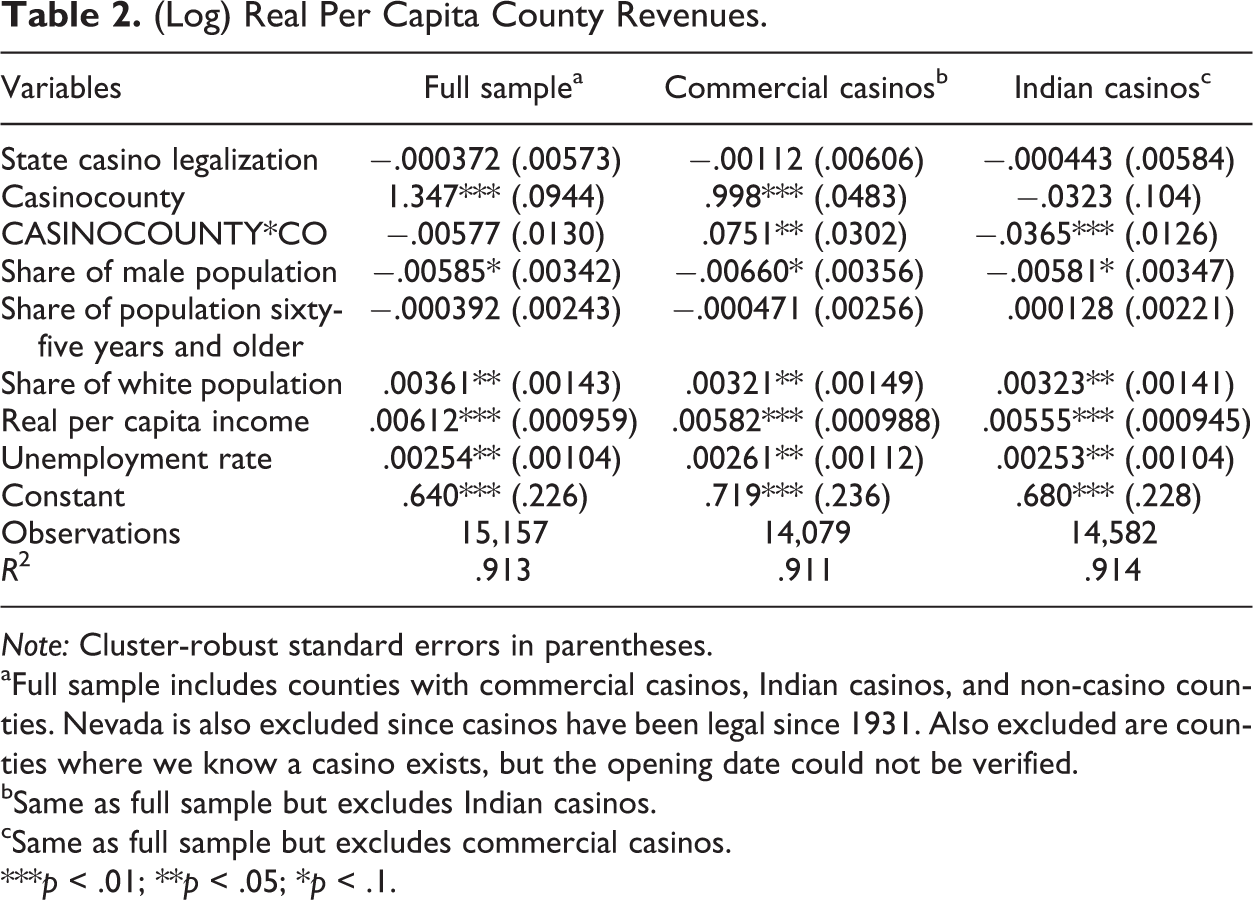
Note: Cluster-robust standard errors in parentheses.
aFull sample includes counties with commercial casinos, Indian casinos, and non-casino counties. Nevada is also excluded since casinos have been legal since 1931. Also excluded are counties where we know a casino exists, but the opening date could not be verified.
bSame as full sample but excludes Indian casinos.
cSame as full sample but excludes commercial casinos.
***p < .01; **p < .05; *p < .1.
Controlling for the percentage of the population that is male, over sixty-five, and Caucasian; the real per capita income; and the unemployment rate, as well as county and temporal fixed effects, the coefficients on CASINOCOUNTY j reported in the two tables confirm that casino counties had higher per capita revenues and expenditures irrespective of the presence of casinos. Tables 1 and 2 also demonstrate that counties with commercial casinos have higher per capita expenditures and revenues, whereas counties with Indian casinos are significantly lower. The coefficients on CASINOLEGAL t reveal a decline in real per capita revenues and expenditures during the period when casinos were legalized (the early to mid-1990s to 2007), although the decline is generally statistically insignificant.
The coefficients on CASINOCOUNTY j,t *CO j,t , the DID estimators, are positive and significant for commercial casinos but negative and significant for Indian casinos, suggesting commercial casinos are associated with increases in county government revenues and expenditures, whereas Indian casinos are associated with decreases. This is consistent with the theoretical prediction and findings from Mason and Stranahan (1996), Anders, Siegel, and Yacoub (1998), Anderson (2005), Kearney (2005), and to some extent Popp and Stehwien (2002).
We further explore the fiscal impact of casinos by examining specifically a major tax revenue source, county sales tax revenues, and a major government expenditure component, county education expenditures. These results are presented in table 3, where for brevity only the casino coefficients are reported. Results in table 3 show that while casino counties had significantly lower per capita sales tax revenues irrespective of the presence of casinos, casino openings in those counties had no significant association with county sales tax revenues. It is possible that any negative impact from casinos through a substitution effect on sales is offset by an overall positive economic impact that in turn generates a sales impact resulting in no net impact on sales tax revenues in the counties where new casinos opened, but we are not able to separately distinguish these impacts. Finally, results in table 3 suggest that casino openings are negatively associated with county education expenditures and that this reduction is primarily due to the opening of Indian rather than commercial casinos. This supports the argument in Mason and Stranahan (1996) that the negative impact of casino gambling on state lottery or other taxable expenditures may reduce those tax revenues and reduce educational expenditures, particularly when state lottery revenues are earmarked for education. Unfortunately, we are not able to examine lottery revenues separately due to a lack of data.
(Log) Real Per Capita County Sales Tax Revenues and Education Expenditures.
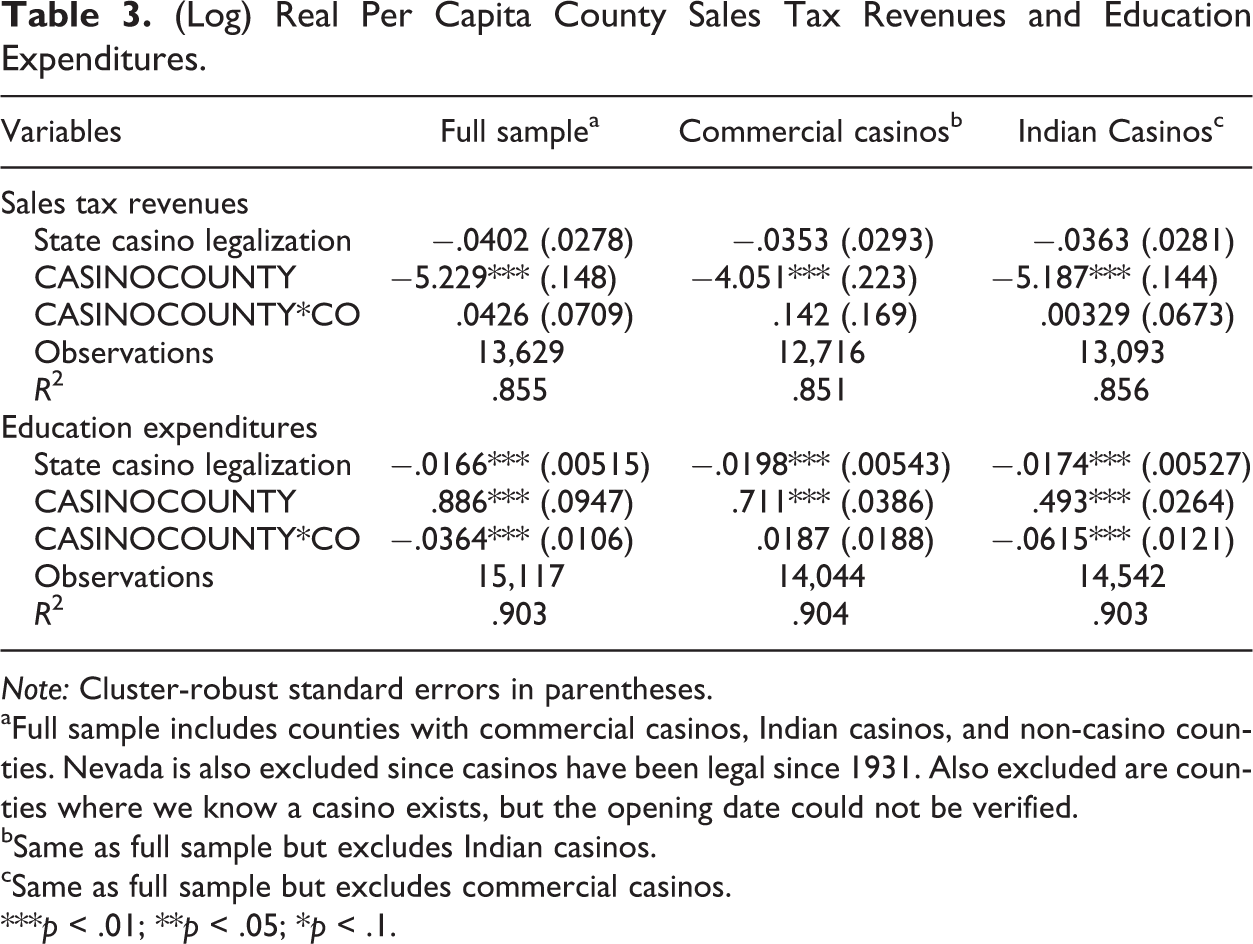
Note: Cluster-robust standard errors in parentheses.
aFull sample includes counties with commercial casinos, Indian casinos, and non-casino counties. Nevada is also excluded since casinos have been legal since 1931. Also excluded are counties where we know a casino exists, but the opening date could not be verified.
bSame as full sample but excludes Indian casinos.
cSame as full sample but excludes commercial casinos.
***p < .01; **p < .05; *p < .1.
The results in tables 1 through 3 suggest commercial casinos are associated with an increase in a county’s overall revenues and expenditures, whereas Indian casinos are associated with a reduction in overall revenues and expenditures as well as educational expenditures. As noted earlier, the results for Indian casinos are consistent with earlier studies that find the introduction of Indian casinos displaces other taxable expenditures. The results for commercial casinos, however, are less clear. On one hand, the increase in overall revenues and expenditures is consistent with positive economic development. On the other, if economic development was the driver of the increase in revenues and expenditures, an increase in sales tax revenues might also be expected. This suggests that the impact is predominantly fiscal, that is, resulting from the direct taxation of casinos. 12 However, taxes on commercial casinos are not levied uniformly across states nor are the distribution of revenues generated from those taxes. 13 Some states, namely, Colorado, Illinois, Iowa, Kansas, Louisiana, Mississippi, Pennsylvania, and South Dakota, explicitly and legislatively share a portion of the tax proceeds with host counties. 14 For example, in Colorado, 12 percent of gaming revenue proceeds goes to the counties where casinos are located whereas in Iowa, 0.5 percent is distributed to the county. Other states, such as Missouri, Michigan, and New Mexico (racinos), have no explicit legislation dictating revenue sharing between states and counties. 15 To assess whether these revenue-sharing laws have an impact on county government revenues and expenditures, we estimate our DID model separately for states with and without this legislation.
Table 4 provides results from estimating our DID model for our four county revenue and expenditure categories for commercial casinos distinguished by whether the state has legislated state/county revenue sharing. Indian casinos are excluded from this analysis. For brevity, only the coefficients on CASINOCOUNTY j , CASINOLEGAL t , and CASINOCOUNTY j *CO j,t are reported. The results present a stark contrast. Casinos operating in counties with revenue-sharing legislation are associated with positive and significant increases in per capita general and sales tax revenues as well as expenditures. Casinos in counties without sharing legislation result in no significant change in general revenues or expenditures and a significant decrease in sales tax revenues. This suggests that the source of the increased revenue for commercial casinos is legislation that mandates county governments receive a share of tax revenues rather than casinos stimulating economic development. Indeed, the negative impact on sales tax revenue for counties without revenue sharing is consistent with the diversion of other taxable spending found for Indian casinos. Interestingly, however, casinos in counties without revenue-sharing legislation are associated with an increase in educational expenditures. 16
Commercial Casinos in States With and Without County Revenue Sharing.a
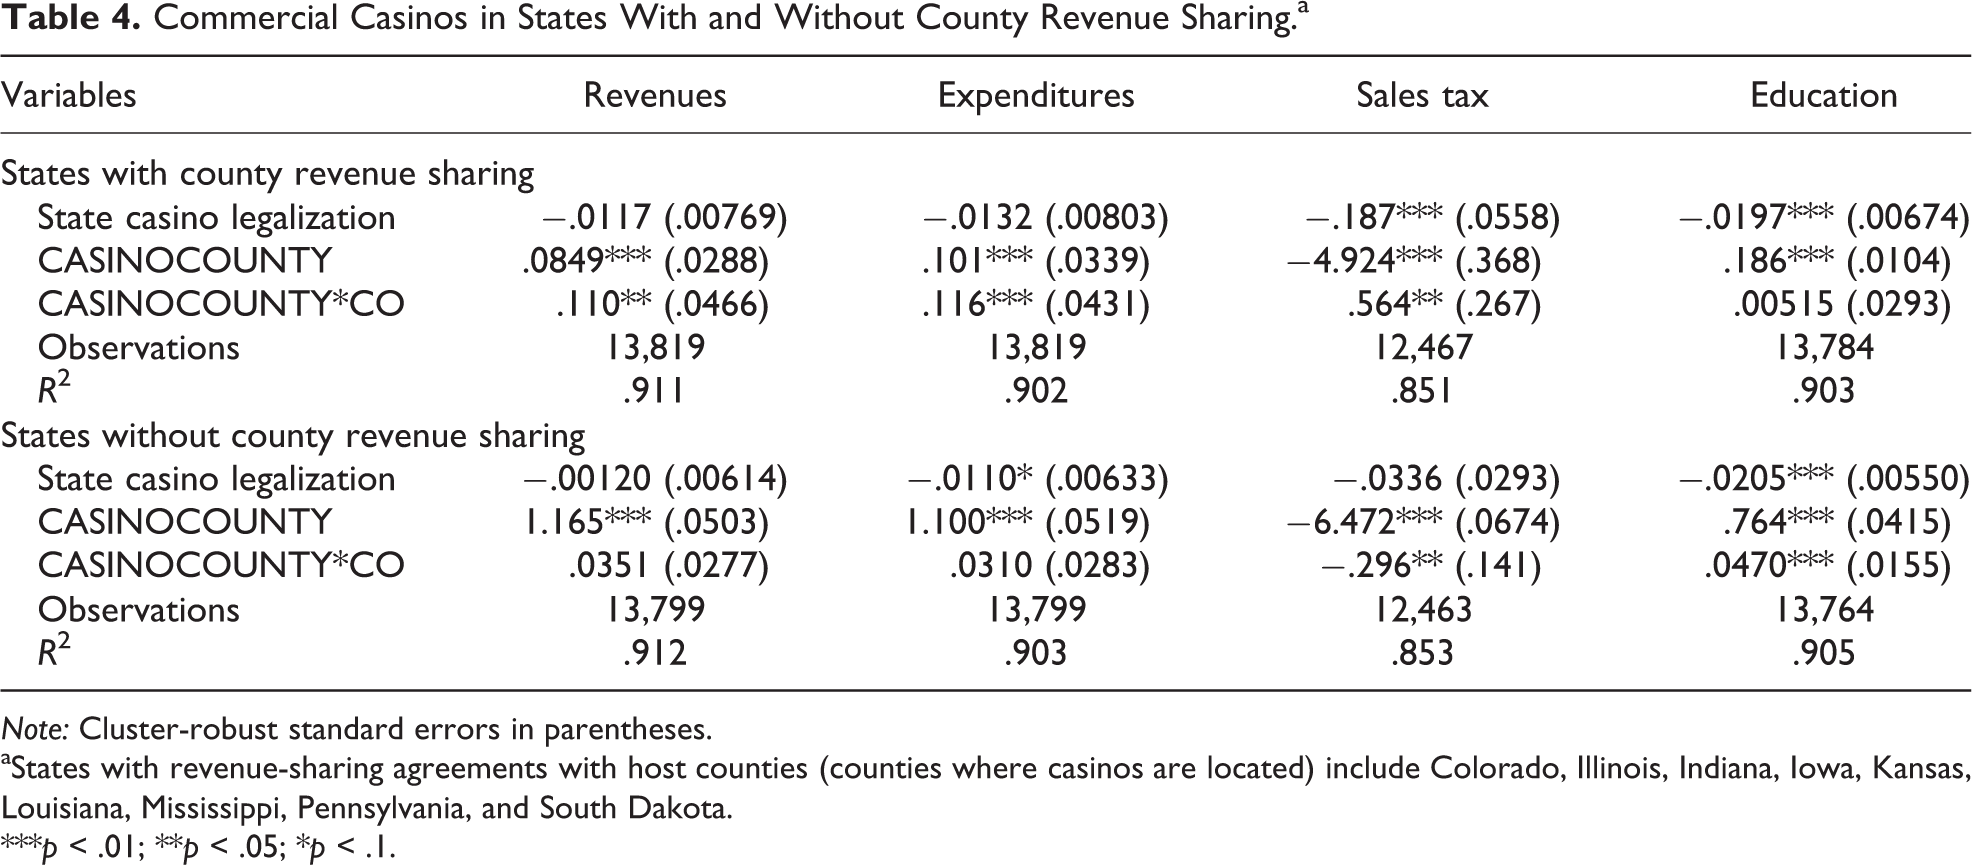
Note: Cluster-robust standard errors in parentheses.
aStates with revenue-sharing agreements with host counties (counties where casinos are located) include Colorado, Illinois, Indiana, Iowa, Kansas, Louisiana, Mississippi, Pennsylvania, and South Dakota.
***p < .01; **p < .05; *p < .1.
The results in table 4 have important policy implications. If communities that host casinos incur a larger portion of any costs associated with casinos (e.g., problem gambling, increased traffic congestion), those communities without revenue-sharing legislation may be insufficiently compensated. Of course, a more detailed examination of the costs associated with the opening of a casino would need to be completed to say anything more definitive. It is not the intention of this article to estimate the costs associated with gambling or perform a cost–benefit analysis of opening casinos, but the findings here suggest that the increases in county government revenues and expenditures associated with the opening of commercial casinos are contingent upon state legislation and limited to those states legislatively required to share revenue with host counties and not due to broader economic development.
Robustness Checks
In this subsection, we perform robustness checks for the results presented earlier. Our first robust check recognizes that Indian casinos are predominately located on Indian reservations where the economic and social conditions likely differ from nonreservation communities. For example, Indian per capita income is 45 percent of US per capita income, while poverty rates for Indians are three times higher (Akee and Taylor 2014). Although we do not have fiscal data for reservations, we do know in which US counties reservations exist. Therefore, we estimate our DID using only those counties in which Indian reservations are present, thereby comparing Indian casino counties with other Indian reservation counties that do not have a casino. The results are presented in Table 5. Relative to other reservation counties, Indian casinos neither decrease nor increase per capita government revenues and expenditures. Similar to our earlier findings, there is no noticeable impact on per capita sales taxes. The reduction in educational expenditures remains, although it is only significant at the 10 percent level. These results suggest that Indian casinos have no net fiscal impact on counties in which they are located relative to their non-casino reservation counterparts. It is important to remember, however, that we are not analyzing the economic impact of the casino on the reservation, just the county in which it is located.
Indian Reservation Counties.a
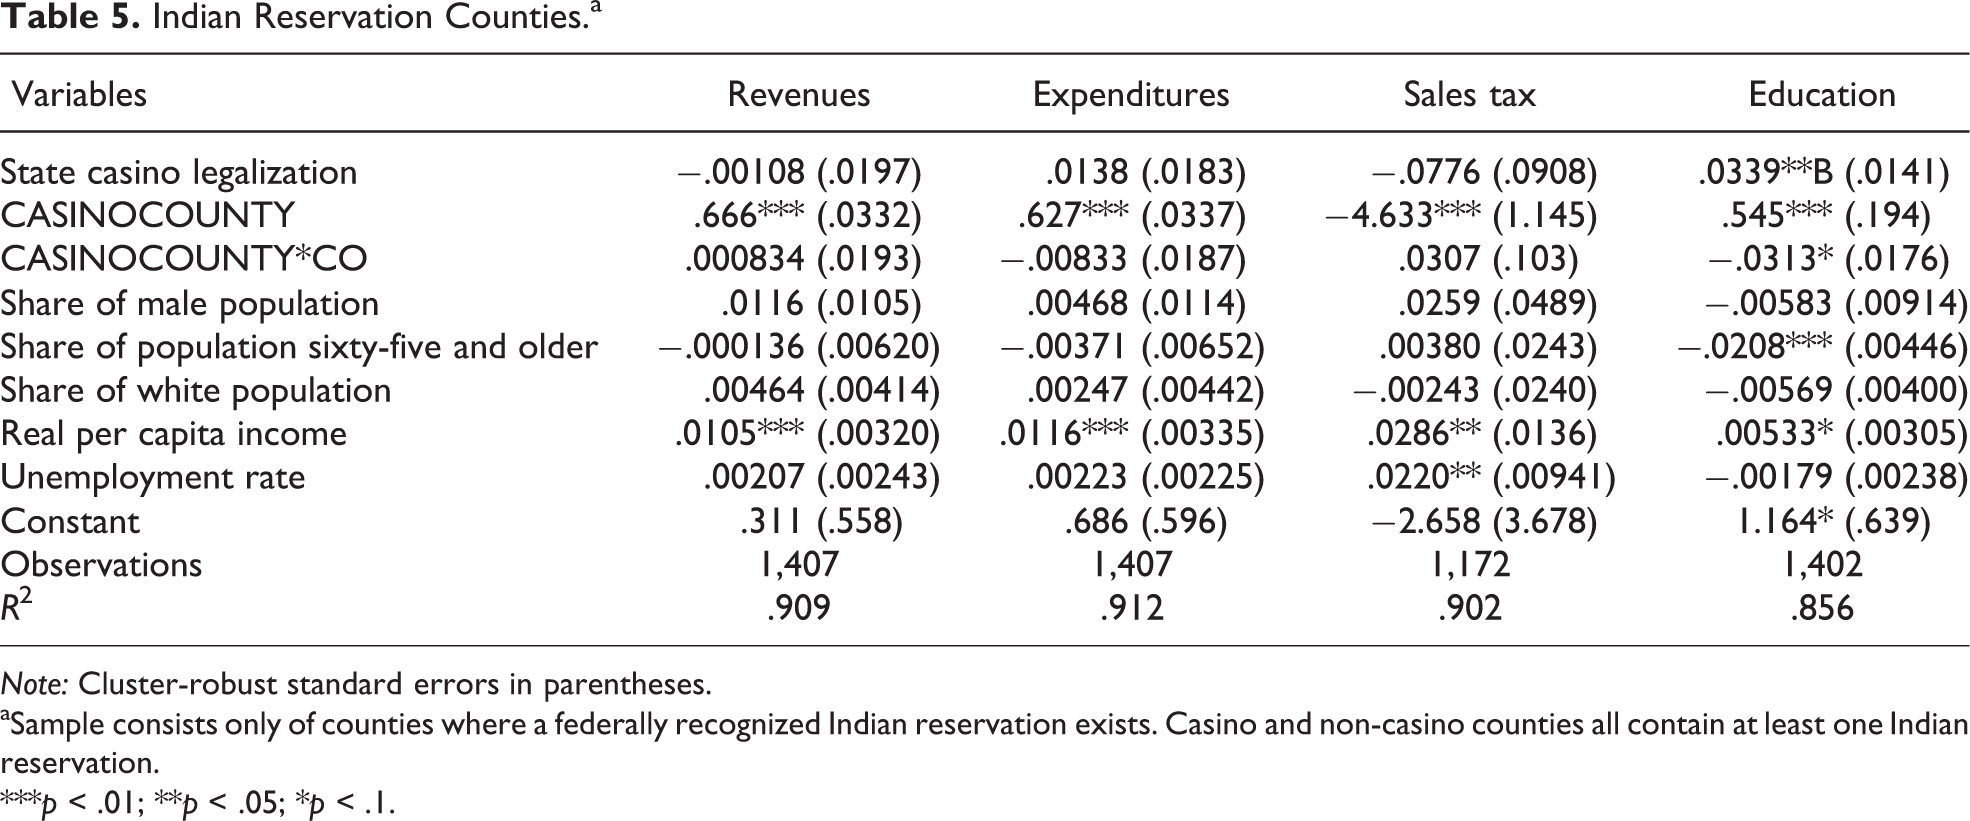
Note: Cluster-robust standard errors in parentheses.
aSample consists only of counties where a federally recognized Indian reservation exists. Casino and non-casino counties all contain at least one Indian reservation.
***p < .01; **p < .05; *p < .1.
Our second robustness check recognizes that casino location is an endogenous rather than random occurrence. As such, our estimates may be biased. To account for this, we use propensity score matching to select a set of matched non-casino control counties for comparison to our casino counties (Caliendo and Kopeinig 2008; Imbens and Wooldridge 2009). Specifically, for each casino county we choose the top ten non-casino counties based on their propensity score and estimate our DID regression on the sample of casino counties and their matched control counties.
The propensity score is estimated using a probit regression with CASINOCOUNTY j , whether the county ever has a casino, as the dependent variable. Our independent variables are total population; real per capita income; the unemployment rate, the percentage of the population that is male, white, and over sixty-five years of age; per capita county government expenditures; revenues, sales tax revenues, and educational expenditures; the percentage of the population with a high-school degree; percentage of the population with a college degree; and a dummy variable for whether an Indian reservation exists in the county.
The model is estimated twice, obtaining two sets of matched control counties: once with the independent variables measured in 1987, before casinos outside of Nevada and New Jersey existed, and again in 1997, the halfway point of our sample. Choosing 1987 as a base year ensures that the anticipation of casino openings is not influencing the values of our selection variables. However, because the time from 1987 to 2007 is long and other factors may change, we also use 1997 as a base year as a robustness check. As demonstrated later, the results are consistent across both years. The propensity score model is estimated imposing a caliper of .1, implying that matched control communities whose propensity score is more than .1 away from a casino county are not eligible for control counties. 17
The results from estimating our DID model on our matched sample are presented in Table 6. For brevity, only the coefficients on CASINOCOUNTY j *CO j,t are reported. As before, results are reported for all casinos as well as commercial and Indian casinos separately. 18 The results, whether using 1987 or 1997 values for independent variables, generally support our earlier results. Namely, commercial casinos are associated with increases in per capita government revenues and expenditures. The results for Indian casinos are generally consistent in sign but less statistically significant than our earlier results. Indian casinos have a negative impact on general revenues and expenditures, but this is generally not statistically significant. Similarly, the negative impact of Indian casinos on education is only significant when matching on 1997 values. These results are similar to those when we restricted our sample to Indian reservation counties, which is not surprising, given that the presence of an Indian reservation was one of our selection criteria. Taken as a whole, the results suggest that our aforementioned findings for commercial casinos are robust but that those for Indian casinos may suffer some selection bias and are more difficult to generalize. 19
Impact of Casino Opening in Casino Counties Compared to Matched Non-casino Control Counties.a
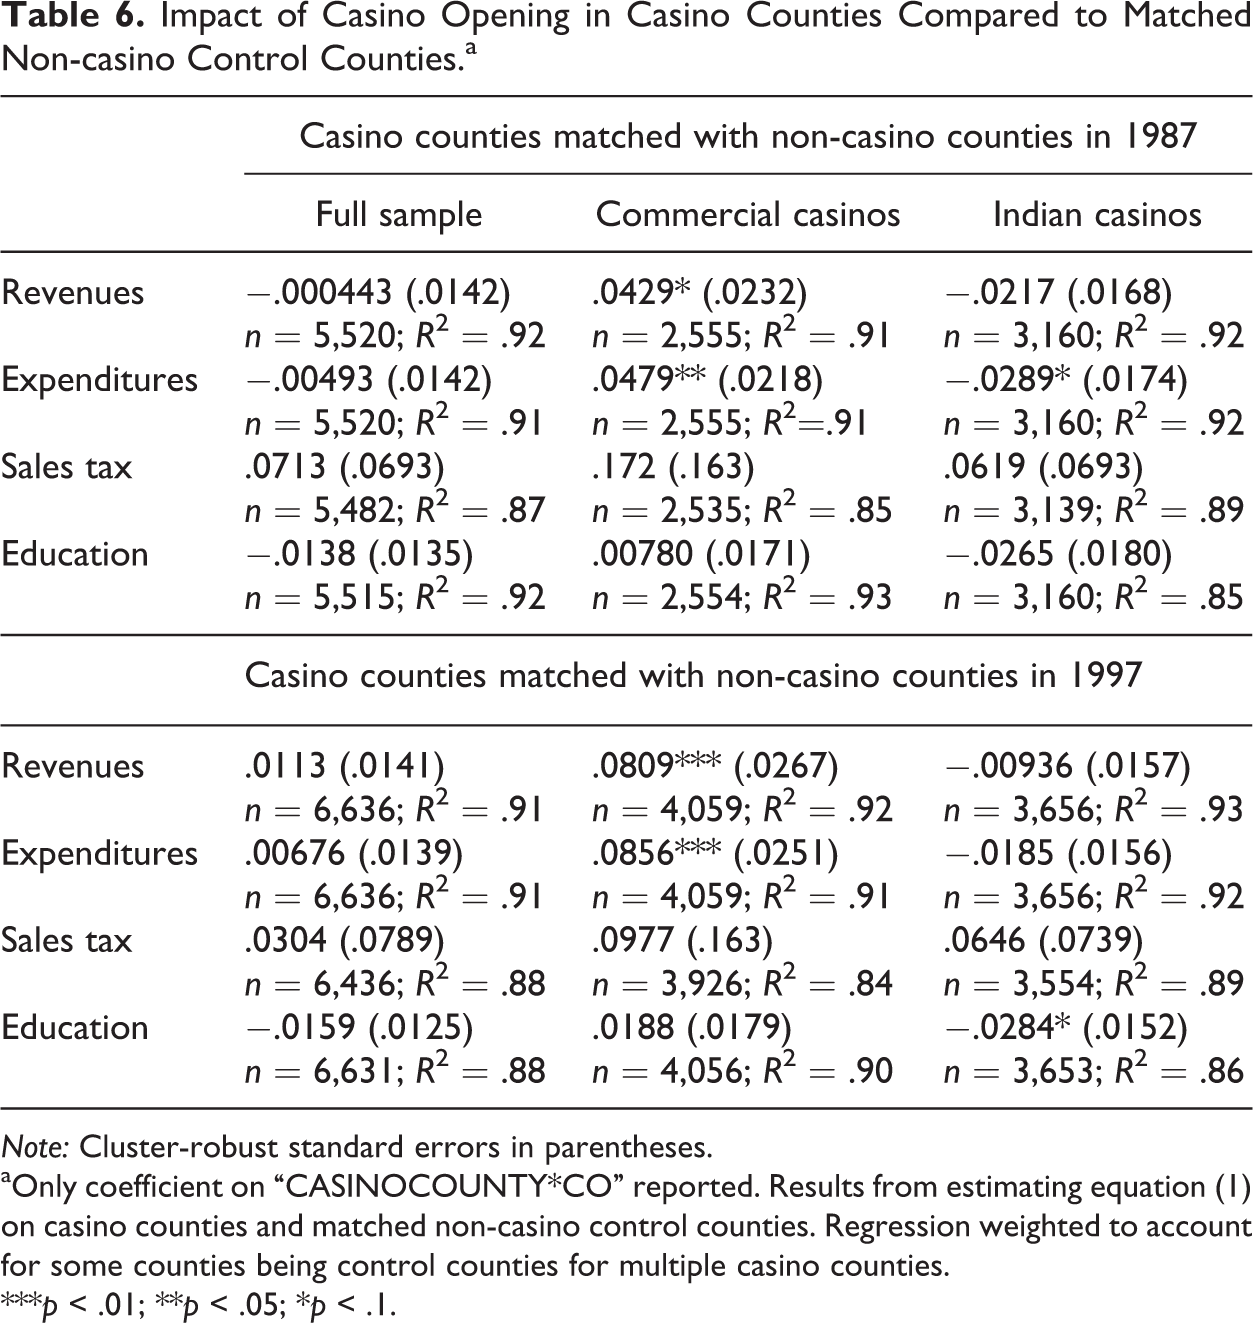
Note: Cluster-robust standard errors in parentheses.
aOnly coefficient on “CASINOCOUNTY*CO” reported. Results from estimating equation (1) on casino counties and matched non-casino control counties. Regression weighted to account for some counties being control counties for multiple casino counties.
***p < .01; **p < .05; *p < .1.
Our last robustness check recognizes that there may be significant spatial effects associated with casino openings. Our main results are robust to estimating both a spatial autoregressive model and a spatial error model. Details are provided in the online appendix as a supplemental file.
Concluding Remarks
In this article, we use panel data on all US counties for the period 1987 to 2007 and DID estimation to identify the fiscal impact before and after casino legalization. We specifically look at the impacts on real per capita county government revenues and expenditures, sales tax revenues, and educational expenditures.
Our results indicate that casinos overall did not have a statistically significant impact on per capita government expenditures and revenues. However, this was due to differential impacts between commercial and Indian casinos. Specifically, commercial casinos are associated with a statistically significant increase in per capita government revenues and expenditures, whereas Indian casinos are associated with a decrease in per capita revenues and expenditures. The results for commercial casinos are robust to both selection bias and spatial impacts. However, the increase in revenues and expenditures associated with commercial casinos is linked to legislation mandating that county governments receive a portion of casino tax revenue. In states where counties are guaranteed a portion of casino tax revenue, the openings of casinos are associated with an increase in overall revenues and expenditures of approximately 11 percent. Absent this legislation, however, commercial casinos have no statistically significant impact on county area government revenues and expenditures.
The results for Indian casinos are less conclusive. The negative impact on overall revenues and expenditures is primarily found when comparing Indian casino counties with all non-casino counties. When restricting the sample to only Indian reservation counties or accounting for selection bias, which also accounts for the presence of an Indian reservation, the negative impact is less pronounced. Thus, it is possible that the negative results demonstrated in tables 1 and 2 stem, in part, from selection bias rather than a diversion of funds from county governments. For example, if counties with Indian reservations have slower economic growth or structurally different economies than other counties, then the reduction in county revenues after the opening of Indian casinos may reflect variation in growth between reservation counties and nonreservation counties rather than an impact of the casino. There is evidence to support this. For example, counties with Indian reservations had slower average five-year growth in real per capita revenues than non-Indian reservation counties (9.34 percent vs. 11.65 percent, respectively). The same is true for real per capita expenditures (9.80 percent vs. 12.50 percent for reservation and nonreservation counties, respectively). 20 Thus, there are notable differences between counties with Indian reservations and those without, suggesting that comparing Indian casino counties with counties without a casino and without a reservation may contribute to the reduction in revenues and expenditures found in tables 1 and 2. 21
Casinos are simultaneously criticized for cannibalizing other business while at the same time praised for job creation and economic development. The results for sales tax revenues suggest that both claims may be exaggerated. Cannibalization of business would be associated with a decrease in sales tax revenues as gamblers substitute expenditures on gambling for other taxable expenditures, whereas significant economic development should increase overall expenditures and sales tax revenues. Evidence of neither is found here.
The results for county education expenditures show a significant negative association with Indian casinos, which is consistent with the finding on total county government expenditures for those casinos and the argument that cannibalization of state lottery revenues by casino gambling could hurt education programs. This result is more robust to selection bias in that the decrease in educational expenditures is found even when restricting the sample to Indian reservation counties. However, this result is only significant at the 10 percent level and does not account for educational expenditures made on the reservation.
In summary, this article provides evidence that commercial casinos are associated with increased county government revenues and expenditures but that this increase is tied to legislation mandating that the state share casino tax proceeds with the county. Absent revenue-sharing legislation, the opening of commercial casinos has no effect on county revenues or expenditures. Whether the increase in county expenditures is due to the social impacts of casinos and increased demand for public services or simply governments spending their additional revenue cannot be determined with our data but is a subject worthy of further exploration. However, to the extent that governments incur costs associated with the opening of casinos, the abovementioned results indicate that legislated agreements covering the sharing of casino tax revenues are critical.
The evidence for Indian casinos is less clear. The reduction in educational expenditures associated with the opening of Indian casinos is robust and consistent with expenditures on Indian casinos being diverted from other taxable sources, particularly lottery expenditures. However, there is mixed evidence that Indian casinos are associated with decreased overall government revenues and expenditures, with the result contingent upon whether the comparison group is all nongaming counties or nongaming Indian reservation counties. Whether the reduction in overall revenues and expenditures is due to a substitution away from other taxable expenditures or differences in counties with reservations is an issue in need of further investigation. However, in no instances were Indian casinos associated with an increase in county government revenues or expenditures, regardless of the comparison group. Given the spread of Indian casinos, their impact on both the reservation and the county in which those reservations are located is an important issue in need of further analysis.
A limitation of the analysis presented in this article is that we are only able to account for the existence of a casino in a county not the volume of casino gambling, as data on volume (e.g., casino revenue) is not readily available over our sample period, particularly for Indian casinos that are not required to publicly report gross revenue. Given that the fiscal impact of casinos is likely to be a function of the size of the industry, not just its presence, this is an area in need of further investigation. Moreover, our analysis only examines the fiscal conditions of aggregated county area governments. An analysis of casinos at the city level would lend additional insight into the fiscal impact at a more localized level distinguishing between, for example, communities where casinos operate versus surrounding communities.
In closing, together with the results of, for example, Anders, Siegel, and Yacoub (1998); Siegel and Anders (1999, 2001); and Walker and Jackson (2011), our results suggest that casinos are not necessarily a means to improve fiscal conditions as is so often promised. Indian casinos have no or even a negative impact for county governments, and improved fiscal conditions associated with commercial casinos are due to explicit legislation mandating that casino tax revenues be allocated to counties that host casinos. Local governments hoping to fiscally benefit from casinos should therefore ensure that a portion of casino tax revenue is allocated to them.
Footnotes
Acknowledgments
We are grateful to Jonathan Taylor and The Taylor Policy Group for providing data on the location and opening dates of Indian casinos. We are also grateful to the advice of two anonymous referees, Professor Jim Alm, and participants at the National Tax Association annual conference. Nicholas Saxon provided valuable research assistance.
Declaration of Conflicting Interests
The authors declared no potential conflicts of interest with respect to the research, authorship, and/or publication of this article.
Funding
The authors received no financial support for the research, authorship, and/or publication of this article.
Notes
References
Supplementary Material
Please find the following supplemental material available below.
For Open Access articles published under a Creative Commons License, all supplemental material carries the same license as the article it is associated with.
For non-Open Access articles published, all supplemental material carries a non-exclusive license, and permission requests for re-use of supplemental material or any part of supplemental material shall be sent directly to the copyright owner as specified in the copyright notice associated with the article.