
Abstract
In 2012, Illinois passed legislation allowing video gaming terminals (VGTs) outside of casinos. This legislation was passed to increase tax revenues from gambling in a market that had seen decreases in revenues and admissions over the past 8 years. VGTs may substitute for casino gambling and have a negative impact on casino and tax revenue. Using ordinary least squares and vector autoregressive models, we find that casino slot revenues decrease by about 0.05 percent for each 1 percent increase in VGT revenues. Admissions decrease by about eleven people per VGT. A Granger causality test suggests causation is running from VGTs to admissions. Thus, there is substitution between VGTs and casino gambling but not so large as to reduce tax revenue. Overall tax revenue from gambling, both casino and VGT, has increased for Illinois. However, local communities where casinos are located have experienced declines in casino tax revenue that have exceeded the gains from VGT revenue.
Prior to 1991, casino gambling was legal in Nevada (1933), New Jersey (1976), and South Dakota (1989). Today, commercial casino gambling, excluding Indian casinos, is legal in twenty-four states and generates over US$40 billion in annual revenue. 1 This revenue is an important tax base for states and totaled $9 billion in 2015, accounting for three to four percent of casino states’ tax collection, on average.
Illinois legalized and began operating casinos in 1991 and was one of the first states outside of Nevada, New Jersey, and South Dakota to do so. Yet, as will be demonstrated below, casino revenue in Illinois (and several other states with a mature casino industry) has been declining, and with it the corresponding tax revenue. In response to this, in September 2012, the state of Illinois voted to allow video gaming terminals (VGTs) in entities other than traditional casinos, thereby becoming one of the few states other than Nevada to allow video gaming in bars and other sanctioned locations outside of casinos (The Video Gaming Act, 230 ILCS 40, 2009).
The law allows for the operation of at most five VGTs at retail establishments that serve alcohol as well as truck stops, fraternal halls, and veterans’ halls. As of 2017, bars comprised 90 percent of VGT establishments, with veterans’ halls (4.8 percent), truck stops (4.3 percent), and fraternal halls (1.6 percent) making up a small minority. After legalization by the state, municipalities could opt out of VGT legalization by ballot measure, while for unincorporated areas, a county board could decide. The law also stipulates that establishments within 1,000 feet of existing casinos and within 100 feet of schools or places of worship are not permitted to receive licenses to operate VGTs. While the fact that municipalities could exclude themselves from VGTs introduces the possibility of selection bias, VGTs are very widespread throughout the state, with only 128 municipalities prohibiting VGTs, whereas 1,066 municipalities allow them. In our sample, only two of ten casino communities, Des Plaines, an independent suburb of Chicago, and East St. Louis prohibit VGTs. Chicago is the most notable city to prohibit VGTs. The reasons for communities opting to prohibit VGTs are not clear.
At the end of 2017 (the end of our sample period), there were nearly 27,000 VGTs at over 6,000 establishments. While several states have video lottery terminals (VLTs) that are operated by the state lottery, Illinois is the first state outside of Nevada to have VGTs in multiple, noncasino locations and have a substantial commercial casino gambling industry. 2
This article examines the degree of substitutability (or complementarity) that may exist between VGTs and casinos and the likely fiscal impact of this legislation. Will expanded VGTs increase tax revenue for the state or will VGTs substitute for casino gambling sufficiently to neutralize or reduce tax collections? What about local communities where casinos are located? These questions are explored using data on the number and revenue of VGTs and various casino measures (revenue and admissions). Specifically, this study examines the effect of VGT revenues and the number of VGT machines on casinos through six state-level measures: total casino revenue, casino slot machine revenue, casino table game revenue, number of slot machines in casinos, number of table games in casinos, and the number of admissions to casinos. Admissions are calculated using turnstiles installed in all Illinois casinos that tally each person entering a casino. From these models, impacts on the state as a whole and the communities where casinos are located are estimated.
This is an important topic for gambling markets because it will help state and local governments better understand the fiscal implications of allowing VGTs (or other forms of casino-style gambling) outside of casinos, informing their decisions on slot machine distribution, tax rates, and revenue sharing between state and local governments. In 2018, Missouri, Indiana, and Mississippi were considering legislation to allow VGTs (Sieroty 2018). Casino owners in Missouri have expressed concern about how this legislation may impact their own revenue. If casino gambling is reaching a mature industry status and gambling revenues and tax collections growth slows or declines, states will be under pressure to reduce expenditures or find alternative sources of tax revenues. Expanding existing forms of gambling may be an appealing source, so the spread of VGTs in Illinois provides a unique and interesting case study.
There exist few, if any, previous studies that have examined the impact of the widespread introduction of slot machines outside of casinos on casino revenue and tax revenue. This is largely due, as noted above, to the fact that Illinois is one of the few states, if not the only state, other than Nevada, to have such an industry structure. The only study we were able to find was Marfels (1997) who studies the introduction of VLTs in Canada (Manitoba and Nova Scotia) and the United States (South Dakota, which only allows commercial casinos in one city, Deadwood). Marfels (1997) concludes that VLTs had no impact on casinos. However, the study was conducted when both casino gambling and VLTs were relatively new and casino gambling was less widespread. Moreover, no formal empirical model is estimated to control for base trends or other factors. Rather, the conclusion is reached by showing that both VLT and casino revenue were growing over the sample period. Paton and Vaughan Williams (2013) examine the impact of the introduction of fixed-odds betting terminals in licensed betting shops in the UK on the number of gambling machines in other facilities such as casinos and pubs. They find no evidence of a reduction of machines in other venues although licensed betting shops do substitute the fixed-odds betting machines for traditional gambling machines. However, the comparison of results in the UK is imperfect as Paton and Vaughan Williams (2013) note that the strict limits imposed on number and payout of machines in the UK and relatively small size of the casino industry make comparisons with the United States tenuous.
The substitutability or complementarity of different forms of gambling on one another, specifically the relationship between the revenues of the different forms of gambling, has been more broadly studied, and, while not conclusive, finds that different forms of gambling substitute for one another, although not necessarily dollar for dollar. Walker and Jackson (2008) provide one of the more extensive analyses of the relationship between various forms of gambling, specifically casinos, horse racing, dog racing, and lottery. Walker and Jackson (2008) find that casino revenue and lottery sales and casinos revenue and dog racing handle are substitutes for one another but that horse racing handle and casino revenue have a complementary relationship as does Indian casino square footage and casino revenue. Casinos in neighboring states, however, are substitutes for casinos in the existing state.
Several studies find that casinos in close proximity to one another are substitutes (Nichols 1998; Walker and Nesbit 2014). Gallagher (2014) examines the Illinois market between 1994 and 2006 and finds that the number of competing casinos as opposed to the size of competing casinos is the factor driving substitution. Importantly, and relevant to this study’s findings, Gallagher (2014) finds that much of the substitution is due to a decrease in patronage or number of visitors to the casino, with spending per patron declining, but not significantly. Marionneau and Nikkinen (2017) provide a thorough review of the above and various other studies and conclude that new gambling products generally substitute for one another but incompletely, resulting in an expansion of the gambling industry overall when a new form is introduced.
The results from this study suggest that there is a statistically significant relationship between VGTs and casinos, with VGTs negatively impacting the casino market. Specifically, the main effects are through casino and slot revenues and casino admissions, with the latter being most significantly impacted. Similar to Gallagher (2014), admissions appear to be the main source of revenue substitution, given that revenue per admission remains essentially constant after the introduction of VGTs. Based on a vector autoregressive (VAR) model and Granger causality test, the decrease in admissions is being “caused,” in the Granger sense, by an increase in the number of VGT machines. While this effect is clear and significant, its persistence is unclear at this stage, and, as concluded by Marionneau and Nikkinen (2017), the substitution is incomplete and Illinois’ gambling market, in terms of casino and VGT revenue, has expanded as have statewide gambling tax revenues. 3 In contrast, however, communities where casinos are located have experienced a decline in overall tax revenue, as the decrease in casino and admissions tax revenue has exceeded the increased VGT tax revenue.
Data and Empirical Methodology
Data for this article are gathered from reports provided online at the Illinois Gaming Board website. Two forms of data were merged together: riverboat casino monthly reports and video gaming monthly reports. For casinos, we have data on total revenue, slot revenue, table revenue, number of slot machines, number of table games, and number of admissions. For VGTs, we have data on total VGT revenue and the number of VGT machines. All monetary variables are expressed in real terms and are adjusted to January 2018 dollars using the Consumer Price Index (CPI). Casino data during the Great Recession causes nonstationarity issues and, given that VGTs were not legalized until 2012, the sample selected for our regression analysis is from January 2013 to December 2017. The first four months of VGT data (September to December 2012) are omitted due to the rapid growth during this period which also introduces nonstationarity issues and is not representative of longer-run growth trends.
Table 1 provides descriptive statistics for various casino revenue and admissions variables as well as VGT revenue, machines, and establishments for our regression sample period, 2013 to 2017. To emphasize that casino revenue and admissions were declining prior to the legalization of VGTs, the descriptive statistics for the casino variables are also reported for 2009 and 2017. Averages for VGT revenue, machines, and establishments are also provided separately for 2013 and 2017.
Casino and Video Gaming Terminal (VGT) Descriptive Statistics (Monthly Averages, Revenue in Millions of Real Dollars).

Over the sample period of 2013 to 2017, casino revenue averages $125 million per month, with the large majority (81 percent) being slot revenue. Average casino revenue per admission is $115. VGT revenue over 2013 to 2017 averages $74.18 million per month, from a monthly average number of machines of 19,319.
In 2009, monthly average casino revenue was $138.37 million, but by 2017, this had fallen to $82.62 million. Revenue per admission, however, remained relatively constant, averaging approximately $115 in 2009 and $121 in 2017, even though the number of monthly admissions declined from an average of 1.2 million in 2009 to nearly 912,000 in 2017. The average number of slot machines decreased slightly from 10,071 to 10,015, whereas the number of table games increased from 236 to 303. The growth in VGTs can be seen by comparing 2013 with 2017. In 2013, monthly VGT revenue averaged $26.77 million but had increased to $110.37 million in 2017, surpassing average monthly casino revenue. The average number of VGT machines also notably increased during this time, from 8,230 in 2013 to 26,812 in 2017. Moreover, the average monthly revenue per machine increased over this period from $3,301 in 2013 to $4,117 in 2017, showing that expanded revenue is not solely due to the expansion of machines or establishments.
Figures 1 through 3 show monthly casino revenue, admissions, casino revenue per admission, and VGT revenue over the period 2009 to 2017 (2013–2017 for VGTs) and highlight the differing performance between the two sectors. The opening of The Rivers Casino in Des Plaines in August 2011 is also indicated. The negative trend in casino revenue and admissions is very evident as is the rapid acceleration of VGT revenue. Casino revenue per admission is more stable, exhibiting a U-shape. 4

Illinois monthly casino revenue and admissions (2009 to 2017). Casino revenue and admissions both show declining trends over time.
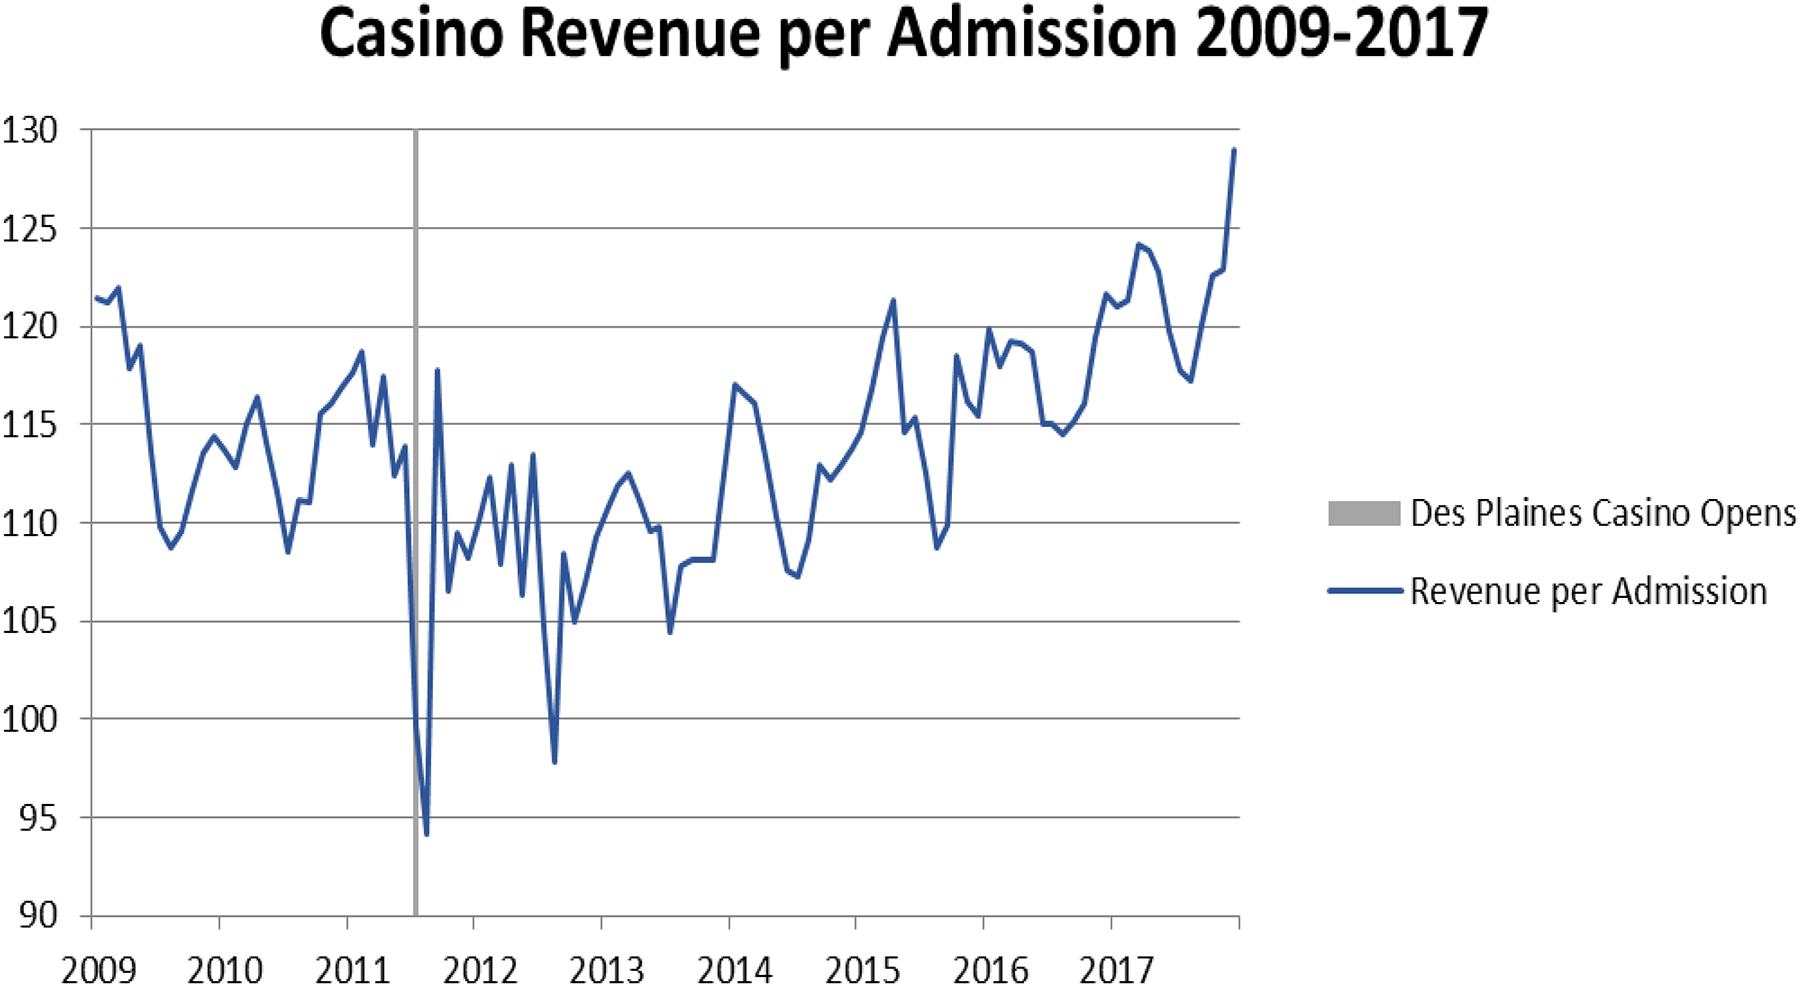
Illinois monthly casino revenue per admission, 2009 to 2017, dollars. Revenue per admission is U-shaped and has remained relatively constant between 2009 and 2017.
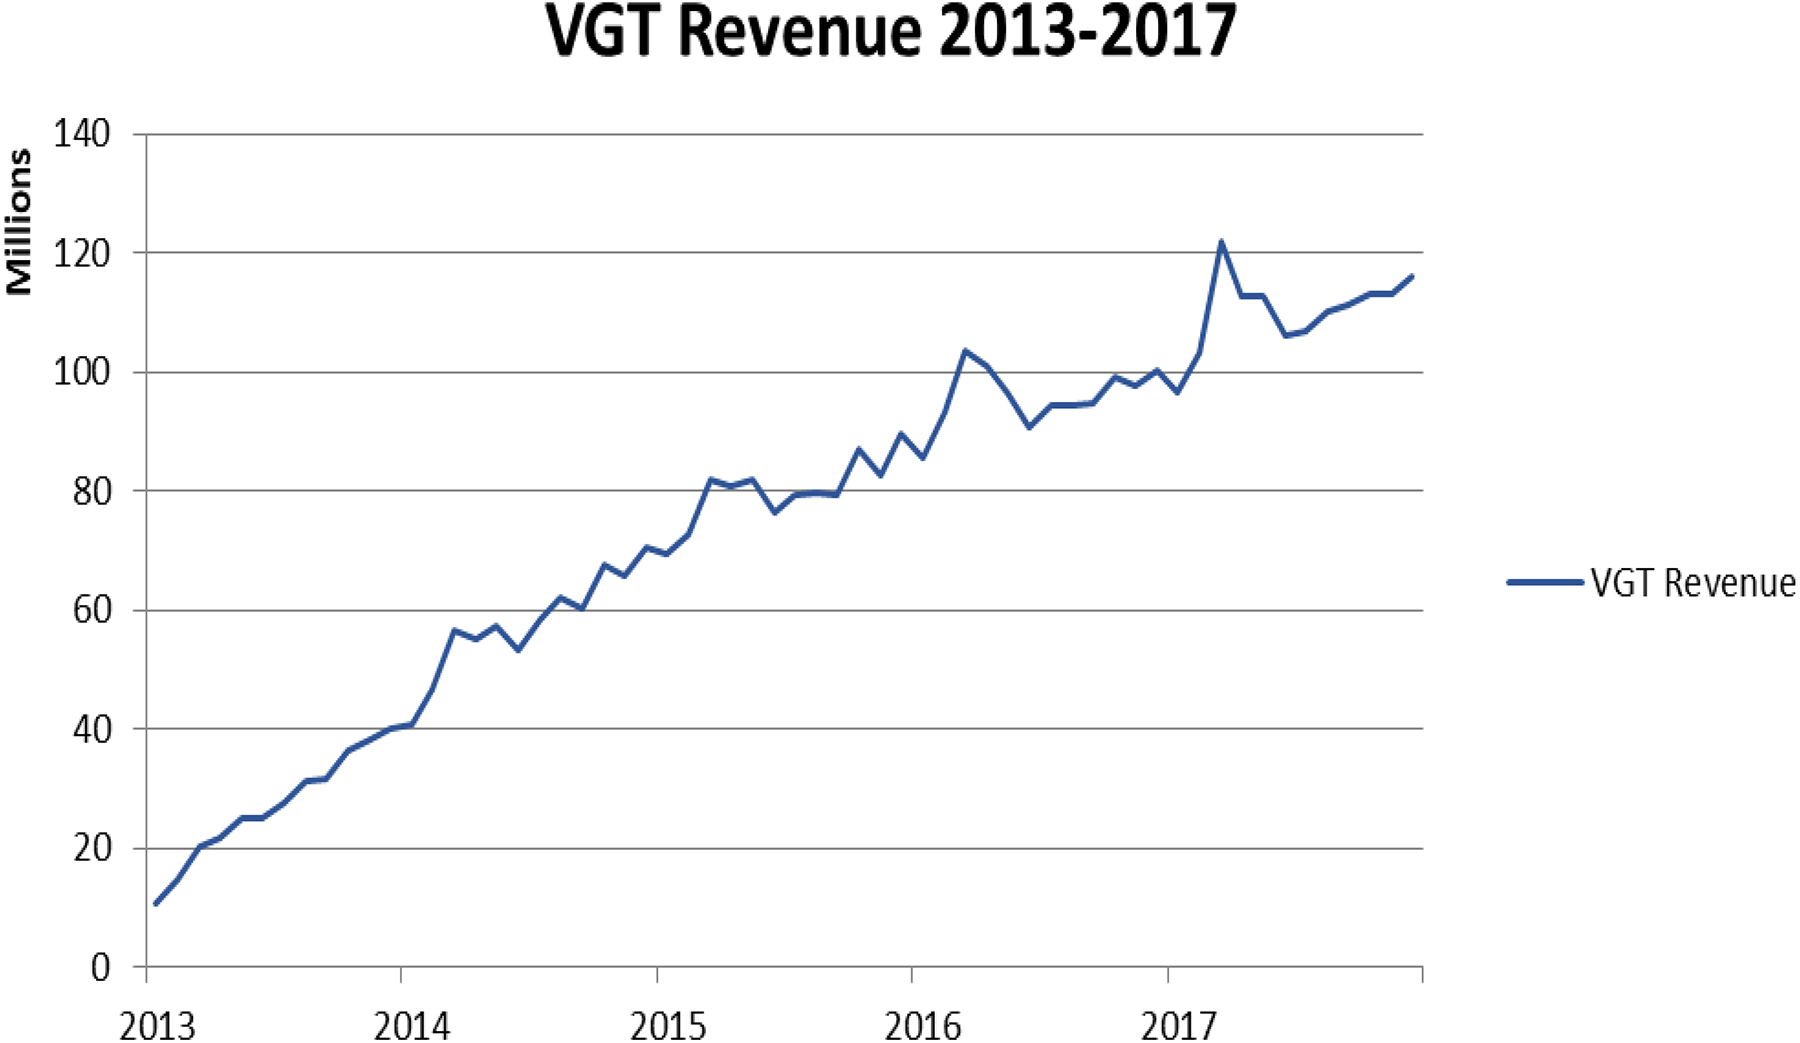
Illinois video gaming terminal (VGT) revenue, 2013 to 2017, millions of dollars. VGT revenue has consistently increased over 2013 to 2017.
Figure 1 illustrates that casino revenue exhibits both a negative trend and seasonal variation. We account for this with spring, summer, and fall seasonal dummy variables, a time trend, and an industry cycle variable. The industry cycle variable was gathered from the Illinois Department of Employment Security using the Current Employment Statistics. This variable tallies the total employment in the arts, entertainment, and leisure industry in Illinois and is intended to capture changes in casino revenue that are reflective of changes in the broader industry as a whole in order to better isolate changes resulting from the introduction of VGTs. On average, there are 50,000 workers in this industry during the sample period with employment trending upward but exhibiting cyclicality similar to casino revenue. Finally, travel costs are accounted for by including the national average price for gasoline from 2013 to 2017. The petroleum data were collected from the U.S. Energy Information Administration. The average gas price during the sample period is $3.18 but was near, or exceeded, $4 for much of 2013 and 2014, with a maximum monthly average of $4.04.
To estimate the relationship between the expansion of VGTs and casino revenue, both an ordinary least squares (OLS) and VAR model are estimated. The OLS model allows us to estimate the response of various casino measures to the expansion of VGT revenue and machines. The Phillips–Perron unit root test was used to test each of the variables in the model for stationarity. These results were also verified with the Augmented Dickey–Fuller (ADF) test. The Phillips–Perron and ADF tests showed that the natural logs of casino revenue, slot revenue, table revenue, and VGT revenue are all trend stationary, as are the number of slot machines, tables, casino admissions, and VGT machines. Gas prices required first differencing to achieve stationarity.
The following OLS model is estimated for various casino measures:

In equation (1), Casino Measuret is measured by the natural log of casino revenue, slot revenue, or table revenue or the number of slot machines, number of tables, and casino admissions. Our main variable of interest is VGT Measuret, which is either the natural log of VGT revenue or the number of VGT machines. Trendt is a linear time trend; IndTrendt , as described in more detail above, is total employment in the arts, entertainment, and leisure industry in month t and is included to account for any industry-specific trends not captured otherwise; and GasPricet is the national average price for gasoline in month t. St are seasonal dummy variables equal to one in spring, summer, and fall with winter being the excluded period. The above model is estimated for the period January 2013 to December 2017, omitting the last four months of 2012 when VGTs were first legalized and spreading rapidly. 5 Including these four months prevented the VGT variables from achieving stationarity.
In addition to the OLS model estimated in equation (1), and based on the findings that admissions to casinos are most affected by the spread of VGT machines, the following VAR model is estimated to further explore the relationship between admissions and the number of VGTs:
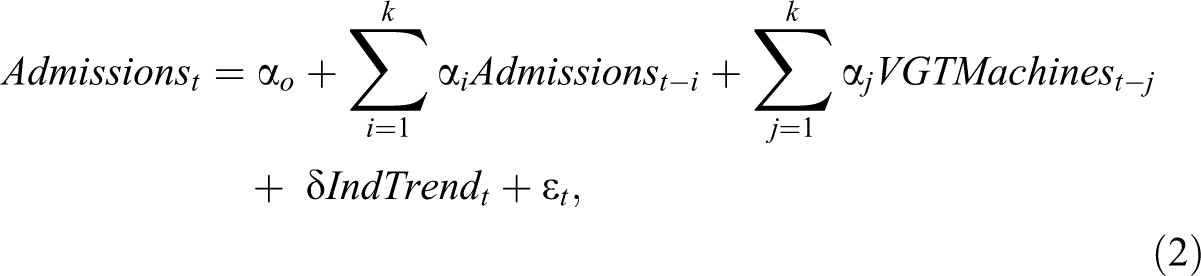

In equations (2) and (3), k = 3. Three lags were optimal in four of the five different criteria that were used to determine lag length, including the sequential modified likelihood ratio test statistic, final prediction error, Akaike information criterion, and Hannan–Quinn information criterion. Industry employment is also included as a control variable. US gas prices were also included but found to be insignificant and consequently dropped.
Empirical Results
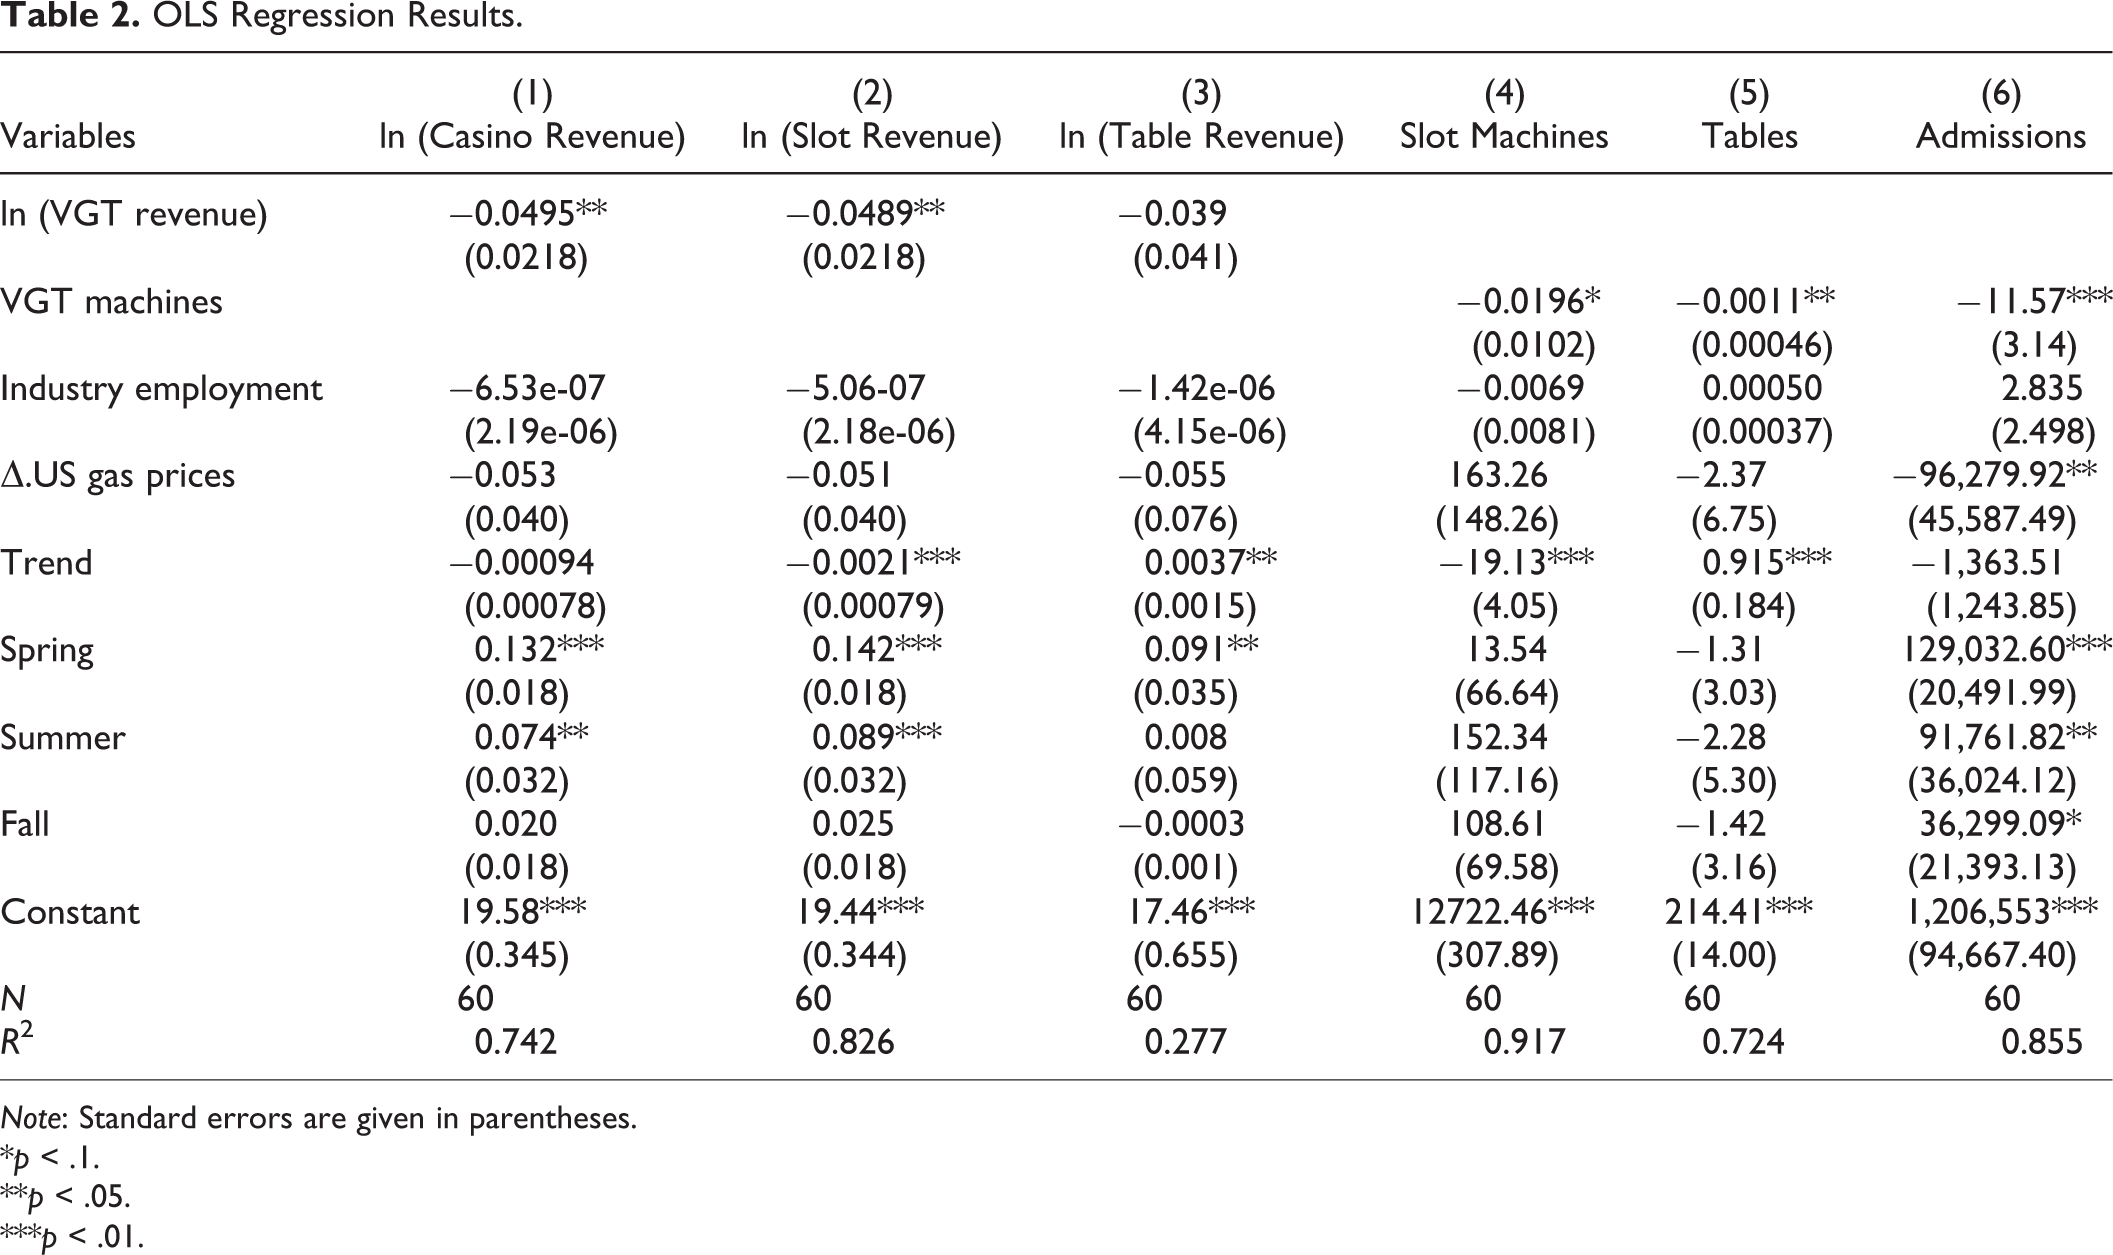
The OLS estimates of equation (1) are provided in table 2. The growth in VGT revenue is significantly associated with the decline in casino revenue. According to this model, a 1 percent increase in VGT revenues is associated with a decline in casino revenues by approximately 0.05 percent. As evidenced in table 2, this decline is driven by a decline in slot machine revenue, with table revenue not significantly correlated with VGT revenue.
OLS Regression Results.
Note: Standard errors are given in parentheses.
*p < .1.
**p < .05.
***p < .01.
The decline in casino and slot revenue is in addition to the overall decline in revenue observed in figure 1 and demonstrated by the negative and generally statistically significant coefficient on the trend variable in equation (1). Industry-specific trends and gas prices are also negatively associated with casino revenue but not significantly so. Seasonality in casino revenue is also evident, increasing in spring and summer relative to winter.
The last three columns of table 2 show OLS results when our casino measure is a count variable, including the number of slot machines, the number of table games, and the number of casino admissions, again defined as the number of people entering the casino as gathered from turnstile counts. Here, our independent variable of interest is the number of VGT machines to assess whether VGT machines impact casino machines and admissions. 6
The most notable correlation with the expansion of VGT machines is on casino admissions. Specifically, each additional VGT machine is associated with approximately eleven fewer casino admissions per month. Given the growth in VGT machines over the period, this is significant, especially for local communities that receive $1 for each admission. The state receives $2 for every admission. 7
As seen in table 2, admissions are the only one of our casino measures influenced by gas prices. Each $1 increase in gasoline prices is associated with approximately 96,000 fewer monthly admissions, suggesting patrons economize on the number of trips they take, although perhaps not the amount of money they spend at casinos when visiting. As with casino revenue, admissions are highest in the spring and summer.
The results for the number of slot machines and table games suggest that the expansion of VGT machines is associated with a decline in slot machines and table games, although the impact is relatively small. In addition, the coefficient on the trend variable reveals that, ceteris paribus, the number of table games has been trending slightly upward over the time period, whereas the number of slot machines has been declining over time.
The negative association between VGTs and admissions seems to be driving the results. This is consistent with Gallagher (2014) who found much of the substitution between various forms of gambling to be explained by a decrease in admissions as opposed to declining revenue. Furthermore, as evident in figure 2, revenue per admission has been relatively stable over the sample period, suggesting fewer people are visiting the casinos now that VGT machines are more widely available, but those that are going to casinos are spending the same amount of money as prior to the VGT expansion. Thus, the decline in total revenue (and slot revenue) seems to be due to fewer people visiting casinos. 8
The OLS results suggest that the expansion of VGT machines in Illinois has been associated with a decline in casino revenue and admissions, with admissions being the driving factor. These results do not show causation of course, nor do they show the dynamics of any impact. Is the negative impact immediate or delayed, for example? To better ascertain the timing of these impacts, we estimate the VAR model shown in equations (2) and (3) and conduct a Granger causality analysis to determine precedence and impulse response functions to better analyze changes to revenue and admissions over time.
The results from estimating equations (2) and (3) are shown in table 3. The results for equation (2) show that an additional VGT machine in month t − 1 results in a decrease in admissions of approximately 68 persons in period t. Previous lags are not significant suggesting that the decrease in admissions quickly follows the increase in VGTs rather than being prolonged over several months. The results from estimating equation (3) reveal that the number of VGT machines are not significantly influenced by the lag of admissions, suggesting that a change in admissions is not influencing the expansion of VGTs. 9
Vector Autoregressive Results.
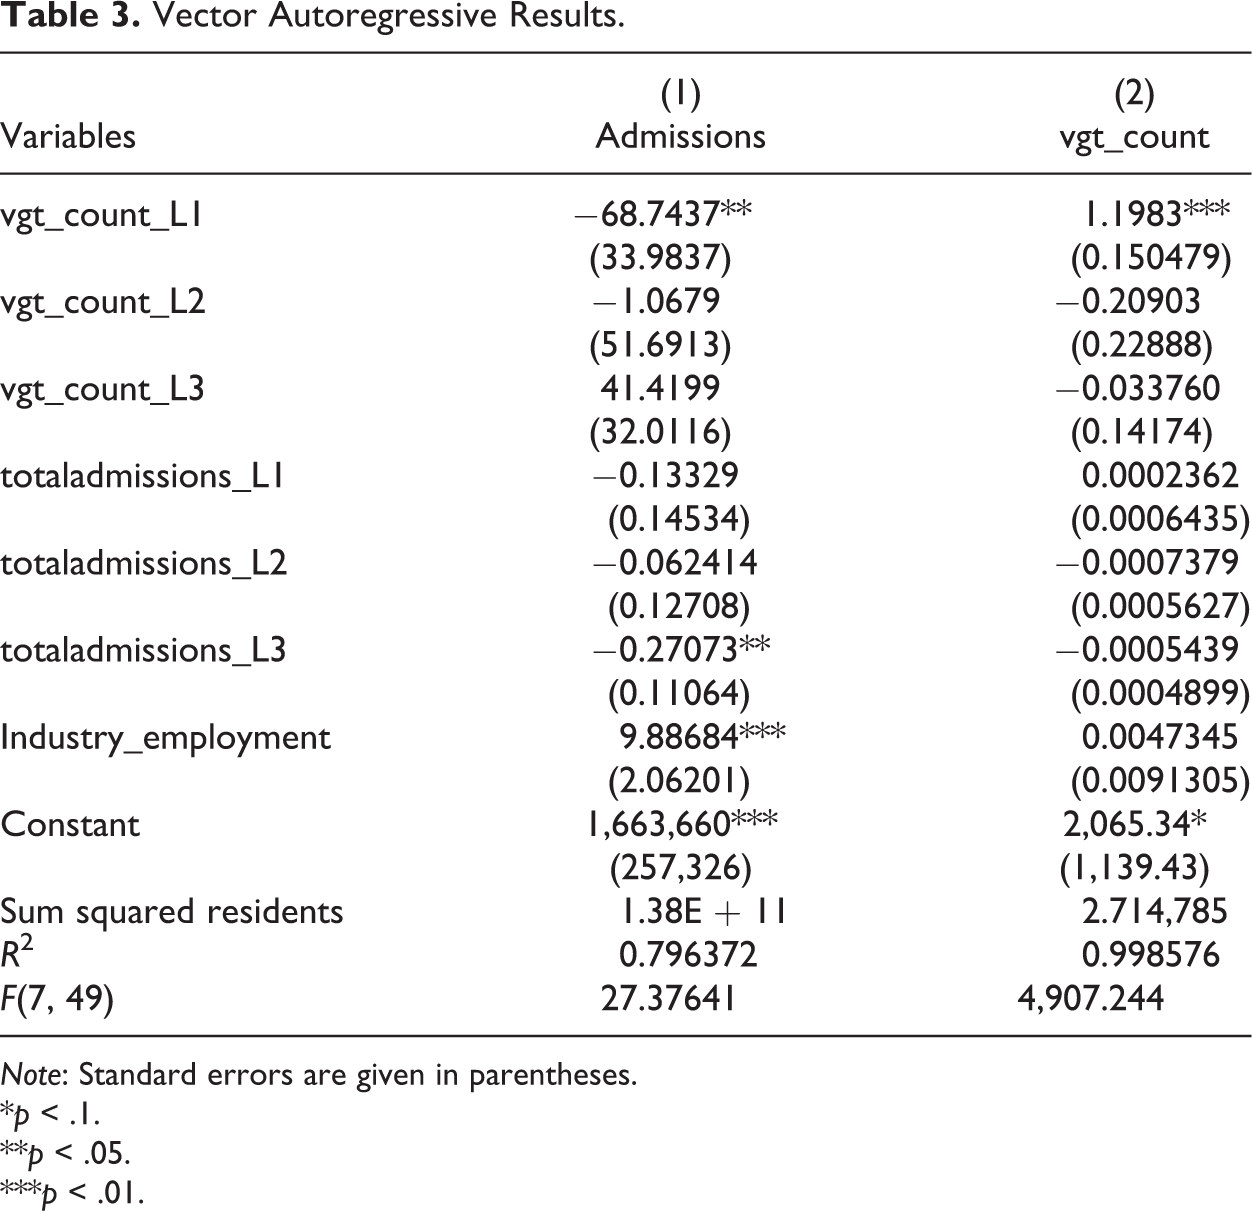
Note: Standard errors are given in parentheses.
*p < .1.
**p < .05.
***p < .01.
A Granger causality test, shown in table 4, reveals that admissions in prior periods do not have a statistically significant impact on the number of VGT machines but that VGT machines do have a statistically significant impact on the number of admissions. Intuitively, this makes sense as well. VGTs are a similar product to slot machines at casinos but are more conveniently located and widespread across the state. Such an expansion will likely decrease the number of people visiting casinos, if for no other reason than reduced travel costs. Decreased casino admissions, however, are less likely to be a factor in an establishment’s decision to add up to five VGTs to their current business. The results in tables 3 and 4 suggest that VGTs are influencing the market for casinos but that casinos do not have much influence over the market for VGTs.
Pairwise Granger Causality Tests.

Note: Causality runs one directionally from VGT count to admissions.
** Null hypothesis can be rejected at the 5 percent level.
Impulse response graphs shown in figures 4 and 5 reinforce the results presented in tables 3 and 4. The impulse response functions show the first twelve months after a shock to each market. Figure 4 provides a prediction of how casino admissions would be affected if VGT machines increased one standard deviation (about 6,700 machines). As suggested by the results in table 3, admissions would initially decrease by approximately 15,000 people, with subsequent impacts being less pronounced. Figure 5 demonstrates that if admissions increased by one standard deviation (about 180k people), VGT machines would be minimally affected by approximately sixty fewer machines.
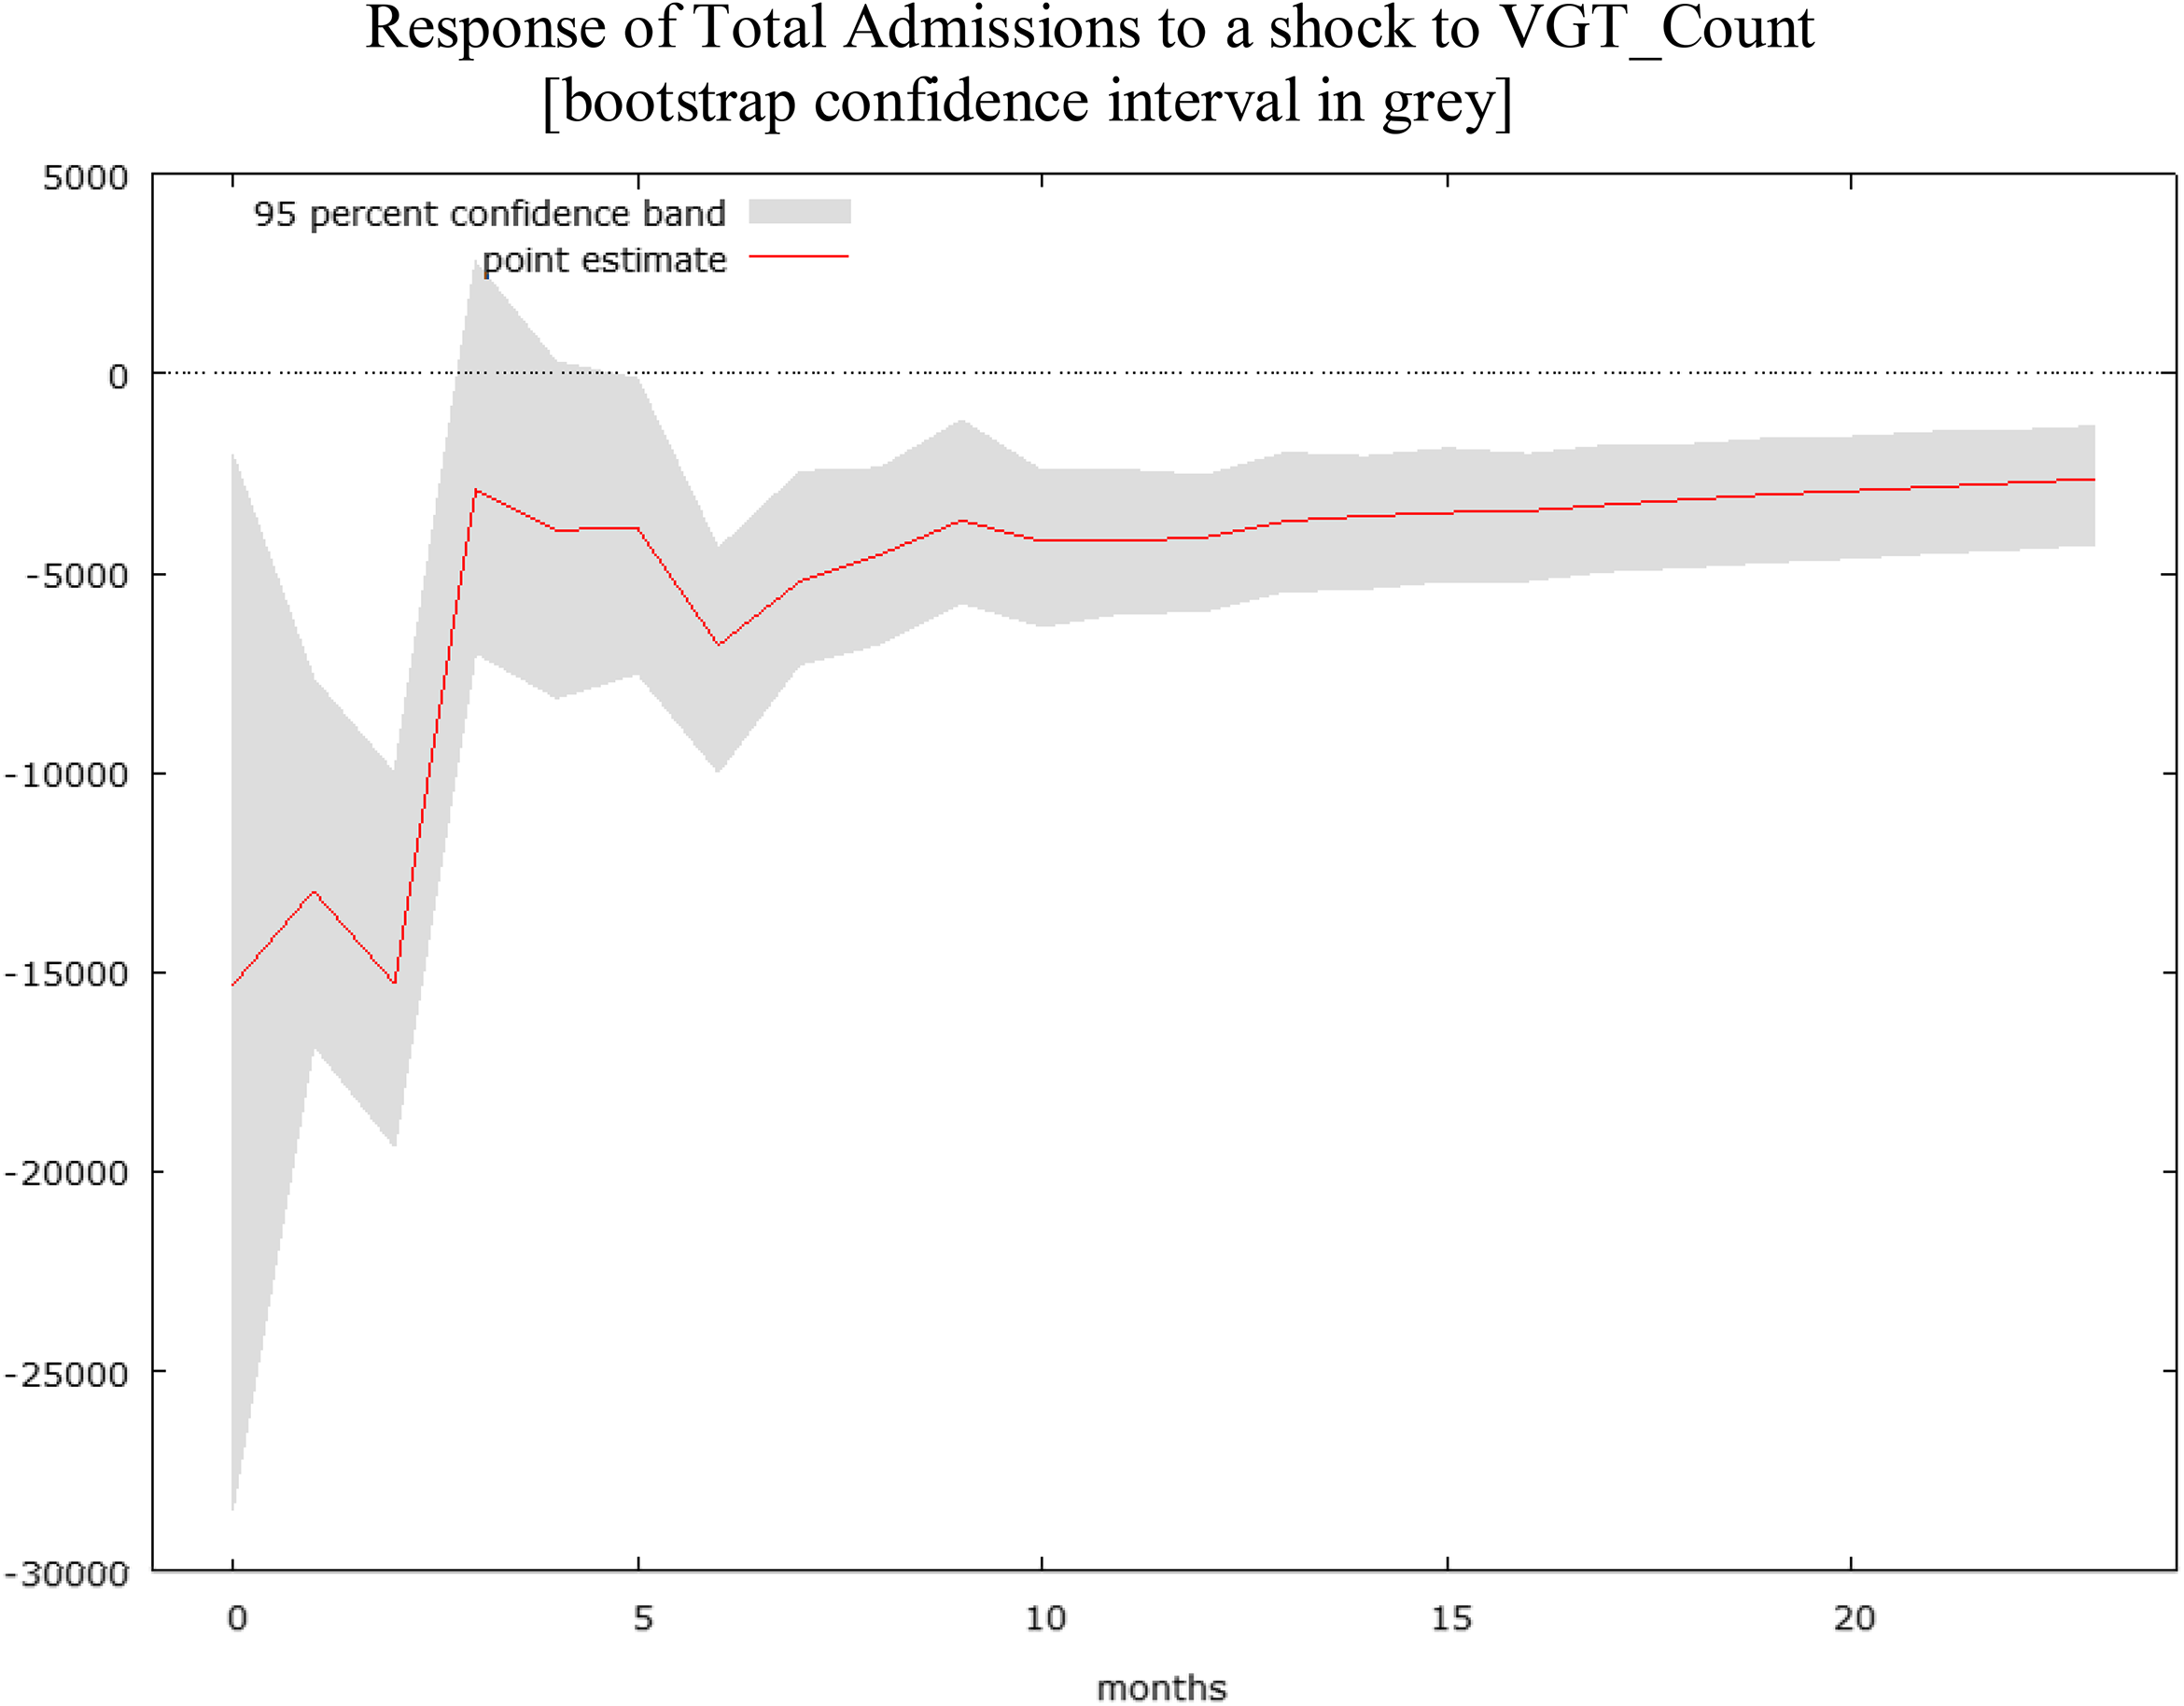
Impulse response function of admissions for one standard deviation increase in video gaming terminals (VGTs). If VGT machines increased one standard deviation (about 6,700 machines), admissions would initially decrease by approximately 15,000 people. Response of total admissions to a shock to VGT_Count (bootstrap confidence interval in gray).

Impulse response function of video gaming terminals (VGTs) for one standard deviation increase in admissions. If admissions increased by one standard deviation (about 180k people), VGT machines would be minimally affected by approximately sixty fewer machines. Response of VGT_Count to a shock to Total Admissions (bootstrap confidence interval in gray).
Geographic Variation in Casino/VGT Activity
The above analysis examined the impact of VGTs on statewide casino performance and found a negative correlation between casino revenue and admissions and VGT activity (VGT revenue and number of VGT machines). To investigate the potential for cannibalization effects further, we create a panel data set consisting of casino revenue and admissions for each of Illinois’ ten casinos. 10 For each casino, we calculate monthly VGT revenue, VGT count, and VGT establishments within the city limits where the casino is located (0 km) as well as cities located within a radius of twenty-five, fifty, and one hundred kilometers. 11
A priori, we expect to see greater negative correlation between casino and VGT activity in areas with more VGT activity. To test this hypothesis, the following equation is estimated with OLS:

In equation (4) Casino Measurei,t is either the natural log of casino revenue or the number of admissions for casino i in month t. VGT Measurei,t is either the natural log or level of VGT revenue, VGT count, or VGT establishments. Casinoi is a dummy variable for each casino and allows for individual casino fixed effects. CasinoTrendi,t is a casino-specific trend to account for the fact that while casino revenue and admissions have been declining in Illinois over our sample period, the rate of decline is not identical for each casino.
The results for estimating equation (4) for the log of casino revenue and the log of each VGT measure are reported in table 5. Each VGT measure is regressed separately. Thus, table 5 reports coefficients from twelve separate regressions, a separate regression for each of the three density measures across the four distance radii. For each VGT measure across all distances, greater VGT activity is associated with reduced casino revenue. In general, the correlation is statistically significant. For the city limits regressions (0 km), East St. Louis and Des Plaines are excluded since those two cities do not allow VGTs. VGTs exist in surrounding cities, however, so the remaining regressions include data for all ten casinos. The results reaffirm our statewide analysis, and the results are qualitatively similar, with VGT activity associated with a small, but significant negative effect on casino revenue. For example, a 1 percent increase in the number of VGTs and VGT establishments is associated with an approximately 0.045 percent decrease in casino revenue.
OLS Regression Results for Casino Revenue and VGT Density.a
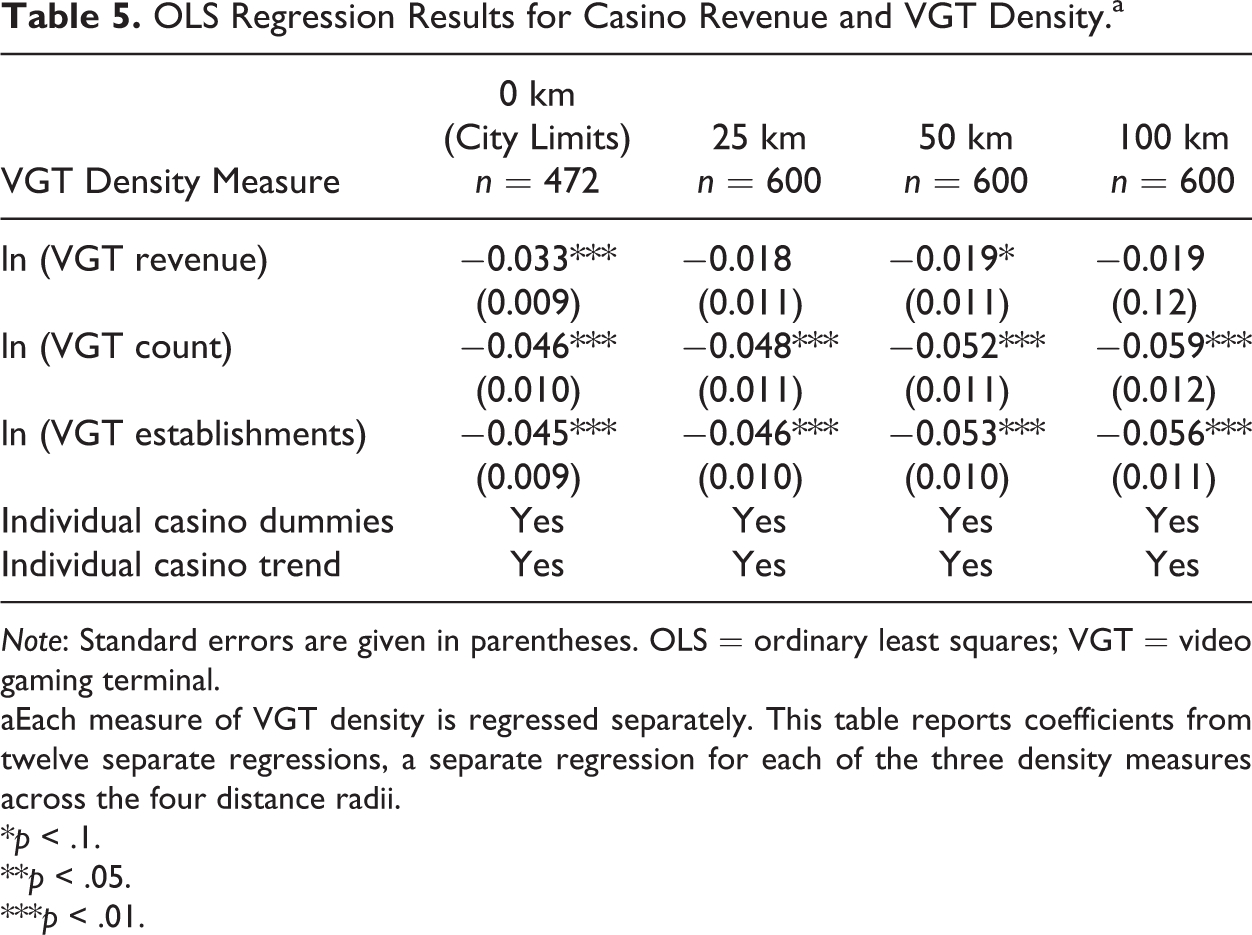
Note: Standard errors are given in parentheses. OLS = ordinary least squares; VGT = video gaming terminal.
aEach measure of VGT density is regressed separately. This table reports coefficients from twelve separate regressions, a separate regression for each of the three density measures across the four distance radii.
*p < .1.
**p < .05.
***p < .01.
Results for estimating equation (4) for the number of casino admissions are included in table 6. Here, the VGT measures are measured in levels, not logs. 12 The results support our statewide analysis and, with the exception of VGT revenue within twenty-five and fifty kilometers, confirm greater negative correlation between casino admissions and increased VGT activity. An additional VGT machine within the city limits of a casino is associated with 87 fewer admissions per month, whereas each establishment is associated with approximately 295 fewer admissions. Each additional machine and establishment within a twenty-five kilometer radius is associated with approximately nineteen and sixty-eight fewer monthly admissions, respectively, suggesting the closer the increased VGT activity is to the casino host city, the greater is the reduction in monthly admissions.
OLS Regression Results for Admissions and VGT Density.a
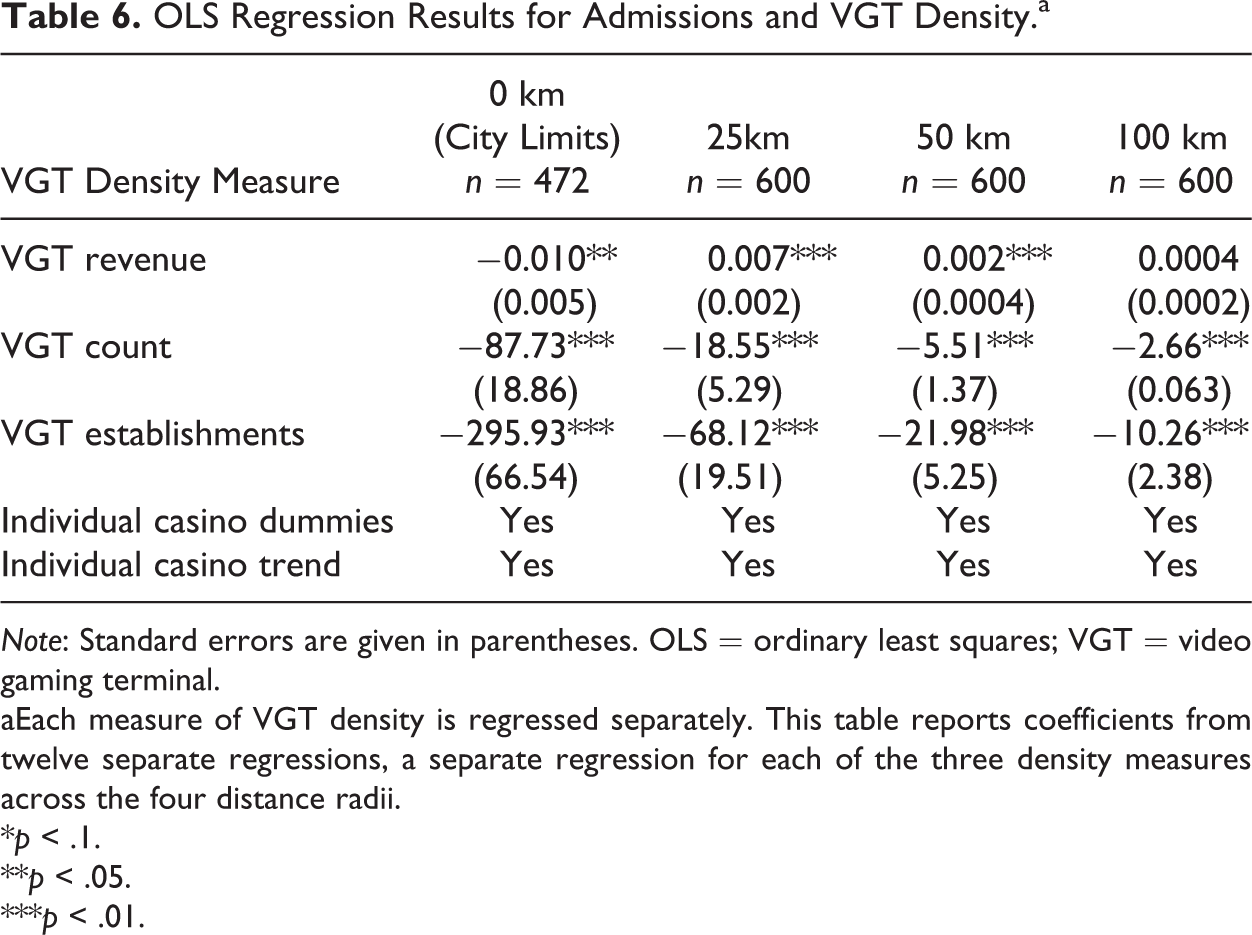
Note: Standard errors are given in parentheses. OLS = ordinary least squares; VGT = video gaming terminal.
aEach measure of VGT density is regressed separately. This table reports coefficients from twelve separate regressions, a separate regression for each of the three density measures across the four distance radii.
*p < .1.
**p < .05.
***p < .01.
Fiscal Implications
As shown in figure 1, Illinois has been experiencing a declining casino gambling market for many years, which was one factor leading to the passage of legislation for VGTs in hopes of increasing tax revenue. Missouri, Indiana, and Mississippi could be looking to pass similar legislation, and other casino markets may follow as casino gambling matures and revenues decline or grow slowly. VGTs may not be the only form of different gambling product adopted by states for tax generation purposes. The US Supreme Court’s recent decision lifting the ban on sports wagering (Murphy v National Collegiate Athletic Association) has already resulted in several states, many with existing casinos, authorizing sports betting. 13 While this article did not examine tax revenues, it did examine casino revenue and admissions, which are the tax base. The results suggest that VGTs are reducing demand for casinos, decreasing casino admissions and consequently revenue, but not on a one-for-one basis, reinforcing the findings of Gallagher (2014) and the studies reviewed by Marionneau and Nikkinen (2017).
Declining admissions and revenue will certainly lower overall casino tax revenues collected, given that no changes in the rate of taxation occurred. 14 To explore and quantify the effects on tax revenues due to the impact of VGTs, our estimated results are helpful. Table 7 summarizes the predicted gain in VGT tax revenue and loss in casino tax revenue due to a 1 percent increase in VGT revenue. These estimates are based on 2017 values. A 1 percent increase in monthly VGT revenue in 2017 resulted in an additional $325,691 of monthly VGT tax revenue collected by the state. In contrast, based on our regression results, this 1 percent increase is predicted to reduce monthly casino revenue by 0.05 percent, resulting in a reduction of $29,333 in monthly casino tax revenue. On net, the state realizes a monthly tax revenue gain of approximately $296,000. 15
Predicted Tax Revenue Implications of Expanded VGTs.

Source: Video Gaming Revenue Reports and Illinois Gaming Board Annual Reports (http://www.igb.illinois.gov/VideoReports.aspx; http://www.igb.illinois.gov/AnnualReport.aspx).
Note: VGT = video gaming terminal.
aTotal net terminal income in 2017 was $1,302,765,498, yielding average monthly income of $108,563,791 ($1,302,765,498/12). One percent of that figure is $1,085,637. Taxed at 30 percent yields $325,691.
bTotal gross casino revenue for 2017 was $1,407,993,353, amounting to a monthly average of $117,332,779. The total reduction in casino revenue from our estimates, 0.05 percent, yields a decrease of $58,666 (117,332,779 × 0.0005). Taxed at the maximum 50 percent rates yields $29,333.
cEach VGT machine took in about $3,840 per month in 2017. For the 3,431 machines added in 2017, this equates to an increase in terminal income of $13,175,040 and, at 30 percent, a $3.952 million increase in monthly VGT tax revenue.
dEach additional machine is estimated to reduce admissions by 11.56 people. An additional 3,431 VGT machines would reduce casino admissions by 39,662. At $3 per admission, the loss is $118,987.
Casino revenues are not the only tax base. There are also admissions taxes collected from casinos. Table 7 also summarizes the loss in admissions tax revenue and gain in VGT tax revenue from the additional machines added in 2017. State and local admissions taxes are $3 for each admission. Based on our regression results, each additional VGT machines is predicted to reduce monthly admissions by 11.57 persons. In 2017, 3,431 VGT machines were added. This is predicted to reduce monthly admissions by approximately 39,600 people (3,431 × 11.57) and an additional loss of approximately $119,000 in monthly tax revenue. 16 Offsetting this, the monthly VGT tax revenue from these additional machines would total approximately $3.9 million. Thus, while there is cannibalization on admission taxes due to an increased number of VGTs, there is still a clear positive effect on total tax revenue.
While the state as a whole has clearly gained tax revenue from the expansion of VGTs, what about local communities where casinos are located? Local casino communities receive $1 for each admission and 5 percent of casino revenue. These tax bases are clearly declining. Countering this decline, all communities which have VGTs receive one-sixth of the tax revenue collected from VGTs in their community. So, how much did casino tax revenue decrease in 2017 compared to the increase in VGT tax revenue for communities where casinos are located and the state as a whole?
Seven casino communities allow VGTs (East St. Louis and Des Plaines prohibit VGTs). Table 8 shows the year-over-year change in casino and VGT tax revenue for 2014 to 2017 for these seven communities and the state as a whole. For casino communities, the losses in casino tax revenue exceed the gains in VGT tax revenue in each year. The loss in casino revenue is particularly pronounced in 2014 when the expansion of VGTs statewide was accelerating. 17 While the annual decrease in casino tax revenue has generally lessened and was the least in 2017, the gains in VGT tax revenue have also slowed. Finally, not only are the annual losses of casino tax revenue exceeding the gains from VGTs, but total VGT tax revenue between 2013 and 2017 ($7,009,873) is less than the losses of casino tax revenue ($8,765,438) for these communities.
Year-over-year Change in Casino Tax Revenue and VGT Tax Revenue.
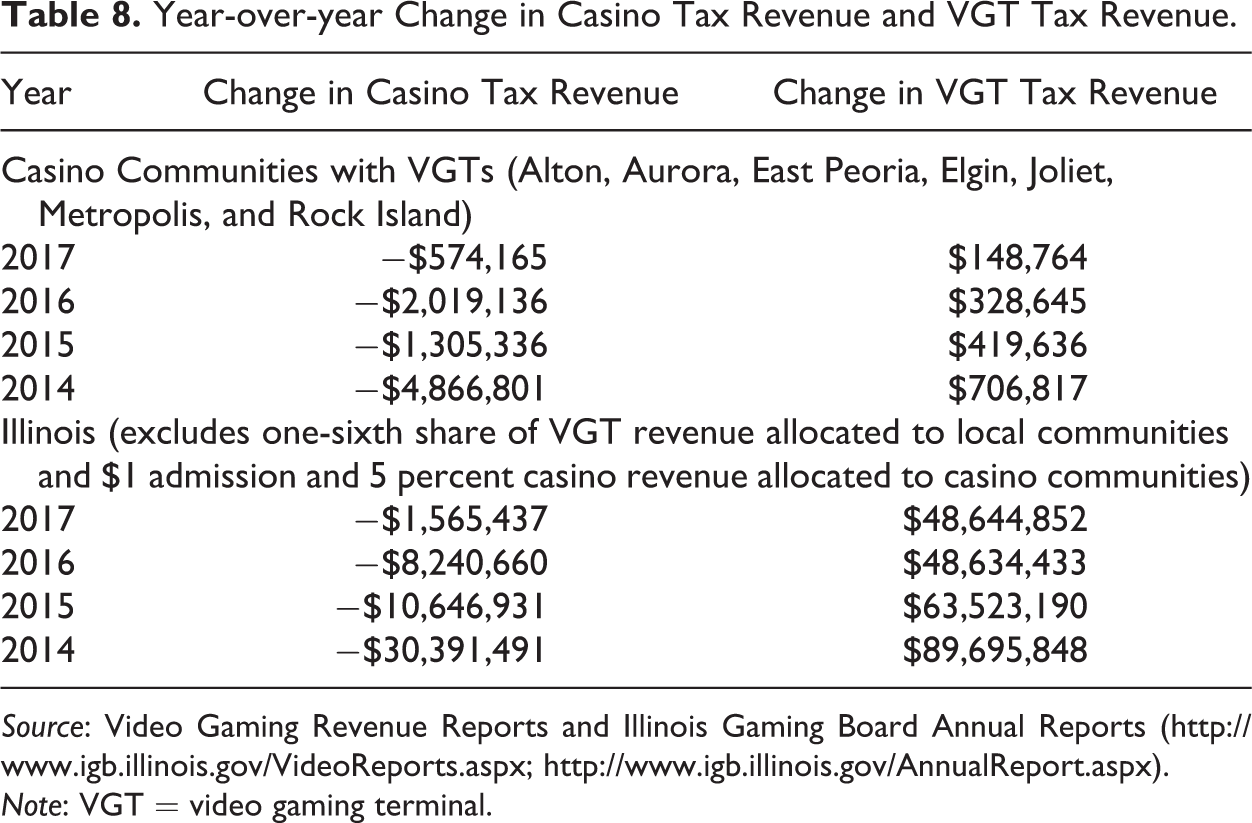
Source: Video Gaming Revenue Reports and Illinois Gaming Board Annual Reports (http://www.igb.illinois.gov/VideoReports.aspx; http://www.igb.illinois.gov/AnnualReport.aspx).
Note: VGT = video gaming terminal.
Illinois as a whole, however, has benefited every year as shown in table 8. In 2017, casino tax revenue allocated to the state, excluding the share going to casino communities, decreased by $1,565,437 consisting of $342,577 in wagering tax revenue and $1,222,860 in admission tax revenue, figures that confirm the greater impact of VGTs on casino admissions. Offsetting this was a $48,644,852 increase in VGT tax revenue allocated to the state, excluding the one-sixth share sent to local communities. This is not unique to 2017, as increases in VGT tax revenue statewide have far exceeded losses in casino tax revenue every year. In 2014, when Illinois lost over $30 million in casino tax revenue, VGT tax revenue was nearly $90 million. While the state of Illinois as a whole has experienced increased tax revenue from the expansion of VGTs, as have other local, noncasino communities that previously did not have VGTs, the communities where casinos are located are losing more in casino-based taxes than they are gaining in VGT taxes. For Des Plaines and East St. Louis, there are no offsetting VGT tax revenues. While Des Plaines experienced a modest (0.31 percent) increase in casino tax revenue in 2017 of $76,112, East St. Louis experienced a 7.14 percent decrease, the greatest of any casino community, amounting to $475,091.
Conclusions and Limitations
The results from this analysis support previous studies, particularly Gallagher (2014) and those reviewed in Marionneau and Nikkinen (2017), in that the expansion of gambling outside of casinos is negatively correlated with casino revenue and admissions but that the correlation is not dollar for dollar. Indeed, we find a modest elasticity of −0.05 for VGT revenue on casino revenue. This is driven primarily by reduced visitation to the casino as is evidenced by the relative stability of revenue per admission.
While the overall fiscal impact for Illinois has been positive, the distribution of the losses in casino tax revenue varies. Communities where casinos are located receive tax revenue from both casino admissions and casino revenue and have been more negatively impacted by the reduction in these tax revenue sources. While the state as a whole has gained, the additional VGT tax revenue generated by and shared with the casino host communities has been insufficient to offset the decline in casino tax revenue.
The state of Illinois shares tax revenue with communities where casinos are located in part to mitigate the costs associated with casinos (e.g., traffic, increased public safety expenditures). Have the costs to the community of hosting a casino decreased proportionately with the decline in visitors and tax revenue? This article cannot answer this question, and indeed, it would be a difficult question to answer, but if not, then a revised tax-sharing arrangement between the state and casino host community may be in order. Of course, these burdens are not likely to stop at the city limit, and some of the surrounding communities not benefiting from casino taxes may have authorized VGTs in order to increase their means of handling costs associated with the casino. We cannot know or estimate this. VGTs may bring their own problems as well, such as increased problem gambling, DUIs, and so on. This article acknowledges this but cannot estimate whether the local share of taxes is sufficient to offset these costs or indeed what these costs would be. What can be said is that for Illinois, VGTs have been associated with reduced casino revenue and visitation and that the fiscal burden has been disproportionately felt by the communities where casinos are located. These communities and the state must decide whether this is a problem to be concerned with, but as other states consider other forms of noncasino gambling, such as VGTs or sports wagering, it is important to recognize not only the overall fiscal impact of the new form of gambling but also the distribution of that impact across communities.
Our study, like all studies, does have limitations. The first limitation of our study is common to all studies that use observational data and has to do with simultaneity bias. Even the most careful of observational studies controls for simultaneous comovement in observed and unobserved variables with some degree of difficulty, and therefore, the estimated coefficients are liable to bias. This study is no different. Having said so, the degree to which this study is affected by potential severe simultaneity bias is likely not very high in comparison with the typical observational study, as we do have data for the most obvious confounders which enable us to have a reasonable set of control variables. Additionally, there is no reason to suspect egregious measurement error problems either.
A second limitation is that, while statistically significant, our estimated substitutability effect between casinos and VGT revenues is quite small, and, as astutely pointed out by an anonymous reviewer, this is not necessarily reflective of the true substitution effect, but quite possibly the by-product of a vast network of underground VGT activity taking place in Illinois, one for which we obviously have no data. These machines have existed in Illinois bars for decades before the passage of the VGT law and were labeled “for entertainment only” but made cash payments to VGT users nonetheless. Therefore, the small estimate of the substitutability effect should not be interpreted as implying that the law had little effect on casino revenue, but rather that the present study’s estimates likely err on the very low end the range of plausible estimates, given that a large fraction of the effect on casino revenue was presumably operative before the passage of the VGT law.
That said, another reason for such a small “cannibalization effect” estimate of VGTs on casino revenue may be due to the imperfect substitutability between VGTs and casinos in terms of their overall entertainment value. As pointed out by another anonymous reviewer, individuals may patronize casinos not only for the opportunity to gamble but also for the chance to take advantage of concerts, restaurants, and so on, none of which are offered by VGTs. Therefore, casinos and VGTs may, to a large degree, attract two different constituencies, thus helping to explain, at least in part, the small estimate we obtained for the cannibalization of casino revenue by VGTs. There is very little research on the characteristics of gamblers who gamble in casinos versus outside of casinos in part because there are few states where slot machines are widespread outside of casinos other than Nevada and Illinois. The Las Vegas Convention and Visitors Authority (2016), however, has conducted studies on Las Vegas residents to better understand their gambling behavior and preferences. Individuals who are 30 to 39 years of age and employed (versus retired) were significantly more likely to gamble in bars/restaurants, suggesting that “locals” who gamble in casinos are more likely to be older and retired compared to those gambling outside of casinos.
Footnotes
Declaration of Conflicting Interests
The author(s) declared no potential conflicts of interest with respect to the research, authorship, and/or publication of this article.
Funding
The author(s) received no financial support for the research, authorship, and/or publication of this article.