
Abstract
The ubiquity of surveys in organizational research means that their quality is of paramount importance. Commonly this has been addressed through the use of sophisticated statistical approaches with scant attention paid to item comprehension. Linguistic theory suggests that while everyone may understand an item, they may comprehend it in different ways. We explore this in two studies in which we administered three published scales and asked respondents to indicate what they believed the items meant, and a third study that replicated the results with an additional scale. These demonstrate three forms of miscomprehension: instructional (where instructions are not followed), sentential (where the syntax of a sentence is enriched or depleted as it is interpreted), and lexical (where different meanings of words are deployed). These differences in comprehension are not appreciable using conventional statistical analyses yet can produce significantly different results and cause respondents to tap into different concepts. These results suggest that item interpretation is a significant source of error, which has been hitherto neglected in the organizational literature. We suggest remedies and directions for future research.
How satisfied are you with the pay you receive for your job? (Tsui, Egan, & O’Reilly, 1992). This seems a straightforward question that anyone who is employed should be able to understand and answer. But what does it actually mean? Is it asking whether you are happy with the pay you receive for your job, or whether you think the amount you earn is fair for the work you do? Or something else? No doubt you will understand both the question and its meaning. The crucial issue, however, is whether others understand it in exactly the same way as you.
Organizational researchers often solicit the opinion of others through surveys. This frequently involves administering a stimulus, in the form of a question or statement, 1 and allowing the participant to choose from a limited menu of responses. Closed questions of this nature allow a verbal (analog) signal to be converted to a numerical (digital) output, through the allocation of ordinal numbers to Likert scale responses, and the consequent output to be subjected to statistical examination.
The advantage of this process of transduction is also its weakness, as the simple numerical output masks infelicities in comprehension of the instruction, question, or response. Individuals “agreeing” with a statement may not necessarily be “agreeing” with the same thing as other respondents, and even sophisticated statistics may not detect these differing interpretations. The whole enterprise of survey research rests on the assumption that there is an unbroken chain of comprehension from the mind of the researcher, through the survey instrument, to the mind of the respondent, and back again. Miscomprehension at any stage in this process introduces error.
A survey that is used as the basis for strategy or policy and that is poorly constructed and ignores different interpretations of questions could have profoundly negative effects. As a consequence, a great deal of effort has been put into improving standards of measurement. This research has mainly focused on using statistics to assay scale quality, with little attention paid to the stimulus questions themselves and the way in which individuals comprehend them.
This article examines sources and types of linguistic miscomprehension in survey research, using published, multi-item scales. We begin with a brief review of scale development and some of the principles of linguistics. We then present three studies that explore miscomprehension in survey research. The first study shows that while participants understand survey questions, they understand them in different ways. Using existing linguistic theory we code the results into three forms of miscomprehension. The second study tests this taxonomy by presenting respondents with a stimulus question and asking them to select, from a list of possible interpretations, the interpretation of the question that most closely matches their own. We find that participants commonly depart from the strict syntax of the item in their interpretations. This threatens construct validity and can have implications for item score on the scale itself and can impact on other scales—in this case turnover intention. In the third study we replicate the findings of the first two studies using a different measure to establish that our findings are not particular to our scale selection. These three studies demonstrate that respondents interpret items differently, that this threatens construct validity, and yet is not apparent when standard statistical tests to assess factor structure and validity are used. We then examine the import of these findings for organizational research, suggest remedies, and outline directions for future research.
A Brief Review of Scale Development
The process of scale development has been discussed in a number of texts (e.g., DeVellis, 2003; Hinkin, 1998). These generally aim to fulfill the American Psychological Association guidelines, which center around content validity, criterion-related validity, construct validity, and internal consistency reliability (Hinkin, 1998).
The first step is to define the concept of interest and its domain. Poorly specified concepts and inadequate domain sampling will guarantee an inadequate scale. The next steps are elegantly summarized by Hinkin (1998). They begin with developing items that either inductively or deductively sample the conceptual domain (Hinkin, 1995). If the resulting items are poorly developed, then it is unlikely that the subsequent stages of the developmental processes will remedy this. Unfortunately, this critical step of item development is seldom accorded appropriate emphasis (Schriesheim, Powers, Scandura, Gardiner, & Lankau, 1993), with DeVellis (2003) suggesting that researchers “often ‘throw together’ or ‘dredge up’ items and assume they constitute a suitable scale” (p. 11). Hinkin (1998) advocates a more rigorous process, where parsimonious, readily comprehensible questions are written and construct validity is examined using multiple samples and techniques such as exploratory and confirmatory factor analysis. Despite the importance of the initial stages of item development (Hinkin, 1995), greater emphasis is often placed on the statistical assessment of the psychometric properties of the scale (Rossiter, 2002) and its relationship to other variables in the nomological net (Borsboom, Mellenbergh, & van Heerden, 2004).
Researchers may choose instead to use published measures. Passage through the peer review process has typically been perceived as evidence of scale quality. However, Ford and Scandura (2007), in an examination of a compilation of organizational measures (Fields, 2002), found that the majority of scales contained one or more threats to construct validity, suggesting that published measures are not without flaws. Using a published measure also involves disembedding it from its original context, potentially increasing the risk of error. Comprehension (u) is a function of syntax (s) and context (c); u = f (s + c), and so the same syntax may be comprehended differently in different contexts. For example, saying “break a leg” means something different in a theater dressing room and an operating theater. The importance of linguistics in item interpretation has not been widely discussed although there are some existing sources that do address the issue (Schwarz, 1999), and it is to this topic we now turn.
A Brief Review of Linguistic Theory Surrounding Item Interpretation
Surveys hinge on comprehension. If the respondent does not understand the survey question in exactly the same way as the researcher then the instrument is not measuring what the researcher intended. This interface between researcher and respondent is of critical importance and where linguistic problems of interpretation manifest themselves. Communication depends on one person’s statements being understood by another. This, however, is not enough, as understanding what another person is saying is one thing, while understanding exactly what they mean is another.
Researchers in the pragmatic tradition of semantics make a clear distinction between what is said and the context (both social and linguistic) in which it is said, the one influencing the other. The interplay between the contextual and literal was articulated by Grice (1975) and subsequently modified and extended by other authors (e.g., Jaszczolt, 2005; Sperber & Wilson, 1986). The principle underpinning this field is that when we interpret a sentence, we flesh out the bare syntax of a sentence, drawing on our experience, context, and environment. This process, however, is neither uniform nor predictable, varying across individuals and situations. These variations mean that survey questions may be “fleshed out” by individuals to give meanings other than the one intended by the question’s author. Consequently, this article is concerned with cataloging these differences and examining their impact on survey research.
Types of Error
Threats to comprehension, and hence validity, fall into two basic categories: instructional and interpretive. Interpretive errors can then be broken down into two further categories commonly used within the psycholinguistic literature (e.g., Hernandez, 2001). One concerns the comprehension of the full sentence, or sentential comprehension, and the other the comprehension of individual words, or lexical comprehension.
Instructional Miscomprehension
This is the most easily understood source of error, where the respondent either does not read/follow the instructions for completing the survey or they misunderstand the instructions (Tourangeau, Rips, & Rasinski, 2000). This failure to follow or understand instructions may not be evident in surveys with a numerical output, yet instructions are of pivotal importance. For some surveys they provide direction as to what is actually being measured. In others, the instructions might contain the experimental manipulation through a change in wording. In either case, the results of the research are affected if the instructions are ignored. In short, instructions are important.
Interpretive Miscomprehension: Sentential
When hearing a question we attempt to understand what it means. This involves making decisions, both conscious and unconscious, about what the questioner is actually trying to ask. For example, the question “Have you had lunch?” at a 2 pm meeting is likely to be interpreted as “Have you had lunch today?” rather than “Have you ever had lunch?” Understanding a question, therefore, is not a banausic process of literally answering what has been asked, but rather one of applying contextual information in order to answer appropriately. Crucially, we must reach the same interpretation as the author of the question, otherwise we are likely to answer a different question from the one the author intended. This is sentential miscomprehension.
Respondents might enrich or deplete the meaning of questions, or both. When an item is enriched, the respondent adds additional information to the stimulus. For example, if the question “Considering everything how satisfied are you with your current job situation?” (Tsui et al., 1992) is interpreted by the respondent as “Would you stay in your job if someone offered you something else?,” 2 they have enriched the sentence to include elements of turnover intention that were not intended. This may mean that the respondent is actually answering a question about turnover intention as opposed to just job satisfaction.
Just as sentences can be enriched they can also be depleted. The question “How fair or unfair are the procedures used to determine pay rates?” (Sweeney & McFarlin, 1993) shows depletion if interpreted as “How fair is your pay?” The respondent has clearly understood the fairness element of the question but not the procedural part and has, effectively, turned a procedural justice item into a distributive justice one.
Interpretive Miscomprehension: Lexical
This form of miscomprehension concerns the meaning of the words themselves. One person’s definition of a word does not necessarily accurately map onto that of another’s because they are drawing on a variety of educational, cultural, social, contextual, or gender-specific definitions.
The word satisfaction has two historical meanings (Simpson & Weiner, 1989). One is “with reference to desires or feelings” (Simpson & Weiner, 1989, p. 502) and is described as “The action of gratifying (an appetite or desire) to the full a sense of pleasurable gratification” (p. 502); the other, “with reference to obligations” (p. 502), is a more transactional sensation of obligation having been fulfilled. Depending on exposure and knowledge, individuals interpreting the word satisfaction may draw on one or the other interpretation, or a blend of both. The issue for survey researchers is that it is very difficult to know which definition the respondent is drawing on. For example, two different respondents may both “agree” with the statement “Are you satisfied with this company” but one might be agreeing that they like the company while the other feels that the company has met its obligations.
The possibility of lexical miscomprehension resulting from this polysemy, or multiple meanings, is not restricted to the word satisfied. The Collins English Dictionary lists 43,636 different nouns and 14,190 different verbs. The average noun has 1.74 meanings and the average verb 2.11 (Fellbaum, 1990), suggesting that there is plenty of opportunity for respondents to draw on more than one meaning.
Lexical miscomprehension can introduce primary error, where the item’s miscomprehension affects its score, and also secondary error, where miscomprehension causes collinearity between scales. This could occur if, for example, a question about satisfaction were included in a model along with an instrument for turnover intention. The responses of those using a transactional interpretation of satisfaction should correlate with turnover intention but the responses of those taking a gratificational view may not.
These three forms of miscomprehension, instructional, sentential, and lexical, have the potential to introduce considerable error into the measurement process. We shall now turn to two studies that provide evidence for the existence of these forms of miscomprehension and a third, which confirms our preliminary findings using a different scale.
Study 1: Respondent Interpretation of Survey Question
This study aims to ascertain whether the forms of miscomprehension outlined previously occur with questions used in organizational research.
Method
The scales used in this study were selected on the basis of three criteria. First, Ford and Scandura (2007) did not identify any threats to construct validity in these scales in their analyses of all the scales contained in Fields’s (2002) book of organizational measures. Second, they contained a mix of both questions and statements so that comparisons could be made between a satisfaction scale using questions (Tsui et al., 1992) and one containing statements (Agho, Price, & Mueller, 1992; drawn from a longer measure in Brayfield & Rothe, 1951). Finally they were brief. This last point was of particular importance in order to minimize the potential for survey fatigue. Two multiple item scales for job satisfaction (Agho et al., 1992, 6 items; Tsui et al., 1992, 6 items) and one for procedural justice (McFarlin & Sweeney, 1992, 4 items) were used. The job satisfaction measures were also different in that one (Tsui et al., 1992) is a general measure of job satisfaction that measures specific facets such as satisfaction with the work itself, supervision, and coworkers, while the other (Agho et al., 1992) was intended as an affective measure of job satisfaction. The papers in which these scales appeared have been widely cited in organizational research and the scales themselves used frequently in subsequent research.
The survey was administered using Qualtrics (2007). The respondents were first asked to explain what they thought the survey question meant, in a free-text, open-ended response format, imagining that they were explaining the item to a non-native English speaker and attempting to convey the true meaning of the item. We then administered the same three scales in their usual format with Likert-type responses. Finally, we captured standard demographic data such as gender, educational level, and native language.
Sample
For this initial exploratory study, we used three convenience samples of participants. First, the authors sent an invitation to participate to their personal contacts, with a request that participants forward the survey to others. We used this method as variance in pragmatic inference is universal (Sperber & Wilson, 1986), and so a nonrandom sampling method was appropriate. We also wanted respondents who had the intellectual capacity to think through the meaning of items carefully. Therefore, sampling our own contacts made sense, as our contacts are typically well educated.
Our final sample comprised a total of 115 respondents. Forty-one of these were native speakers of British English (BrE) (average age = 34.3, SD = 11.9; 42% female, 58% had a master’s degree of higher), 40 were native speakers of American English (AmE) (average age = 37.1, SD = 11.6; 52% female, 60% had a master’s degree of higher). We selected speakers of British English and American English as we were concerned that there might be differences in interpretation between these two forms that are strongly represented in organizational research and represent the two forms of English that are taught internationally. We also asked members of the RMNet listserv (a listserv restricted to members of the Research Methods Division of the Academy of Management) to complete the survey (n = 34, average age = 44.5, SD = 12.2; 48% female, 91% had a master’s degree or higher) as those with an interest in research methodology may assist colleagues in developing surveys. The BrE and AmE samples were broadly similar in terms of age, gender profile, and educational attainment, while the RMNet sample was slightly older and more highly educated, as would be expected.
Classification of Open-Ended Responses
Responses were classified manually using NVivo 8 (2008) by two coders and interrater reliability statistics (Cohen’s kappa, κ; Cohen, 1960, as implemented in SPSS) were calculated.
Instructional miscomprehension was identified and coded when a respondent failed to follow the instructions. The instructions were in a bordered box at the top of the first page and clearly stated in bold, italicized, block capitals: “
In order to identify sentential miscomprehension we examined the responses for deviation from the syntax of the question, in the form of enrichment or depletion. Enrichment was defined as the respondent venturing beyond a strict syntactic interpretation of the question by including other conceptual elements. Depletion, on the other hand, was defined as the absence of an element of the question in the answer provided. Depending, of course, on the nature of the item, it is possible to simultaneously enrich and deplete an item. For instance, a respondent who interprets the question “How fair or unfair are the procedures used to determine pay rates?” (Sweeney & McFarlin, 1993) as “How transparent is compensation?” simultaneously depletes the question by not asking about the (un)fairness of pay rates (i.e., removing a conceptual element) and also enriches it by expanding from pay to compensation.
Lexical miscomprehension is difficult to apprehend, as it is impossible to know what mental schema the respondent is drawing on, so interpretation of the response can only be made by inference from the rest of the sentence. The definition of satisfaction in the question “How satisfied are you with the nature of the work you perform” (Tsui et al., 1992) was coded as “pleasurable” if words indicating pleasure (e.g., happy) were included in the interpretation and transactional if the interpretation included phrases indicating that it matched or met their expectations. Questions where no classification could be made were coded as “neutral.”
Other words that proved tractable to classification for lexical miscomprehension included questions where a vague term such as often or most was used, and there were responses that quantified what these words meant, for example often being interpreted as “3/5 days.” Lexical ambiguity could also be seen in interpretations of such items as “I like my job better than the average worker” (Agho et al., 1992), which begged the question of how you define the “average worker.” The differing referents for the “average worker” were readily classifiable in the responses.
Finally, analyses were conducted using SPSS to establish the reliability and dimensionality of the measures used in the survey.
Results
Statistical Tests for Dimensionality
Coefficient alpha (Cronbach, 1951) for the measures ranged between .79 and .91, which was consistent with or better than alphas previously reported for these measures (Fields, 2002). In addition, we used exploratory factor analysis to establish unidimensionality of each measure (Conway & Huffcutt, 2003). We used maximum likelihood extraction and direct oblimin rotation. All items had factor loadings exceeding .40, with almost all exceeding .50, indicating undimensionality of each measure.
Results of Coding Open-Ended Responses
Instructional Miscomprehension
This was readily detected when respondents answered the question rather than describing what the question meant. Eight respondents consistently answered the questions instead of describing them (BrE 3/41; AmE 2/40; RMNet 3/34). RMNet members in particular demonstrated another form of instructional miscomprehension. Nine of 34 wrote responses such as “job satisfaction/facet is pay,” “procedural justice,” or “Need a Likert scale response,” which are clearly incompatible with the instructions. Overall, 17 of 115 respondents (15%) provided answers suggesting that they had not read the instructions properly.
Sentential Miscomprehension
Examination of the sample revealed evidence of both enrichment and depletion, with little difference in degree of miscomprehension between the three groups of respondents. Accordingly they were combined. The coding was completed by two raters, with excellent interrater reliability (κ = 0.85-0.90). Depletion was particularly evident with the items from the procedural justice scale (Sweeney & McFarlin, 1993) where respondents ignored the procedural element of the question, such that “How fair or unfair are the procedures used to determine pay rates?” was interpreted as “How fair is your pay?” Effectively this turned a procedural justice item into a distributive justice one. Overall 27% of respondents ignored the procedural element of the question (BrE 30%, AmE 32%, RMNet 16%).
Five respondents said that they did not understand the item “How fair or unfair are the procedures used to communicate performance feedback.” In spite of this they were still able to provide a numerical response in the multiple-choice section, despite the option not to do so. Therefore their lack of understanding is undetectable in the statistical data. Up to 44% of respondents depleted any given item, as can be seen in Table 1.
Number of Respondents Coded as Depleting or Enriching Items.
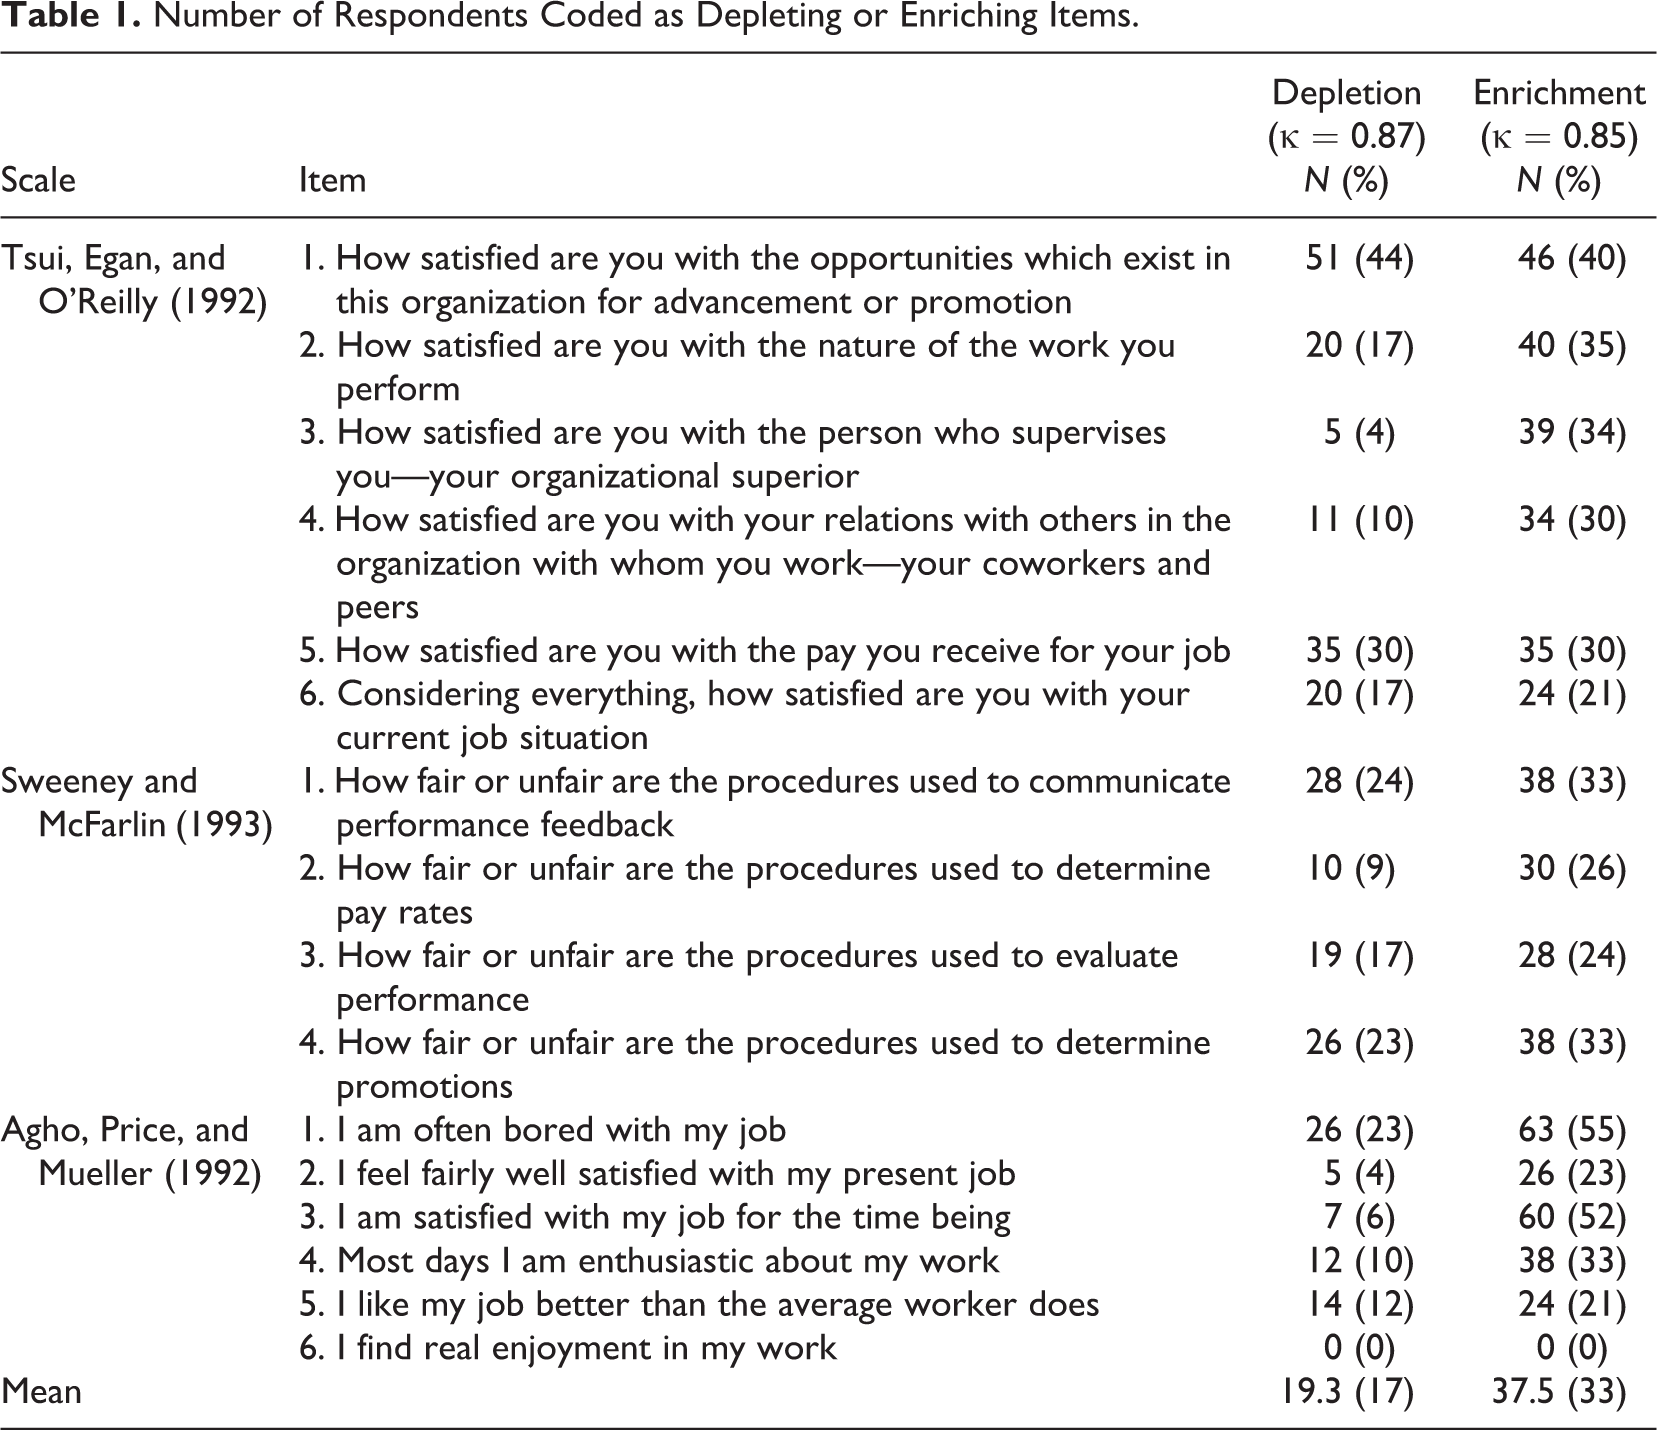
Enrichment was far more common, which is understandable as linguistic theory suggests that individuals are more likely to augment basic sentence syntax to recover meaning. Table 1 demonstrates that items were enriched by 21% to 55% of the respondents. There was no clear pattern to the enrichment, with the exception of the statement “I am satisfied with my job for the time being” (Agho et al., 1992), which seemed to trigger an association with turnover intention. This enrichment was not uniform, however, as one respondent interpreted it as “I am currently happy with my job, but I may look for a new job in the future” and another as “I’ll be out of here at the first opportunity.” Despite these very different interpretations, both these respondents “agreed” with this item in their Likert response. It is clear then that the numerical output from multiple item scales can mask considerable linguistic variance, as two opposing interpretations had the same score (4/5).
No statistical difference was detectable between the depleted or enriched responses and the rest of the sample on the basis of a Mann-Whitney U test (a nonparametric comparison test appropriate for non-normal small samples) applied to the Likert responses for each category. So individuals are answering different questions, sometimes radically so, and yet this is undetectable statistically.
Lexical Miscomprehension
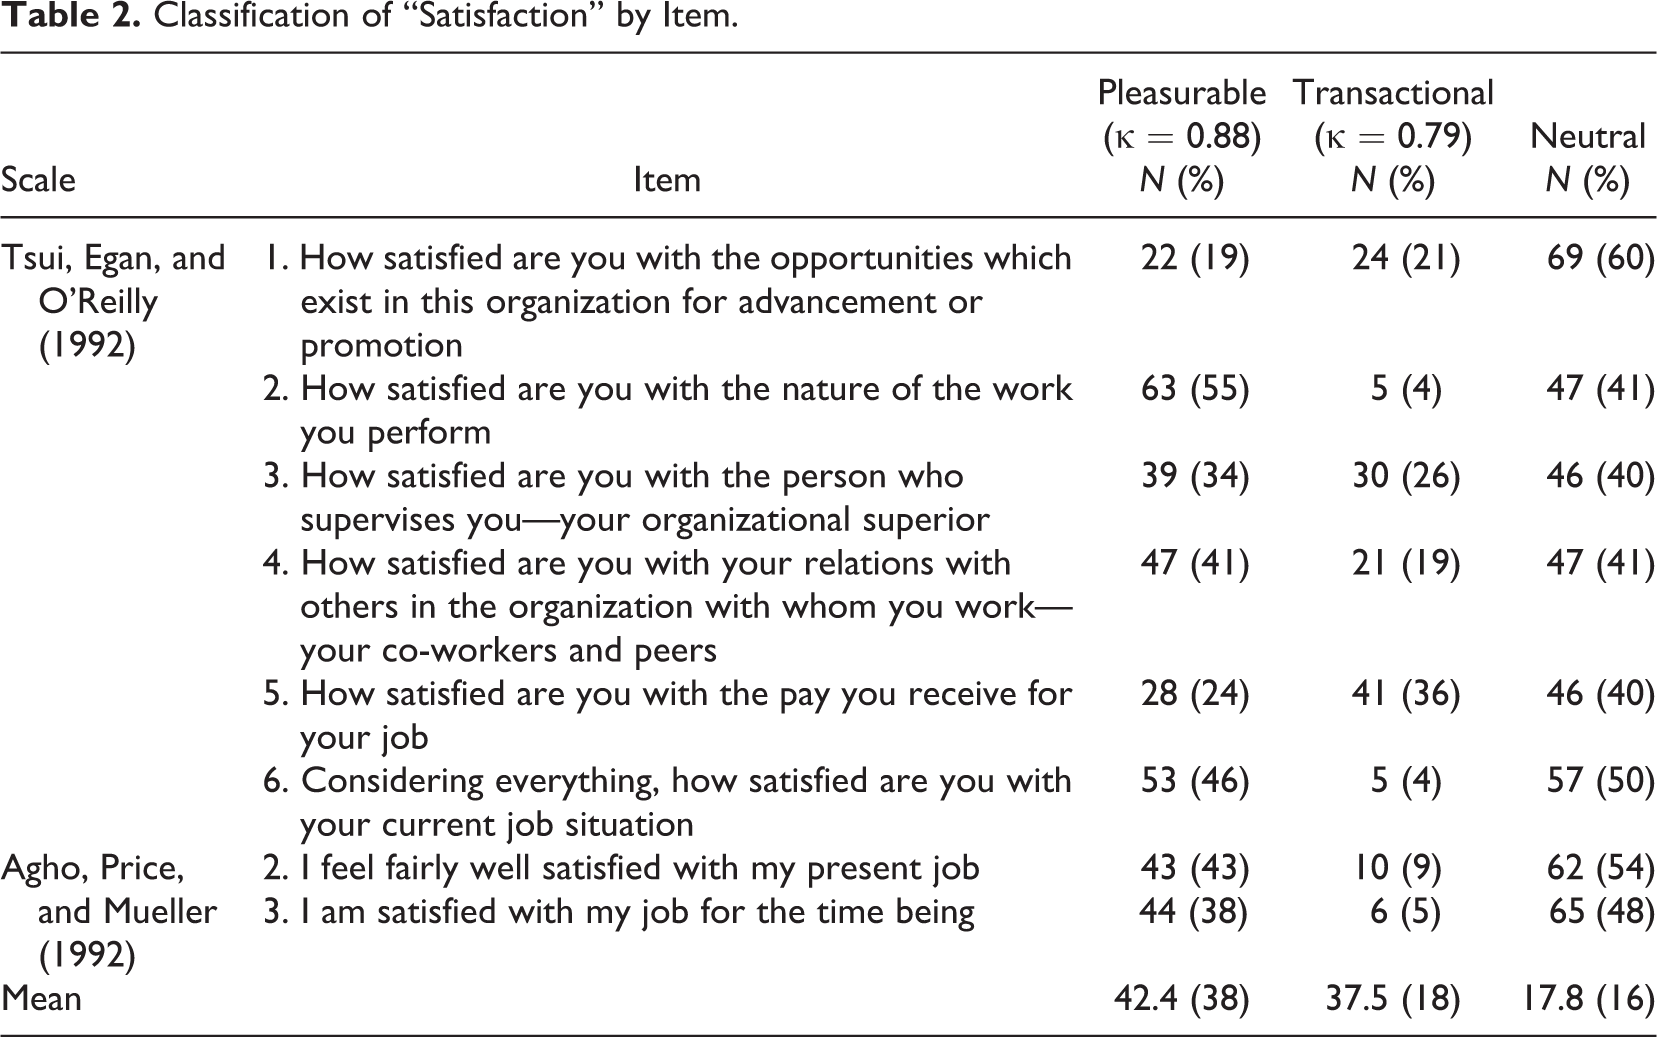
Despite the intractability of detecting lexical miscomprehension, as previously noted, there was clear evidence of differing interpretations of the word satisfaction, as can be seen in Table 2.
Classification of “Satisfaction” by Item.
Other examples of lexical miscomprehension can be seen with the use of vague terms (Tourangeau et al., 2000) such as the word often in the item “I am often bored with my job” (Agho et al., 1992). For example, often was interpreted as varying from “More than 33% of the time” to “99% of my work.” The word most in the statement “Most days I am enthusiastic about my work” was interpreted with responses as varied as “4/5 days,” “at least 3 days/week,” and “more often than not.”
The final element of lexical miscomprehension examined was the comparators for the item “I like my job better than the average worker does.” Thirty-four percent compared themselves to the general population, 18% to their peers, and 4% to people in similar jobs. Social comparison theory suggests that the choice of referent is critical to attitude formation (Riordan & Shore, 1997). As with sentential miscomprehension there was no statistical difference between categories on the basis of the Mann-Whitney test applied to the Likert responses for each category.
Study 1 Results Summary
Analysis of the qualitative results provides evidence for all three types of miscomprehension and suggests that this miscomprehension may not be readily detectable statistically. The linguistic ambiguity within these scales is therefore a potentially significant but typically undetectable source of error.
Study 2, Phase 1: Respondent Self-Classification Into Types of Miscomprehension
In order to ensure that the miscomprehension observed in the first study was not an artifact of the coding and classification process, we ran a second study to verify our results.
Method
Study 2 was survey based and had three parts. The first was the “normal” presentation of the scales (i.e., with a modified Likert response scale), and the last section asked for demographic information. The second section, however, was very different.
Participants were presented with the items and then invited to choose the interpretation that most closely matched their understanding of the original item. We derived these alternative interpretations from the open-ended responses gathered in Study 1. In order to assess sentential miscomprehension, each stimulus item was presented with several response options, including a neutral paraphrase of the original item (N), an enriched response (E), a depleted response (D), a response that was both depleted and enriched (D&E), and an option for respondents who did not agree any of the choices were consistent with their understanding (I). A sample item is presented in Table 3. Each stimulus was presented twice with differing sets of possible interpretations (i.e., neutral, enriched, etc.) on each occasion, in order to verify that the respondents’ selections were not simply an artifact of the specific choices presented. If a respondent is interpreting the item accurately, they should select the neutral option both times.
Sample Items for Study 2, Phase 1.
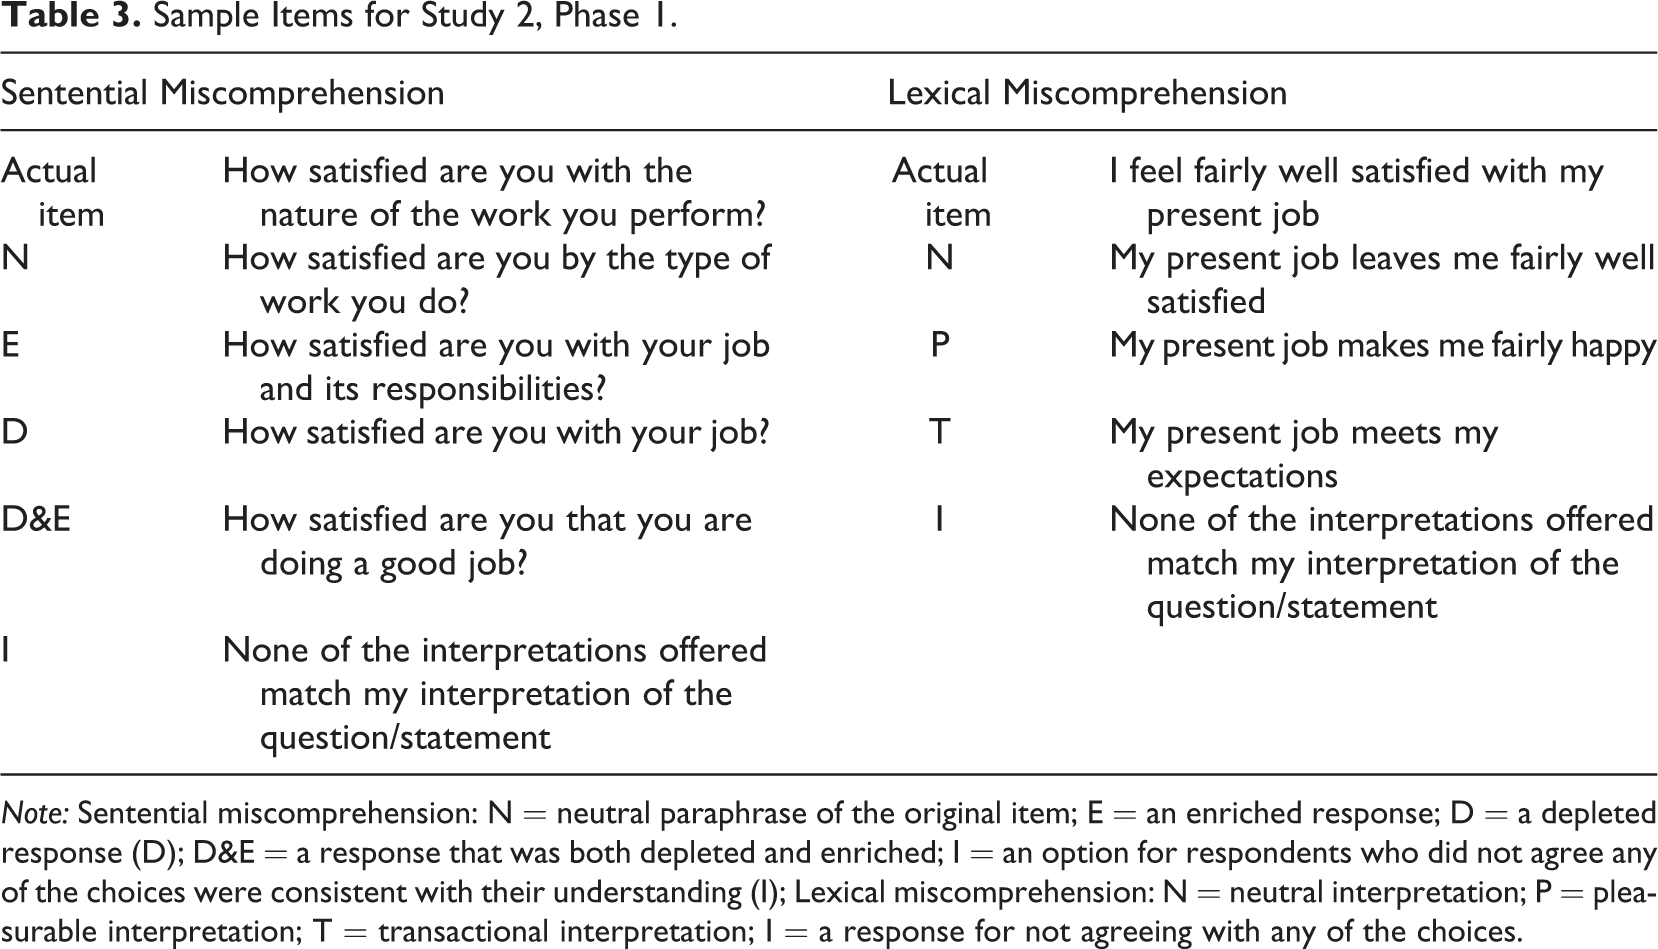
Note: Sentential miscomprehension: N = neutral paraphrase of the original item; E = an enriched response; D = a depleted response (D); D&E = a response that was both depleted and enriched; I = an option for respondents who did not agree any of the choices were consistent with their understanding (I); Lexical miscomprehension: N = neutral interpretation; P = pleasurable interpretation; T = transactional interpretation; I = a response for not agreeing with any of the choices.
Similarly when assessing lexical miscomprehension we focused on the different meanings of the word satisfaction. Respondents were offered neutral (N), pleasurable (P), and transactional (T) interpretations and a response for not agreeing with any of the choices (I). A sample item is presented in Table 3. As with sentential miscomprehension each stimulus was presented twice with differing response options. If linguistic ambiguity has no effect on survey research, then respondents should either pick the neutral item, which was a paraphrasing of the initial question or, at least, all choose the same non-neutral option.
The second test for lexical miscomprehension included the use of three items with ambiguous modifying terms: “I am often bored with my job,” “Most days I am enthusiastic about my work,” and “I like my job better than the average worker does” (Agho et al., 1992). Respondents were presented with different options for each term indicating different frequencies, time periods, or comparative groups, respectively. For example, for the item “I am often bored with my job,” responses ranged from “More than 33% of the time I am bored with my job” to “More than 75% of the time I am bored with my job.”
The validity of the response choices was checked by sending them to a university linguistics professor. She classified the responses into the sentential and lexical miscomprehension categories. She accurately classified 98% of the response choices into the same category as the authors, suggesting that the choices accurately mirrored sentential and lexical miscomprehension as outlined previously.
The sample for Study 2 came from two sources. First, we again sent the survey to some of our contacts and asked them to forward it to other working adults and collected 165 valid responses from this group. We then collected an additional 100 responses using a paid Qualtrics panel of working adults. This allowed us to check whether the phenomena observed were an artifact of our sampling method or whether they also occurred in a broader sample that is likely to be more representative of the population of working adults.
Results
Dimensions of the Sample
Two hundred sixty-five valid responses were received. Most of the respondents were natives of either the UK (37%) or US (52%) with the remaining 11% from a mix of other countries. The average age was 42 (SD =11.5), 57.7% were female and 87.5% had a college degree, with 52% having a master’s degree or higher.
Statistical Tests for Scale Validity
As in Study 1 numerical responses to the first portion of the survey where the items were administered in their conventional format were subjected to statistical analysis. Coefficient alpha values were somewhat higher than in Study 1, varying between .87 and .91.
We established scale dimensionality in this sample by conducting confirmatory factor analysis using LISREL (Jöreskog & Sörbom, 2006) to examine factor structure. We looked at each of the job satisfaction scales (Agho et al., 1992; Tsui et al., 1992) on its own in combination with the measure of procedural justice (Sweeney & McFarlin, 1993) as we did not expect to find that a three-factor model including both measures of job satisfaction would provide a satisfactory fit to the data. In both cases, all items loaded significantly on the latent variable, and acceptable fit statistics were obtained (Comparative Fit Index [CFI] of .95 and .98; standardized root mean square residual [SRMR] of .043 and .059), although in both cases the chi-square test was significant. Chi-square can be problematic (Jöreskog, 1969) as it is very sensitive to both sample size and violations of distributional assumptions. Garson (2009) advises that chi-square test significance can be overlooked if other fit measures indicate good fit. Given that other fit statistics were consistently within acceptable range (Hair, Black, Babin, Anderson, & Tatham, 2006), and the reliability coefficients were strong, we concluded that the scales demonstrated sufficiently good fit that if we were conducting a substantive analysis using these data, we would consider that we had confirmed the unidimensionality of each scale.
Sentential Miscomprehension
Over 90% of the respondents found that one of the four interpretations of the stimulus item offered (i.e., neutral, enriched, depleted, or enriched and depleted) coincided with their interpretation of the stimulus item. If respondents had followed the strict syntax of the stimulus item then they should have selected the neutral response. While this was the modal category and was, on average, selected 49% of the time (range = 24%-68%), other categories, principally enrichment, were also commonly chosen. Table 4 shows the number and percentage of respondents demonstrating sentential miscomprehension.
Number and Percentage (in Parentheses) of Respondents Demonstrating Various Forms of Sentential Miscomprehension.
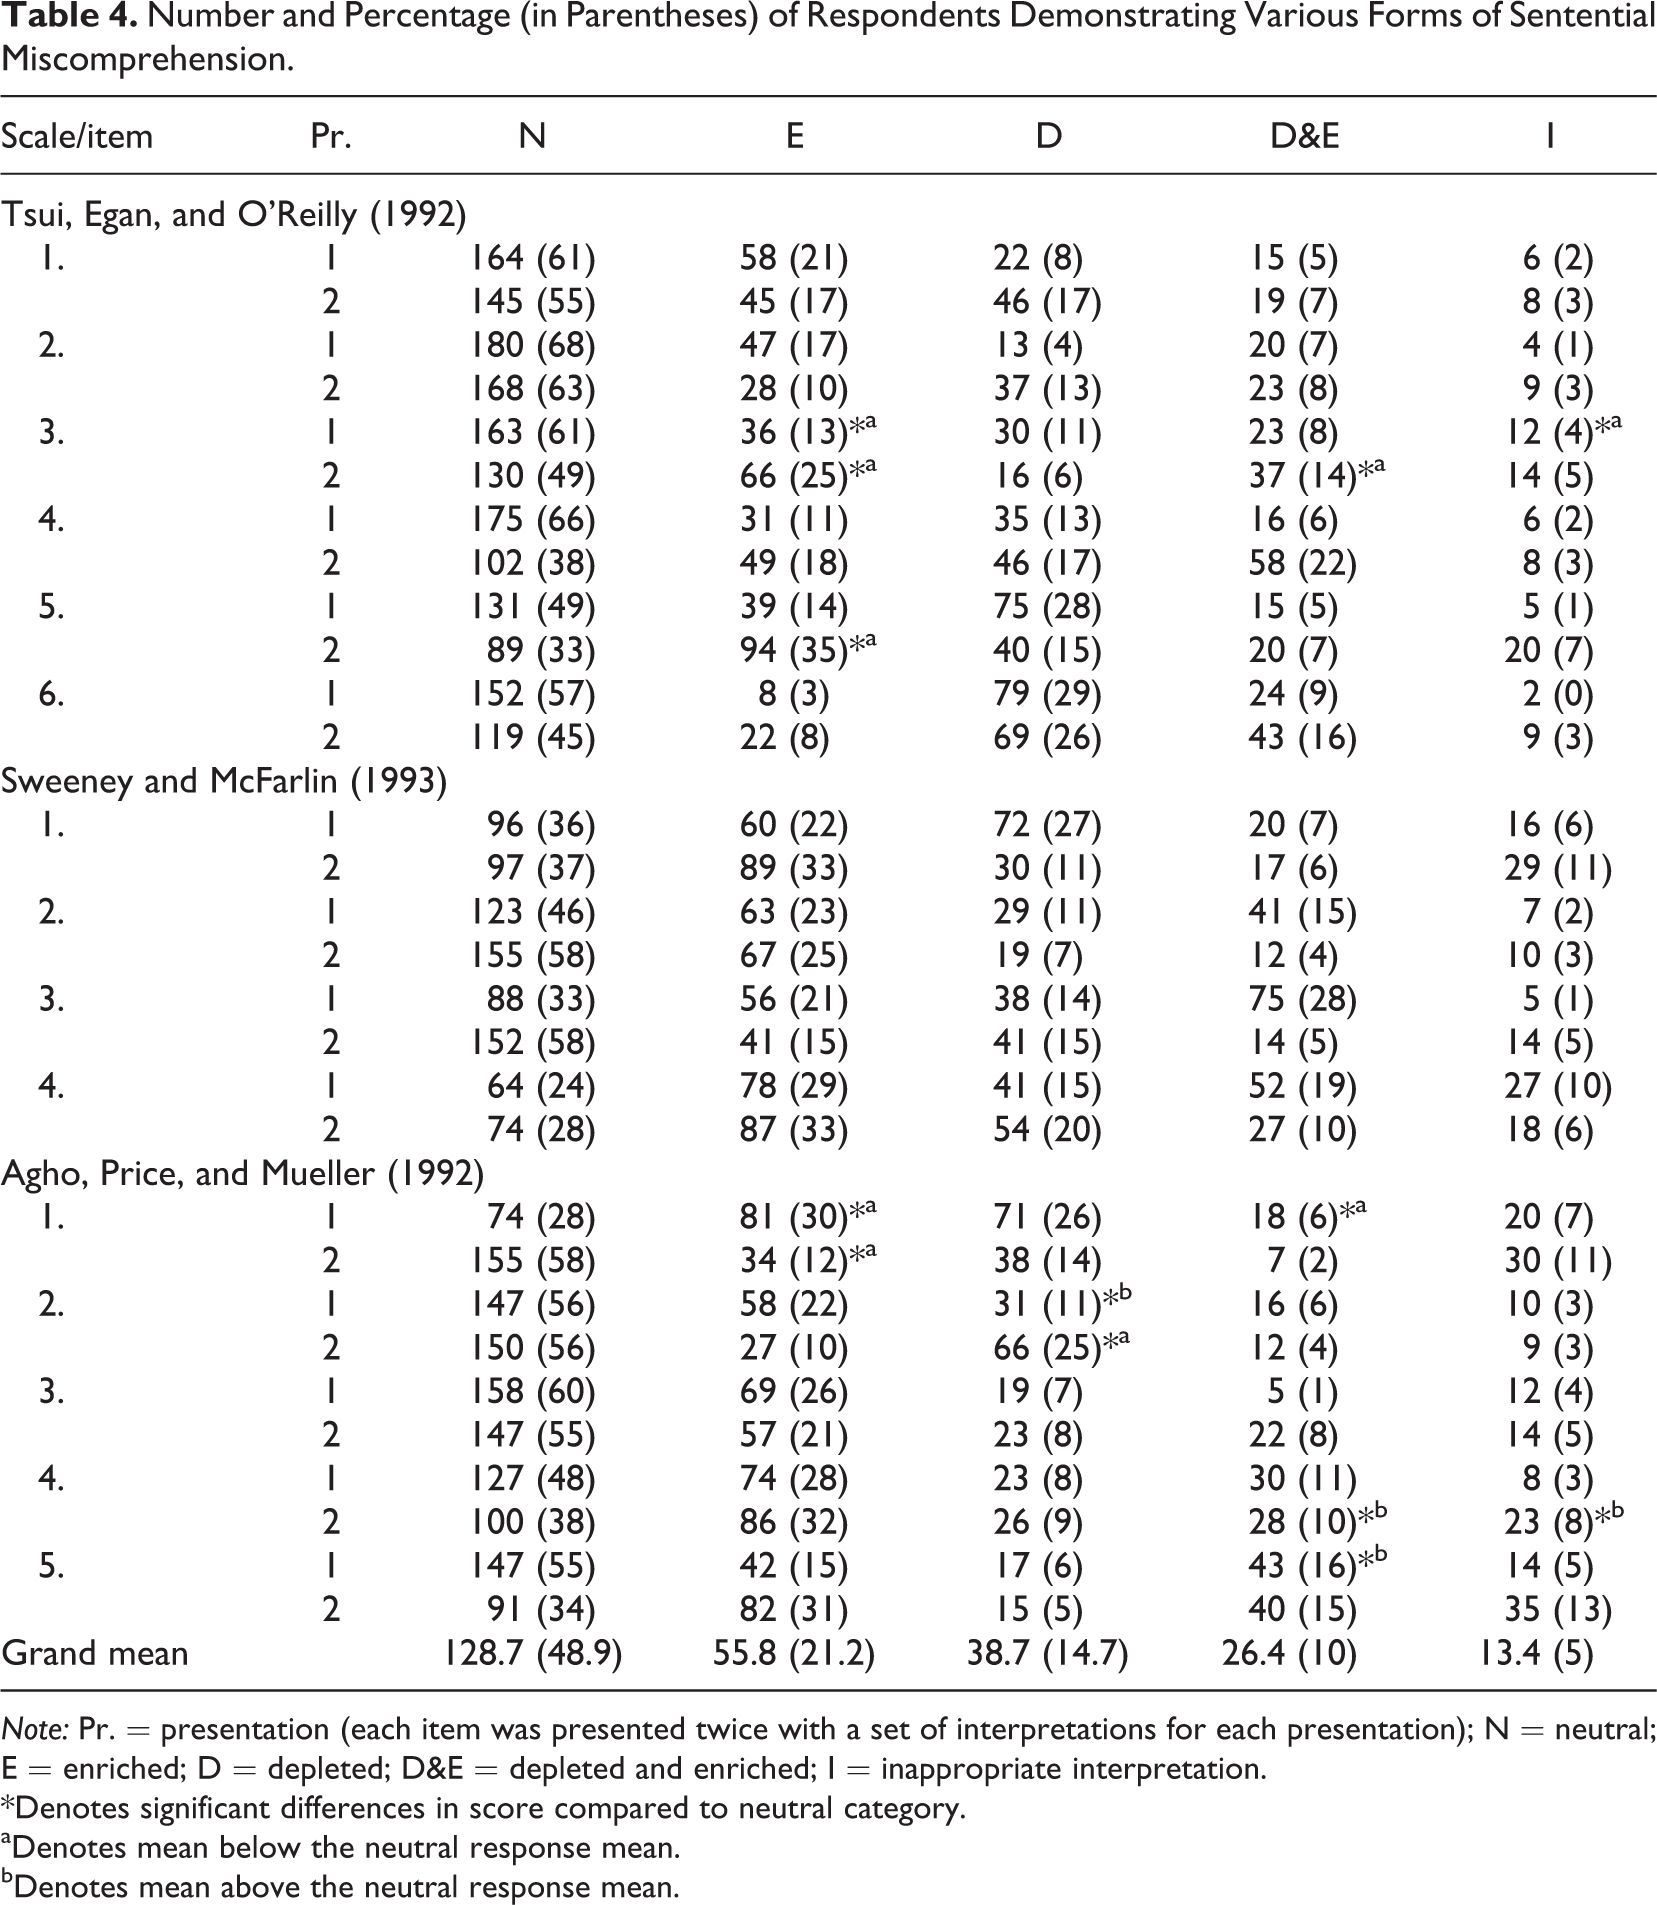
Note: Pr. = presentation (each item was presented twice with a set of interpretations for each presentation); N = neutral; E = enriched; D = depleted; D&E = depleted and enriched; I = inappropriate interpretation.
*Denotes significant differences in score compared to neutral category.
aDenotes mean below the neutral response mean.
bDenotes mean above the neutral response mean.
These results confirm that respondents routinely go beyond the strict syntactic meaning of items. Moreover this interpretive process does not appear to be uniform and some items are enriched or depleted to differing degrees. These data accord with the results of Study 1.
The first section of the survey contained the scales in their conventional format (i.e., with Likert responses). This allowed us to see whether different interpretations produced significantly different scores. For 9 of 30 items the different interpretations produced significantly different scores on the Kruskall-Wallis test, with these demonstrating mild to moderate effect sizes of between r = –0.15 to –0.29 (Cohen, 1977). A Bonferroni correction was applied to post hoc Mann-Whitney results, such that differences are reported at a ≤.01 level of significance. The categories that differed from the neutral interpretation and the direction in which they differed are shown in Table 4.
We conducted character, syllable, and word counts for each item and calculated a number of readability measures (after Jensen, 2009) to explore the impact of item length and complexity on comprehension. These were then compared to the number of neutral interpretations of each item as fewer neutral interpretations suggests greater miscomprehension. No significant relationship was observed, suggesting that item length and complexity did not correlate with miscomprehension.
Lexical Miscomprehension
Over 90% of respondents found that the options that they were presented with matched their own interpretation of the item. Analysis of respondents’ understanding of the word satisfied, presented in Table 5, suggests that there was significant deviation from the neutral response. Fifty-six percent of respondents selected the “neutral” option—which contained the word satisfied rather than any interpretation. Twenty-four percent of respondents selected a pleasurable interpretation of the word satisfied, and 14% chose the transactional interpretation.
Number and Percentage of Respondents Demonstrating Lexical Miscomprehension of the Word Satisfied.
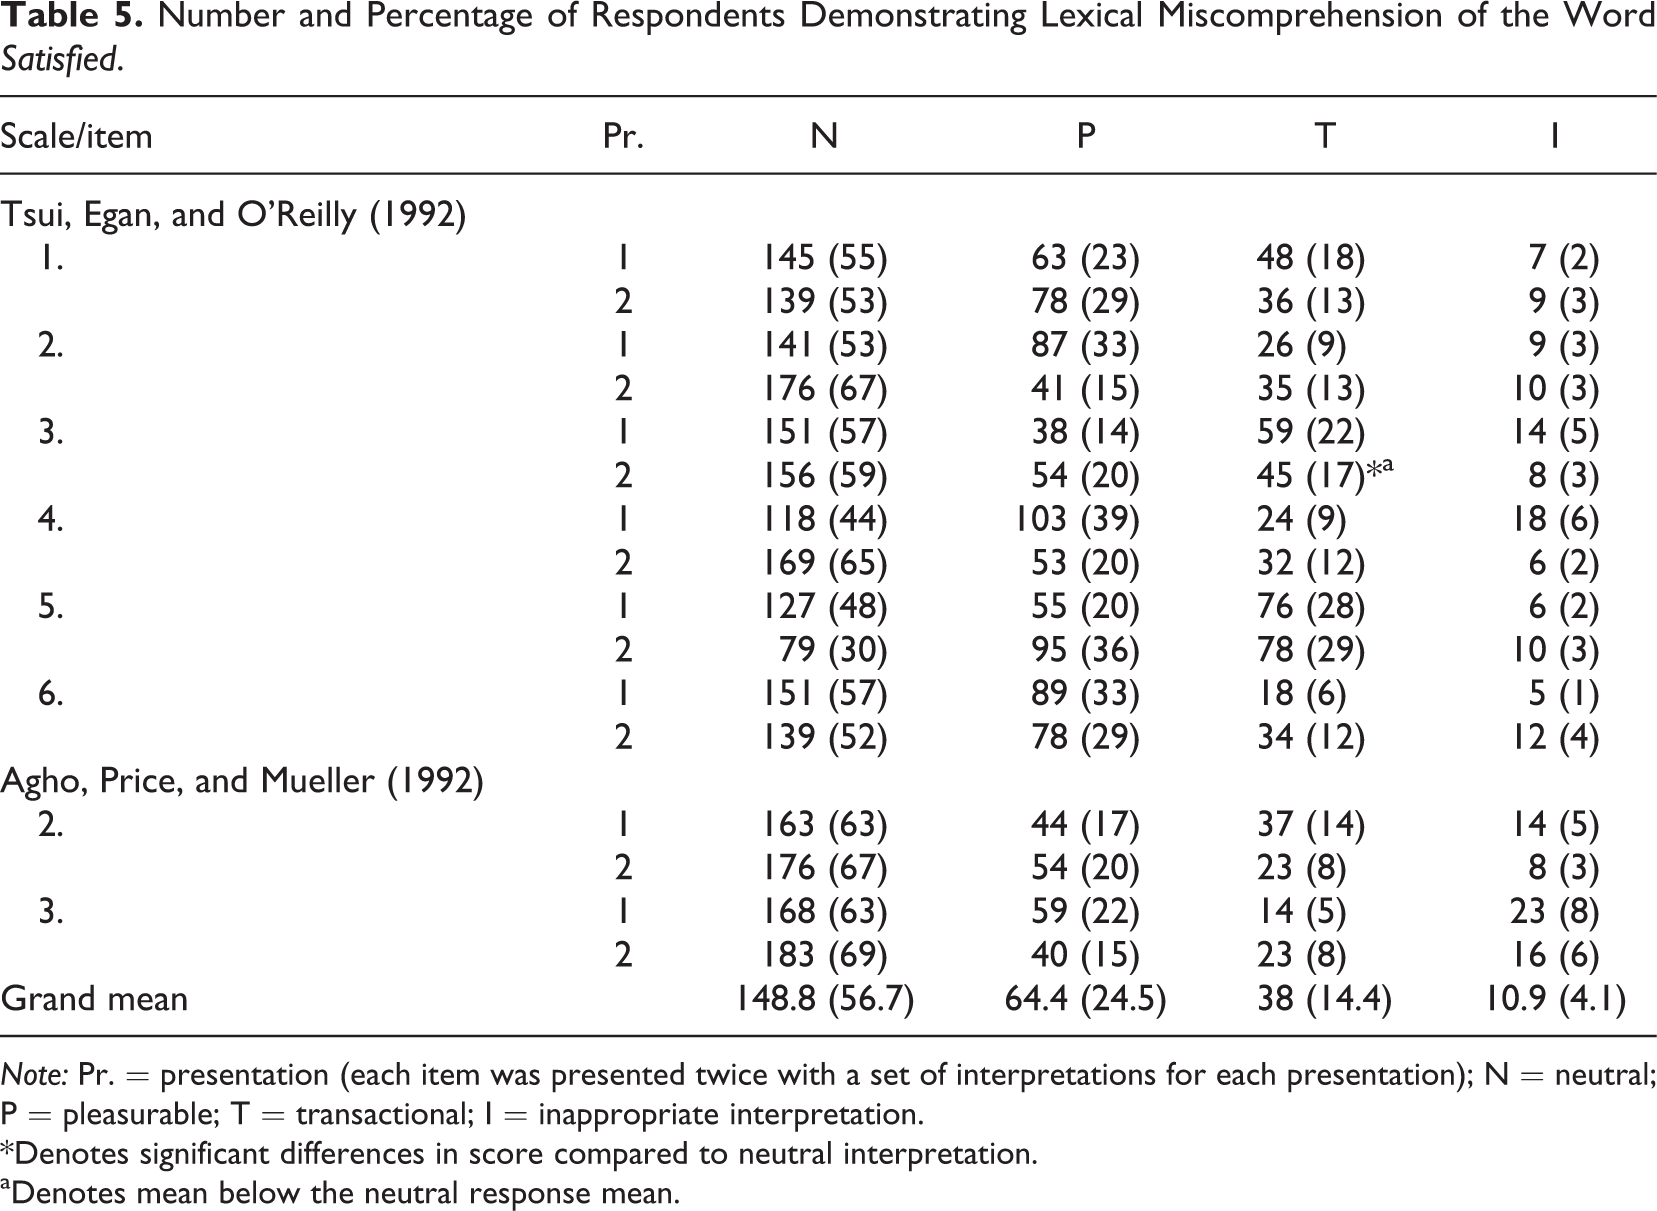
Note: Pr. = presentation (each item was presented twice with a set of interpretations for each presentation); N = neutral; P = pleasurable; T = transactional; I = inappropriate interpretation.
*Denotes significant differences in score compared to neutral interpretation.
aDenotes mean below the neutral response mean.
The number of respondents choosing pleasurable or transactional interpretations was lower than in Study 1. Statistical analysis of the responses to the different forms of lexical miscomprehension using the Kruskal-Wallis test demonstrated a significant difference for only 1 of 16 items, again, with a mild to moderate effect size (r = –.18, see Table 4).
Differing lexical interpretations were also observed. The word often in the item “I am often bored with my job” was interpreted as being 33% to 75% of the time. Most in “Most days I am enthusiastic about my work” was either 3 of 5 or 4 of 5 days with a significant number understanding “most” as “more often than not.” Finally for the item “I like my job better than the average worker does,” a number of different options were given to define the “average worker.” Most respondents selected either the “typical worker in this country” or “the average person,” but 14% selected either coworkers or peers as their comparator.
Although the differences in categories was significant when analyzed using the Kruskal-Wallis test as an omnibus test, none of the categories reached significance in post hoc analysis using Mann-Whitney with a Boniferroni correction, indicating that there is no significant difference in scale score based on respondent interpretation of the item.
These data present strong evidence that individuals interpret words differently. Some regard being “satisfied” as a pleasurable experience whereas others regard it as a transactional one, even when the original intent of the author was one or the other. Modifying words such as often are similarly open to interpretation as individuals draw on different mental schemata.
Study 2, Phase 2
Phase 1 of the study demonstrated primary effects, where differences in interpretation resulted in significant differences in score. We have already raised the possibility of secondary effects, where differences in interpretation affect other constructs. So to explore this possibility we repeated Phase 1 and incorporated a measure of turnover intention.
Method
The survey used was exactly the same as that used in Phase 1, but with the addition of two items from the Camman, Fischman, Jenkins, and Klesh (1983) scale measuring turnover intention. The survey was administered using Amazon’s Mechanical Turk (mTurk) to obtain a sample of respondents who were currently employed. mTurk has been used effectively in various fields, including both linguistic and psychology studies (see Mason & Suri, 2012; Sprouse, 2011).
Results
Of the 250 respondents who completed the survey, 39 failed checks built in to test for careless responding, leaving a final sample size of 211 valid responses. The checks included 3 items scattered through the survey such as “If you are reading this, please select disagree.” Participants were discarded from the sample if they failed two or more of these checks and they completed the survey very quickly. This is the consistent with the methods described by Meade and Craig (2012) to detect and eliminate cases in which the respondent is not attending to the content at all.
Of respondents, 51.2% were female, the average age was 35.2 (SD = 10.9), 95.3% of respondents were American, 78.7% had a college degree or higher, with 15.4% having a master’s degree or higher.
Sentential Effects on Turnover Intention
We noted in Study 1 that the item “I am satisfied with my job for the time being” (Agho et al., 1992) seemed to trigger an association with turnover intention in some respondents. In Study 2, one of the enriched interpretations reflects this. Respondents therefore could choose between a neutral interpretation of the item and an enriched version, “At the moment I am satisfied with my job and I am not looking for a new one.” There was no significant difference detectable in item score across the interpretations, suggesting that the impact of the miscomprehension is not directly detectable. Accordingly we selected this item for analysis.
We compared the turnover intention scores of those who selected the enriched interpretation of the item with those who selected the neutral interpretation. Using a Mann-Whitney test to compare the scores for these two groups we found a difference that approached significance, U = 1,867, z = –1.88, p = .060, r = –.13, whereby those enriching the item scored higher on turnover intention. This suggests that sentential miscomprehension can have indirect effects, as such a result is unlikely to have happened by chance (Nickerson, 2000).
Lexical Effects on Turnover Intention
We explored the possibility that lexical miscomprehension might also have indirect effects by examining the relationship between differing interpretations of the word satisfaction and turnover intention. We chose the satisfaction item that best reflected the global concept of job satisfaction—“Considering everything, how satisfied are you with your current job situation?” In Phase 1 there was no significant difference in item score among the types of interpretation offered.
We found a significant difference across groups when comparing the transactional interpretation to the pleasurable interpretation, U = 569, z = –2.95, p = .013, r = 0.20, and also when comparing the transactional interpretation to the neutral one, U = 1,208, z = –2.38, p = .017, r = –.16.
These results show that differences that do manifest themselves on item score may, as linguistic theory suggests (Schwarz, 1999), reflect differing cognition and have indirect effects.
Study 2 Results Summary
The findings of Phase 1 of Study 2 confirm the findings in Study 1, suggesting that they are not the product of researcher confirmation bias (see Nickerson, 1998). Furthermore, Phase 2 of Study 2 demonstrates that miscomprehension may also have indirect effects.
Study 3: Replication of Results With Spreitzer’s Empowerment Scale
To allay concerns that the findings demonstrated were an artifact of the scales selected we replicated Studies 1 and 2 with Spreitzer’s (1995) 12-item empowerment scale. This scale was developed using best practices for scale development and the author reported strong evidence of construct validity. The scale includes four subdimensions of psychological empowerment: meaning, competence, self-determination, and impact.
Method
The replication was carried out in two phases. Phase 1 involved administering the 12 items of the scale to a pool of 29 participants, as in Study 1. The results of this first phase were then used to create the item interpretations for the second phase, which replicated Study 2. In this phase we constructed neutral, enriched, depleted, and depleted and enriched interpretations for each item in Spreitzer’s (1995) scale and asked respondents to select the interpretation that most closely matched their own interpretation. We again collected demographic data and asked the respondents to answer the scale in its original format. Data were collected from 100 employed workers through Amazon’s Mechanical Turk.
Results
Eleven of the 100 respondents failed checks built in to the survey to test for careless responding, leaving a final sample size of 89 (average age = 35, 56% male, 60% had a college degree). As with the three previous scales, there was significant evidence of miscomprehension, as a sample of responses to the item “The work I do is meaningful to me” shows. Respondents variously interpreted this as “I feel good about what I do,” “I gain personal satisfaction from performing the work because it is worthwhile,” “I believe my job is important to the company therefore I am serving a purpose,” “The overall work that I do aligns with what I want to achieve with my life,” and “How important is my job to my sense of self,” suggesting that respondents frequently go beyond the syntax of the item to sententially miscomprehend it.
The results of the second phase are shown in Table 6. As with Study 2 we see that participants select responses that deviate from a neutral paraphrase of the original item. We were therefore able to demonstrate that the phenomena uncovered in Study 1 and Study 2 can be replicated using alternate scales, and therefore we can conclude that linguistic ambiguity is a threat to construct validity of all scales, no matter how well they are theoretically or statistically grounded.
Replication of Study 2 Using Spreitzer’s (1995) Empowerment Scale.
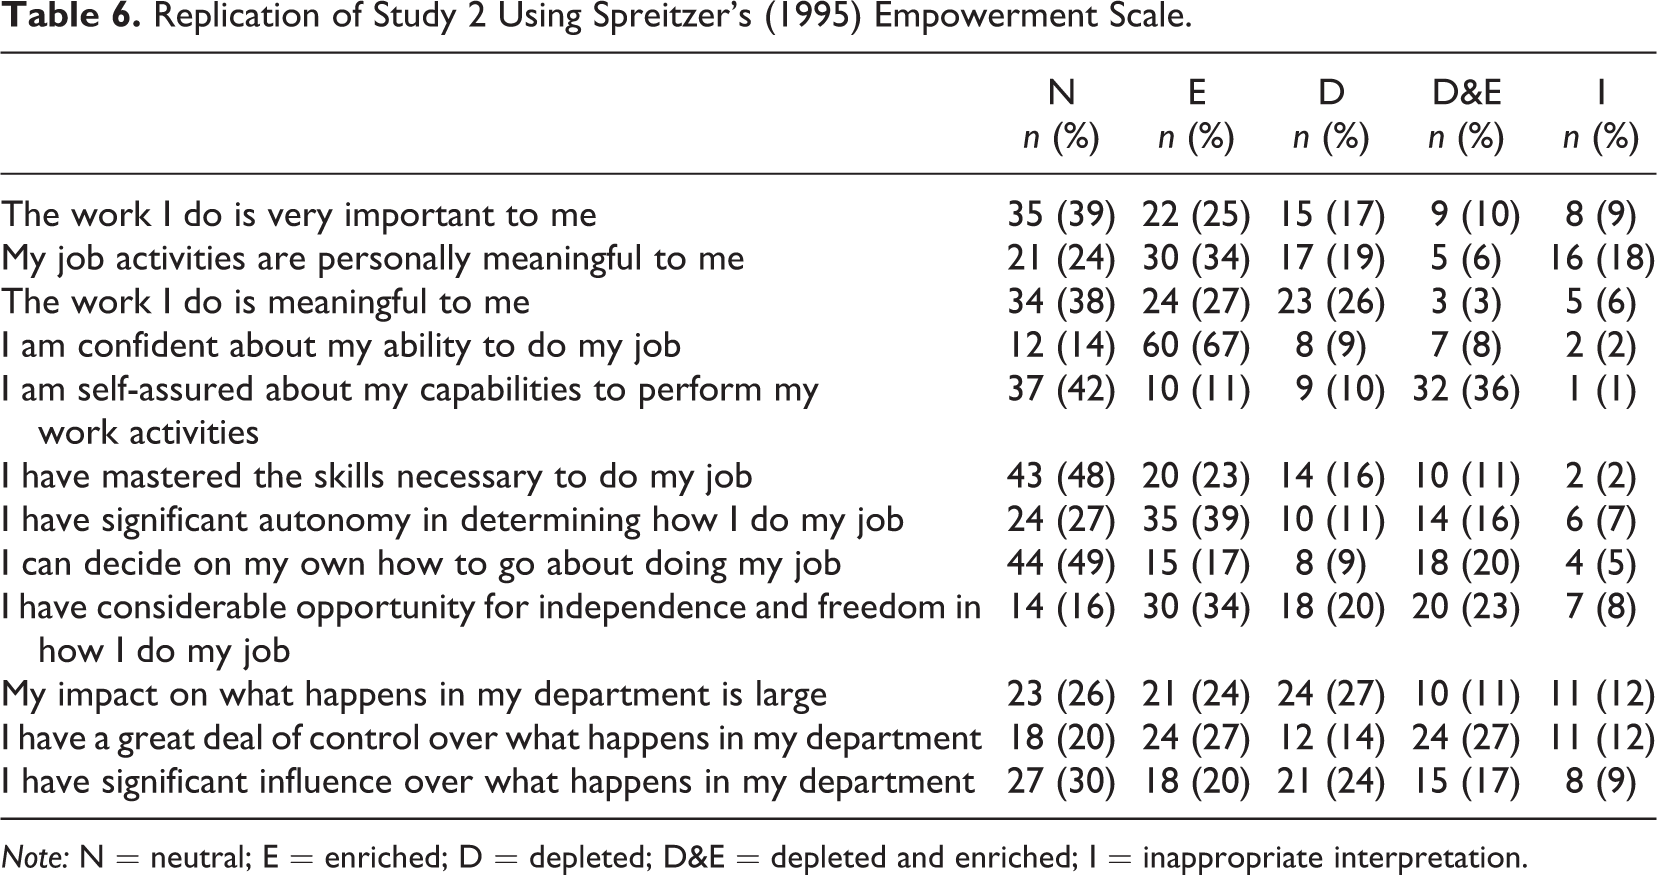
Note: N = neutral; E = enriched; D = depleted; D&E = depleted and enriched; I = inappropriate interpretation.
Discussion
All three studies provide strong evidence for three types of miscomprehension: instructional, sentential, and lexical. The three types differ in the ease with which they are apprehended and, potentially, the ease with which they are remedied. In this section we will examine the impact of each category of miscomprehension and make recommendations for amelioration of the error observed.
Instructional Miscomprehension
Of respondents, 5% to 9% do not appear to read the instructions that accompany the survey, and the conservative classification system used means that the true figure may be considerably higher. This figure appears to be markedly increased for the RMNet group, suggesting perhaps that those most familiar with survey research are actually the least likely to pay attention to instructions.
The reasons why individuals did not read the instructions is unclear, but it seems probable that familiarity with the task and the seeming “obviousness” of what needs to be done are likely. The highly educated nature of the sample may mean that they are more regularly surveyed. They may also take mental “shortcuts” as they believe they know what is required. This would seem particularly true for the RMNet group for whom surveys are likely to be common currency.
The fact that a large number of RMNet members (12/34) did not read the instructions is understandable but nonetheless a cause for concern. When developing scales, researchers routinely ask their colleagues’ opinions on various matters and use them to help generate items. This result suggests that Schriesheim and colleagues (1993) were correct when they asserted that academic colleagues might not be the ideal assistants.
Sentential Miscomprehension
The results suggest significant sentential miscomprehension. This is most dramatically observed in the procedural justice scale (Sweeney & McFarlin, 1993) where (depending on the item) 21% to 31% of respondents appeared to miss the “process” element and hence answer a question about distributive justice. The figure was rather lower for the RMNet group, which we believe may be because they are more likely to be sensitized to the procedural element of the question. The fact that the group that ignored the procedural component was indistinguishable statistically from the respondents interpreting the question correctly means that any results from this scale would contain substantial and hidden error. However, as the literature is replete with studies in which procedural and distributive justice are highly correlated (Colquitt, 2001), this study perhaps sheds some new light on the source of some of this collinearity.
Study 2 showed that enrichment, depletion, or a combination of the two were demonstrated by about half of respondents. This suggests that around half of respondents deviate from the strict syntax of the item and alter it according to their own understanding.
The impact of sentential miscomprehension is difficult to ascertain. For 9 of the 30 items, differing interpretations produced significantly different results on the traditional presentation of the item. This effect, however, was inconsistent. It seems likely that the process of enrichment or depletion meant that respondents tapped into other concepts when responding. For example, the item “I am satisfied with my job for the time being” was interpreted 22% of the time as “At the moment I am satisfied with my job and I am not looking for a new one,” an interpretation that, as Phase 2 of Study 2 shows, also taps into turnover intention. The implications of this are both direct and indirect. Directly, some respondents tap into a construct other than job satisfaction. Indirect effects might potentially occur when job satisfaction and turnover intention are included in the same study. The linguistic interaction for some (but not all) of the participants would potentially interfere with the validity of the results obtained.
Sentential miscomprehension therefore has the potential to introduce substantial error. This may not be detectable using conventional scale appraisal techniques, as the scales in this study had high coefficient alphas and were unidimensional in factor analyses. Despite this, this error has considerable impact on construct validity and sporadic impact on scale score.
Lexical Miscomprehension
Although lexical miscomprehension is difficult to ascertain, the different understandings of the word satisfaction and the variation in meaning of the word often in this study demonstrates that there is linguistic variance among respondents.
What is the impact of this? It seems likely that respondents are answering somewhat different questions as a result of lexical miscomprehension of the word satisfied. Again this raises the possibility that some respondents may be tapping into different constructs when they interpret items. This will have both primary effects on the scale itself and secondary effects on any model incorporating constructs similar to those being unconsciously tapped into by the respondent.
Lexical miscomprehension is most clearly observed in the different interpretations of often. When responding to the statement “I am often bored with my job,” if the threshold for often is one-third of the time then you are likely to respond differently to this question than would someone for whom often means 99% of the time.
The results demonstrate that individuals have different interpretations of individual words, yet this is not appreciable using conventional statistical techniques. The impact of this is that respondents are drawing on quite different conceptual schema and referents, with attendant diminution of construct validity.
Consequences and Remedies
The findings of this study make uncomfortable reading for those of us involved in survey research. The degree of variance observed linguistically would be serious cause for concern if it was observed numerically. All four measures used in this series of studies have been published in high-quality journals and frequently cited. They have furthermore been subjected to significant previous construct validation analyses. And yet they all contain linguistic threats to validity.
The reliability and validity of measurement instruments and surveys is of pivotal importance. If the measures do not measure what they purport to, or do not do so accurately, then recommendations based upon research that employs these measures are likely to be flawed. So what is to be done? We propose strategies to minimize each form of miscomprehension for those developing new scales and those using existing scales. We begin by providing principles to undergird item construction.
Instructional Miscomprehension
Putting borders around the instructions and using bold type or capitals do not seem to completely eliminate instructional miscomprehension, as these were all used in Study 1 to little effect. The literature on manipulation checks however offers a possible direction. Oppenheimer, Meyvis, and Davidenko (2009) used an effective system to detect failure to follow instructions. Participants were presented with a survey about sports participation. The instructions indicated that participants should ignore the first question in the survey and instead click on the page title. Those who had not read the instructions were able to proceed with the survey normally, allowing researchers to compare the responses of those who read the instructions with those who did not. This is similar to the “captcha” or “reverse Turing test” advocated by Mason and Suri (2012) where a particular response is requested by the survey item to prove that the participant is paying attention and motivated. Use of these approaches improves engagement, reducing the proportion of invalid responses from 48.6% to 2.5% (Kittur, Chi, & Suh, 2008).
There is a danger that these seemingly counterintuitive instructions (e.g., to ignore a particular item) might confuse respondents. Instructing participants to pay close attention to the items and informing them that tests that measure their carefulness or attentiveness are being used may help. Care should also be taken to ensure that such tests do not interfere with respondents’ capacity to answer other items in the survey. There is also a potential danger that selecting only those respondents who obey all the instructions excludes particular groups, for example those with a particular personality trait. Nonetheless, tests of this sort are a useful addition to any survey to ensure that participants have attended to the instructions and are sufficiently motivated.
Sentential Miscomprehension
When looking at the structure of the item, it is important to eschew vague words such as many, most, often, or sometimes. These have no formal quantity and so represent an open invitation to miscomprehension. Try to use a quantity so that instead of an item that says “Most days I am enthusiastic about my work” use “I am enthusiastic about my work at least 75% of the time.” When asking for a comparison, ensure that the comparator is clear. The UK Office of National Statistics Wellbeing Survey (Office of National Statistics, 2013), for example, contains an item “Overall, how satisfied are you with your life nowadays?” Nowadays is a vague term. A better item would be “Overall, how happy have you been with your life over the last three months.”
Comprehension may also be improved by the use of bold or italicized elements of items (see Christian & Dillman, 2004). As those respondents not following instructions have already been eliminated it seems likely that those remaining in the sample are more motivated and attentive. The use of bold or italics may help emphasize elements of the item, for example, “How fair or unfair are the
Lexical Miscomprehension
There is a great deal of extant advice on item construction (e.g., DeVellis, 2003; Groves et al., 2004) and our recommendations are intended to supplement this, not supplant it. We first consider the actual words used in the item.
The tendency for multiple interpretations of the same word (polysemy) that we have observed with the word satisfaction suggests that care should be used to avoid words with multiple meanings. The number of different meanings of a particular word can be examined using a dictionary. As an example, the word happy might be preferred to the word satisfied when asking about the relationship between an employee and their organization if the measure is intended as an affective one. If another word is not available, then linguistic theory suggests that context aids comprehension. This means that the scale authors should provide careful guidance, through contextual information, as to which meaning the respondent should select. As this contextual information is typically provided in the instructions, the problem of instructional miscomprehension becomes even more of a concern and the use of effective mechanisms to combat it even more vital.
Ill-defined words, such as meaningful, should also be avoided. While the researcher may have a clear idea of what a concept means, the respondents may not. Plain, short, commonly used words are most likely to be understood and reduce miscomprehension. Care should also be taken to avoid jargon and culturally specific terms. The word quite, as in quite good, for example, is a superlative in the US but represents borderline mediocrity in the UK. In some cases researchers may abjure from using words altogether and use pictograms, such as smiling/frowning faces used by Kunin (1998). Those using existing scales should be similarly critical of words used, even in published scales, as the authors may not have attended to issues of miscomprehension.
Survey Construction
Moving from the individual item to survey composition allows us to use linguistic theory to aid comprehension. Given that comprehension is a function of syntax and context, a sensible approach is to provide plenty of context to ensure a more uniform and predictable interpretation process. While there have been conflicting views of the necessity or indeed the desirability of intermixing items (Schriesheim & Denisi, 1980; Schriesheim, Kopelman, & Solomon, 1989; Sparfeldt, Schilling, Rost, & Thiel, 2006), we suggest that it might potentially have an effect on miscomprehension as surrounding items may well provide contextual information that helps the respondent understand the item, and so grouping may help reduce miscomprehension (Tourangeau & Rasinski, 1988). We therefore recommend grouping items together.
Similarly, more thoughtful instructions—again with an attentiveness check—could help improve item comprehension. If the heading for the Sweeney and McFarlin (1993) scale contained the instruction “We now want you to think about the
While it is clear that linguistic errors are a considerable concern in survey research, few researchers are looking for it. When a new scale is being developed, researchers might ask expert judges if they understand the item, or ask whether the item appears to them to measure the construct, but they do not typically ask respondents what they think the item means. If an existing scale is used, then the provenance of publication may well ensure that even less attention is paid to the properties of the scale.
Testing and Evaluation
After developing a scale that appears to minimize linguistic miscomprehension while sampling the content domain appropriately, we suggest that researchers assess the degree of linguistic ambiguity that the items produce within the target population. This field testing should be used both during scale development, where it should be thought of as a distinct and necessary step in the scale development process and also when using preexisting scales. As linguistic theory suggests that comprehension is a function of both syntax and context, any change in context necessitates a check to ensure that the item is still uniformly understood by respondents and, crucially, in the same way as the researcher.
We have found, during the course of our own research, that the approach we adopted in Study 1 was very effective at identifying ambiguity. This simply asks respondents to describe what they think the question means in their own words. This technique can be used in both the development of new items and in appraising preexisting ones. The advantage of this approach is that it can be administered remotely, and it elicits useful information. For item development purposes it is not necessary to go through the coding processes we did in Study 1, as inspection of the responses is usually sufficient to establish whether the item is being homogenously interpreted. This approach is probably only suitable, however, for about 15 to 20 items as it is time-consuming for the respondent. For longer surveys one might use a piecemeal approach where the whole survey is broken down into blocks of 15 to 20 items and administered to separate samples.
The scale development literature includes a number of approaches to further ensure both content adequacy and homogeneity of comprehension of survey items. Schriesheim et al. (1993) suggest using Q-methodology to help measure the differences between individual judges. Anderson and Gerbing (1991) also offer methods for pretesting with small samples, although their technique focuses more on predicting confirmatory factor analysis (CFA) performance. Hinkin (1998) has suggested both these approaches to test content validity. Hinkin and Tracey (1999) built on this work and provided an analysis of variance technique that allows for evaluation of item distinctiveness as part of the content validation process. In public opinion surveys cognitive interviewing is commonly used to pretest items (Beatty & Willis, 2007; Schwarz & Sudman, 1996). This may either take the form of asking respondents to think aloud as they answer the survey question (Ericsson & Simon, 1980) or by probing specific areas of understanding to help draw out elements of the respondents’ thinking (Willis, DeMaio, & Harris-Kojetin, 1999).
In all survey development there is a tension between specificity and applicability. Words and items that are too specific will not be applicable in other contexts, similarly general words and items may not be sufficiently precise to reflect subtle difference. The process of thoughtful development and field testing should help ensure that the researcher successfully navigates between these two poles.
A Note for Reviewers
Those reviewing papers using survey research should also attend to issues of linguistic ambiguity, as quality measurement is the responsibility of both researcher and reviewer (Hinkin, 1995). The first step should be to require anyone who submits a paper based on survey research to provide the measure for examination. 4 They should then, having ruled out normal threats to validity (e.g., double barreled, etc.), look at the individual words in the item to see if the item contains any modifiers such as most or often or words with multiple meanings, such as satisfaction. The next step should be to inspect the syntax of the item to make sure that referents are clear, for example, yesterday rather than recently. Reviewers should then assure themselves that the authors have ascertained whether the item is uniformly comprehensible to the target audience. Finally reviewers should inquire as to the steps taken by researchers to ensure that their respondents have read the instructions and are motivated throughout the survey. These steps, taken together, should help reduce poorly worded items and weed out unmotivated participants, thus improving the quality of research based on soliciting opinions.
It is unlikely, however, that linguistic ambiguity will ever be eliminated. As linguistic philosophers have pointed out, and as we discussed in the linguistic theory section, there is always an indeterminacy of language. Nonetheless these approaches to item development and testing will help identify and eliminate the more obvious forms of instructional, sentential, and lexical miscomprehension.
Limitations and Future Directions
This article used two different approaches to explore the impact of linguistic pragmatics on survey interpretation through the examination of four carefully chosen scales. By using a combination of open-ended and fixed response format questions we have aimed to use “methods that have non-overlapping weaknesses in addition to their complementary strengths” (Brewer & Hunter, 2006, p. 4). The four scales used here, however, can hardly be seen as representative of all available scales. Future studies should extend this analysis to other scales.
Future research could explore the properties of items and words, and their context, which led to them being either sententially or lexically miscomprehended. This would require considerable effort, but given careful design and sufficient respondents, it may be that general principles to reduce the impact of linguistic factors on survey research could be produced, given that the extant linguistics literature has examined some of these issues already.
Another interesting area for future research would involve comparing whether native English speakers were more likely to sententially or lexically miscomprehend items than non-native speakers. Theoretically native English speakers should have a more nuanced vocabulary and so be more likely to make linkages to other English words than non-native speakers. This may mean that non-native English speakers are actually better survey respondents as they are more likely to interpret items appropriately. Research in children, who similarly have a more restricted vocabulary, suggests that they produce a more restricted set of interpretations (Noveck, 2001). In addition, future research might examine the possibility that there may be individual differences that drive linguistic miscomprehension.
Finally, the current study has been within the paradigm of classical test theory. Item response theory (IRT) might offer an alternative approach to identifying linguistic ambiguity. IRT’s ability to examine bias by comparing the performance of individual items has been used to identify characteristics of respondent populations—for example those faking personality tests (Zickar, Gibby, & Robie, 2004). IRT has also been used to explore characteristics of surveys, for example context effects (Rivers, Meade, & Lou Fuller, 2009), the effects of extreme wording (Nye, Newman, & Joseph, 2010), and equivalence of translation (Ellis, 1989). Evaluation of item response curves may help identify differences in interpretation that are not readily appreciable using classical techniques.
Summary
Survey research is a critical weapon in the social scientist’s methodological armory. It enables the opinions and feelings of large numbers of respondents to be rapidly ascertained and collated. Developments in statistical techniques have enabled more sophisticated analyses to be performed in order to enhance our understanding of social phenomena and processes. Surveys have tended to rest on the assumption of an unbroken chain of comprehension between the mind of the researcher through the survey instrument and to the mind of the recipient—and back again. This assumption does not seem, on the basis of the results of this study, to be particularly robust. Respondents often either fail to follow instructions or miscomprehend the items presented. This is not readily detectable when the output from a survey is numerical; a problem that may be further exacerbated by changes in the context in which the items are presented.
This article is not intended to denigrate surveys as an information source or research tool, but rather it seeks to draw the reader’s attention to some of the linguistic problems that underlie surveys and to demonstrate the magnitude of effect of these problems. The problem is, perhaps, most neatly summarized by the sociologist R. H. Tawney’s (1971) comment that “Sociology … is a department of knowledge which requires that facts should be counted and weighed, but which, if it omits to make allowance for the imponderables, is unlikely to weigh or even count them right” (p. 147), a comment that seems as relevant and applicable to organizational survey research as it does to sociology.
Overall, research into the linguistics of survey items is a rich soil for future research. Given the misinterpretation described in this article, there is clearly much work to be done. Attention to the potential methodological issues outlined in this article should help produce better, more valid results that will in turn provide the basis for an improved understanding of social and organizational phenomena.
Footnotes
Authors’ Note
All data are available from either author (Ben Hardy,
Declaration of Conflicting Interests
The author(s) declared no potential conflicts of interest with respect to the research, authorship, and/or publication of this article.
Funding
The author(s) received no financial support for the research, authorship, and/or publication of this article.