
Abstract
In this article, we describe how neuroscience can be used in the study of team dynamics. Specifically, we point out methodological limitations in current team-based research and explain how quantitative electroencephalogram technology can be applied to the study of emergent processes in teams. In so doing, we describe how this technology and related analyses can explain emergent processes in teams through an example of the neural assessment of attention of team members who are engaged in a problem-solving task. Specifically, we demonstrate how the real-time, continuous neural signatures of team members’ attention in a problem-solving context emerges in teams over time. We then consider how further development of this technology might advance our understanding of the emergence of other team-based constructs and research questions.
Keywords
In the area of team-based research, organizational scholars have relied on traditional assessment approaches, such as surveys, interviews, and observations, to study how team members interact with each other at multiple stages of team development. For example, in a field study using surveys and observations, Farh and Chen (2018) used observer ratings and postprocedure questionnaires to study how the different roles taken by leaders can motivate more member “voice” at alternative phases of team development. As another example, Metiu and Rothbard (2013) attempted to use ethnographic observations and interviews to examine how team members develop mutual attention over time.
However, traditional methods to study teams have a few key limitations, especially when examining emergent processes in real time. First, surveys or questionnaires are most realistically administered at certain points of time in a team process to avoid issues such as rater fatigue and interruptions (Kozlowski et al., 2013). Thus, in general, surveys are best administered at either the beginning or end of a team process. Regarding the latter, post hoc assessments inherently depend on the validity of team members’ retrospective information or memory. In addition, retrospective assessments can only deliver overall evaluations rather than provide information on variables (e.g., member engagement levels) that are likely to be fluid or episodic over time in an emergent team process (Kozlowski et al., 2013).
Second, the use of observation to examine aspects of team process may be prone to observers’ motivations and biases (Waldman, Wang, & Fenters, 2019). To truly understand how teams and their members may vary over the course of a team interaction, we need minimally invasive assessment tools that can capture team-based data at precise or episodic moments in real time and with more ecological validity compared to a technique such as human observation of team members (Waldman et al., 2019). In sum, team-process measurement techniques with such desirable characteristics are limited; thus, it would be beneficial to introduce new approaches to study individuals and their interactions within team processes.
Organizational neuroscience, an emerging research domain that integrates organizational phenomena with neuroscience, offers a fresh perspective through which researchers might conceive research issues and measure variables (Ashkanasy, Becker, & Waldman, 2014). Jack et al. (2019) reported that quantitative electroencephalogram (qEEG) constitutes a commonly used method in organizational neuroscience. Gevins et al. (1998) suggested that qEEG can be an especially effective acquisition technology for brain activity due to its high temporal resolution (i.e., high correspondence between the timing of brain activity and its acquisition), its continuous online monitoring capability, and the potential for real-time assessment of participants.
The application of qEEG to organizational phenomena has been largely targeted toward the assessment of individuals (e.g., Bagozzi et al., 2013; Waldman, Wang et al., 2017, 2018). The real-time, neuroscientific study of team processes has been unrealistic due to the technical limitations of qEEG hardware and software, which heretofore had not been designed to support the examination of multiple brains synchronously. However, that state of affairs has changed through recent advances in qEEG technology.
In this article, we describe how nascent neuroscience technologies and related methods can help us better understand team-based research questions, especially as they relate to emergent processes. We provide an example of the neural assessment of attention in teams as a means of demonstrating the contribution of a qEEG measure to emergent properties of teams. We then describe how further development of qEEG technologies and methods might advance an understanding of other constructs and research questions that are relevant to emergent phenomena in team-based research.
Methods
Problem-Solving Task and Sample
The task that we used to investigate how attention emerges in teams consists of a team-based analysis of a business case depicting issues of ethics and corporate social responsibility by linking child labor practices in Bangladesh to global business policy and repercussions in distant consumer markets (see Pless & Maak, 2011). In the case, a Bangladesh-based supplier to a multinational corporation, Levi Strauss & Co., appears to be violating corporate policies pertaining to the use of child labor. Complicating information is introduced throughout the case, including corporate pressures to maintain performance and profitability, other firm-level policies, and the detrimental repercussions on the local communities of potential alternatives to child labor, such as human trafficking and child prostitution, that present even more onerous consequences.
To undertake the Levi Strauss & Co. case, the overall sample of participants consisted of 146 students enrolled in an MBA program in Europe. A variety of nationalities were represented in the sample, and 64.4% were males. The average age was 28.9 years old; 61.5% were Caucasian, 20.7% of the students were Asian, and 15.6% were Hispanic. The language of instruction in the MBA program was English. Participants were first given up to 1 hour to individually read the case, ponder the issues presented in it, and type out written solutions to those issues (i.e., typically several paragraphs of material per participant). The case introduced several questions as a guide for participants to derive their solutions, such as “Who are the stakeholders that would be affected by the manager’s decision? Which concerns should be addressed and how? Should those concerns be prioritized, and if so, how?”
Following the deriving of individual case solutions, participants came together in 32 teams of either 4 or 5 individuals per team to provide a consensus, team-based recommendation. Each team was given approximately 45 minutes to discuss the issues presented in the case and generate a typed consensus recommendation representing the team’s case solution. A single participant in each team volunteered to record that summary by assuming the role of typist. Typing activities on the part of this participant could ensue at any point during the team process that a respective typist might choose. The purpose of producing a team-based case solution was to ensure that each team was focused on a common goal within the 45-minute time frame. As shown in the lower portion of Figure 1 (and described in the following), the qEEG of each team member for each respective team was independently acquired continuously throughout the 45-minute team process.

Participants during individual pretask and team problem-solving task.
qEEG Measure of Attention
Increased interest in using qEEG to study the neural patterns of human interactions (i.e., neuro-syncronicity) has resulted in equipment and software specifically designed to record high-quality qEEG through lightweight, portable (i.e., wireless) devices that can be applied effectively in team-based contexts (Johnson et al., 2011; Waldman et al., 2013). The equipment described in our following case example (see Figure 1) uses a wireless, sensor-laden headset that transmits brain electrical activity from an individual’s scalp to a qEEG acquisition system via Bluetooth technology, allowing neural data to be captured reliably and relatively unobtrusively. This qEEG equipment has been used in other experimental team-based protocols, including the study of submarine piloting and navigation teams, to show how teams cognitively organize around task changes (Stevens et al., 2012), brain fluctuations of participants in team-based health care simulation training (Stevens et al., 2016), and brain changes in high school students acquiring problem-solving skills (Stevens et al., 2009).
Neural measures, each derived from the simultaneous acquisition of multiple independent qEEGs, may offer uncommon insights to examine emergent processes in teams. For example, an individual’s ability to simply garner more “positive” neural attention from others when speaking over the duration of the team’s deliberation may be relevant to how team members are ultimately identified and endorsed by fellow team members. In our team problem-solving task, “positive” neural attention or arousal is based on the generation of excitement and enthusiasm that is produced when team members speak, as opposed to arousal due to factors such as fear or anger (Berka et al., 2004, 2005). As such, fellow members who are willing to allocate more positive neural attention (i.e., to a focal individual’s communication and reasoning) may be more likely to internalize that focal member’s goals and identify with their values and ideas to solve the ethical dilemma (DeRue & Ashford, 2010). In other words, team members who can garner others’ positive neural attention may be perceived as contributing more to solving the dilemma and facilitating members to achieve the team goal (Kozlowski & Bell, 2013).
Understandably, not all individuals can garner the same level of attention from others, and different teams may generate different levels of team attention, although they may be discussing the same case. Therefore, it is meaningful to examine how individuals garner attention from others and how attention changes within and between teams over time.
We utilized neuroscience technology to track team members’ positive neural attention levels as others in a respective team were verbally contributing to solve the ethical dilemma. That is, we used synchronous, real-time qEEG to assess each team members’ simultaneous positive neural attention levels as they considered the “utterances” of other participants throughout the problem-solving process. The qEEG system used in our study allows for independent, simultaneous qEEG profiles to be captured for each participant, including precise assessments of amplitude and frequency throughout the brain. As such, the system provides a highly sensitive and specific method for capturing neural responses in real time and in a format appropriate for post hoc analyses.
Specifically, this system uses nine electrodes affixed to the scalp of participants at specific predetermined locations (e.g., a subset of the International 10/20 standard for the placement of up to 20 electrodes) and acquired 256 assessments per second from those locations for the duration of the team exercise (Jasper, 1958). Indeed, only the brain activity captured from these nine locations is needed to derive the positive neural attention or arousal measure. The locations are shown with their International 10/20 labels in Figure 2, and they include frontal (F3, Fz, and F4), central or sensorimotor (C3, Cz, C4), and parietal (P3, POz, and P4) regions of the brain.

Map of the quantitative electroencephalogram channel locations: F3, Fz, F4 (frontal); C3, Cz, C4 (central); P3, POz, and P4 (parietal).
Our measure of neural attention was derived from the recorded qEEG data based on B-Alert software designed by Advanced Brain Monitoring, Inc. Technical details about the measure itself can be found in Appendix A. In the current study, to account for natural brain response intensity differences between participants, this neural measure of attention was normalized for each team member with respect to a 3-Choice Vigilance Task (i.e., 3-CVT) pretask (see the upper portion of Figure 1 for an example of participants performing the 3-CVT task; see Appendix A for more details about the normalization procedure). The normed, neural measure has been validated in a number of studies, which have demonstrated how it is associated with processes involving sustained attention or alertness to both auditory and visual stimuli (Berka et al., 2004, 2005; Westbrook et al., 2004) as well as individual differences in susceptibility to the effects of sleep deprivation (Berka et al., 2005). In an additional study, Berka et al. (2007) evaluated the current measure of neural attention by comparing it to a qEEG measure of workload in different tasks. The results of that study showed that the qEEG workload measure but not the qEEG attention measure increased linearly as level of task difficulty increased during problem-solving tasks. On the other hand, the qEEG attention measure but not the qEEG workload measure decreased during a 20-minute vigilance test because the subjects could not sustain attention over the relatively long, repetitive task. In sum, our study makes use of a normed, neural measure of attention (presented as a Z score) that allows for statistical manipulations and comparisons between- and within-subjects at different times during a task.
As mentioned previously, our neural measure of attention can be isolated in terms of specific time points in a team process. This attention measure can be assessed in an ongoing, episodic manner via neuroscientific devices with strong ecological validity and no disruption to ongoing team processes, all of which represent key advantages for dealing with the challenges that are inherent to emergence research (Kozlowski et al., 2013). Furthermore, we videotaped each team in time sync to the qEEG monitoring of individuals within the team. This procedure allowed us to align a respective member’s speaking utterances with fellow team-member responses to those utterances, including our measure of neural attention.
We specifically targeted and segregated the multiple occasions throughout the 45-minute team process during which each individual spoke. Thus, we focused on team members’ attention during different recorded utterances of each member from the beginning to the end of the team process. For an utterance to be included in our analyses, it had to be significant in terms of length (i.e., longer than 6 seconds) as well as distinctive, discernible (i.e., no one else on the team was speaking at the time), and case-related (rather than involving chitchat not related to the case). Using these criteria, two coders independently viewed the videos of the team discussions for the purpose of time-stamping utterances of respective team members, and they reached an initial 90% agreement level regarding the inclusion of speaking times for respective participants. They discussed the remaining cases and reached agreement for those participants. Following our criteria, our teams produced a total of 626 unique relevant utterances for analysis, each lasting on average 20.5 seconds. Individual participants provided between 2 and 5 relevant utterances each. To control for the varying duration of respective utterances, we generated an attention score for each utterance, taking into account the duration of that utterance (i.e., attention for each respective utterance divided by the duration of that utterance in seconds).
For the purpose of validation, we administered the Rich, LePine, and Crawford (2010) measure of engagement to each participant at the end of the 45-minute team process. As characterized by Rothbard (2001), engagement and attention are conceptually similar. Rich et al. considered engagement in terms of a combination of cognitive, affective, and physical components. As two examples of items for the affective component, we asked each participant to reflect on the team task and then rate the extent to which the participant “was enthusiastic” and “felt positive about the task” (Cronbach’s α = .87). Accordingly, it is clear that this measure taps into positive affect as individuals engage in the task. In line with Metiu and Rothbard (2013), we correlated the individual’s own neural attention (when speaking and listening to other team members across all utterances) with the Rich et al. measure of affective engagement. The relationship was .15, p < .05. We also aggregated the Rich et al. measure of affective engagement to the team level and correlated it with respective team averages of the neural measure of attention when team members were speaking across all speaking utterances. The relationship was .33 (p < .05). Together, these findings not only help to validate our neural measure of attention, but they also do so in a way that suggests its positive affective nature.
Emergent Processes
Multiple emergent processes pertaining to neural attention may emerge in a team context. As noted by Kozlowski et al. (2013), emergence is multilevel, process-oriented, and amplified through the interactions of team members over time. We examined three group emergent processes proposed by Lang, Bliese, and Adler (2019) that can describe how attention emerges over time, specifically when individuals are participating by speaking. First, we considered how group attention changes, that is, how the amount of neural attention in a team trends over time (Kozlowski & Klein, 2000). The direction of team-level attention may increase or decrease (Lang, Bliese, & de Voogt, 2018; Lang et al., 2019). For example, it is possible that members at the very beginning of team discussion are more engaged to learn other people’s perspectives and gradually pay less attention to each other’s utterances with diminishing returns thereafter, resulting in decreasing team attention. It is also possible that the team attention levels may grow as team members gradually understand the value of inputs from each other. Therefore, the trajectory of team attention can capture the team’s emergent process over time.
Second, how teams develop their attention over time is more involved than a simple increase or decrease in trend. That is, different teams may develop variability in their changing trajectories (indicated as slope variability in Lang et al., 2019). For example, some teams may start with uniform enthusiasm for the speaking contributions of individual members (i.e., as tapped by “positive” neural attention), and their overall team attention will increase at a slow speed but maintain at a relatively high level. However, other teams may start at a lower level of enthusiasm for the task at hand, but because of intensive discussions, their team attention emanating from individuals’ speaking contributions may have a steeper slope over time.
Third, in a team process, team members may develop more or less consensus of attention over time (Kozlowski et al., 2013). Various trends could occur. For example, it is possible that teams may start out with similar levels of attention based on initial contributions of team members, but over time, some members may remain focused when individuals speak while others reduce their attention. Conversely, teams could start out with varying levels of attention among members and gradually increase consensus in attention over time.
Furthermore, we included the total amount of speaking time for respective participants that was relevant to the team task (i.e., not chitchat), which was measured as the sum of all speaking time durations for respective participants. Speaking time on the part of individuals may influence how they influence attention over time, and thus, it was used as a predictor of the attention emergence process. By adding this person-level predictor, we can better address whether team members with more speaking time will garner more attention than do others and whether attention consensus among members is influenced by their speaking time. 1
Analysis and Findings
The correlation table of our data is in Table 1. In line with Lang et al. (2019), we used R (nlme package) to conduct the analysis (see Appendices B and C for equations and syntax, respectively). Specifically, we have multiple-level group data, with longitudinal observations at Level 1 (five times of attention scores mentioned previously), persons at Level 2, and teams at Level 3. We used the five steps recommended by Lang et al. (2018, 2019) to illustrate the attention emergent process (see Lang et al., 2019, p. 274, their Table 1). Step 1 generated the slope of group attention that describes how latent group attention means change over time. Step 2 generated the variability in slope change to examine how various groups develop attention trajectories differently. Step 3 captured the consensus or variance of attention in teams by adding the estimate of residual variance (standard deviation of the error term). Step 4 added the person-level predictor, speaking time duration, to see if it had an effect on group attention change. Step 5 illustrated the main effect of speaking time duration and examined the effect of duration on the residual variance change (consensus change).
Means, Standard Deviations, and Correlations Among Variables.

Note: T1 through T5 refer to speaking times 1 to 5 for each individual.
*p < .05. **p < .01 (two-tailed).
Findings
The results of whether adding the parameter at each step significantly improves the model fit is shown in Table 2. Step 1 revealed that overall, the amount of attention decreased across the groups (γ100 = −0.006, p < .001; change in groups’ latent means over speaking times; also see the estimate in Table 3). Results for Step 2 provided evidence of a significant amount of variance in the trajectory of garnered attention, υ11 = 0.0001 (slope variability, some groups develop extreme opinions or behaviors in one or the other direction over time), and including this parameter improved model fit significantly, χ2(1) = 22.87, p < .001 (Step 2a, Table 2). These findings suggest that some groups develop more extreme levels of attention than others. The addition of the covariance term (Step 2b) revealed that the covariance was positive and significant, υ01 = 0.0002, χ2(1) = 5.24, p = .022. Groups that started at a higher level of attention also remained at a higher level of attention over the course of the team process.
Model Comparisons.

Note: AIC = Akaike information criterion; BIC = Bayesian information criterion.
* p < .05, ** p < .01, *** p <.001 (two-tailed).
Parameter Estimates for Steps 3 and 5a in the Analyses of Attention Data.

* p < .05, ** p < .01, *** p <.001 (two-tailed).
The Step 2 analyses showed that the slope of teams’ attention change during team discussion process differed systematically among teams. Step 3 showed that the change in the residual variance (δ1; increase or decrease in consensus) was positive, with a value of 0.061 (see Table 3). A comparison of −2 log-likelihood values indicated that a model that included δ1 fit significantly better than a model that omitted this estimate, χ2(1) = 7.26, p = .007. The δ1 estimate was therefore significant at the 95% confidence level, which suggests that groups as a whole demonstrated discernible variance in their attention levels over time. The average personal level of garnered attention of individuals moved away from the latent means of their group, δ1 = 0.061; specifically, the residual variance changes from .002 to .0035 from speaking Time 1 to speaking Time 5. Team members’ attention toward others did not reach consensus over time. Instead, they developed more variance in their attention over time. Evidently, we uncovered a trend over time for some members to stay focused when their fellow members spoke, whereas others were not as attentive.
To better illustrate our change patterns, Figures 3 and 4 display emergent patterns from our data. Figure 3 shows the overall trajectory of attention across teams as well as differences (i.e., variability in trajectories) in three sample teams. Figure 4 shows how team members from the same team display increasing variability in garnered attention over the speaking times of their fellow teammates. It should be noted that our goal was to capture attention on the part of fellow team members during actual speaking times for individuals within a team. Accordingly, time is relative to individual team members in Figures 3 and 4. For example, “Time 1” is not a particular temporal point in a team process but rather reflects the first time when each individual within a respective team spoke up.

How mean levels of attention change over individuals’ speaking times across teams.

An example of how variance in a team’s attention changes (increases) over individuals’ speaking times. Note: We demonstrate this particular team with members each having five utterances of speaking times. However, not all team members from other teams have five speaking times. As mentioned earlier, individual participants in respective teams provided between two and five relevant utterances.
We further added total speaking time (i.e., duration) as a person-level predictor of attention. The model estimates in Table 3 (Model 2) indicate that duration was associated with the intercept but not with latent mean-level change. This indicates that people who speak longer can garner overall higher attention from others at the beginning of a team discussion (β01j = 0.0001, p = .03). Although this could be expected, our findings show that speaking time duration does not impact how attention changes over time (β11j = 0.00004, ns). Moreover, the model estimate for δ2 in Table 3 and the comparisons for Step 5 in Table 2 indicate that people with longer speaking times differ in the level of consensus in garnered attention on the part of teammates, χ2(1) = 70.58, p < .001, generally having more consensus in attention than people with less speaking time, with δ2 = −0.07. However, more speaking time did not accelerate the emergence of attention variance over time, as indicated by a nonsignificant interaction of duration with time, χ2(1) = 0.67, p = .41.
Discussion
Compared to more traditional techniques (e.g., surveys or observational coding), our neuroscience-based approach provides both a relatively unobtrusive and an ecologically valid method to assess fluid attention levels in teams (Ashkanasy et al., 2014; Smith & Gevins, 2005; Waldman et al., 2019). This approach to capture how attention emerges responds to a call by George, Haas, and Pentland (2014) to apply sensing technologies in management research. Specifically, George et al. described how such technologies could potentially be used to analyze “team behavior, using sensors…to track individuals as they work together,…or spend time interacting” (p. 235). George et al. suggested that such methods could be seen as an alternative to more traditional techniques (e.g., observation, surveys, etc.) to produce real-time data on team dynamics. The technology described here is representative of the type of sensory devices to which George et al. referred, which we used to pinpoint the occurrence of team member attention on a second-by-second basis without interrupting the team process.
In particular, we showed how attention emergence could be captured by different operationalizations of the neural attention that is garnered from fellow team members while a team member is speaking in a problem-solving task. First, in line with the notion that “much of the emergence literature centers on the idea of consensus” (Lang et al., 2018, p. 256), we showed how a trend of consensus in the amount of attention develops over speaking times and across teams. Second, attention when team members are speaking may be especially prominent early in a team process and then show a trend of diminishing returns over time. As such, there may be a first impressions effect, perhaps based somewhat on one’s expertise or suitability for understanding the nature of a team’s problem. Third, there is less consensus of attention toward other people over time. That is, some people may attract more attention than others when they speak, and the variance among attention increases over time. Furthermore, speaking time duration may play a role in shaping people’s level of garnered attention, but it does not impact how attention emerges in teams over time.
Further Development of Team-Based qEEG
A limitation of the qEEG headset in our study is that only nine electrodes were used, and thus, this equipment can only produce assessments of brain activity from regions where it is adequately detected. Although providing a reliable and valid measure of positive neural attention, it is limited in terms of examining cognitive and affective aspects of team members that are relative to brain activity in other regions. However, recent applications of 24-channel EEG can offer more flexible, accurate, and comprehensive assessments of “whole brain” activity. For example, researchers have taken a first step to develop an algorithm that can partially classify the neurophysiological aroused positive and negative affective states (Stikic et al., 2014). Correa et al. (2015) used 24-channel qEEG technology to assess emotional reactions (i.e., empathy, positive/negative affect) in real time to videotaped narratives or speeches.
Such methods could be used to better understand person-level effects on consensus change in teams (Lang et al., 2019). For example, it should be possible to utilize this approach to study emotions-related questions in a team setting as members react to each other in real time. Specifically, researchers may be able to track how team members influence each other’s emotions and develop emotional contagion or group affect tone over time (Lang et al., 2018; Tsai et al., 2012). Furthermore, 24-channel qEEG has been used to detect participants’ levels of cognitive workload such as fatigue, frustration, and attention (Myrden & Chau, 2016). Thus, researchers might build on this work to study how a shared mental model of team members may change over time within an ongoing team.
Overall, we see a number of advantages in the use of qEEG technology in teams and organizational research. Specifically, this technology is becoming more user-friendly, affordable, and practical for organizational research. The stereotypic image of a costly, immobile, and impractical device, such as those used in conjunction with functional MRI (fMRI), is giving way to less costly, easier to use devices, such as those associated with qEEG. Indeed, qEEG has evolved as an effective and much less costly means of incorporating neuroscience into an organizational research program. Furthermore, the portability of EEG equipment makes it possible to do assessment in either a lab or real-world setting. Moreover, researchers are finding that variables, such as the power spectral density measures used here, can be readily used in conjunction with the types of traditional variables and measurement approaches (e.g., surveys) with which organizational researchers are accustomed (e.g., Waldman et al., 2018; Waldman, Wang, et al., 2017).
With that said, we caution researchers about the potential use of qEEG technology. First, compared to fMRI, qEEG does not have the same spatial precision with regard to assessing brain activity. However, such precision may not be necessary in organizational research applications (Waldman et al., 2019; Waldman, Ward, & Becker, 2017). Second, we recognize that the EEG headsets shown in Figure 1 might appear to be somewhat uncomfortable, obtrusive, or distracting to individuals in a team who wear them. Indeed, in our experience in using this technology, after a few initial minutes of wearing the headsets, participants seemed to quickly ignore the headsets and pursue the problem at hand. Moreover, they reported little or no discomfort when wearing the headsets. However, we should note that even less obtrusive EEG devices are being produced (Goverdovsky et al., 2016). Bleichner and Debener (2017, p. 2) referred to one such technological approach as “transparent EEG,” which they defined as a “portable, motion-tolerant, self-applicable, highly unobtrusive, near invisible, and comfortable to wear EEG system” (p. 2). Their own system involves ear-based EEG sensors, although the ability of such systems to assess cognitive variables (e.g., attention) is not clear. We suggest future research to assess the potential usefulness of ear-based EEG sensors as well as participants’ reactions to alternative EEG systems, including the one featured here.
Furthermore, we caution against potential overspeculation of neural signatures based on qEEG. That is, there is the risk of using qEEG technology without understanding precisely what is being measured and whether or how electrical signals from the brain may be indicative of particular cognition or emotions. Thus, researchers need to be confident that there is sufficient evidence supporting their use and interpretation of qEEG-based measures.
Practical Guidelines for Organizational Researchers
As a practical issue, we recognize that it may seem like a daunting challenge for organizational researchers to “get into the game,” so to speak, with regard to the application of neuroscience theory and methods to their respective research programs. Accordingly, in Figure 5, we suggest an approach that can be used by organizational researchers to incorporate neuroscience theory and methods into their research programs, specifically with regard to qEEG. As a general strategy, we recommend that researchers think in terms of a team structure with specific tasks requiring different interests and types of expertise.

Organizational researcher approach to the incorporation of neuroscience.
First, neuroscience involves its own theoretical perspectives that need to be integrated with more traditional management and organizational theories. These perspectives are beginning to proliferate in a burgeoning organizational neuroscience literature, which can be seen in recent years in applied psychology and management journals (e.g., Dulebohn et al., 2016; Waldman et al., 2018; Waldman, Wang, et al., 2017). They are also evident in a range of neuroscience journals (e.g., NeuroImage, Frontiers in Human Neuroscience, Trends in Cognitive Sciences), although it may be necessary for organizational researchers to extrapolate to their own areas of interest. For example, Waldman, Wang, et al. (2017) were interested in understanding brain regions that might be particularly relevant to ethical leadership. Although direct neuroscience literature on this topic was limited, they could extrapolate from somewhat extensive literature and theory pertaining to neural networks associated with ethical reasoning and decision making.
Second, a research team will need to have expertise for hands-on applications of both hardware and software in the assessment of research participants. Relatedly, expertise would need to be developed to use qEEG-based software, such as NeuroGuide
It is obvious that specialized neuroscience expertise is essential for the incorporation of qEEG into an organizational research program. But how might such expertise be brought to bear in a research effort? One obvious possibility is that the expertise necessary to use qEEG-based equipment and data could be developed in-house on the part of an organizational research team. Practically speaking, time and other factors (e.g., researchers’ motivations) might negate this possibility. In line with prior advice put forth by Waldman, Ward, and Becker (2017), organizational researchers might attempt to partner with neuroscience experts. Waldman, Ward, and Becker recognized the difficulty in establishing such partnerships with neuroscientists in university settings (e.g., department “silos” within universities). However, it is also possible to form research collaborations with neuroscience experts in the private sector.
In addition, in line with the team roles literature (Belbin, 1981), a successful research team will need an individual who takes on a combination of people-oriented and thought-oriented roles. This “integrator” is a person who specializes in bringing together component knowledge from the various disciplines (e.g., organizational behavior, psychometrics, neuroscience) into a whole and ensuring that those concepts function effectively together. That person will need to understand the concepts and language of each discipline in enough detail to aggregate organizational and neuroscience theories and methods.
Finally, Figure 5 points toward budgetary considerations. As suggested earlier, the costs of using neuroscience technology in organizational research have shown a decreasing trend over time. Nevertheless, costs in this realm are likely to be greater than those with which organizational researchers are typically accustomed. With that said, funding from grants agencies and private sources appear to be increasingly available because of how neuroscience is seen as representing a new frontier for understanding individuals and teams in organizational settings.
In conclusion, we recognize that organizational neuroscience is still at a nascent stage of development. Regardless, we have demonstrated here that this burgeoning area may be applied to understanding emergent processes in teams. Our hope is that this demonstration will lead to further development and applications to the study of teams.
Appendix A: Technical Description of Neural Attention Measure
The steps taken during the electroencephalogram (EEG) signal-processing procedure to obtain neural attention scores are illustrated in the following flow diagram. The EEG signals were first filtered with a band-pass filter (0.5-65 Hz). Then the sharp notch filters at 50, 60, 100, and 120 Hz, which corresponded to the main frequencies (i.e., 50 Hz and 60 Hz) and the first harmonics (i.e., 100 Hz and 120 Hz) of the power network in the United States and Europe/Asia, respectively, were applied to decontaminate environmental artifacts from the power network.

Artifact that is introduced by naturally occurring head, jaw, and eye movement can potentially prohibit the type of equipment featured in Figure 1 from being used to accurately examine team processes or emergent properties, such as attention. However, with the Advanced Brain Monitoring, B-Alert software used in the current study, an artifact rejection algorithm (see Berka et al. 2004) that applies signal-processing analyses and “wavelet transformation” eliminated nearly all artifact in real time without affecting the desired brain signals.
As shown in the Appendix A figure, the quantitative EEG (qEEG) signal is typically transformed from the time domain to the frequency domain by first applying fast Fourier transformation (Cooley & Tukey, 1965), and then power spectral density (PSD) is calculated that assesses how the signal power is distributed over the different frequencies. In our study, the absolute PSD values as well as relative PSD values (described further in the following) of the decontaminated qEEG signal were extracted on a second-by-second basis for frequencies up to 40 Hz with 1 Hz resolution. The higher frequencies were not included in the analysis to minimize potential excessive muscle activity artifact. The calculated PSD values were transformed to a logarithmic scale to resemble the normal distribution, and their range was between 1.7 and 4.1 in the current study.
From these PSD values, our measure of neural attention was derived. The measure utilizes PSD variables that are shown as “Absolute Attention” and “Relative Attention” (explained further in the following) in the following table. These variables are along the midline FzPOz and CzPOz regions of the brain (shown as “Channel” in the table) and at precise frequencies (referred to as “Hz bins” in the table), specifically a combination of PSD variables at locations and frequencies derived through discriminant function analysis (designated at DFA in the previous figure) in previous studies. 4 Differential FzPOz and CzPOz amalgamations are calculated by subtracting the corresponding referential qEEG values (i.e., FzPOZ = Fz – POz and CzPOz = Cz – POz). The variables in the Appendix table have shown to be the most discriminative of participants’ alertness or attention by Johnson et al. (2011).

Beyond the artifact issue mentioned previously, an additional problem in qEEG-based assessments of attention is that algorithms may not account for individual variability, thus leading to a major potential for confounds. That is, although the neural network of attention is well known in the neuroscience literature, the physiological (electrical) response to stimuli in that region is unique to each individual (Johnson et al., 2011). Fortunately, even though the neural attention pattern is different between individuals for a given stimulus, the response pattern to that stimulus within an individual is relatively stable and representative of a specific level of neural attention (Johnson et al., 2011).
As shown in the Appendix figure, to deal with this issue in our study, we controlled for individual variations to obtain relative attention scores by conducting a “three-choice vigilance task” (i.e., 3-CVT) pretask. This task was conducted prior to team-level assessment. Specifically, we used the individual profiles to normalize subsequent qEEG data (Stikic et al., 2011). As depicted in the top portion of Figure 2, the 3-CVT involves a sustained attention activity whereby participants individually discriminate one primary target (presented 70% of the time) from two secondary, nontarget geometric shapes that are randomly interspersed over a 20-minute period. By classifying the ongoing, kinetic performance (e.g., delay in response, error ratio over time, etc.) to this very repetitive yet concentration-demanding activity, an individualized profile (i.e., derived from the variables shown in the Appendix table) is identified that represents different levels of individual neural attention. During the initial development phase of the attention measure, the 3-CVT task was selected among a number of different tasks as the best representative of high attention (Berka et al., 2007).
The 3-CVT task was presented to each individual team member prior to the team task, and the quality of the data was evaluated by checking the number of missed events or too slow reaction times as well as percentage of data that were classified as high attention during the pretask. The data were of good quality and were thus used to calibrate (i.e., normalize) subsequent neural attention scores on an individual basis by Z scoring the qEEG-based attention during the team task with respect to the participant’s known attention profile (i.e., its mean and standard deviation value) during the reference, 3-CVT pretask. The Z scores are obtained by subtracting the mean attention during the 3-CVT pretask from attention during the team task and then dividing the difference by the standard deviation of attention during the 3-CVT pretask. Thus, a respective Z score indicates whether attention is above or below its pretask mean value.
To illustrate this normalization procedure, we provide example calculations for one of the participants in the current study. His average attention score during the 3-CVT pretask was 0.81, and his standard deviation was 0.28. At a point during the beginning of team discussion, his attention score was 0.36. Thus, his normalized attention score at that point was negative: (0.36 – 0.81) / 0.28 = –1.61. On the other hand, at a later point during the team discussion, his attention score was increased to 0.87. At that time, his normalized attention score was positive: (0.87 – 0.81) / 0.28 = 0.21.
Appendix B: Equations
Model 1 specification (Lang et al., 2019, p. 273)
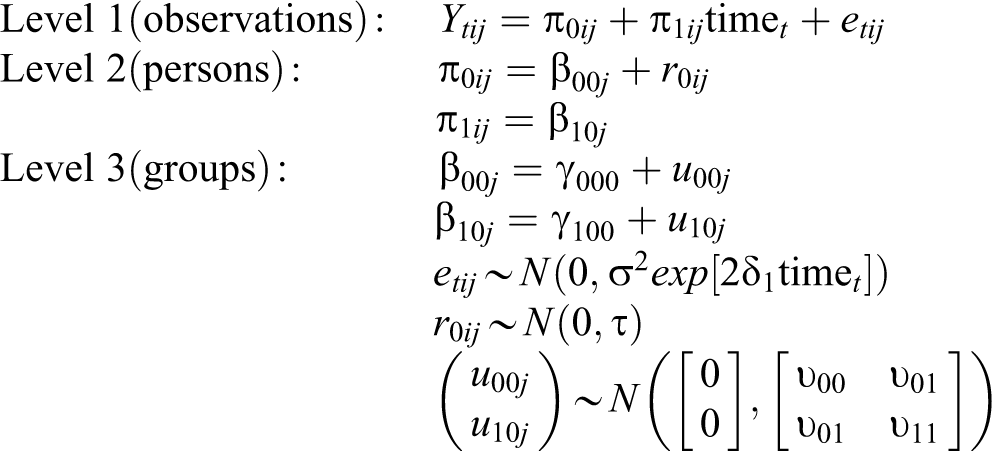
Model 2 with person-level predictor (Lang et al., 2019, pp. 279-280)

Appendix C: Syntax in R based on Lang et al. (2019, pp. 284-285)
Footnotes
Acknowledgments
We acknowledge comments from John Antonakis and Mark van Vugt on an earlier version of this article, and the support by an internal grant of ESADE Business School for the project “The Neuroscience of Leadership.” We also thank Zhen Zhang and Jia (Joya) Yu for providing guidance on the statistical modeling. Maja Stikic did most of the work when she was at Advanced Brain Monitoring.
Declaration of Conflicting Interests
The author(s) declared no potential conflicts of interest with respect to the research, authorship, and/or publication of this article.
Funding
The author(s) disclosed receipt of the following financial support for the research, authorship, and/or publication of this article: We acknowledge financial support by an internal grant of ESADE Business School for the project, “The Neuroscience of Leadership.”