
Abstract
Although the use of ideal point item response theory (IRT) models for organizational research has increased over the last decade, the assessment of construct dimensionality of ideal point scales has been overlooked in previous research. In this study, we developed and evaluated dimensionality assessment methods for an ideal point IRT model under the Bayesian framework. We applied the posterior predictive model checking (PPMC) approach to the most widely used ideal point IRT model, the generalized graded unfolding model (GGUM). We conducted a Monte Carlo simulation to compare the performance of item pair discrepancy statistics and to evaluate the Type I error and power rates of the methods. The simulation results indicated that the Bayesian dimensionality detection method controlled Type I errors reasonably well across the conditions. In addition, the proposed method showed better performance than existing methods, yielding acceptable power when 20% of the items were generated from the secondary dimension. Organizational implications and limitations of the study are further discussed.
Keywords
In industrial-organizational psychology, there has been growing interest in measuring noncognitive constructs, such as attitude, personality, emotional intelligence, and vocational interests, which aim to predict valued employee outcomes, such as training performance (Barrick et al., 2001; Schmidt & Hunter, 1998), adaptive performance (Huang et al., 2014), motivation (Judge & Ilies, 2002), and overall job performance (Barrick et al., 2001; Judge et al., 2013). Researchers also have shown that noncognitive constructs reduce the adverse impacts typically associated with measures of cognitive ability (Hough et al., 2001; Ployhart & Holtz, 2008).
To construct reliable and valid noncognitive measures and evaluate their quality, an item response theory (IRT) methodology has been widely utilized. Based on item response process assumptions, researchers have developed and implemented two types of IRT models: dominance and ideal point. Dominance IRT models assume that the item response probability monotonically increases as an examinee's latent trait increases. This assumption is well accepted in cognitive and noncognitive assessments where examinees’ maximum performance and abilities are measured. Ideal point IRT models assume nonmonotonic item response probability, where an examinee endorses or agrees with an item only if the examinee's latent trait is close to the location of the item. Ideal point models have recently gained attraction in organizational research because some research suggested that the ideal point models characterize the examinee's endorsement process better than dominance models for measures that require introspection and self-reflection (Drasgow et al., 2010; Nye et al., 2020).
Although the use of ideal point models for organizational research has increased over the last decade (Foster et al., 2017), the assessment of construct dimensionality of ideal point scales has been overlooked in previous research. For example, researchers presumably applied conventional methods for assessing dimensionality developed based on the dominance response process to ideal point scales. However, this approach may not be appropriate, because it could result in an artificial scale dimension from ideal point scales (Davison, 1977; Tay & Drasgow, 2012a). Furthermore, the dimensionality assessment methods for ideal point scales have not been systematically evaluated. Only a few studies attempted to develop and evaluate the methods under various conditions, but the techniques require manual statistical programming and intensive computation (Carter & Zickar, 2011). User-friendly software for assessing the dimensionality of ideal point scales is also not readily available for organizational researchers.
In principle, an evaluation of dimensionality is a prerequisite for constructing a scale, because the reliability and validity of measures are heavily dependent on the construct dimensionality of the scales. Therefore, we aim to develop appropriate dimensionality assessment methods for ideal point scales and examine the efficacy of the methods under various conditions via a Monte Carlo simulation. In addition, we show the feasibility of the developed dimensionality assessment methods using an empirical example and demonstrate the procedure for assessing the dimensionality of ideal point scales.
Ideal Point Modeling in Organizational Research
Ideal point IRT models have been used in many organizational studies (Foster et al., 2017; Nye et al., 2020). Ideal point IRT modeling has several advantages for addressing important issues. For example, ideal point models are flexible for measuring a wide range of latent traits, including positive (or negative) and intermediate items. Intermediate items, especially, have shown several advantages for noncognitive assessment in organizational settings because these items provide more information for examinees who have moderate latent traits and increase the reliability of the scores (Chernyshenko et al., 2007; LaPalme et al., 2018). Intermediate items refer to statements designed to measure a neutral value on the construct latent trait continuum (Drasgow et al., 2010). An example of intermediate item on the extraversion scale in a personality assessment is “I don’t mind attending social events”. This item could be endorsed by moderate-level introverts and extraverts because the statement does not explicitly describe the extreme extraversion trait, and moderate-level examinees would perceive the statement as describing themselves accurately (Stark et al., 2006). Intermediate items are generally known to be less discriminating and have lower scale reliability under the dominance modeling framework. However, with ideal point modeling, intermediate items can be analyzed with high reliability and better model fit (Cao et al., 2015).
Moreover, intermediate items have been proven to be more fake-resistant than extreme positive or negative items (Liu & Zhang, 2020; Zhang et al., 2020). In organizational settings, faking has been a major issue: Researchers have debated whether it occurs and whether it matters (Birkeland et al., 2006; Donovan et al., 2014). Faking is defined as examinees’ attempt to distort their latent traits to be more favorably perceived (Kuncel & Borneman, 2007). Although there are mixed results in the literature (Ellingson et al., 2007), faking responses generally have negative impacts on the psychometric properties of scales, rank order in personnel selection, and the overall utility of noncognitive measures (Birkeland et al., 2006; Mueller-Hanson et al., 2003; Rosse et al., 1998). Several methods have been suggested for preventing faking in high-stakes settings, and researchers have found that including intermediate items can effectively prevent faking (Liu & Zhang, 2020; O'Brien & LaHuis, 2011; Scherbaum et al., 2013; Zhang et al., 2020). For example, Harris et al. (2021) empirically showed that motivated test takers (i.e., the faking condition) perceived intermediate items were more difficult to respond to in the “socially desirable” way than dominance items (i.e., positive or negative items). In accordance with these advantages, several empirical and simulation studies utilized ideal point models and showed the benefits of ideal point modeling for noncognitive assessments (Cao et al., 2015; Carter & Dalal, 2010; Drasgow et al., 2010; LaPalme et al., 2018; Stark et al., 2006; Tay et al., 2009).
Generalized Graded Unfolding Model
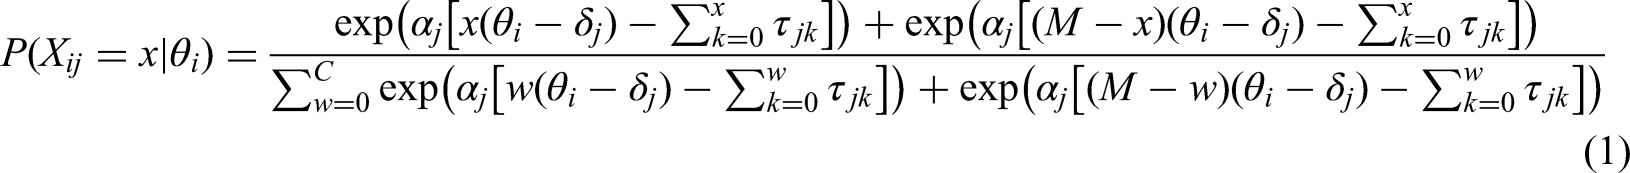
In applied settings, the generalized graded unfolding model (GGUM; Roberts et al., 2000, 2002) is the most widely used ideal point IRT model because the model is flexible enough to fit dichotomous and polytomous responses, and user-friendly software, GGUM2004 (Roberts et al., 2006), is publicly available. To describe the generalized formulation of the GGUM, let
Practical Issues with Ideal Point Scale Dimensionality
One of the major assumptions for a construct assessment is the unidimensionality of the scale. Violation of the assumption can substantially distort the reliability and the validity of scales and decrease the precision of parameter estimation, resulting in substantial bias and measurement error in the model. Conventional dimensionality assessment methods, such as factor analysis (FA) or principal component analysis (PCA), have been considered in organizational settings; however, these methods might not be appropriate for ideal point scales because the conventional methods assume a linear, monotonically increasing relationship between latent traits and the response probability (Carter & Zickar, 2011; Tay & Drasgow, 2012a). Previous literature has discussed the inappropriateness of conventional dimensionality assessment methods for ideal point scales due to the unfolding/nonmonotonic nature (Davison, 1977; Maraun & Rossi, 2001; van Schuur & Kiers, 1994). For example, it has been shown that when unidimensional ideal point scales are analyzed with conventional dimensionality assessment methods that inherently assume the dominance response process, an additional factor can be yielded (Spector et al., 1997; Tay & Drasgow, 2012a).
To illustrate how conventional methods could mislead the dimensionality assessment results for ideal point scales (also according to the suggestion of an anonymous reviewer), two unidimensional data based on dominance and ideal point processes were generated. The dominance data were generated using the two-parameter logistic (2PL) model, and the ideal point data were generated using the GGUM 1 . The data included 20 items and 1,000 examinees. PCA was applied to the data, and scree plots were created using the principal components. Figure 1 shows the scree plot results for unidimensional dominance and ideal point data. The figure clearly shows that for the dominance data, one strong factor was found and explained more than 25% of the total variance. In contrast, for the ideal point data, two major principal components were found, and both explained more than 10% of the total variance. This illustration emphasizes previous research where an additional artificial factor can be found in dimensionality assessment with ideal point scales. Tay and Drasgow (2012a), for example, showed that when scales are constructed to measure positive and negative traits on the same latent trait continuum, the midpoint-level items are endorsed by positive and negative trait responders. Thus, these midpoint-level items are categorized into the latent variable that is distinct from the positivity-to-negativity dimension. Figure 2 further illustrates the PCA results for multidimensional data. Similarly, multidimensional data were generated based on the assumption of dominance and ideal point processes, and 40% of the total items were generated from the secondary dimension, which correlates the primary dimension with .40. As shown in Figure 2, two factors were detected with PCA from the dominance data, whereas three factors were detected from the ideal point data. Specifically, it was more challenging to identify the distinct factors for ideal point data because the remaining principal components still explained a large proportion of the total variance. This illustration highlights that conventional dimensionality assessment methods not only fail to detect the secondary construct dimension but also could lead to a misinterpretation of the dimensionality assessment for ideal point data.
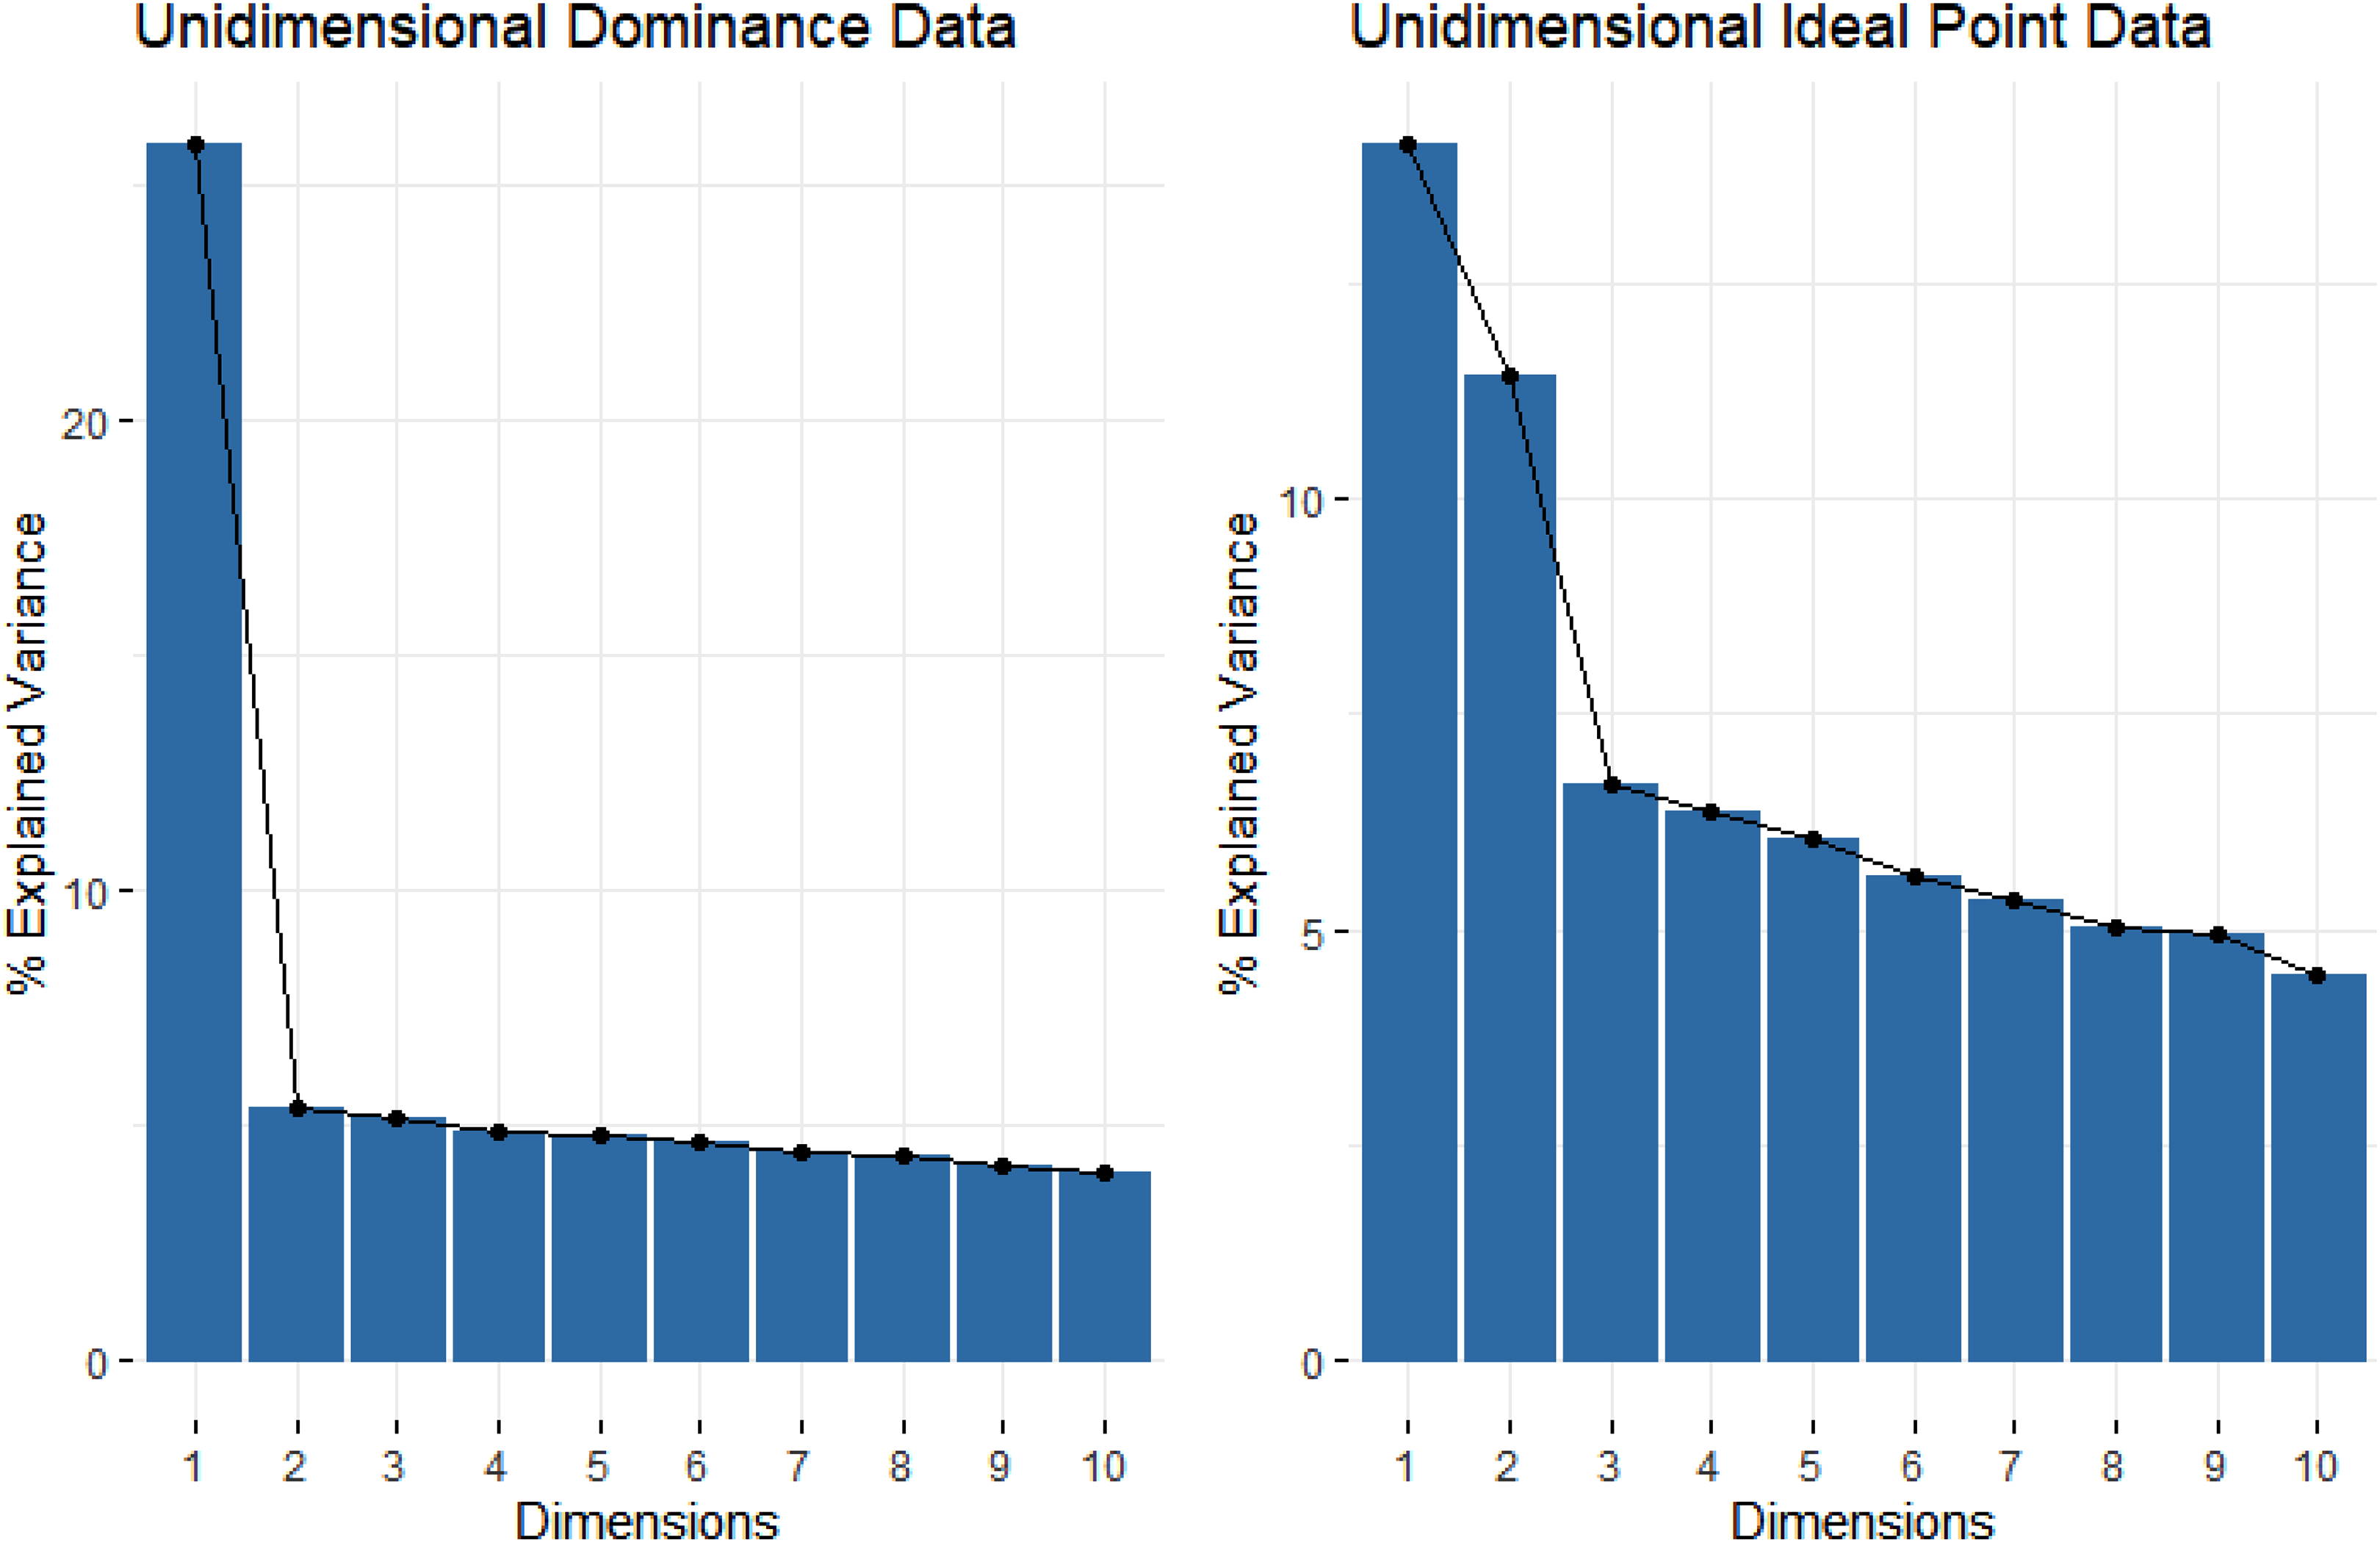
Scree plots from principal component analysis (PCA) for unidimensional dominance and ideal point data.
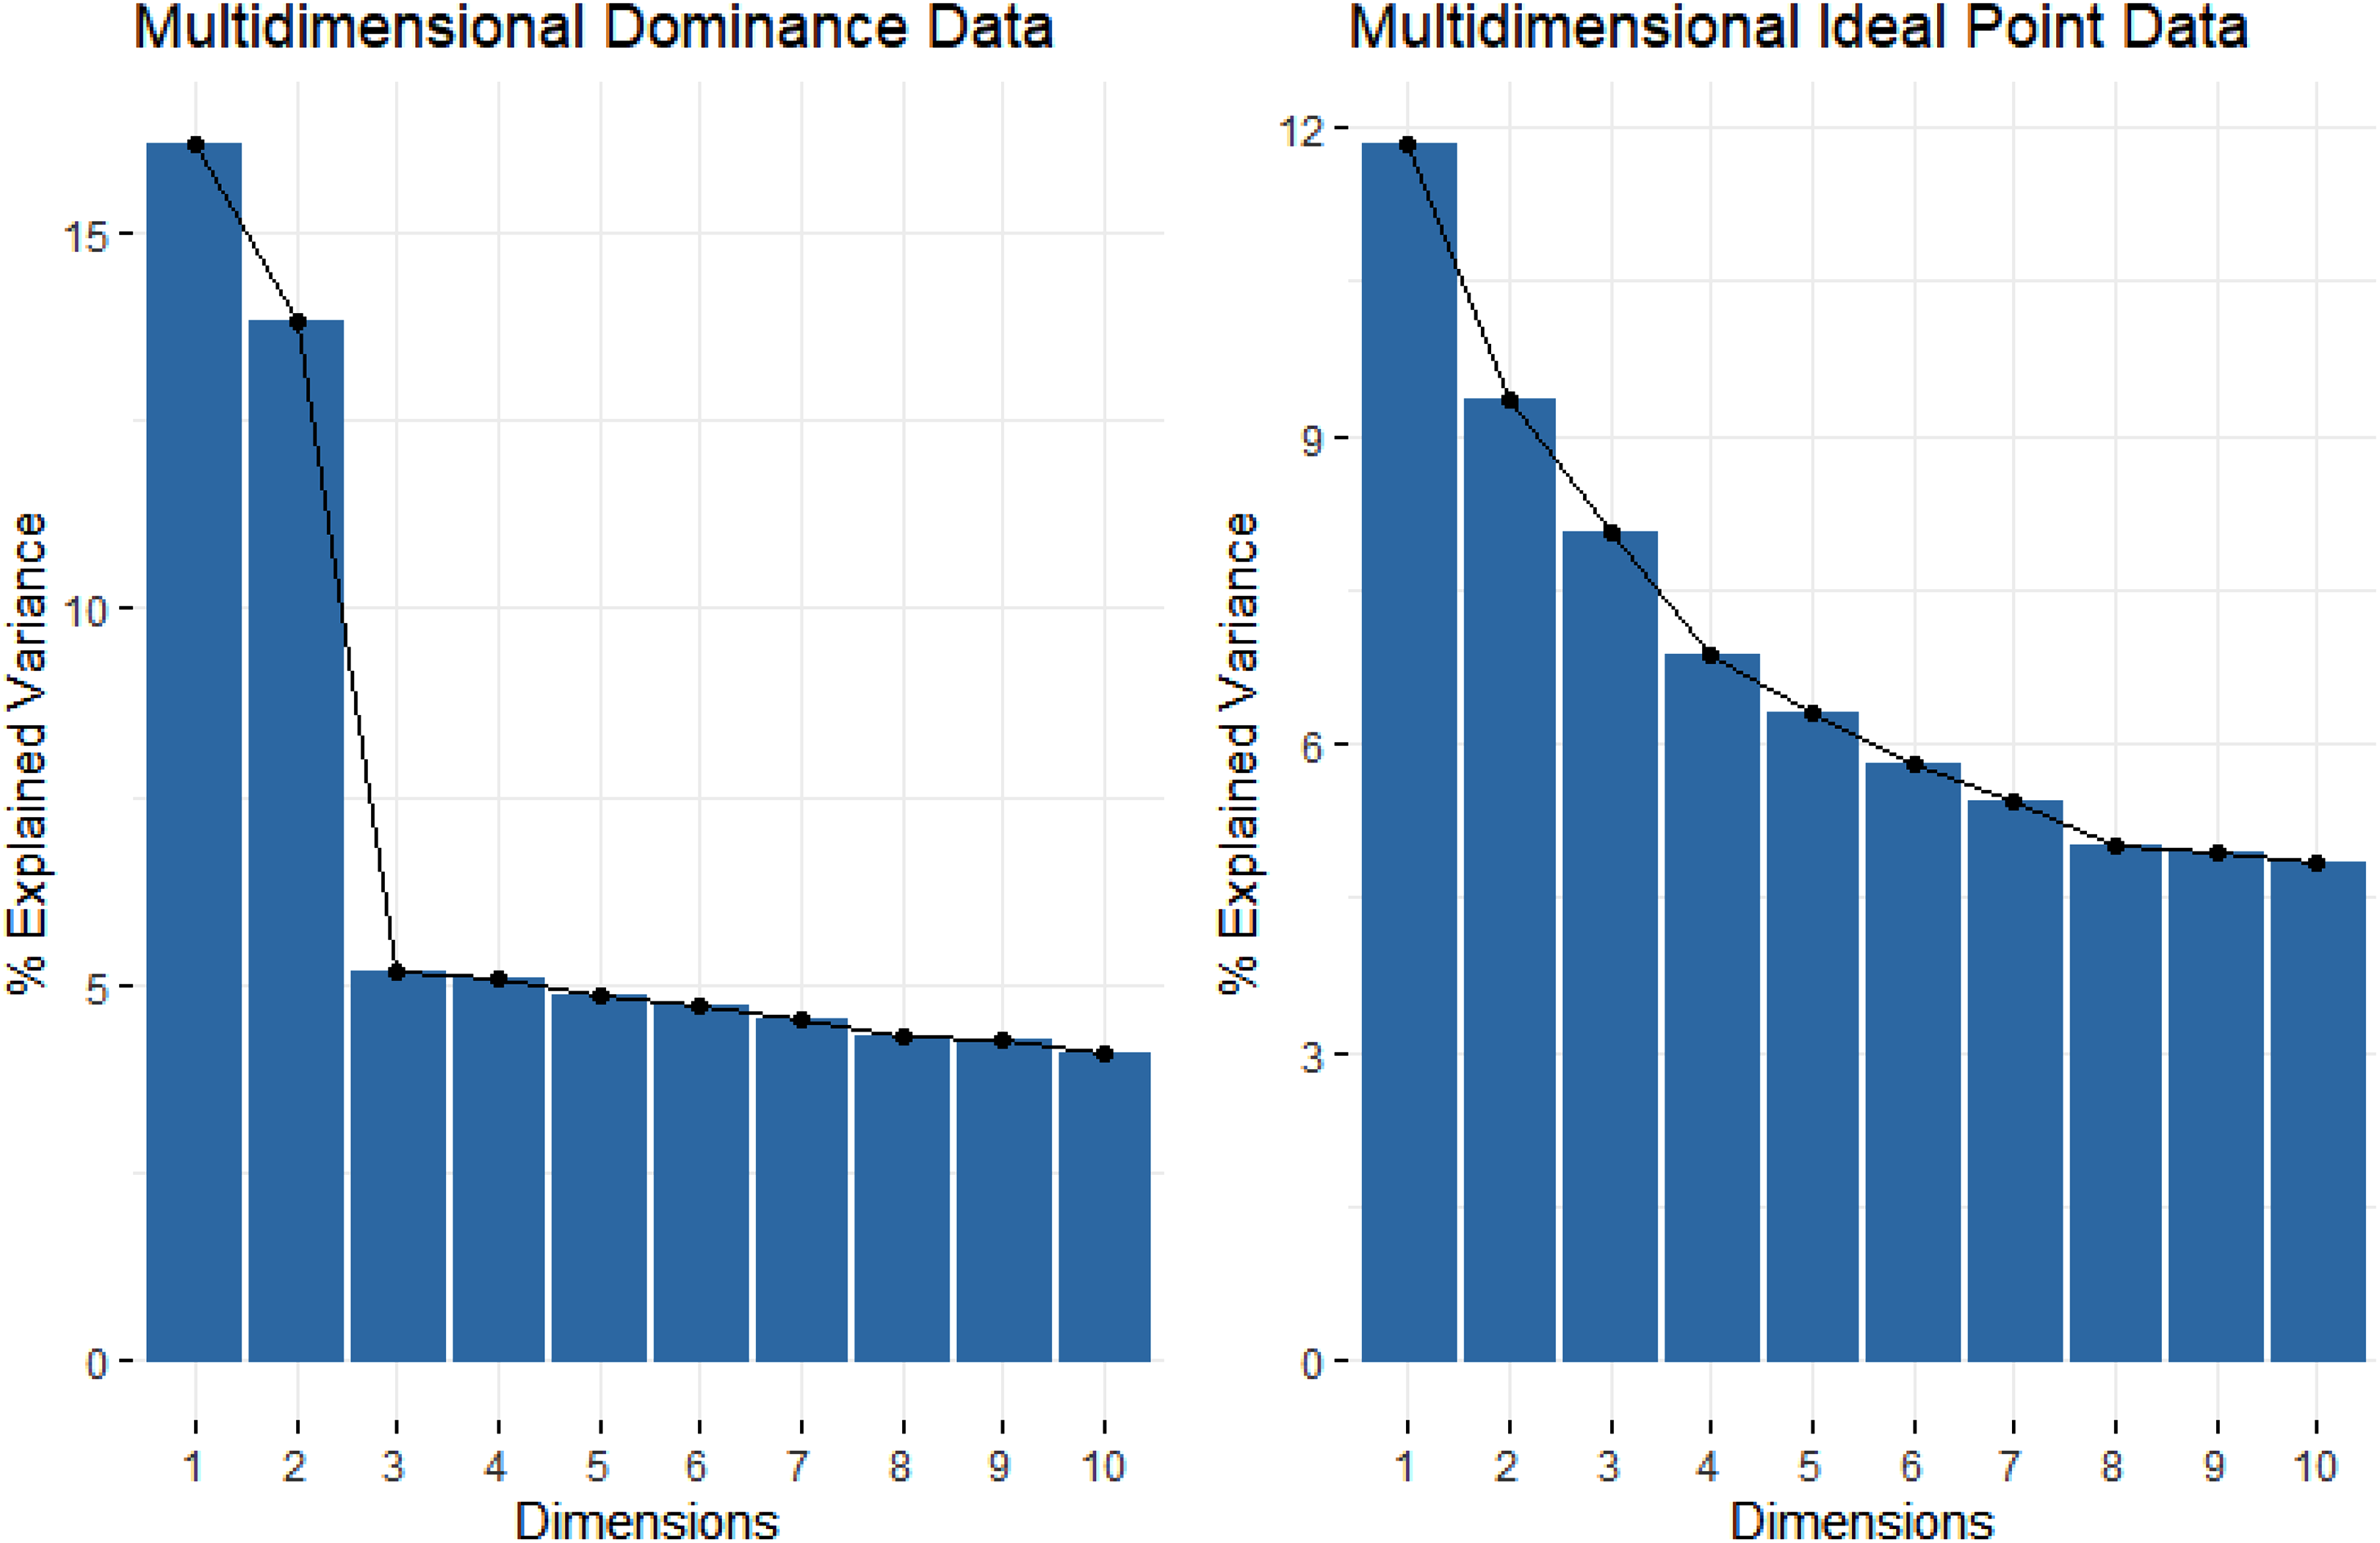
Scree plots from principal component analysis (PCA) for multidimensional dominance and ideal point data.
Another example of the misuse of dimensionality assessment for ideal point scales is related to attitude assessment. Specifically, misinterpretation of ideal point dimensionality may have amplified the controversy between the bipolar model and the bivariate model in attitude assessment. After Thurstone (1928) first conceptualized that attitude can be measured, the attitude dimension was well understood with the bipolarity structure (e.g., sadness to happiness, conservative to liberal, and evil to good). However, researchers argued that the bipolarity structure of attitudes assumes a reciprocal relationship between positive and negative traits (i.e., mutually exclusive) and does not explicitly explain attitudinal ambivalence (Cacioppo & Berntson, 1994). Ambivalence occurs when an examinee makes positive and negative evaluations of an attitude object; thus, the examinee tends to agree on two opposite attitude statements (McGrane, 2019). One of the reasons researchers advocated the bivariate model is that ambivalence can be explained by imposing an additional dimension. Researchers provided psychometric evidence that supports the bivariate model with studies in which an additional dimension was found with the factor analytic approach (Cacioppo et al., 1997). However, given that studies showed attitudes can be better explained using the ideal point model (Andrich & Styles, 1998), dimensionality assessment based on the dominance assumption, such as FA, could have led to the misinterpretation of ideal point scale dimensionality. The additional dimension triggered by conventional methods may not appropriately explain attitudinal ambivalence but was created artificially. Recent studies also have shown that coendorsement of positive and negative statements can better be explained by the bipolarity structure of attitudes using the unidimensional ideal point model, especially for problems associated with the dimensional structure of affect (Tay & Kuykendall, 2017) and the construct continuum specification (Tay & Jebb, 2018). However, we carefully note that the goal of the present study is not to convince readers of the bipolarity structure of attitudes but rather focus on the methodological issue of ideal point scale dimensionality in the context of organizational research.
Assessment of Ideal Point Scale Dimensionality
Although the conventional methods were mainly developed based on the dominance assumption, several studies attempted to develop dimensionality assessment methods for ideal point scales. Habing et al. (2005), for example, previously investigated the performance of Q3 statistics (Yen, 1984) and proposed a modified version of the Q3 statistic for the GGUM. The modified Q3 statistic corrects the direction of residuals for extreme items (i.e., high or low location items) that could produce the opposite sign due to the nonmonotonicity of the GGUM. The simulation results indicated that the modified Q3 statistic controls Type I error and produces high power to detect the violation of unidimensionality when extreme location items are used. However, the performance of the modified Q3 statistic is still in question for nonextreme items because of the bias in the modified Q3 statistic (Habing et al., 2005). In addition, Carter and Zickar (2011) investigated the impact of a violation of unidimensionality with the GGUM and showed that item and latent trait parameters are severely biased if the scale includes secondary dimension items. Wang and Wu (2016) also developed a confirmatory multidimensional GGUM and showed the efficacy of the model. However, previous studies mainly focused on the impact of the violation of unidimensionality and the development of a confirmatory multidimensional model, and a method for assessing dimensionality with the GGUM is still in its infancy. Habing et al.’s (2005) study was limited to Q3 statistics, and the results were not favorable for intermediate-level items. Many statistics other than Q3 are also available for dimensionality assessment, and it would be useful for organizational researchers if more than one-dimensionality assessment method were developed and compared for various contexts. Tay and Drasgow also emphasized that “we need to develop models of nonlinear factor analysis that go beyond common link functions (e.g., log, logit, or inverse) to take into account the unfolding relationship between indicators and the latent variable” (2012a, p. 380).
To achieve this goal, in the present study, we developed dimensionality assessment methods for the GGUM under the Bayesian framework. Specifically, we adapted the posterior predictive model checking (PPMC) procedure to assess the unidimensionality of the GGUM scale. In the next section, we present the PPMC method and its discrepancy statistics, and describe the design, procedure, and analysis methods of the simulation study.
Posterior Predictive Model Checking
The PPMC method (Gelman et al., 1996) was originally developed to evaluate model fit by computing the discrepancy between observed data and the fitted model using the posterior predictive distribution. The posterior predictive distribution refers to the predictive distribution of replicated data conditional on the observed data (Sinharay et al., 2006). If the observed data fit the model, the replicated data generated under the model should look similar to the observed data (Gelman et al., 1996).
One of the advantages of the PPMC method is that any type of conventional statistic can be used to evaluate the discrepancy between the observed data and the model. Specifically, using the selected discrepancy statistic D, one can conduct a specific diagnostic analysis with the observed data (Berkhof et al., 2004; Levy et al., 2009). For example, item pair statistics, such as Q3 or the odds ratio (OR), can be implemented as discrepancy statistics to assess the unidimensionality of the scale because they are sensitive in detecting multidimensionality and local dependence among items (Chen & Thissen, 1997). Furthermore, researchers can make statistical inferences about population parameters by computing posterior predictive p-values (PPP). A PPP value closer to .5 indicates the observed data fit the model adequately, and a value closer to 0 or 1 indicates the model does not fit the observed data adequately. To implement the feature of p-value in classical hypothesis testing, it has been suggested using
Based on previous studies (Drasgow et al., 1995; Habing et al., 2005; Levy et al., 2009; Nye et al., 2020), we chose the following discrepancy statistics to assess the scale dimensionality of the GGUM: chi-squares
We considered the two types of chi-square statistics
In this study, we also considered the OR, COV, and MBC as the discrepancy statistics. Previous studies with the PPMC method found that the OR is effective for detecting model-data misfit induced by local dependencies among item pairs (Sinharay et al., 2006). The OR produces high power to detect item misfit under the PPMC framework. One advantage of using the OR statistic and the COV matrix as discrepancy statistics for PPMC is that they do not require item parameter estimates for computing PPP. This implies that the statistical inference with the OR and the COV matrix would be consistent regardless of the accuracy of the item parameter estimates.
In addition, the COV and MBC matrices are useful statistics for detecting multidimensionality by computing the association among item pairs. The two approaches differ in how they compute the expected frequency. The COV matrix computes the expected frequency from the mean of the observed response counts. The MBC matrix, however, computes the expected frequency based on the fitted model using Equation 1. This difference plays an important role in the ideal point IRT model. Habing et al. (2005) have discussed that dimensionality assessment methods which use the conditional covariance matrix (e.g., DIMTEST) may not be appropriate for the ideal point model because the procedure assumes a monotonic relationship between the latent trait and the item response (Stout, 1990; Zhang & Stout, 1999). The conditional covariance matrix may distort the measure of item pair association for intermediate items because the mean of the observed response counts does not properly reflect the expected frequency. To address this issue, we incorporated the MBC matrix where the expected frequency can be computed directly from the fitted model.
Finally, we included Q3 as the discrepancy statistic in this study. Q3 is a widely used statistic for assessing dimensionality under the classical statistic framework. One criticism of the Q3 statistic is that there is no proper sampling distribution for making statistical inferences. Yen (1984) suggested using Fisher's z-transformation because the Q3 statistic with the z-transformation asymptotically follows the standard normal distribution if the model is correct. However, Chen and Thissen (1997) provided empirical evidence that Q3 with the z-transformation does not approximate the standard normal distribution, especially in the tail probabilities, and Type I errors inflate when the sample size increases. However, the lack of a sampling distribution for Q3 can also be overcome with PPMC by empirically constructing the posterior predictive distribution (Sinharay et al., 2006).
Methods
Simulation Design
To evaluate the performance of PPMC dimensionality assessment methods for the GGUM, we conducted a Monte Carlo simulation study. We included various simulation designs by manipulating the data-generating conditions: (a) sample size (500, 1,000, and 2,000), (b) test length (10 and 20), (c) dimensional correlation (0, 0.3, and 0.6), (d) range of discrimination parameter (low, medium, and high), and (e) proportion of multidimensionality (20% and 40%). A total of 3 × 2 × 3 × 3 × 2 = 108 simulation conditions were considered, and for each condition, 50 replicated data were generated 2 . We fixed the response scale as dichotomous in this study. The rationale for the specific values in each condition is described as follows.
Sample Size and Test Length
The sample size was varied across 500, 1,000, and 2,000, and the test length was varied from 10 to 20 items. The smallest sample size was 500 because previous studies have shown that item parameters of the GGUM are accurately estimated as low as 500. With the Bayesian Markov chain Monte Carlo (MCMC) estimation method, previous simulation studies reported that a sample size of 400 can produce minimal bias for item parameter estimates of the GGUM (de la Torre et al., 2006; Joo et al., 2017; Roberts & Thompson, 2011). Given that the accuracy of item parameter estimation improves as the sample size increases, we expect that the efficacy of the PPMC dimensionality assessment methods would be most apparent in large sample size conditions. We also varied the number of items on a test from 10 to 20. In practical settings, many noncognitive tests are relatively short, and typical measures developed with the GGUM have test lengths ranging from 10 to 20 (Roberts et al., 1999; Tay & Drasgow, 2012a, 2012b). We believe the range of the sample size and the test length considered in this study is commonly observed in practice, and the simulation results can be generalized to applied settings.
Dimensional Correlation
To investigate the impact of the dimensional correlation of the multidimensional latent trait structure, we varied the dimensional correlations from 0 to .3 and .6. Levy et al. (2009) illustrated that the dimensional correlation has a significant impact on dimensionality assessment, and the increasing dimensional correlation tends to diminish the effect of multidimensionality. This is especially true if the multidimensional scales are created with secondary dimension items in addition to primary dimension items. Previous studies (Carter & Zickar, 2011; Habing et al., 2005) also empirically supported that increasing the dimensional correlation of the latent trait structure substantially decreases the impact of multidimensionality. For example, Carter and Zickar (2011) showed that the bias of the GGUM item and latent trait parameters decreased considerably as the dimensional correlation increased from 0 to 0.9. They also found that the parameter estimation results in the correlation of the 0.9 conditions were similar to those for unidimensional scales. Based on these results, we expect that the power to detect the violation of unidimensionality improves as the dimensional correlation decreases.
Discrimination Parameters
We varied the range of discrimination parameters in the simulation design from low to medium and high. For each of the three conditions, the alpha parameters of the GGUM (i.e., the discrimination parameters) were randomly drawn from U(0.5, 1), U(1, 1.5), and U(1.5, 2), respectively, for each replication. The values in the uniform distributions were selected based on empirical GGUM studies (Cao et al., 2015; Carter & Dalal, 2010; Tay & Ng, 2018). Note that items with high discrimination parameters produce latent trait parameters that are more accurate and have lower measurement errors. Similarly, it is expected that multidimensional scales with high discrimination parameters have a higher impact than multidimensional scales with low discrimination parameters. Zhang and Stout (1999) and Levy et al. (2009) discussed that increasing discrimination parameter values leads to an increase in the magnitude of the conditional COV structure. We expect that increasing discrimination parameters will increase the detection rate of the dimensionality assessment methods.
Proportion of Multidimensionality
We also varied the proportion of the items exhibiting multidimensionality from 20% to 40%. Based on previous studies (Carter & Zickar, 2011; Levy et al., 2009), the proportion of the secondary dimension items affects the detection rate considerably. When the number of secondary dimension items is relatively small, the latent trait vectors from two dimensions are highly distinguishable, and the angle between two vectors becomes large. In contrast, as the number of secondary dimension items increases, the distinction (i.e., angle) between two latent trait vectors diminishes (Levy et al., 2009; Zhang & Stout, 1999). As a result, the Type I error rate (i.e., falsely detecting multidimensionality) would increase, and the power rate (i.e., correctly detecting multidimensionality) would decrease. We chose 20% and 40% as the simulation conditions because these values were typically observed in several studies (Carter & Zickar, 2011; Habing et al., 2005; Levy et al., 2009). Therefore, the performance of the dimensionality detection methods from the present study can be compared directly.
Data Generation
For the simulation study, we benchmarked generating the parameters of the GGUM from previous studies (Carter & Zickar, 2011; de la Torre et al., 2006; Joo et al., 2017; Roberts & Thompson, 2011; Roberts et al., 2000, 2002). The discrimination parameters
To generate the multidimensional scale, we followed the procedure in previous studies that investigated scale dimensionality (Carter & Zickar, 2011; Levy, 2011; Levy et al., 2009). First, we generated a two-dimensional latent trait matrix from a multivariate normal distribution with a zero mean vector and a variance–covariance matrix. The off-diagonal elements of the variance–covariance matrix were set to 0, and the diagonal elements of the variance–covariance matrix were varied depending on the simulation study conditions (e.g., the dimensional correlation equaled 0, 0.3, or 0.6). The first column of the latent trait matrix was considered the primary dimension, and the second column of the latent trait matrix was considered the secondary dimension. Then, the item responses were generated based on the latent trait dimensions.
The secondary dimension items selected for the GGUM varied based on the simulation study design 3 . For the 20% multidimensionality with the 10-item test condition, we randomly selected two items as the secondary dimension items and selected the remaining eight items as the primary dimension items. For the 40% multidimensionality with the 10-item test condition, we randomly selected four items as the secondary dimension items. Similarly, we selected four items as the secondary dimension items in the 20% multidimensionality with the 20-item test condition and randomly selected eight items as the secondary dimension items in the 40% multidimensionality with the 20-item test condition. The random selection of the secondary dimension items varied across replications to reduce the impact of generating the item parameters of the GGUM.
Parameter Estimation and PPMC Implementation
The parameters of the GGUM were estimated with the MCMC estimation procedure (Patz & Junker, 1999). Specifically, the Metropolis–Hastings within Gibbs sampling method was implemented. The four-parameter beta distribution, B(a, b, u, v), was specified as a prior distribution for the item parameters of the GGUM. Note that four-parameter beta distribution can mimic widely used distributions, such as normal and log-normal distributions, by manipulating its shape (a, b) and range (u, v) parameters (Zeng, 1997). As used by de la Torre et al. (2006) and Joo et al. (2017), the four-parameter beta distributions B(1.50, 1.50, 0.25, 4.00), B(2, 2, −5, 5), and B(2, 2, −6, 6) were used for the alpha, delta, and tau parameters of the GGUM. For the latent trait parameter, standard normal distribution, N(0, 1) was specified for the MCMC estimation algorithm.
The Metropolis–Hastings with Gibbs sampling method also requires specifying initial values for the parameters to be estimated. The initial values were generated separately for each parameter of the GGUM. For the alpha parameters, we set 1 as the initial value across all items. For the delta parameters, we set −3 as the initial value for the first item and specified values in an increment of 6/(J−1), where J is the number of items, for the successive items, such that the initial value for the last item was specified as 3. For the tau parameters, we fixed the initial value at −1 for all items. For the latent trait parameters, we randomly generated samples from N(0, 1) and specified the samples as the initial values for all parameters. The strategy for the initial value specification is consistent with previous ideal point IRT model studies (de la Torre et al., 2006; Joo et al., 2019).
After specifying initial values, we estimated the item and latent trait parameters of the GGUM simultaneously with the MCMC algorithm. We considered multiple chains (C = 3) in this study. For each chain, a total of 20,000 iterations were performed, and the first 10,000 samples were discarded as the burn-in period. After the burn-in period, samples across the chains were used to compute the parameter estimates. The number of iterations, burn-in period, and chains were determined based on the convergence check computed from
For the dimensionality assessment, we implemented PPMC by adapting the method described by Sinharay et al. (2006) in which the model is evaluated using the posterior predictive distribution. The computation of the posterior predictive distribution is described as follows.
After the burn-in period, we drew Markov chain samples of the item and latent trait parameters from the posterior distribution. We generated replicated response data, We computed the discrepancy statistics using the observed data Finally, we compared the discrepancy statistics
Evaluation Criteria
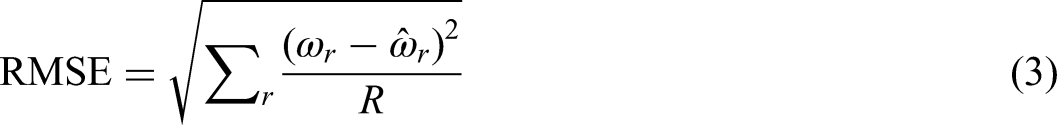
To evaluate the performance of the PPMC dimensionality detection methods, we computed Type I error and power rates. The Type I error rate was obtained by computing the proportion of replications in which PPP falsely produced the extreme value for item pairs that involved the primary dimension. Similarly, the power rates were obtained by computing the proportion of replications in which PPP correctly produced the extreme value for item pairs that involved the secondary dimension. In addition, to investigate the impact of the violation of unidimensionality on the parameter estimates, we computed the bias and the root mean squared error (RMSE) for the item and latent trait parameter estimates and the correlation between generating and estimated (CORR) for the latent trait parameters. We computed the bias and the RMSE as follows:

In addition, we compared the performance of PPMC with that of existing methods. The existing methods can serve as the baseline for evaluating the performance of the PPMC dimensionality assessment methods. We considered commonly used model fit statistics developed for dimensionality assessment. For example, Drasgow et al. (1995) previously introduced several model fit statistics using chi-squares (i.e., singles, doubles, and triples) for dominance IRT models. However, they noted that the chi-square statistics do not approximate the sampling distribution and are sensitive to a large sample. Alternatively, Drasgow et al. (1995) suggested using the chi-square degrees of freedom ratio (χ2/df) for assessing model-data fit. To address the sensitivity of chi-squares to large sample sizes, they also recommended adjusting chi-squares with a fixed sample size (e.g., 3,000; Tay & Drasgow, 2012b). As a heuristic diagnosis, Drasgow et al. (1995) suggested using a cutoff value of 3 for detecting model misfit. Later, Tay and Drasgow (2012b) showed adjusted χ2/df doubles and triples with the cutoff value of 3 are effective for detecting model-data misfit but have little power to detect moderate multidimensionality. Based on the previous findings, we included the adjusted χ2/df doubles in this study.
We also included Yen's Q3 (Yen, 1984; we refer to this statistic as YQ3 to distinguish it from Q3 in the PPMC method) and modified Q3 (MQ3; Habing et al., 2005) as the existing methods. Given that YQ3 statistics with the z-transformation do not accurately approximate the standard normal distribution, we alternatively used .20 as the heuristic cutoff value for detecting multidimensionality following Chen and Thissen’s (1997) recommendation. This cutoff has been used in applied settings (Makransky & Bilenberg, 2014; Reeve et al., 2007) and found to be effective for controlling Type I error under the null condition (Christensen et al., 2017). Data generation, MCMC estimation, PPMC computation, and evaluation of simulation results were accomplished using the statistical program R (R Core Team 2020).
Results
Type I Error Rates
Tables 1 and 2 show the Type I error results for the PPMC dimensionality assessment methods for the GGUM. Note that the Type I error rate is computed as the proportion of incorrectly detecting primary dimension items as secondary dimension items across replications. As shown in Tables 1 and 2, the Type I error rates were well controlled for the 20% multidimensional item conditions and were lower than or equal to the nominal level of .05. The acceptable Type I error rates (< .05) were consistent across conditions, including the sample size, the number of items, the dimensional correlation, and the level of the discrimination parameters. In terms of the discrepancy statistics, MBC and Q3 revealed higher Type I errors than the other statistics. For the 40% multidimensional item conditions; however, the Type I error increased considerably, and we observed values higher than the nominal level in some conditions. As the sample size, the number of items, and the level of the discrimination parameters increased, the Type I error rates increased substantially, and we observed unacceptable Type I error in the 20-item conditions. In addition, the Type I errors of OR, COV, MBC, and Q3 tended to be higher than those of the chi-square statistics (X2 and G2). MBC and Q3 produced the highest Type I error (.27) in the 2,000 sample size, 20-item test, high discrimination parameters, 0.6-dimensional correlation, and 40% multidimensionality item condition.
Type I Error Rates of Posterior Predictive Model Checking (PPMC) Dimensionality Assessment Methods for the 10-Item Conditions.

Note: Disc = item discrimination; COR = theta dimension correlation; COV = covariance; MBC = model-based covariance; OR = odds ratio. Values in bold are Type I error greater than .05.
Type I Error Rates of Posterior Predictive Model Checking (PPMC) Dimensionality Assessment Methods for the 20-Item Conditions.
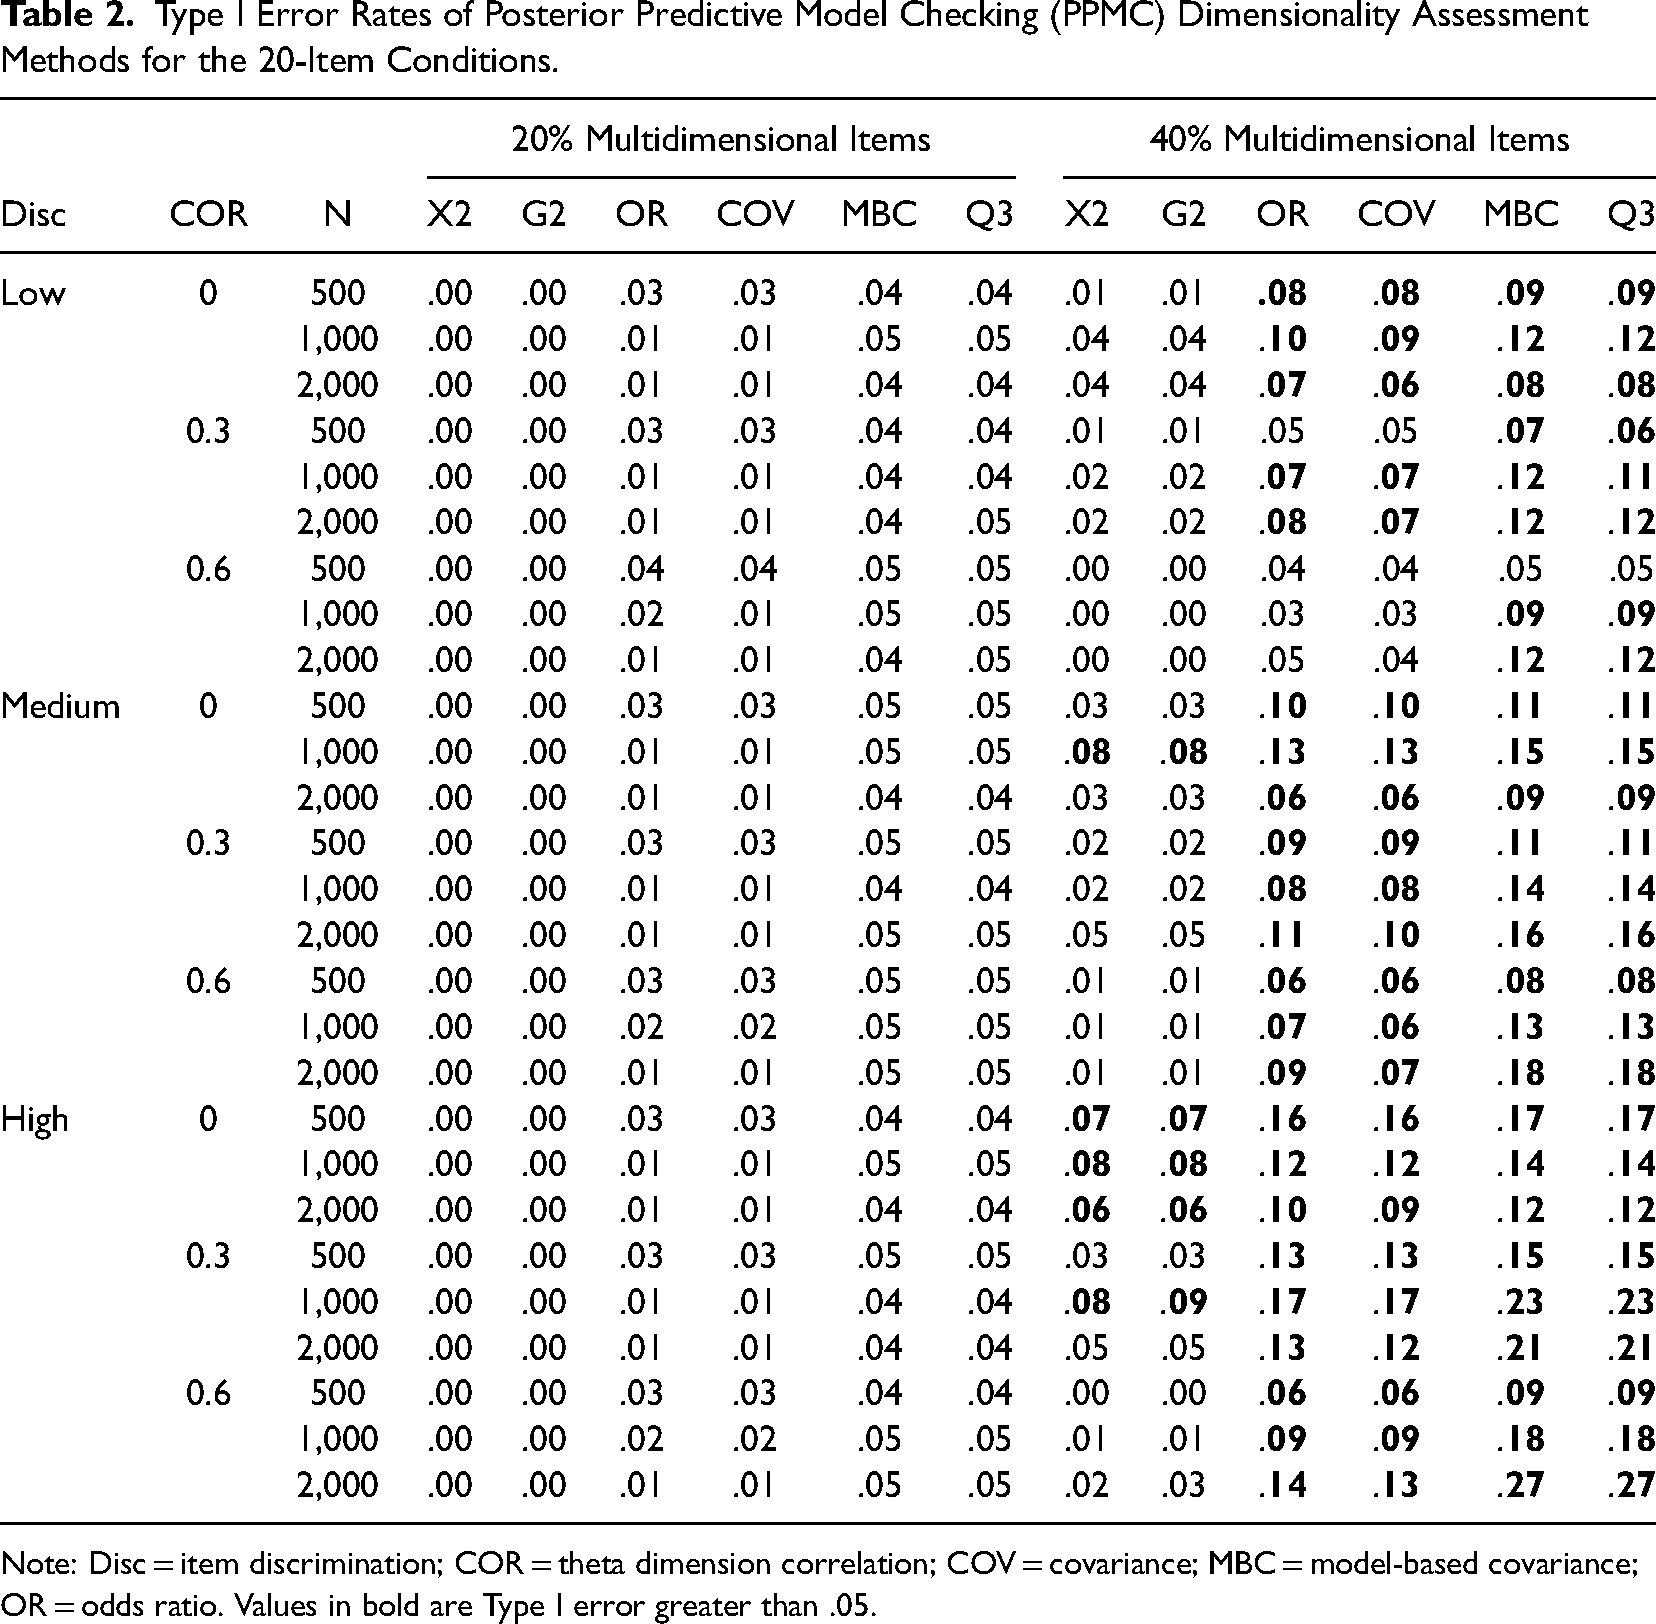
Note: Disc = item discrimination; COR = theta dimension correlation; COV = covariance; MBC = model-based covariance; OR = odds ratio. Values in bold are Type I error greater than .05.
Power Rates
Tables 3 and 4 show the power rates of the PPMC dimensionality assessment methods across the simulation conditions. Overall, we observed a pattern consistent with previous dimensionality studies (Carter & Zickar, 2011; Levy, 2011). As expected, increasing the sample size substantially increased the power rates of the dimensionality assessment methods. For example, the marginal power rates for each sample size (i.e., average power rates across simulation conditions) for X2 were .12, .45, and .63 for the 500, 1,000, and 2,000 sample sizes, respectively. In addition, the power rates notably increased as the discrimination parameters increased. When the low discrimination parameters were considered, the marginal power rates for X2, OR, and MBC were .28, .44, and .46, whereas the corresponding values were .53, .66, and .68 when high discrimination parameters were considered. Regarding the dimensional correlation of the latent trait structure, higher correlation resulted in lower power rates for the methods across conditions. The decrease in the power rates was more prominent when the dimensional correlation increased from 0.3 to 0.6. For example, the marginal power rates of G2, COV, and Q3 were .50, .60, and .62 for the 0 correlation conditions. However, for the 0.3 correlation conditions, the corresponding values decreased to .45, .58, and .61, respectively, and for the 0.6 correlations, the corresponding values decreased to .27, .43, and .49. Consistent with the Type I error rates, increasing the number of secondary dimension items decreased the overall power rates. When 20% of the items were generated from the secondary dimension, the marginal power rates for OR and Q3 were .66 and .67, whereas the corresponding values decreased to .44 and .47 when 40% of the items were generated from the secondary dimension. Last, MBC and Q3 overall showed the highest power rates across the discrepancy statistics. For example, the average power rates across the conditions for X2, G2, OR, COV, MBC, and Q3 were .40, .41, .55, .54, .57, and .57, respectively. These results support a previous PPMC dimensionality study (Levy et al., 2009), where the PPP distributions of MBC and Q3 showed more uniformity than the other statistics.
Power Rates of Posterior Predictive Model Checking (PPMC) Dimensionality Assessment Methods for the 10-Item Conditions.
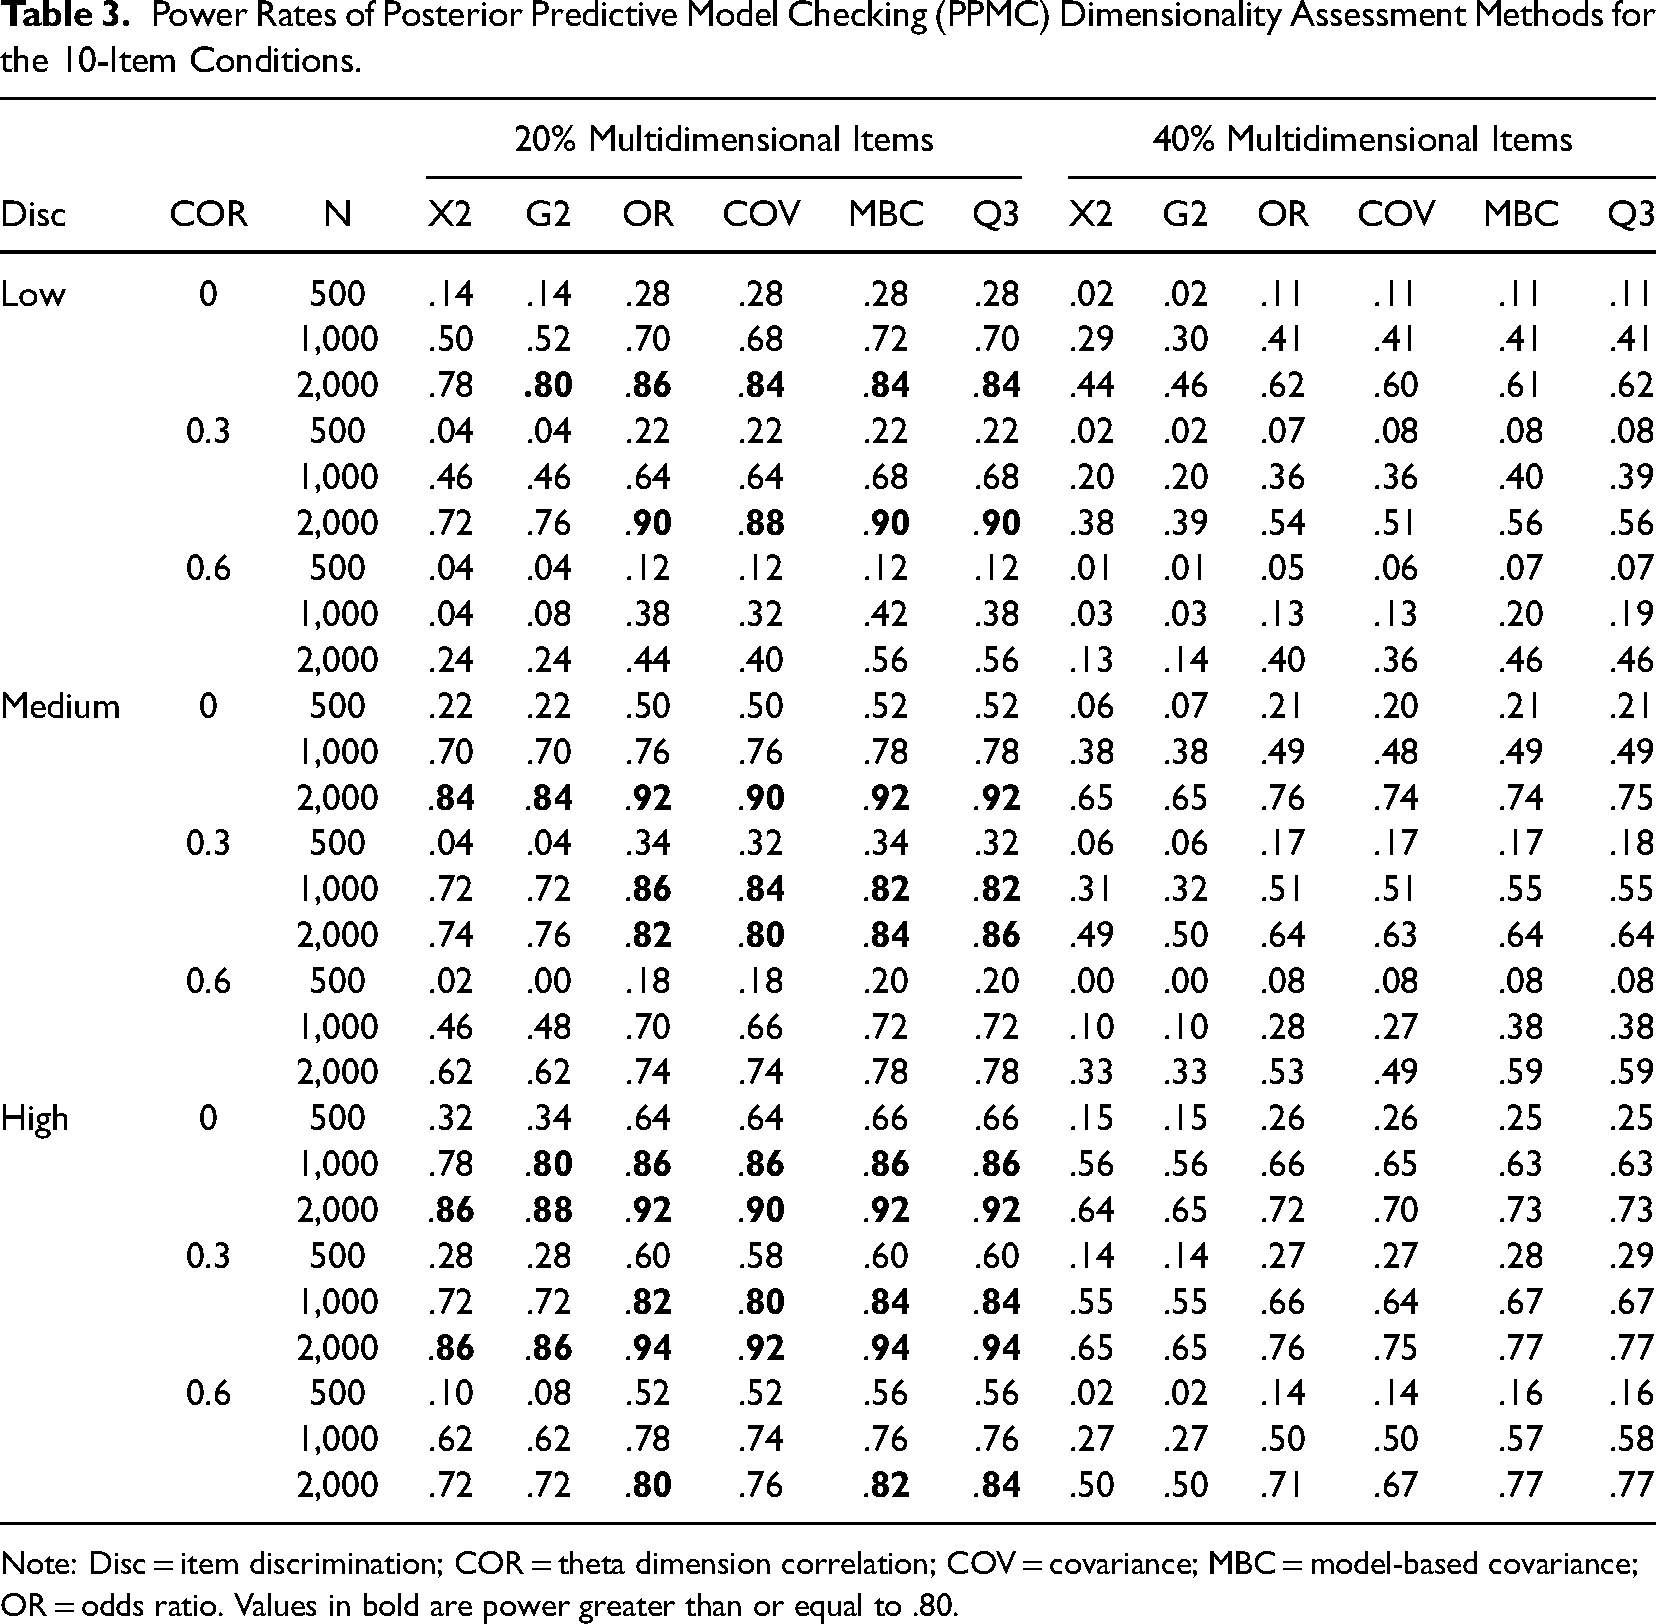
Note: Disc = item discrimination; COR = theta dimension correlation; COV = covariance; MBC = model-based covariance; OR = odds ratio. Values in bold are power greater than or equal to .80.
Power Rates of Posterior Predictive Model Checking (PPMC) Dimensionality Assessment Methods for the 20-Item Conditions.

Note: Disc = item discrimination; COR = theta dimension correlation; COV = covariance; MBC = model-based covariance; OR = odds ratio. Values in bold are power greater than or equal to .80.
Comparison with the Existing Methods
Table 5 shows the Type I error rates of the existing dimensionality assessment methods across the simulation conditions. Overall, the results show that the existing dimensionality methods controlled Type I error reasonably well, and YQ3 and MQ3 generally outperformed the χ2/df ratio. For the 20% multidimensional item conditions, the Type I error rates were well controlled across all methods. However, for the 40% multidimensional item conditions, the χ2/df ratio showed inflated Type I error results when the dimensional correlations were 0 and .3. YQ3 and MQ3 also showed inflated Type I error results when the number of items was 10, the dimensional correlation was 0, and the discrimination parameters were high.
Type I Error Rates of Adjusted χ2/df Ratio, Yen's Q3, and Modified Q3 Dimensionality Assessment Methods.
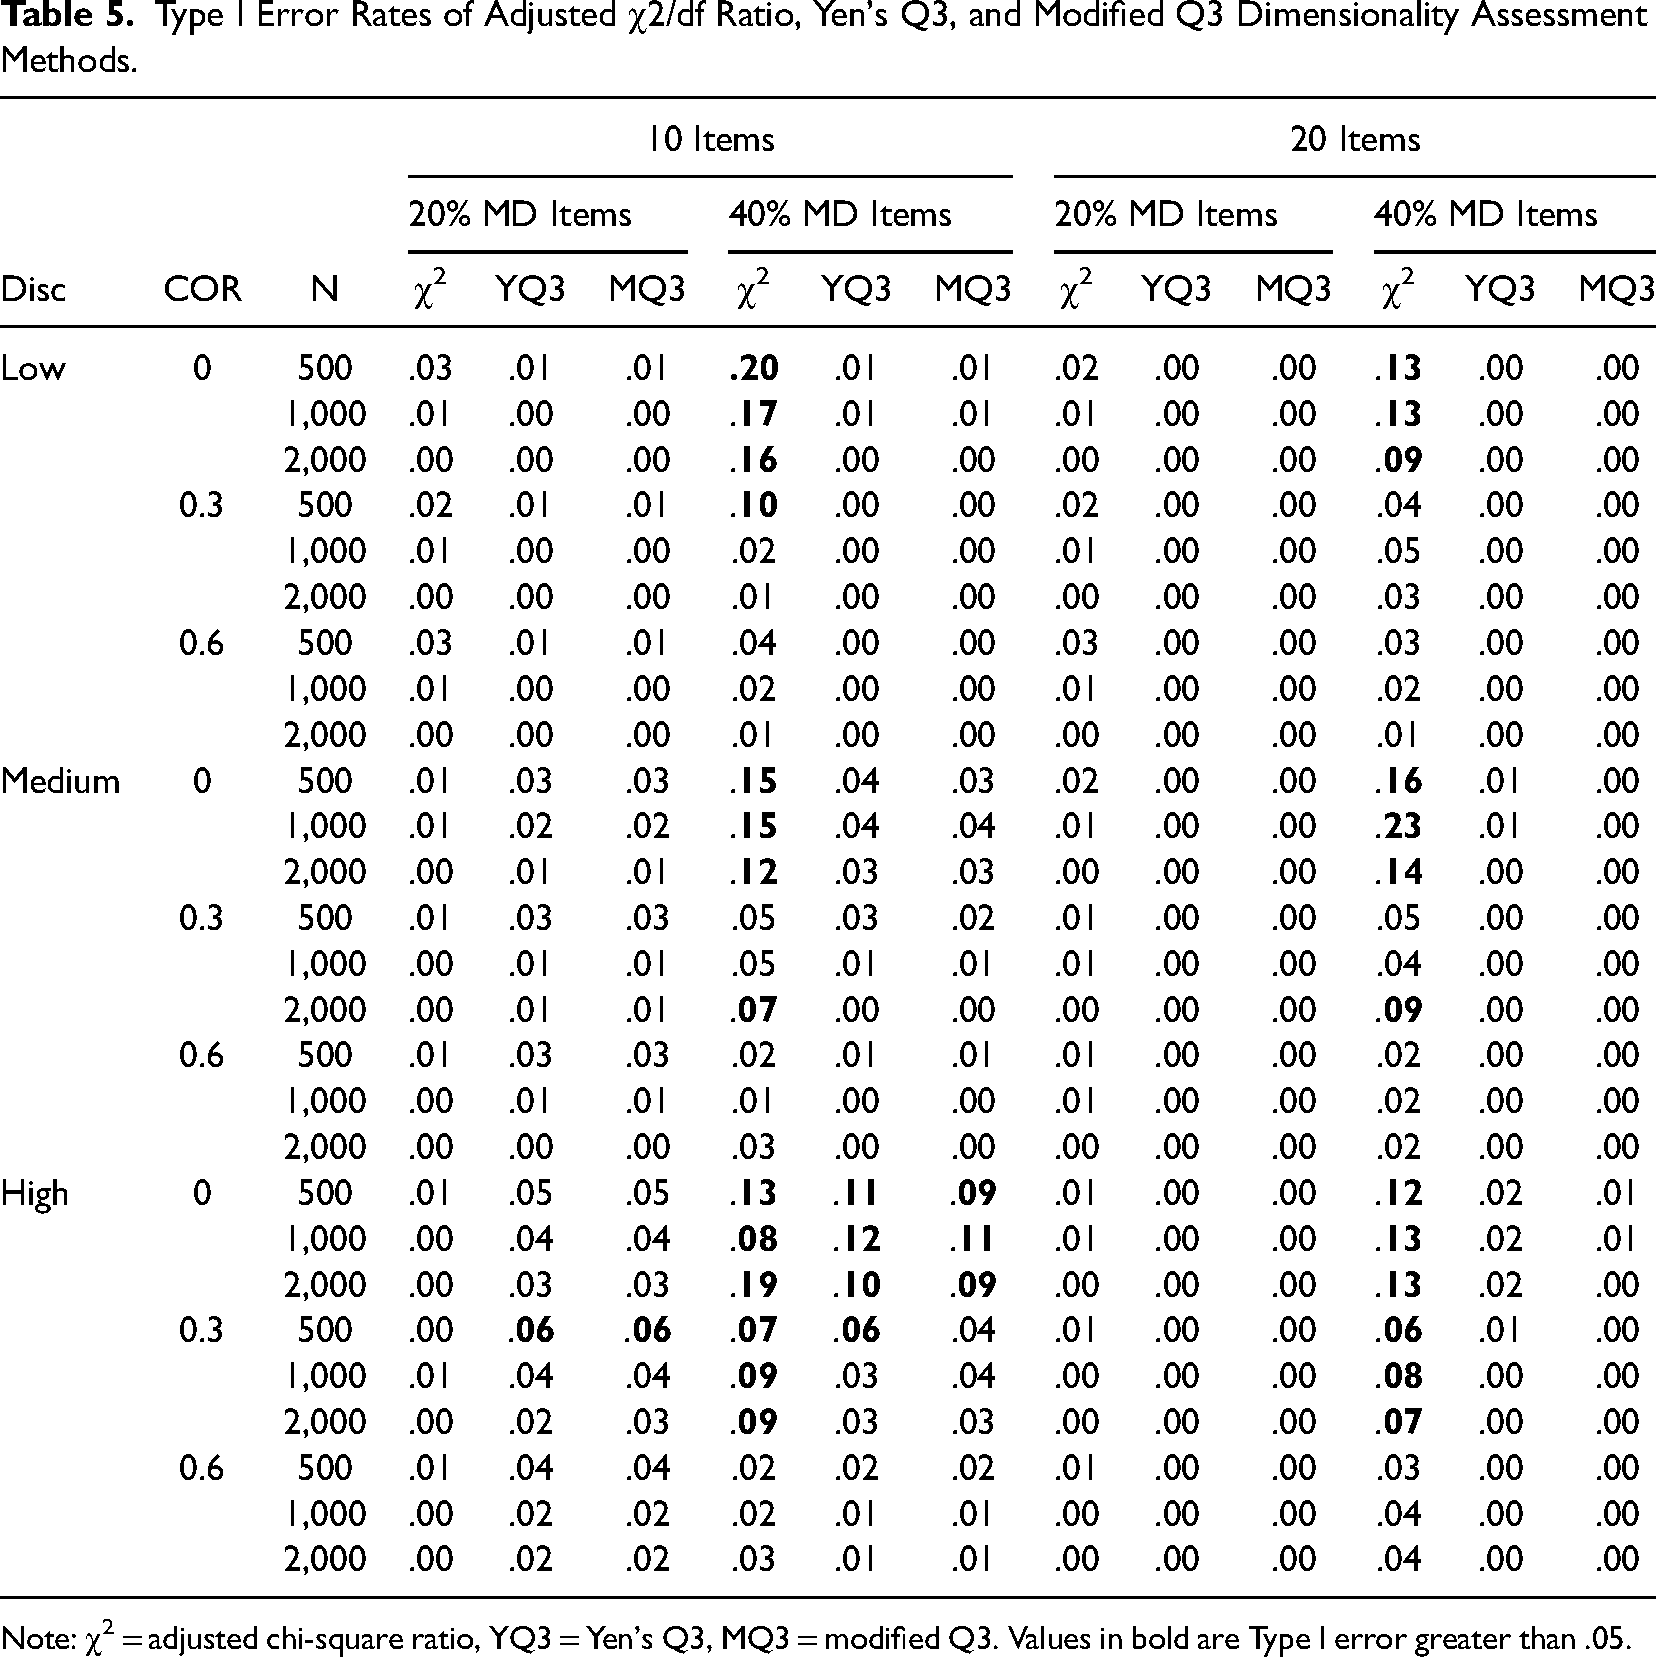
Note: χ2 = adjusted chi-square ratio, YQ3 = Yen's Q3, MQ3 = modified Q3. Values in bold are Type I error greater than .05.
Figure 3 shows the power rates of detecting multidimensionality across the methods for the 20% multidimensional item condition. Given that the 40% multidimensional item condition showed an inflated Type I error, we present only the 20% multidimensional item condition for the 20-item test. In Figure 3, we also include PPMC with Q3 and MBC to directly compare the performances. As shown in the figure, PPMC with Q3 and MBC outperformed existing methods across the conditions. The power rates of PPMC with Q3 and MBC were consistently higher than those of existing methods, and the power difference was more evident as the dimensional correlation increased. YQ3 and MQ3 showed minimal effectiveness, and the χ2/df ratio showed somewhat better performance for detecting multidimensionality. As the sample size increased, the performance of the χ2/df ratio and the PPMC methods with Q3 and MBC increased, whereas that of YQ3 and MQ3 remained consistent.

Power rates of detecting generalized graded unfolding model (GGUM) multidimensionality across methods for the 20% multidimensional item condition.
Item and Latent Trait Parameter Estimates
To investigate the impact of multidimensional scales on the GGUM, we computed the bias, RMSE, and CORR for the item and latent trait parameter estimates across simulation conditions. The item and latent trait parameter estimates were computed by fitting the unidimensional GGUM. Figures 4 and 5 show the bias and the RMSE of the item parameter estimates across the sample size and dimensional correlation conditions, respectively. In Figure 4, panels a and c (left column) show the bias and RMSE results for the primary dimension item parameters, and panels b and d (right column) show the bias and RMSE results for the secondary dimension item parameters. Item parameter estimates for the primary dimension showed minimal bias, whereas those for the secondary dimension showed substantial bias across different sample sizes. The bias of the primary dimension items was close to 0, but that of the secondary dimension items ranged from −.75 to 0. The bias of the alpha parameters increased as the sample size increased, and the bias of the tau parameters decreased as the sample size increased. The bias of the delta parameters remained 0 across all sample sizes. Similarly, the RMSEs for the primary dimension item parameters were relatively small, whereas the RMSEs for the secondary dimension items were relatively large. As the sample size increased, the overall RMSEs decreased for the primary dimension item parameters, and the values were consistent with previous GGUM estimation studies (Roberts & Thompson, 2011; Roberts et al., 2000). For the secondary dimension items, the RMSEs of the alpha parameters increased substantially as the sample size increased, and the RMSEs of the delta parameters decreased as the sample size increased. The RMSEs of the tau parameters showed consistent results across the sample size conditions.
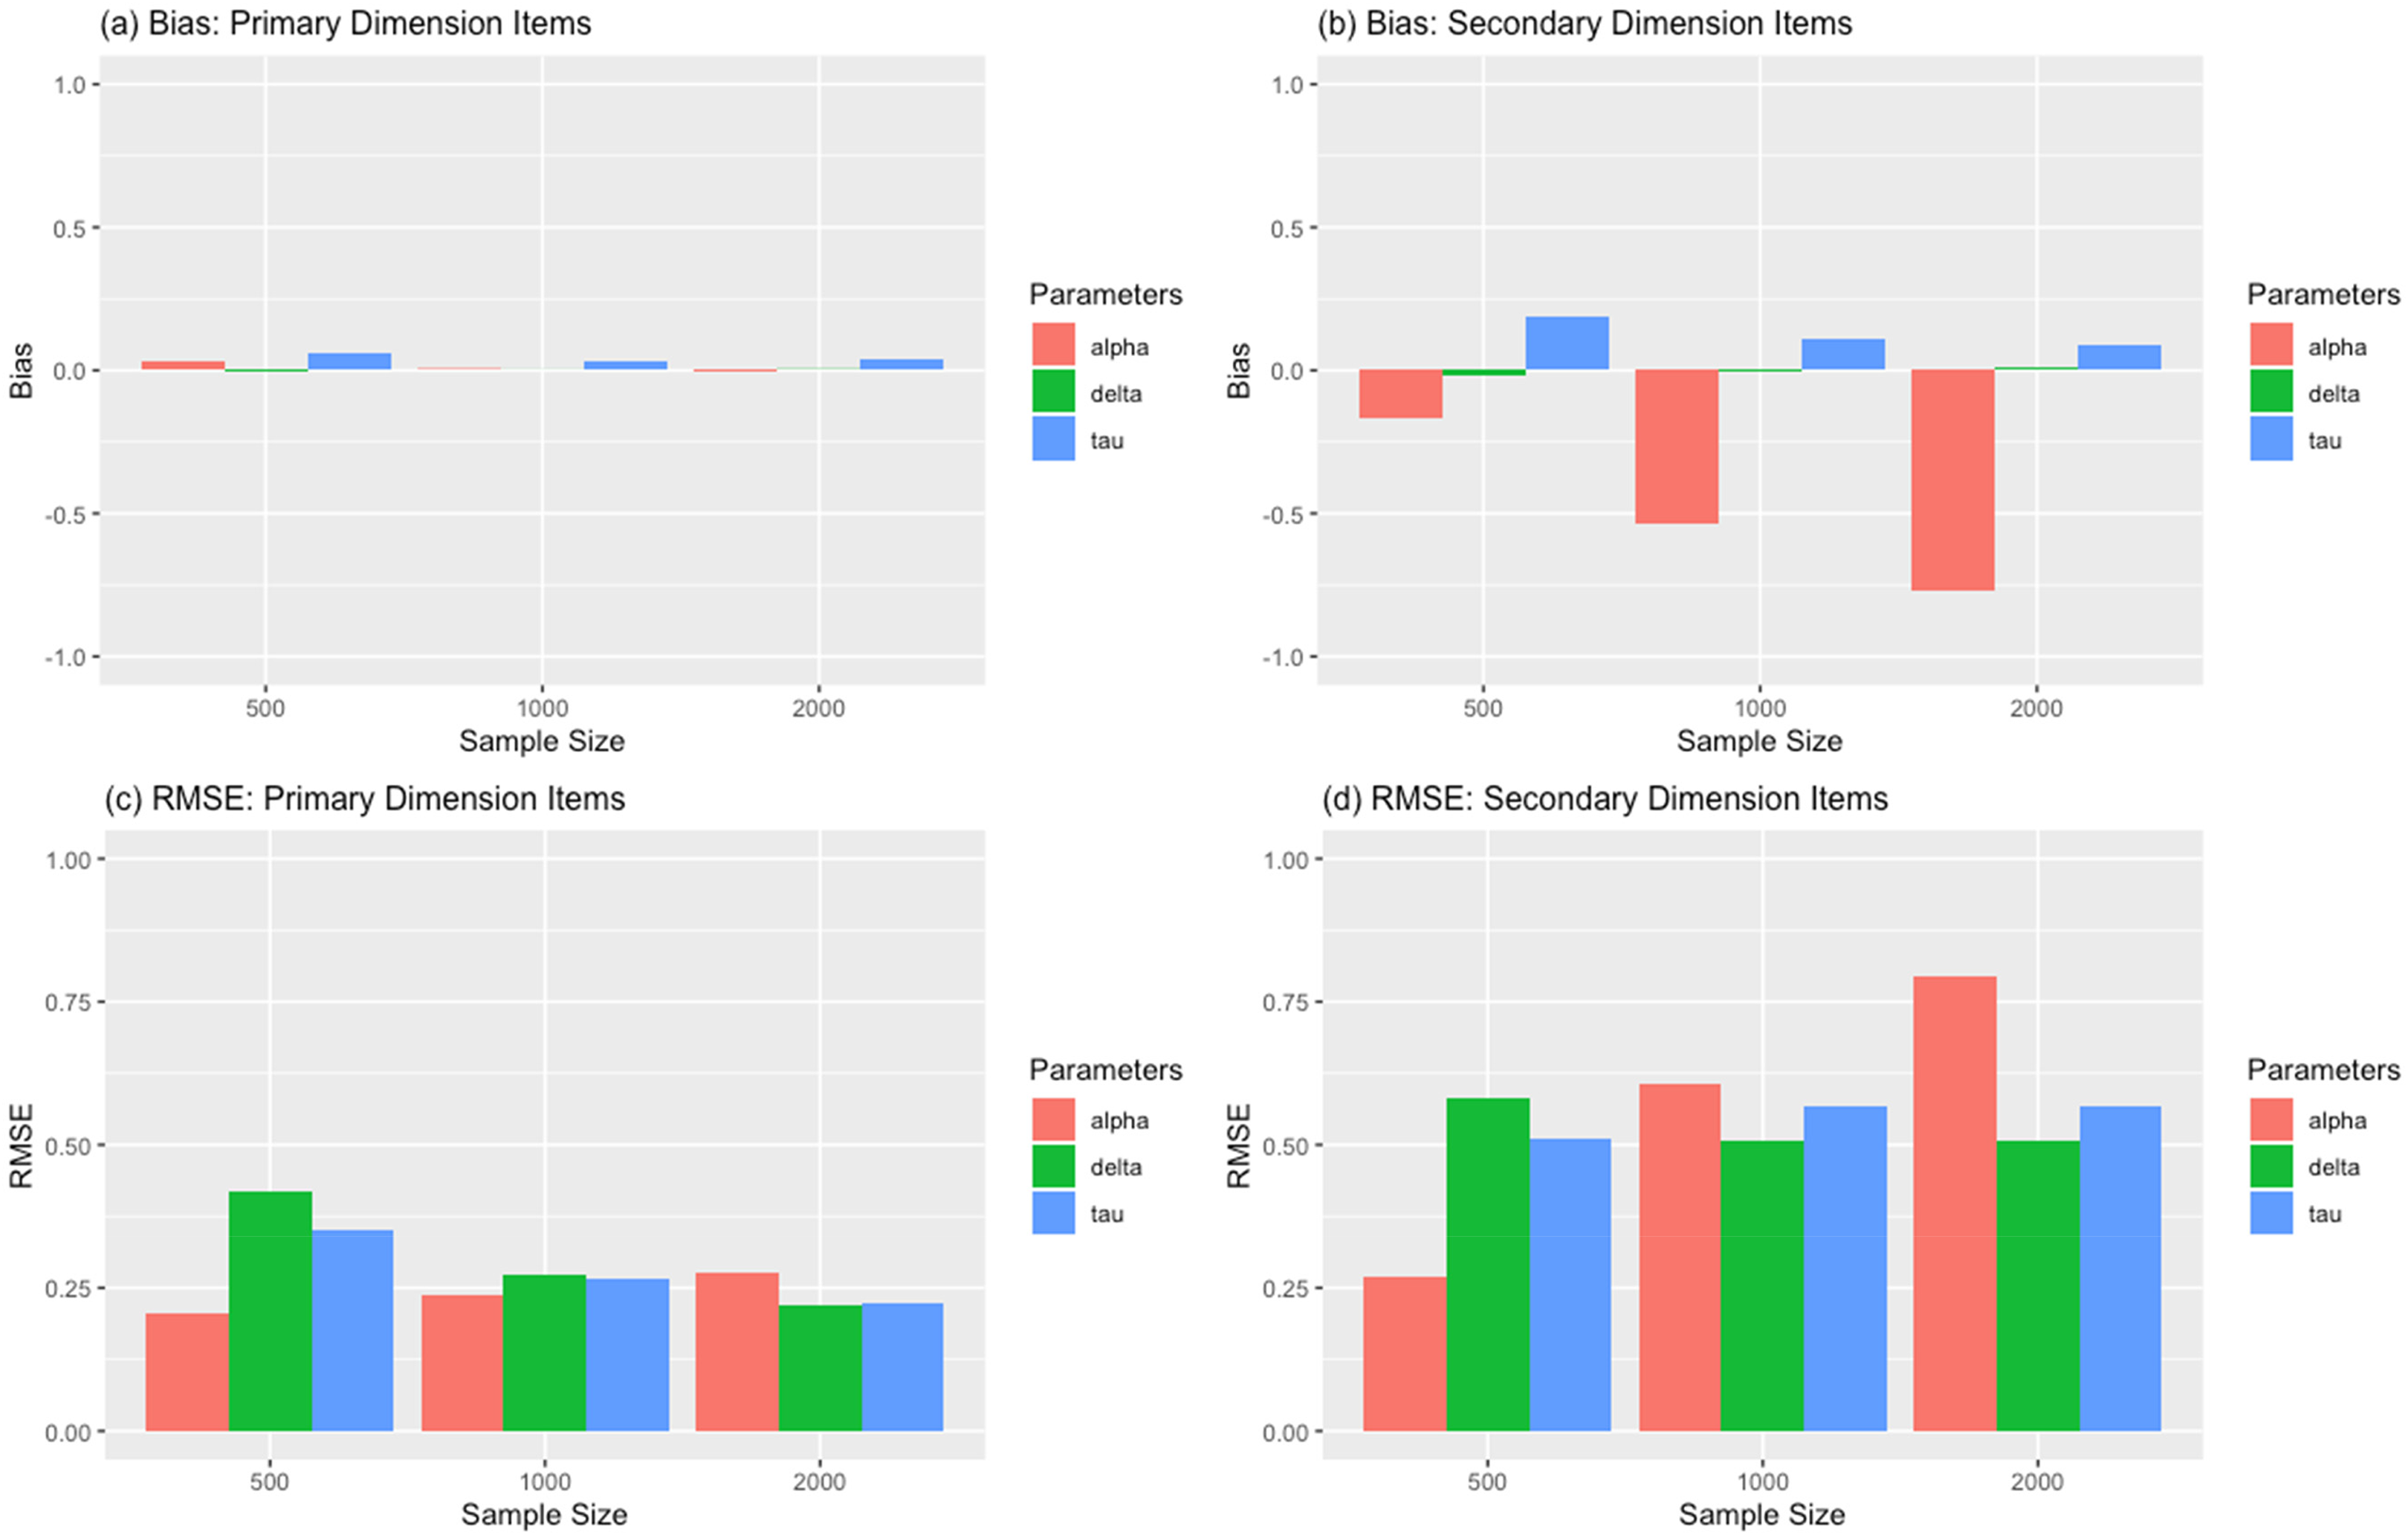
Bias and root mean squared error (RMSE) of the generalized graded unfolding model (GGUM) item parameter estimation for primary and secondary dimension items across sample size.

Bias and root mean squared error (RMSE) of the generalized graded unfolding model (GGUM) item parameter estimation for primary and secondary dimension items across dimension correlations.
Figure 5 also shows the bias and the RMSE for the GGUM item parameter estimates, but the results are summarized across the dimensional correlation conditions. Consistently, the item parameter estimates for the primary dimension showed minimal bias across the dimensional correlation conditions, and the corresponding RMSE values were close to 0, similar to the results illustrated in Figure 4. The item parameter estimates for the secondary dimension showed nonignorable bias, especially for the alpha parameters, and the RMSE values were considerably high. Consistent with the power rate results as shown in Tables 3 and 4, increasing dimensional correlation decreased the bias and the RMSE of the secondary dimension item parameter estimates. The delta parameters showed the highest RMSE values when the dimensional correlation condition was 0, but as the dimensional correlation increased, the RMSE decreased, and the values were similar to those of the alpha and tau parameters. However, regardless of the conditions, the RMSEs of the secondary dimension item parameters were substantially higher than those of the primary dimension item parameters.
Figure 6 shows the RMSE and the CORR of the latent trait parameter estimates across the sample size (left column) and the number of items (right column). As expected, increasing the sample size and the number of items overall improved the accuracy of the GGUM latent trait parameter estimates. However, as the proportion of the secondary items increased, accuracy decreased notably. As shown in Figure 6, regardless of the sample size and the number of items, the RMSEs of the latent trait parameter estimates increased, and the CORRs of the estimates decreased consistently as the number of items for the secondary dimension increased from 20% to 40%.
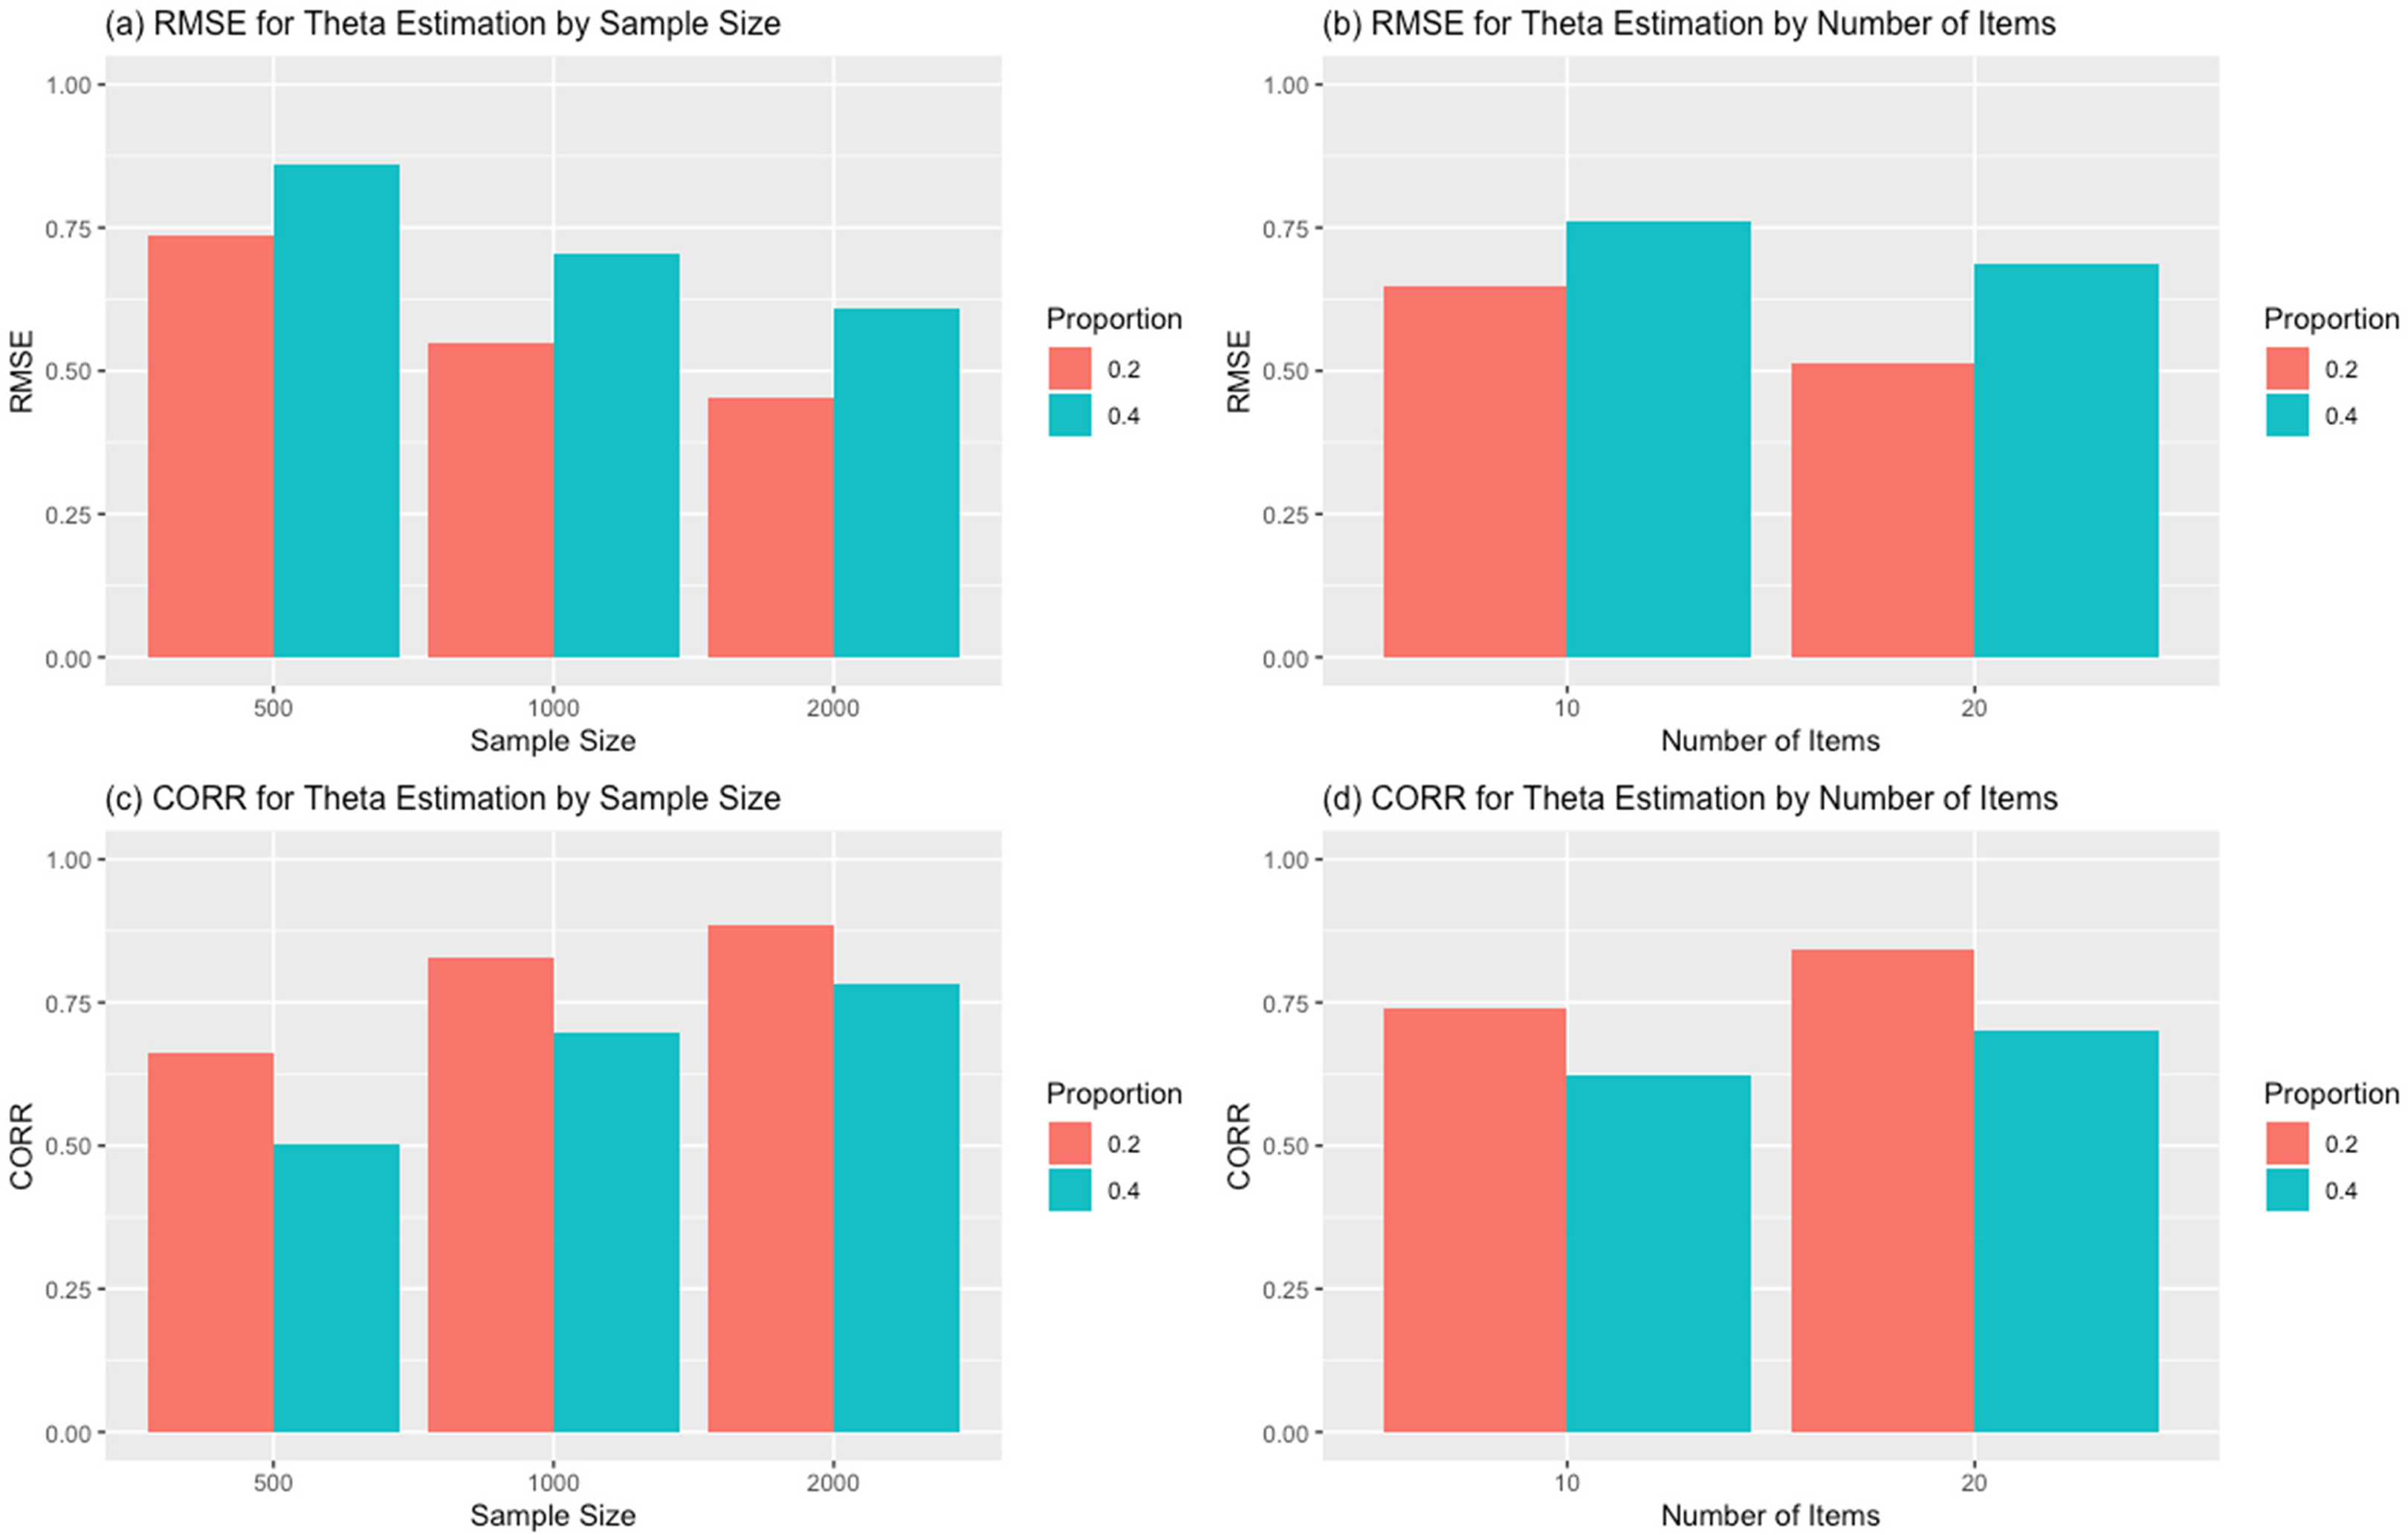
Root mean squared error (RMSE) and CORR of the generalized graded unfolding model (GGUM) latent trait estimation for the proportion of the secondary dimension items across sample size and the number of items.
Empirical Example
To demonstrate the feasibility of PPMC dimensionality assessment methods, we applied the methods to an open-source personality data set (openpsychometric.org). The Big Five personality measure includes items from the International Personality Item Pool (IPIP; Goldberg, 1992) and consists of 50 items (i.e., 10 items per dimension). To illustrate the performance of dimensionality assessment methods, we purposely selected eight items from a conscientiousness scale and two items from an openness scale. Thus, the conscientiousness trait is considered the primary dimension, and the openness trait is considered the secondary dimension for the example scale. Based on the simulation results, 2,000 examinees were randomly drawn from the total data set. The Big Five personality data set was originally coded as 5-point scales, but for this demonstration, we dichotomized the responses such that any response less than or is equal to 3 was recoded as 0, and 1 otherwise. We first analyzed the response data with the GGUM by calibrating the item and person parameters via MCMC estimation 4 . After we obtained the GGUM parameters, we used the PPMC dimensionality assessment to analyze the scale dimensionality. The dichotomized item response data set and the estimated item parameters were used for the GGUM dimensionality analysis. The R code for this analysis is available in the online Supplemental Material.
The item parameter estimates, and their PSD results are shown in Table 6. Overall, the items were well estimated, and the GGUM parameters were similar to values commonly observed in applied settings. The discrimination parameter estimates ranged from .30 to 2.23 and an average of 1.26. We also found that the item discrimination estimates from the openness trait showed low values. For the location parameters, the estimates showed a pattern consistent with their item directions. That is, positive items produced positive location parameter values, and negative items produced negative location parameter values. The range of the location parameters was also within the range commonly observed in noncognitive measurement.
Generalized Graded Unfolding Model (GGUM) Item Parameter Estimates and Standard Error from the Empirical Example.
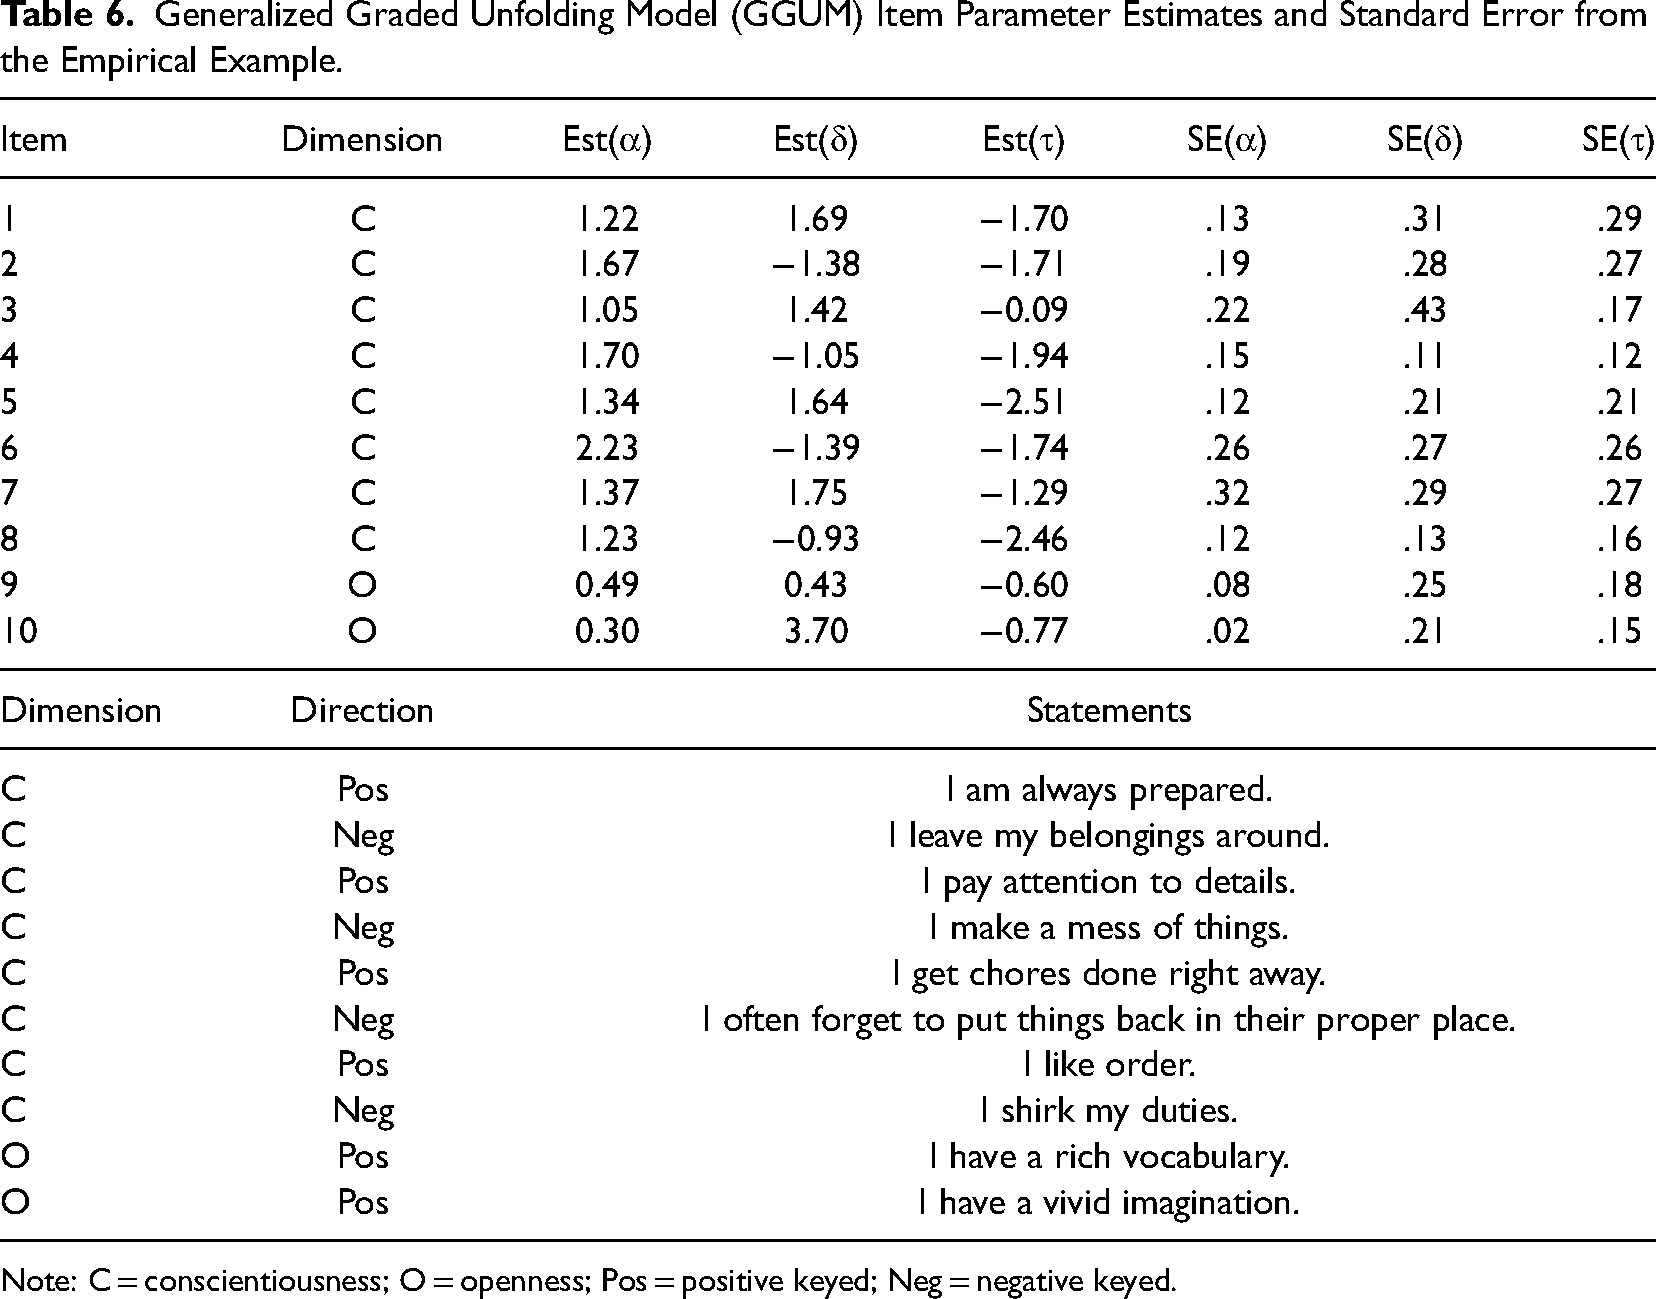
Note: C = conscientiousness; O = openness; Pos = positive keyed; Neg = negative keyed.
Table 7 shows the dimensionality assessment results for the empirical data. We computed the item pair PPP values based on the Q3 and MBC statistics. Note that extreme PPP values (less than .025 or greater than .975) indicate item misfit from the multidimensionality of the scale. As shown in Table 7, only one item pair (items 9 and 10) was detected as extreme PPP from the Q3 and MBC statistics, and the other item pairs showed moderate PPP values ranging between .13 and .50 for MBC and .06 and .94 for Q3. As intended, items 9 and 10 were correctly detected from the PPMC dimensionality methods.
Posterior Predictive P-Value (PPP) of Item Pairs Using PPMC-MBC and PPMC-Q3 from the Empirical Example.
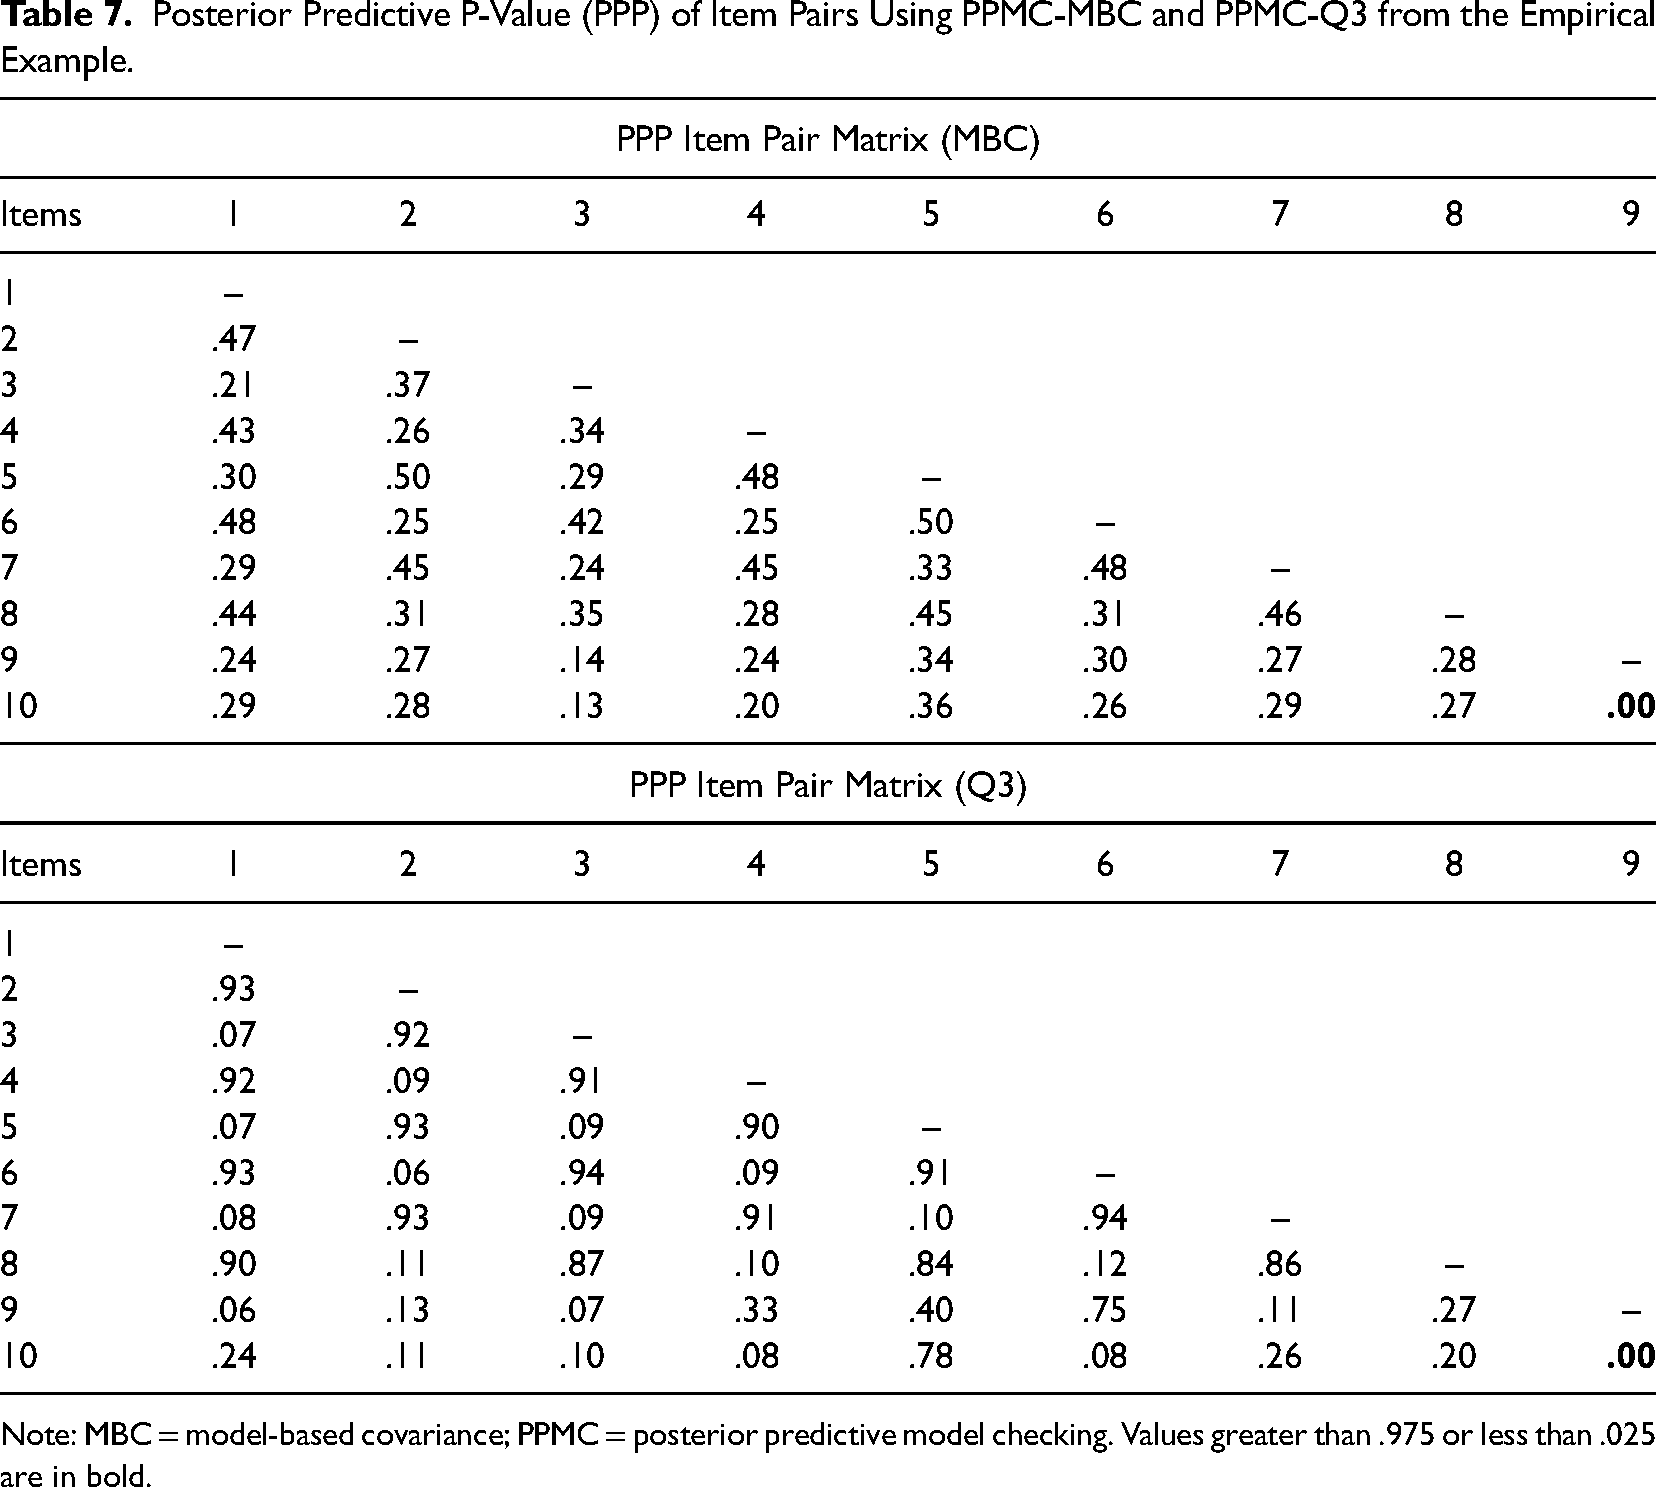
Note: MBC = model-based covariance; PPMC = posterior predictive model checking. Values greater than .975 or less than .025 are in bold.
Discussion
The purpose of this study was to develop dimensionality assessment tools for the most widely used ideal point IRT model, GGUM, using the Bayesian PPMC method, and explore the efficacy of different discrepancy statistics in conjunction with the sample size, the number of items, the level of the discrimination parameters, the dimensional correlation, and the proportion of multidimensionality. We evaluated the power and Type I error of the developed methods and investigated the impact of the item and latent trait parameters of the GGUM under the violation of unidimensionality. We also compared the PPMC dimensionality methods with existing methods. Finally, we demonstrated the PPMC dimensionality assessment procedure with the empirical example data set.
The results first showed Type I error rates were well controlled at the nominal level when 20% of the total items were generated from the secondary dimension. However, when the proportion of secondary dimension items reached 40%, the Type I error rates were inflated in the multidimensionality detection methods. This finding is expected, because if almost half of the items were generated from the secondary dimension, the magnitude of unidimensionality for the scale would diminish, resulting in a reduction in item pairs that reflect the same dimension (Levy et al., 2009; Zhang & Stout, 1999). Second, the sample size, the item discrimination, and the dimensional correlation had a significant impact on detecting the multidimensional scales. We found acceptable power rates under the conditions of 2,000 sample size, high discrimination parameters (i.e., GGUM alpha greater than 1.50), and zero-dimensional correlation. However, similar to the Type I error results, power diminished notably when the proportion of secondary dimension items reached 40% and low discrimination parameters were used. Third, the discrepancy statistics MBC and Q3 performed best, yielding the highest power while controlling the Type I error rates. Fourth, the PPMC dimensionality assessment methods outperformed the existing methods (adjusted χ2/df ratio, YQ3, and MQ3). Although the χ2/df ratio, YQ3, and MQ3 showed well-controlled Type I error rates for the 20% multidimensional conditions, and Type I error was inflated as the proportion of multidimensionality increased. More importantly, the power to detect multidimensional items for the existing methods was unacceptably lower than that for the PPMC methods. Fifth, the PPMC dimensionality assessment methods correctly detected the secondary dimensional items from the personality example data set. This finding assured that the PPMC dimensionality assessment methods can be utilized in practical settings. Finally, the violation of unidimensionality of scales substantially biased the GGUM item parameters, especially the discrimination parameter.
Implications for Organizational Researchers
The present study has several important implications for noncognitive measurement research. First, the developed methods can be readily applied in the development of ideal point scales. Previously, researchers either ignored assessing the dimensionality of scales or used conventional dimensional assessment methods, such as FA or PCA (Cao et al., 2015; Tay & Drasgow, 2012a). However, conventional methods are inappropriate for ideal point scales due to the nonmonotonic nature of the response process; therefore, applying conventional methods to ideal point scales may distort the results. As illustrated in the introduction, PCA incorrectly identified the ideal point scale as two dimensions when the scale was generated as unidimensional. As Tay and Drasgow (2012a) noted, PCA does not take the intermediate latent trait continuum into account, but instead, incorrectly assumes two construct dimensions for the positive and negative ends of the latent trait continuum. Moreover, previously developed methods (e.g., adjusted χ2/df ratio and modified Yen's Q3) were not very effective at detecting the violation of unidimensionality for the ideal point scales (Habing et al., 2005; Tay & Drasgow, 2012b). In the present study, we have shown the effectiveness of the PPMC dimensionality assessment method for the ideal point scales and the newly developed method consistently outperformed the existing methods across the simulation conditions. We posit that the program developed for the present study can be a useful tool for organizational researchers to check the dimensionality of ideal point scales, given that the program was specifically developed for the ideal point IRT model (the R code is available for applied researchers in the online Supplemental Material).
However, it is worthwhile to note that the PPMC method did not show sufficient power in some conditions. Although the PPMC method consistently outperformed the existing methods, the PPMC method still showed limited power. For example, when 40% of the items were generated from the secondary dimension, the highest power only reached .88 using MBC and Q3 as the discrepancy statistics. In addition, when the discrimination parameter values were relatively low (e.g., less than 1) for the 40% multidimensionality condition, no discrepancy statistic from the PPMC method showed sufficient power. Although this finding is consistent with previous studies (e.g., Levy et al., 2009) and the 40% multidimensionality is too extreme and may not be considered as a unidimensional scale, we recommend organizational researchers carefully investigate and interpret dimensionality assessment results with the PPMC method. Furthermore, highly discriminating items with a well-constructed scale would produce the best result for the PPMC dimensionality assessment.
Second, the developed dimensionality assessment methods for the ideal point model can be implemented in person-organization (P-O) fit measures. In principle, ideal point models have been used to develop and evaluate P-O fit measures because the ideal point response process is more appropriate for P-O measurement than the dominance response process. Specifically, examinees are highly likely to endorse P-O items if their job matches the level of the examinees’ latent traits. Chernyshenko et al. (2009), for example, developed a P-O fit measure using the ideal point IRT model and provided incremental validity evidence in predicting intentions to leave the job. However, in their study, the dimensionality of P-O measures was not investigated, and evidence for scale unidimensionality has not been reported. In future, researchers can investigate the dimensionality of P-O fit measures using the PPMC dimensionality assessment methods and improve the validity of the measurement by detecting and removing items that possibly measure an irrelevant construct dimension.
Third, the GGUM dimensionality assessment methods can also be applied for the development of multidimensional forced choice (MFC). Note that MFC measures consist of two or more statements representing different construct dimensions within an item, and examinees are asked to choose or rank the statements based on their preference. Over the last few decades, new IRT models have been exclusively developed for MFC measures to reduce the ipsative problem associated with the traditional scoring method (Brown & Maydeu-Olivares, 2011; Joo et al., 2018; Lee et al., 2019), and one of the most popular IRT models based on the ideal point assumption is multi-unidimensional pairwise preference (MUPP; Stark et al., 2005). The MUPP model has been implemented in industrial applications, including the Tailored Adaptive Personality Assessment System (TAPAS; Drasgow et al., 2012; Stark et al., 2014). In practice, MUPP item calibration and scoring are performed based on the GGUM statement probability function, and the GGUM statement parameters play an important role in test development in terms of designing and constructing MFC items (Joo et al., 2020). For example, test developers would like to match similar statement extremities within an MFC item to create fake-resistant MFC measures, and to do so, accurate and valid statement parameter estimates should be obtained in the GGUM item calibration step (Stark et al., 2005). In addition, it is also critical for test developers to ensure the unidimensionality of statements to increase the validity of MFC measures. However, to date, no statistical software was available for the GGUM dimensionality assessment, and the construct validity of MFC statements for MUPP has been heavily dependent on the item writers’ subjective judgment. Therefore, the present study contributes to MFC research by providing options for test developers to statistically evaluate the statement level construct validity and unidimensionality.
Limitations and Future Research
The present study also has several limitations. First, the simulation study did not include polytomous responses in the design; the simulation explored only the dichotomous responses of the GGUM, and dimensionality assessment methods were specifically developed for the dichotomous responses only. However, the PPMC method can be easily extended for the polytomous responses of the GGUM by including discrepancy statistics for polytomous responses. For example, the global OR for polytomous responses (Penfield, 2007) can be implemented as discrepancy statistics in the PPMC method, and one can evaluate the performance of the method under various conditions. In addition, the polytomous version of chi-square statistics (Drasgow et al., 1995) can be applied in the future. Second, based on the simulation results, the PPMC method still requires a large number of examinees to obtain the acceptable power rate (e.g., power greater than or equal to .80). Although the PPMC method has shown better performance than existing methods, organizational researchers still need a large number of examinees to meet the statistical standards. This may be challenging for some organizational studies where a relatively smaller number of examinees are generally collected (e.g., employee or student data in research setting). However, large-scale personality assessments such as college admission tests or military selections generally have a large number of examinees (or applicants) and ideal point IRT modeling and the dimensionality assessment be easily applied. A future study should investigate and develop more efficient dimensionality assessment methods that meet the statistical standards and require a fewer number of examinees. Third, the proposed PPMC dimensionality assessment methods depend on the specific ideal point IRT model, the GGUM. That is, the proposed PPMC dimensionality methods would perform effectively if two assumptions are met: (a) The observed response data fit the GGUM adequately and (b) the GGUM item parameters are accurately estimated. Again, these assumptions may not easily hold in organizational studies due to various reasons, and a future study should develop dimensionality assessment methods that do not depend on a specific model (i.e., the nonparametric approach).
Despite these limitations, this study contributes to and advances research on dimensionality assessment with ideal point measures. The PPMC dimensionality methods described in this paper have many potential extensions for ideal point scales, and more investigation is needed to refine the methods and applications. We posit that the methods and program developed for this study will help organizational researchers apply IRT scaling for noncognitive constructs more gainfully in research and practice.
Supplemental Material
sj-docx-1-orm-10.1177_10944281211050609 - Supplemental material for Assessing Dimensionality of the Ideal Point Item Response Theory Model Using Posterior Predictive Model Checking
Supplemental material, sj-docx-1-orm-10.1177_10944281211050609 for Assessing Dimensionality of the Ideal Point Item Response Theory Model Using Posterior Predictive Model Checking by Seang-Hwane Joo, Philseok Lee, Jung Yeon Park and Stephen Stark in Organizational Research Methods
Footnotes
Appendix
Declaration of Conflicting Interests
The author(s) declared no potential conflicts of interest with respect to the research, authorship, and/or publication of this article.
Funding
The author(s) received no financial support for the research, authorship, and/or publication of this article.
Supplemental Material
Supplemental material for this article is available online.
Notes
Author Biographies
References
Supplementary Material
Please find the following supplemental material available below.
For Open Access articles published under a Creative Commons License, all supplemental material carries the same license as the article it is associated with.
For non-Open Access articles published, all supplemental material carries a non-exclusive license, and permission requests for re-use of supplemental material or any part of supplemental material shall be sent directly to the copyright owner as specified in the copyright notice associated with the article.