
Abstract
Contextualized in postpurchase consumption in business-to-business settings, the authors contribute to customer experience (CX) management theory and practice in three important ways. First, by offering a novel CX conceptual framework that integrates prior CX research to better understand, manage, and improve CXs—comprised of value creation elements (resources, activities, context, interactions, and customer role), cognitive responses, and discrete emotions at touchpoints across the customer journey. Second, by demonstrating the usefulness of a longitudinal CX analytic based on the conceptual framework that combines quantitative and qualitative measures. Third, by providing a step-by-step guide for implementing the text mining approach in practice, thereby showing that CX analytics that apply big data techniques to the CX can offer significant insights that matter. The authors highlight six key insights practitioners need in order to manage their customers’ journey, through (1) taking a customer perspective, (2) identifying root causes, (3) uncovering at-risk segments, (4) capturing customers’ emotional and cognitive responses, (5) spotting and preventing decreasing sales, and (6) prioritizing actions to improve CX. The article concludes with directions for future research.
Text mining and other emerging technologies offer potentially better ways to measure and manage customer experience (CX); (Keiningham et al. 2017; Lemon and Verhoef 2016; Verhoef, Kooge, and Walk 2016; Villarroel Ordenes et al. 2014). Yet there is little research to guide scholars and practitioners on how to gain important insights from the extensive big data that arises throughout the CX and to understand, manage, and improve CXs. Prior work has focused primarily on the firm’s perspective. We depart from this by taking a customer-focused perspective, integrating prior research to provide a conceptual framework to guide future research and practice and to show that CX analytics that apply big data techniques to the CX can offer significant insights that matter.
Consistent with taking a customer perspective, we build on foundational research in value creation by McColl-Kennedy et al. (2012) with later work by Macdonald, Kleinaltenkamp, and Wilson (2016) who highlight the importance of interactions at touchpoints and context, foundational work by Verhoef et al. (2009), and later work by Lemon and Verhoef (2016) that highlights the importance of both emotions and cognitive responses at the various touchpoints. We underscore the importance of viewing the CX as a journey, comprised of multiple touchpoints over time.
The purpose of this article is 3-fold to (1) offer a conceptual framework that integrates prior CX research, (2) demonstrate the usefulness of a longitudinal CX analytic based on our conceptual framework that combines quantitative and qualitative measures, and (3) provide a step-by-step guide for implementing the approach in practice highlighting what really matters to customers and what actions are needed by managers.
Our work contributes to CX literature by providing a conceptual framework that integrates and extends key foundational work and by taking a customer perspective approach comprising value creation elements, customer discrete emotions, and customer cognitive responses at distinct touchpoints to gain salient CX insights. Our model not only provides rich insights into customer behavior by assisting in identifying and monitoring pain points, it also enables early detection of potentially vulnerable customers within the segment typically seen as highly satisfied and enables identification of the root cause(s) of this vulnerability to spot and prevent decreasing sales. Further, we provide managerial implications, setting out a step-by-step guide to putting our conceptual framework into action, illustrating how managers can use this model to identify root causes and prioritize actions designed to improve CXs. Using this approach enables an organization to begin to manage the small details that matter (Bolton et al. 2014; Forrester 2015), by capturing customers’ emotional and cognitive responses.
In the following sections, we develop our conceptual framework, describe the methodogy and data collection, and present the findings showing how our analytic can be used to gain insights into the CX and, importantly, to identify where to focus resources to adapt and potentially redesign the CX at problematic touchpoints. Finally, we close with a summary of managerial implications, contribution to theory, and directions for future research.
What We Know and What We Need to Know about Managing CX
CX is a central focus of marketing theory and practice. Providing a meaningful CX is viewed as being essential to achieving competitive advantage and satisfied customers (Bolton et al. 2014; Homburg, Jozić, and Kuehnl 2017; Verhoef et al. 2009). Organizations that carefully manage the customer experience reap rewards including increased customer satisfaction, increased revenue, and greater employee satisfaction (Rawson, Duncan, and Jones 2013). The CX can be conceptualized as holistic, comprised of multiple touchpoints (Frow and Payne 2007) in an end to end journey (Neslin et al. 2006), involving the customer’s cognitive, affective, emotional, social, and sensory elements (De Keyser et al. 2015; Lemon and Verhoef 2016; Verhoef et al. 2009). This conceptualization is consistent with the view that CX is a process (Grönroos 1998; Rawson, Duncan, and Jones 2013), comprised of interactions and activities across multiple touchpoints. It is important to note that touchpoints can also occur across several repetitions of a service, especially where customers repeatedly deal with the same organization. Prior experiences shape expectations about future interactions. 1
Several models have sought to understand the influence of specific firm actions on CX assessments and customer behaviors. Typically called linkage models, or root cause analyses, these econometric models seek to identify the influence of specific firm marketing actions on overall customer assessments (such as satisfaction, loyalty, or net promoter score (NPS), e.g., Bolton 1998; Reichheld 2003) or behaviors (such as repeat purchase or retention, cross-buying, word of mouth (WOM), or customer lifetime value (CLV), e.g., Bolton, Lemon, and Verhoef 2004, 2008; Rust, Lemon, and Zeithaml 2004). These models seek to link (1) firm actions to (2) customer perceptions to (3) customer behaviors to (4) firm performance (see Gupta and Zeithaml 2006, for details and review). For example, in a business-to-business (B2B) context, Bolton, Lemon, and Bramlett (2006) found that specific types of interactions between the supplier firm and the business customer had significant influence on whether a contract was renewed. Their work highlights not only the importance of CXs but that extreme outcomes across the customer journey can have a significant effect on renewing the contract.
Linkage models enable firms to identify factors that influence customer behavior and outcomes, but typically the potential touchpoints are predefined by the firm and limited by data availability. Prior research has not examined these linkages by letting the key touchpoints emerge from the data, nor has research connected qualitative data and quantitative data to identify root causes and specific opportunities for improvement. Even when both types of data are available, qualitative, open-ended responses are often simply characterized broadly as either “complaints” or “compliments” (cf. Knox and van Oest 2014). Other research examines how specific touchpoints contribute to the overall CX across the customer journey. For example, research has found that customers utilize different channels for different aspects of the customer journey, identifying specific categories of shoppers who search in one channel and purchase in another and shoppers who purchase in one channel but seek postpurchase assistance in another (De Keyser, Schepers, and Konuş 2015; Verhoef, Neslin, and Vroomen 2007).
Need for a Customer Perspective
While these models, as a whole, are a great starting point for analyzing the CX and provide beginnings for touchpoint improvement, further work is needed. Touchpoints to be improved should be mapped out from the customer’s perspective, not solely from the firm’s perspective (Lemon and Verhoef 2016). In addition, richer models are needed to identify key pain points from the customer perspective and to translate these pain points into specific firm opportunities (root causes) for improving the CX.
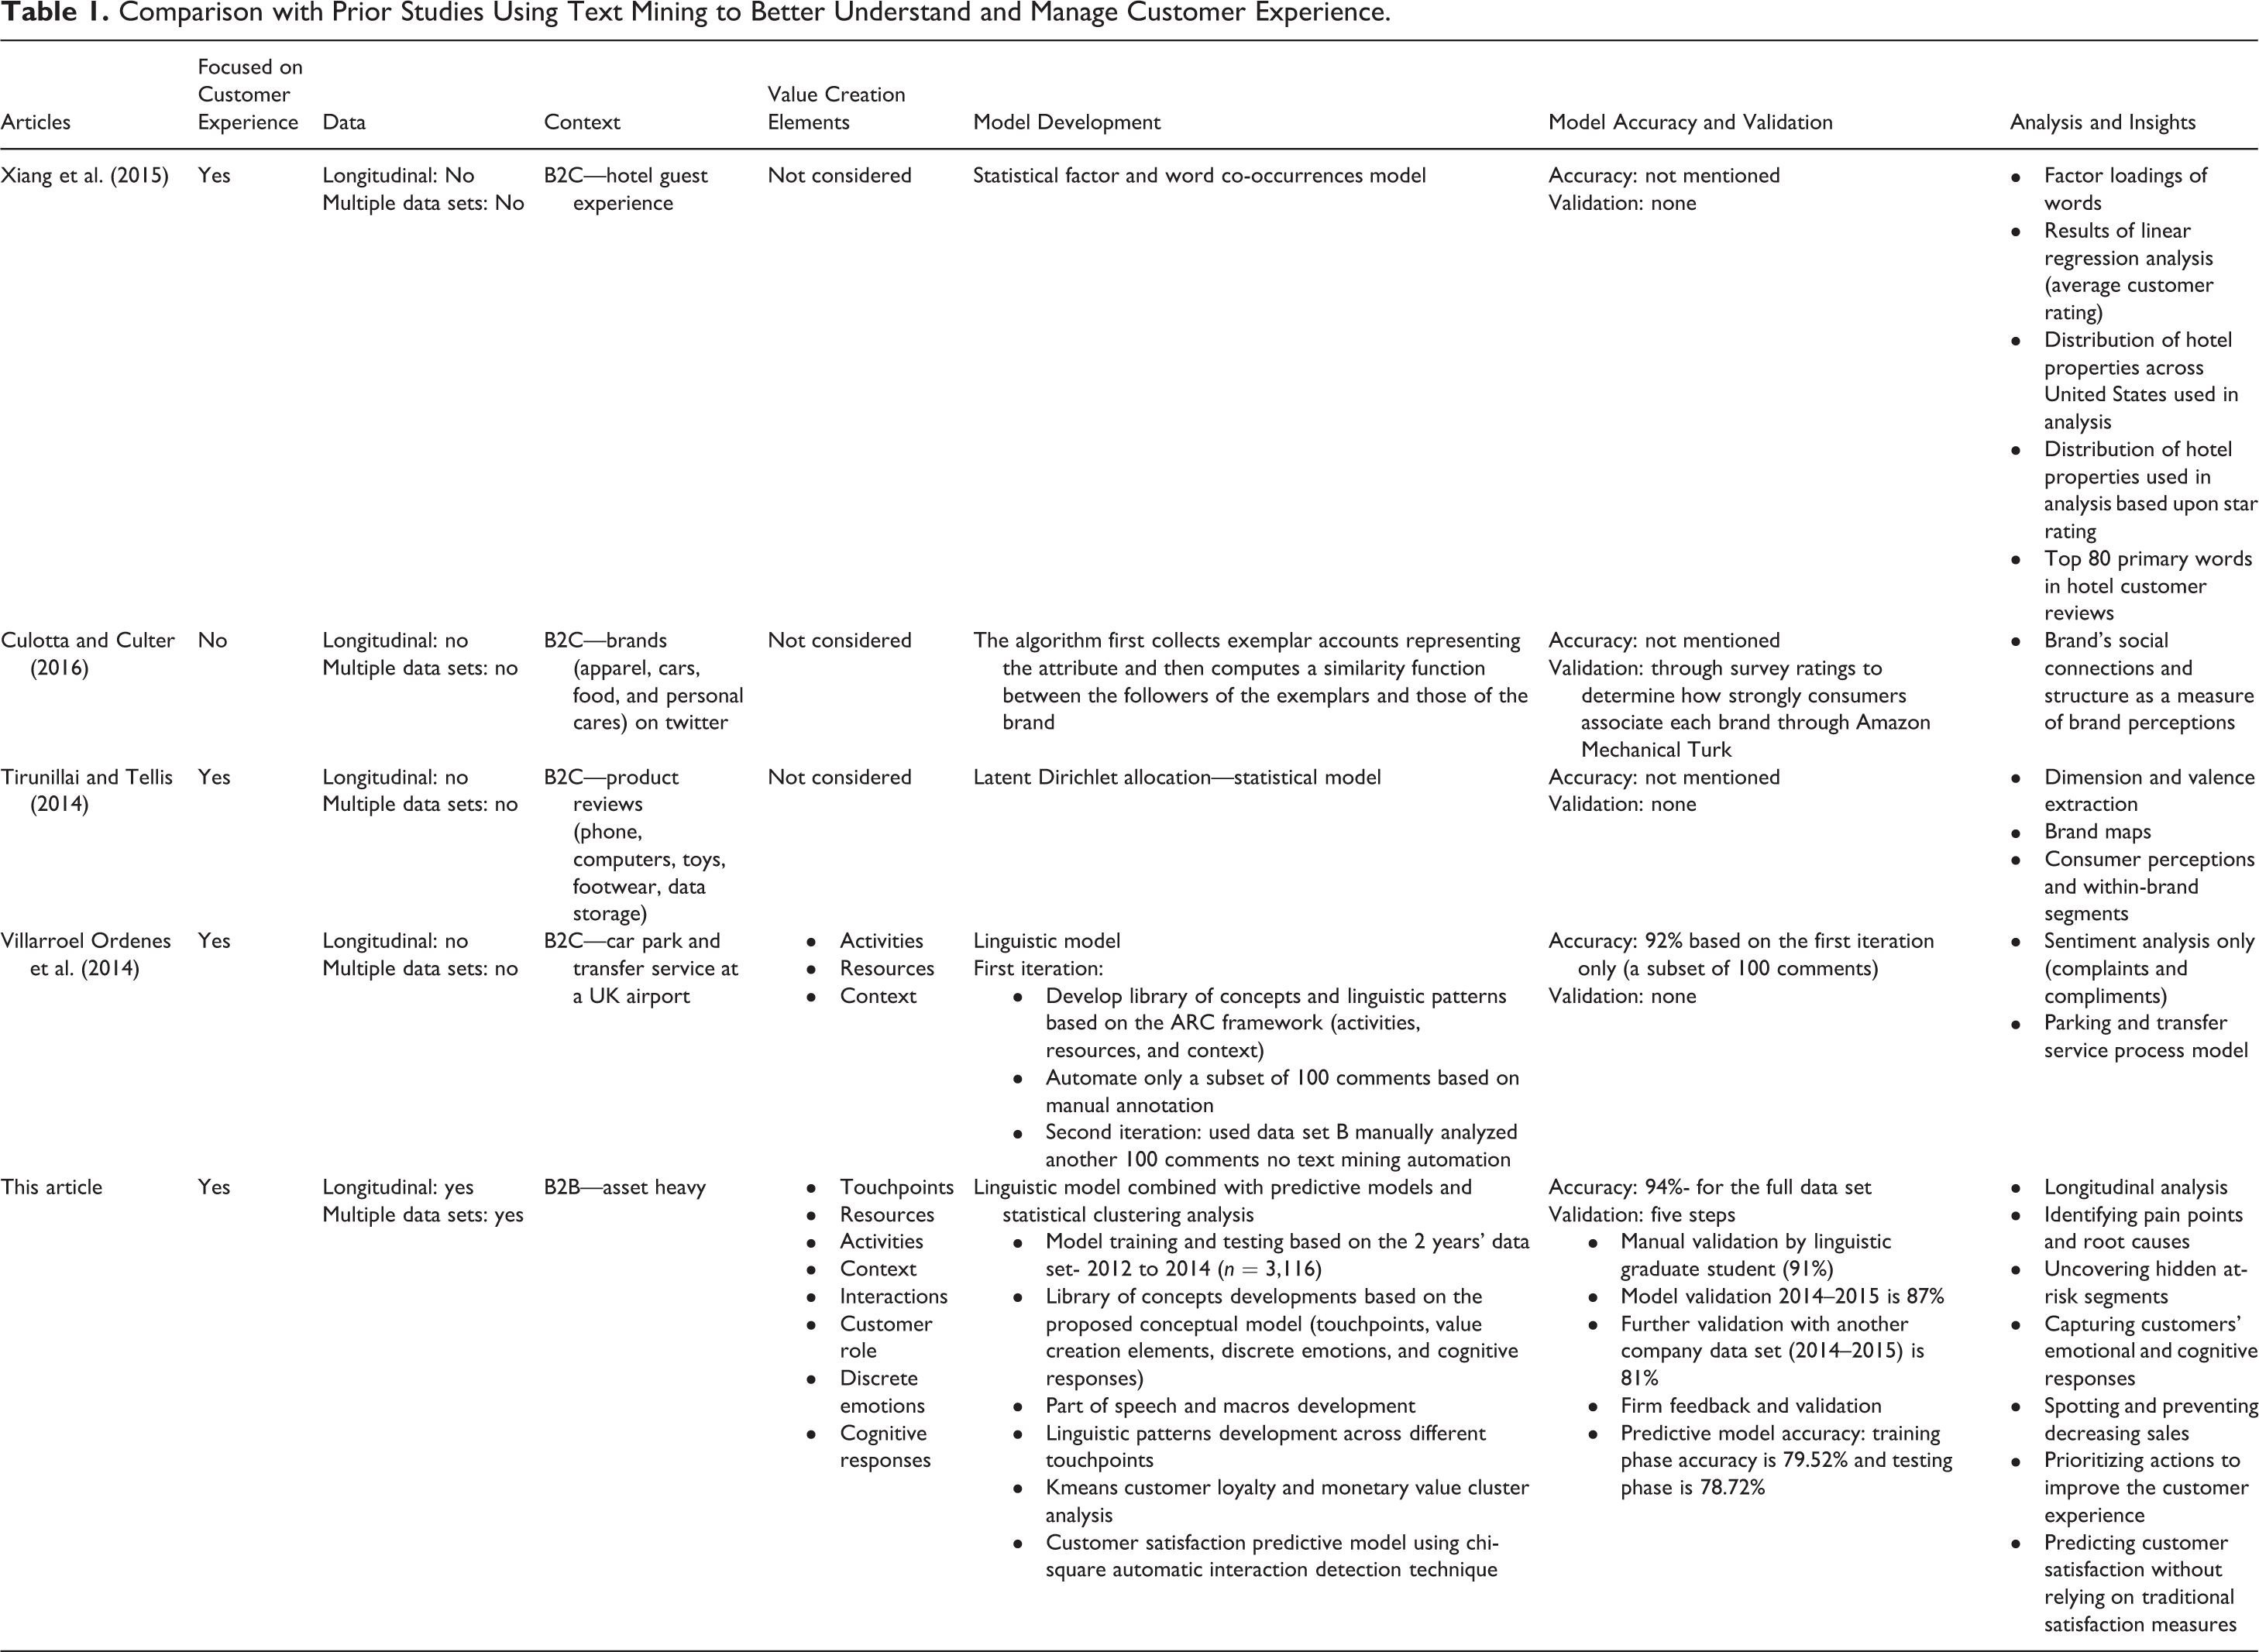
Large amounts of data, including textual data such as verbatim comments from customers, are now generated at many touchpoints in the customer journey. Open-ended feedback and user-generated content constitute excellent sources to mine meaning (Tirunillai and Tellis 2014) and gain insights into specific pain points along the customer journey. Text mining is well suited to extract customer opinions from unstructured comments and customer satisfaction data (Pang and Lee 2008) and assist in improving the CX. Although well established in information systems and computer science literatures (e.g., Schmunk et al. 2014), text mining is not yet mainstream in marketing. Limited examples include, for instance, Xiang et al. (2015) who applied text mining to customer reviews to understand the relationship between CX and satisfaction. Culotta and Culter (2016) used a social network mining model to analyze multiple Twitter data sets from B2C brands to structure a social connection analysis and determine how strongly consumers associate with each brand. Villarroel Ordenes et al. (2014) proposed a framework comprising three important elements of the CX, namely, (1) activities, (2) resources, and (3) context using a linguistics-based text mining approach to automate sentiment analysis in customer feedback of car park and transfer services at a UK airport. Their text mining model captured customer activities and resources, company activities and resources, and customer sentiment (complaints and compliments). The approach provides empirical evidence of how to use certain features of linguistics-based text mining, such as dictionaries and linguistic patterns to analyze textual customer feedback. However, their study is limited to three value creation elements with the sentiment analysis being confined to complaints and compliments for a single setting—parking and transfer service process. They report only model accuracy but stop short of providing model validation. Baxendale, McDonald, and Wilson (2015), by taking an integrated view of touchpoints, highlight the importance of understanding multiple touchpoints, interactions at the touchpoints, and modeling the valence of the customer’s affective response to the respective touchpoints. In addition to pointing out the importance of taking a multiple touchpoint perspective, recognizing interactions at touchpoints, and capturing emotions, an important contribution of Baxendale et al.’s study is the development and implementation of a new tool to collect real-time CX tracking for selected consumer goods.
Research into B2B CX is especially lacking. Clearly, more needs to be done to integrate past work, including providing a conceptual framework specifically linking a fuller set of value creation elements with emotions and cognitive responses at customer touchpoints to address these gaps and thus advance knowledge and practice. This is where we contribute. Table 1 summarizes the above text mining–based studies and where our work seeks to contribute. In the following sections, we develop our conceptual framework, describe the methodology, present the findings, and discuss implications for theory and practice, as well as providing directions for future research.
Comparison with Prior Studies Using Text Mining to Better Understand and Manage Customer Experience.
Conceptual Framework
Extending Prior Work
In this article, we significantly extend existing research by (1) offering a conceptual framework that integrates prior CX research, (2) demonstrating the usefulness of a novel, longitudinal CX analytic based on our conceptual framework that combines quantitative and qualitative measures, and (3) providing a step-by-step guide for implementing the approach in practice, highlighting what really matters to customers and what actions are needed by managers.
In line with Macdonald, Kleinaltenkamp, and Wilson (2016), McColl-Kennedy et al. (2012), and Lemon and Verhoef (2016), we take the view that customers create value with a firm through CXs, specifically by integrating resources at multiple touchpoints in context through activities and interactions. Following this research, we view the CX as consisting of value creation elements, customer discrete emotions, and customer cognitive responses at distinct touchpoints. Our approach employs a theoretically based, comprehensive set of value creation elements, together with customer emotional and cognitive responses around touchpoints appropriate to our focus on brand-owned postpurchase consumption (Lemon and Verhoef 2016) in B2B settings. Our conceptual framework is provided in Figure 1. Consistent with Court et al. (2009) and Lemon and Verhoef (2016), we define a touchpoint as an episode of direct or indirect contact with a firm, confining our investigation to brand-owned postpurchase consumption (Lemon and Verhoef 2016).
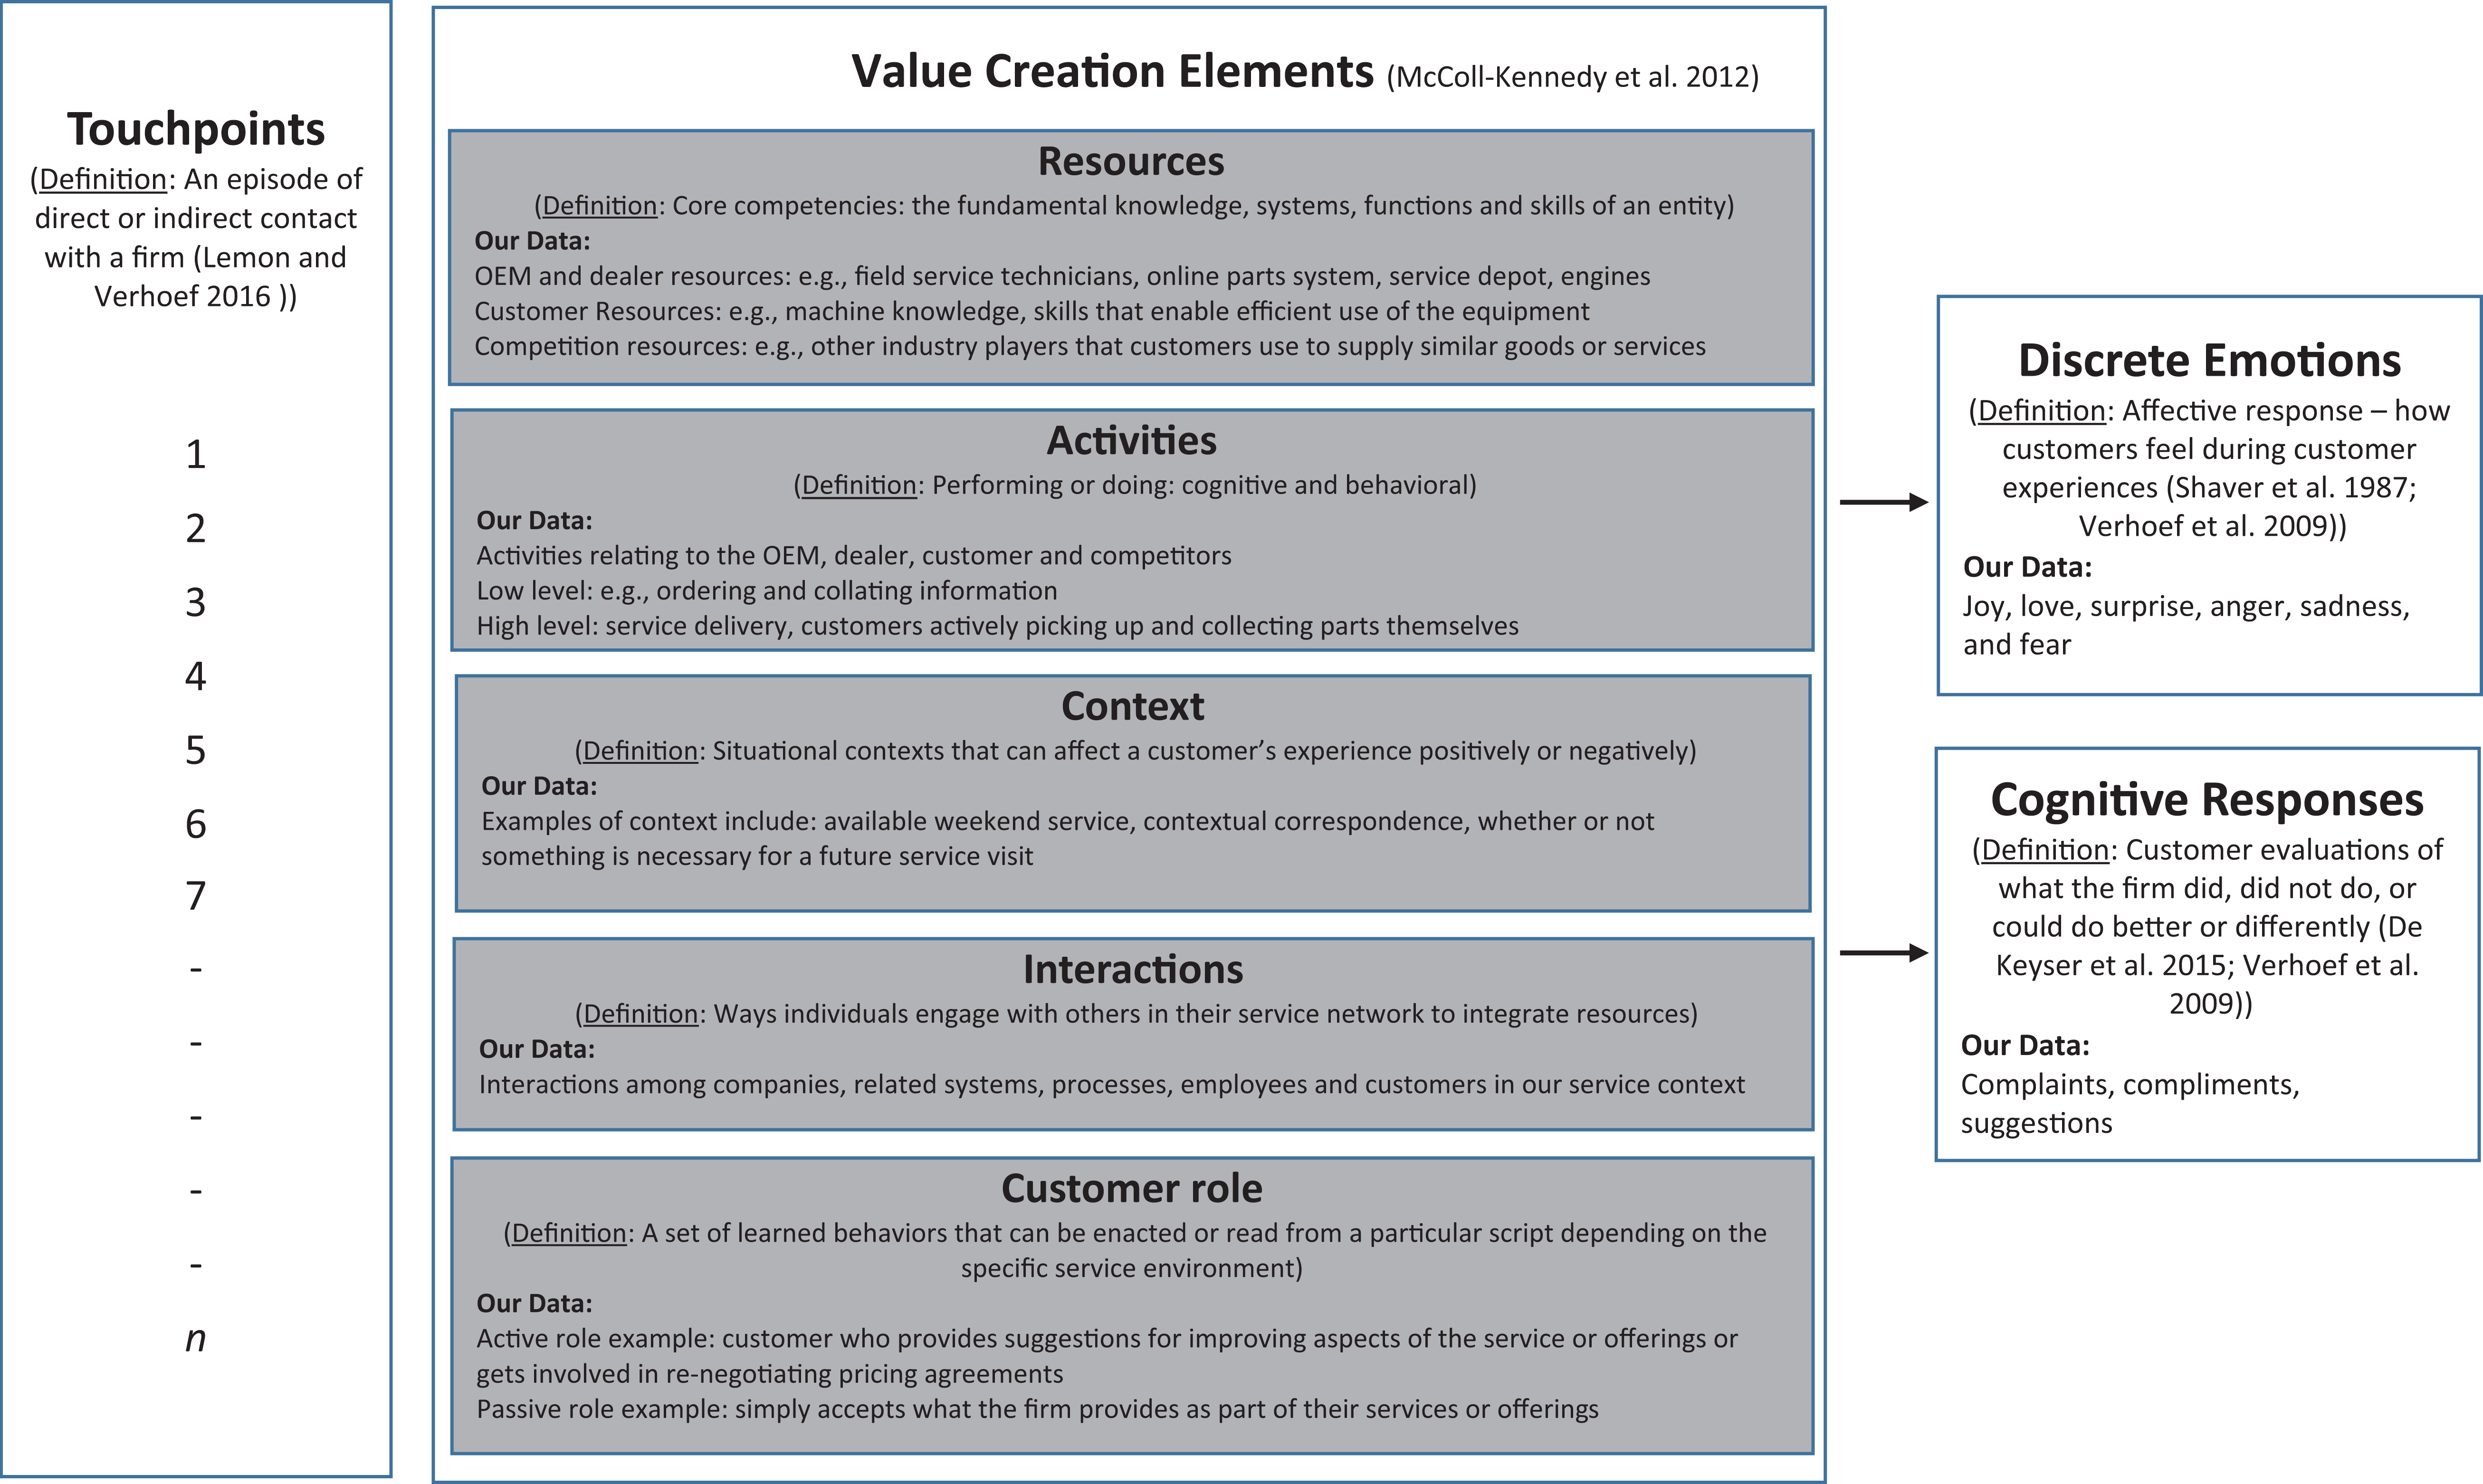
Conceptual framework.
Value creation elements
While Ordenes et al. (2014) identified three elements of value creation (activities, resources, and context), we extend this to five elements (resources, activities, context, interactions, and customer role), consistent with McColl-Kennedy et al. (2012). Resources are defined as core competencies, the fundamental knowledge, systems, functions, and skills of an entity (Macdonald, Kleinaltenkamp, and Wilson 2016; McColl-Kennedy et al. 2012, 2017; Vargo and Lusch 2008; Villarroel Ordenes et al. 2014). For a B2B company for example, such resources would include aspects such as company resources (sales people, service technicians, internal systems, etc.), customer resources (knowledge of products/equipment, skills that enable customers to efficiently use goods/services, etc.), and competition resources (such as other players in the industry that customers may use to supply similar goods and/or services). Activities are defined as “performing” or “doing” (cognitive and behavioral; McColl-Kennedy et al. 2012; Villarroel Ordenes et al. 2014). For example, activities would relate to the focal company, key suppliers, the customer, and competitors. For a B2B company, activities could range from simple (low level) activities such as ordering and collating information, to complex (high level) activities such as service delivery and customers actively picking up and collecting parts themselves. Context includes situational contexts that can affect a customer’s experience positively or negatively (e.g., availability of weekend service/delivery, necessity for future service visits). Previous research shows that value cocreation depends on the context in which the service is generated (Grönroos and Voima 2013; Villarroel Ordenes et al. 2014). Interactions are the ways individuals engage with others in their service network to integrate resources (McColl-Kennedy et al. 2012). The CX originates from a set of interactions between a customer and a product, a company, or part of its organization, which provoke a reaction (Gentile, Spiller, and Noci 2007). As highlighted by Baxendale, McDonald, and Wilson (2015), interactions with others are important in the CX. Indeed, the service literature has long recognized that customer evaluations of service experience are an outcome of interactions among companies, related systems, processes, employees, and customers in a service context (Bitner, Booms, and Mohr 1994). Customer role is defined as a set of learned behaviors that can be enacted or read from a particular script depending on the specific service environment (Solomon et al. 1985). In other words, the role of the customer role is a function assumed or part played by the customer in a given context. The customer role can vary considerably from very active to relatively passive (Chandler and Lusch 2015; McColl-Kennedy et al. 2012). Accordingly, we consider the role as being an active player or merely a recipient of a service. For example, a customer who provides suggestions for improving aspects of the service or product offerings or gets involved in renegotiating pricing arrangements would be classified as active, while a passive recipient simply accepts what the firm provides as part of their services and/or product offerings.
Discrete emotions
Emotions have long been associated with experiences going back to experiential theorists of the 1980s (such as Hirschman and Holbrook 1982; Holbrook and Hirschman 1982). Later work highlights the importance of how customers feel during CXs (e.g., De Keyser et al. 2015; Verhoef et al. 2009), sometimes referred to as affective response (e.g., Baxendale, Macdonald, and Wilson 2015; Verhoef et al. 2009) or discrete emotions (De Keyser et al. 2015). While it may be debated what the exact number of discrete emotions is, it is generally accepted that there is a relatively small number of basic emotions that are biologically determined, whose expression and recognition are essentially the same for all individuals, irrespective of culture (Izard et al. 1993). Many contemporary emotion theories agree on basic discrete emotions that usually include happiness (joy), surprise, anger, sadness, and fear (Shaver, Morgan, and Wu 1996). Drawing on Shaver et al.’s (1987) foundational work on discrete emotions, we incorporated six main emotions—joy, love, surprise, anger, sadness, and fear—and their respective subcategories in our conceptual framework.
Cognitive responses
Not only do customers experience emotions during interactions at touchpoints, customers also have cognitive responses (De Keyser et al. 2015; Verhoef et al. 2009). Customers make cognitive evaluations of what the firm did (i.e., compliments) or did not do but should have done (i.e., complaints). In addition, customers may think about what the firm could have done to resolve problems or to further improve the CX at a given touchpoint (i.e., suggestions). Cognitive responses help firms to identify root causes and specific opportunities for improvement. Such responses have been characterized as either “complaints” or “compliments” (cf. Knox and van Oest 2014) or “suggestions” (Villarroel Ordenes et al. 2014). The complaint category is defined as customer-initiated expressions of dissatisfaction with a firm (Knox and van Oest 2014; Landon 1980). The compliment category is defined as the “expressions of personal praise that indicate the degree to which someone or something is liked” (Herbert and Straight 1989, p. 37). In addition, Kraft and Martin (2001) defined positive feedback as a compliment taking the form of an acknowledgment or an expression of gratitude. The suggestion category is defined as an idea offered by the customer for improving the service (Villarroel Ordenes et al. 2014).
Taken together, our framework incorporates key elements of the CX, that is, value creation elements (resources, activities, context, interactions, and customer role) and both customer discrete emotions and cognitive responses at touchpoints. As we show in our Method and Results Section, we use this conceptual framework to identify pain points from the customer perspective and then map these onto specific root causes that represent key opportunities for improvement of the CX from the firm’s perspective.
Method
In this section, we demonstrate how to apply our conceptual framework using data mining and design science research methods (e.g., Chapman et al. 2000; Hevner et al. 2004). While several approaches to design science have been developed (e.g., Peffers et al. 2007), our methodology follows the established approach of Chapman et al. (2000) and Hevner et al. (2004). As outlined in Appendix A, we used a six step process. The first step was a business understanding phase to understand the complex, B2B heavy asset service that offers both physical goods and services. Second, we engaged in the data understanding phase. The third phase consisted of data sampling, as is typical in text mining, followed by proposing a solution for the annotation schema. Fourth, we applied the conceptual framework; fifth, we built our model in the model development phase. The suggested solution, development, and evaluation stages were iterative until they offered a reasonable version of the artefact (Vaishnavi and Kuechler 2005). The final (and sixth) phase model validation employed five different approaches described below in the model validation section.
Step 1: Business Understanding
We began with exploratory field research. This step involved first designing a protocol for the qualitative research. Second, we shadowed employees across all key touchpoints. Third, we conducted interviews with customers and employees. Throughout, we captured field notes, photographic records, and memos. Online Appendix 1 summarizes key findings from this exploratory (“business understanding”) phase.
Step 2: Data Understanding
The second phase involved the building and testing of our new CX analytic developed from the interrogation of a longitudinal CX survey data set spanning 2 years (n = 3,116; Appendix A). The survey data were administered by a third-party market research organization for the complex, B2B heavy asset service offering both physical goods and services with multiple touchpoints, with both the same and multiple customers, across multiple points in time. In order to develop and test our approach, we adapted and extended the linguistic text mining approach introduced by Villarroel Ordenes et al. (2014). We obtained 2 years of customer survey data based on 12 questions on overall satisfaction, repurchase, referral, resource availability, responsiveness, communication, service completion duration, preparation, service quality, invoice timeliness, and invoice accuracy. Customers rated each question on a 10-point scale from 1 to 10, where 10 is very satisfied and 1 is very dissatisfied. The final question was an open-ended question “Do you have any other comments or suggestions on how (NAME) could improve this service.” This free text question provided detailed, verbatim comments to which we apply our conceptual framework.
Step 3: Data Sampling
In order to develop our model, the first step was to take a random sample of 100 comments from the data set to use in the training stage (Singh, Hillmer, and Wang 2011). The 100 comments range in size from 246 to 255 characters to provide rich text for data understanding and pattern development. Examples of the initial “training set” of 100 comments are provided in Online Appendix 2. The second step was to split each comment into separate sentences. The third step was to employ two coders who independently classified each comment into discrete units of information, defined by Singh, Hillmer, and, Wang (2011) as phrases or sentences (ideas).
Step 4: Applying the Conceptual Framework
In Step 4, following established practice, the coders manually annotated each of the sentences based on our conceptual framework as illustrated in Figure 2. That is, (1) touchpoints were identified, (2) all value creation elements—resources, activities, context, interactions, and customer’s role were coded, as were (3) discrete emotions, and (4) cognitive responses. A judge was used when there was disagreement. Our approach is particularly effective in enabling rich insights as domain specificity is incorporated into the analysis (Bhuiyan, Xu, and Josang 2009). Many computer science and information systems studies focus primarily on algorithmic aspects of text mining and extracting information related to opinions or sentiments (Goldberg and Zhu 2006; Pang and Lee 2008). In contrast, our finer-grained approach enables text mining algorithms to capture specialized vocabulary used by customers and consequently is better at identifying pain points that matter to customers. The general linguistics-based text mining applications typically use external public resources, such as WordNet, the largest online database of English linguistic terms (http://wordnet.princeton.edu/; Villarroel Ordenes et al. 2014), which are likely too broad to capture important details that matter to customers (Bolton et al. 2014).

Applying the conceptual model.
Step 5: Model Development
In summary, we developed a text mining model (see Online Appendix 3) that involved importing corpus (2 years of customer survey data), extracting concepts based on manual coding used in the previous section and built-in analyzers and dictionaries. The model uses part of speech (POS) and developed patterns using macros and linguistic pattern rules applied to the conceptual framework. Then, we evaluated and, where appropriate, extended the dictionaries and defined new concepts, patterns, and text mining models, evaluated them, and extended them again. The text mining model is iterative. We extracted, reviewed the results, made changes, and then refined the model. The resulting patterns were then mapped to the root causes, which enable the firm to identify opportunities to improve the CX. We further developed a predictive model using the chi-square automatic interaction detection (CHAID) classification technique (Kass 1980; Magidson 1994) to predict whether customers are satisfied from the qualitative data without the use of traditional overall satisfaction measures (see Online Appendix 4).
Step 6: Model Validation
Following prior research, for example, Lebart (2004) and Singh, Hillmer, and Wang (2011), we undertook a five step validation of our model, namely (1) a manual linguistics validation, (2) a second data set validation, (3) a second firm validation, (4) feedback from the CX team at the focal organization, and (5) a CHAID analysis. The process is summarized in the Model Validation section of Appendix A and discussed later in the Model Validation Results section of our article.
Results: Insights That Matter
Consistent with our conceptual framework, the following section outlines our results providing insights for CX management in terms of (1) touchpoints, (2) value creation elements, (3) discrete emotions, and (4) cognitive responses. We show how these customer-centric insights link to the firm’s perspective through root causes, enabling the identification of specific opportunities to improve the CX. Table 2 summarizes the operationalization of our framework. Of particular note are the customers’ cognitive responses, as they provide in-depth evaluation of the service experience and what needs to be done to enhance it. However, we will first address the elements of our model based on our conceptual framework.
Linking the Results to Our Conceptual Framework.
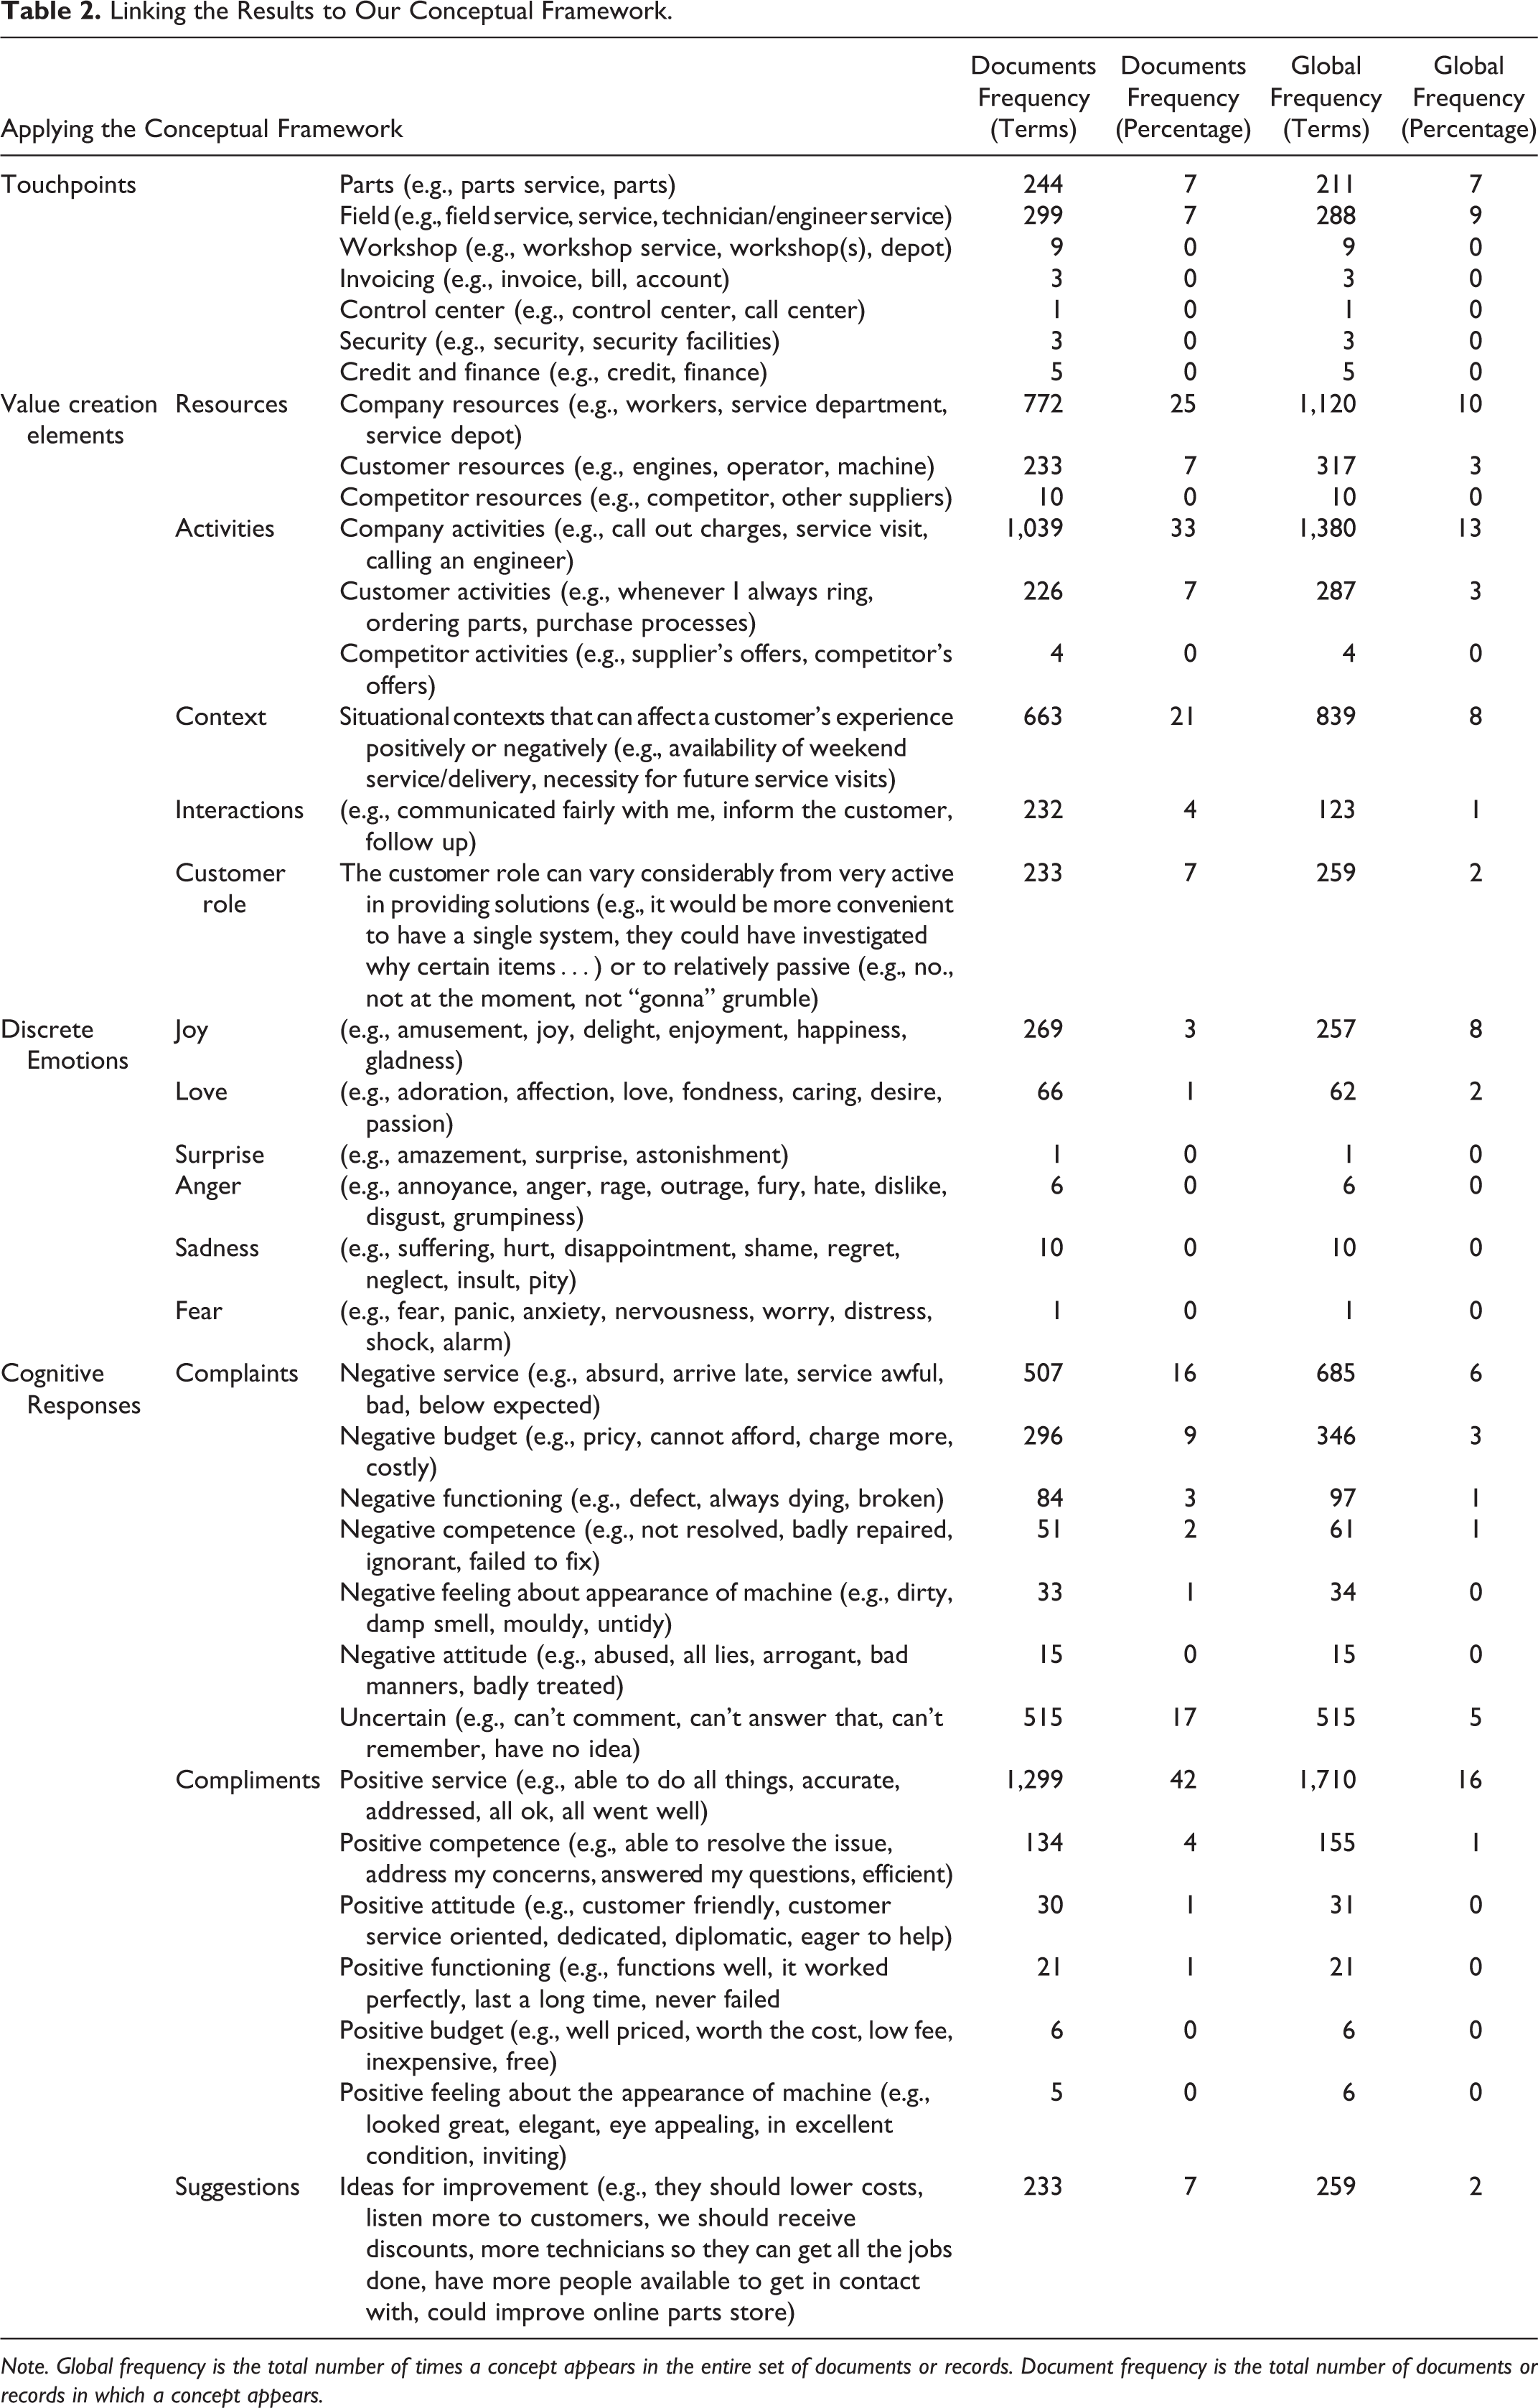
Note. Global frequency is the total number of times a concept appears in the entire set of documents or records. Document frequency is the total number of documents or records in which a concept appears.
Touchpoints
First, we were able to identify a full set of touchpoints, importantly, including touchpoints that customers viewed as critical, not merely those identified by the participant organization. As shown in Table 2, touchpoints are parts, field, workshop, invoicing, control center, security, and credit and finance. While parts and workshop were frequently mentioned by customers as critical touchpoints, customers also identified credit and finance as well as security. For instance, “For us as an end user, parts availability seems to be an issue and credit facilities seem to be very tightly controlled…” “When I go to [city name] to pick spare parts, the security guard just sits in the shed, why doesn’t the security guard come out and meet me to give me the relevant paperwork.” Taken as a whole, touchpoints account for 16% of all customer comments (global frequency).
Our model identifies touchpoints that are working well, working poorly, or need improvement. Allowing these opportunities for improvement in the CX to arise from the customer feedback itself provides a more customer-centric approach to prioritizing actions to improve the CX. Next, we discuss insights obtained from the value creation elements.
Value Creation Elements
Recall value creation elements consist of resources, activities, context, interactions, and customer role (McColl-Kennedy et al. 2012), illustrated in Table 2. Value creation elements account for the largest single category of customer comments at 40% (global frequency).
Resources
Our model enables deep insights into how customers work together with the firm to cocreate value, starting with what resources they have (customer resources such as, in our case, the engines, machines, the operators, e.g., field service technicians), what resources the firm provides (company resources such as, workers, service departments, and service depot), and comparisons with competitors (competitor resources). As shown in Table 2, customers focus on company resources (25%) in terms of document frequency, compared to customer and competitor resources.
Activities
Importantly, we can see what activities each party engages in, including activities of competitors. Company activities receive the greatest attention (33%), including, for example, call out charges, service visits, and so on. Customer activities accounted for 7%, “I ordered and paid,” “I ordered the parts,” “I did buy four new rims for the machine. I collected the rims,” “I buy a lot of equipment,” and “We downloaded the parts book instead of looking for it on the website.” Interestingly, comparisons with competitors are also made. For example, “We are currently seeking service contracts for our two machines and I’ll probably go with [competitor name] because they are more competitive in their pricing” and “we deal with a lot of suppliers [competitor names] but I would say [participant company] is the best.”
Context
The context in which the service is performed is also important to understand, receiving 21% frequency, as this can affect a customer’s experience either positively or negatively. Availability of servicing or parts delivery at the weekend received particular attention. For instance, “I’ve had problems with online orders, I cannot implement discounts online. It means I have to wait until the Monday if I needed to order over the weekend.”
Interactions
Another important area is interactions of the parties. Examples include how the customers view the way the firm communicated with them, communicating fairly or otherwise, how they inform the customer, and how they follow up with the customer. For example, “I had to chase a part. I wasn’t kept informed of when the part would arrive…need more communication. Weekly Updates.”
Customer role
The customer’s role can vary considerably from being very active in providing solutions to problems and working with the firm to coproduce a service. For example, in our data, several customers provided solutions to the current field risk assessment paperwork to produce more specific and effective assessment reports. For instance, regarding “the paperwork, when technicians come to site they carry out a field risk assessment. This is not ideal. The ones they come with are very generic and are reams and reams of assessments that don’t represent the jobs they’re doing.” On the other hand, a customer may see themselves as having a passive role merely accepts what the firm provides. For example, customers who were exhibiting a passive role commented “‘no idea,’ ‘not at the moment,’ ‘not gonna grumble.’”
Discrete Emotions
Our approach captures how customers feel identifying discrete emotions, including the key dimensions of joy, love, surprise, anger, sadness, and fear, as shown in Table 2 (10% global frequency). For example, positive emotions of joy and love were expressed in terms of affection and fondness of the brand and service. “We are quite delighted with the service” and another said “I’m delighted with the service,” and another said, “I enjoy working with [Company name],” and another “We are very happy with the service.” We see sadness also expressed, for instance, “Well, this is the first time I bought from [participant company’s] machines. I was very disappointed, that after I bought the two new machines we set up a contract for [participant company] to do servicing on them, I thought they had done the servicing, but they hadn’t.” Further, another customer mentioned “While the machine was in for service, a fan belt was changed. Since then, the fan belt has changed 3 times. The fan belt is still not working. I am disappointed with my service from them” and “no hydraulic van on site any more which is a shame.” Fear was evident in the following statement that “the after sales team for products is shocking. If you buy an attachment no one knows the parts, no one follows up to see if you are satisfied.” Anger was expressed by customers, for example, “I was annoyed…with [the] poor service and communication,” “The cost is outrageous, if I would know that it would have cost that much I wouldn’t have done it as it cost me half the value of the machine.” Another customer lamented, “I was annoyed with the poor service and communication,” and another said, “I get annoyed ordering parts because it means I have equipment not working.”
Cognitive Responses: Linking Customer-Centric CX to the Firm’s Perspective through Root Causes
Recall that cognitive responses (35% global frequency) are conceptualized as customers providing evaluations of what the firm did, did not do, or could do better or differently (De Keyser et al. 2015; Verhoef et al. 2009), through complaints, compliments, and suggestions (see Figure 1).
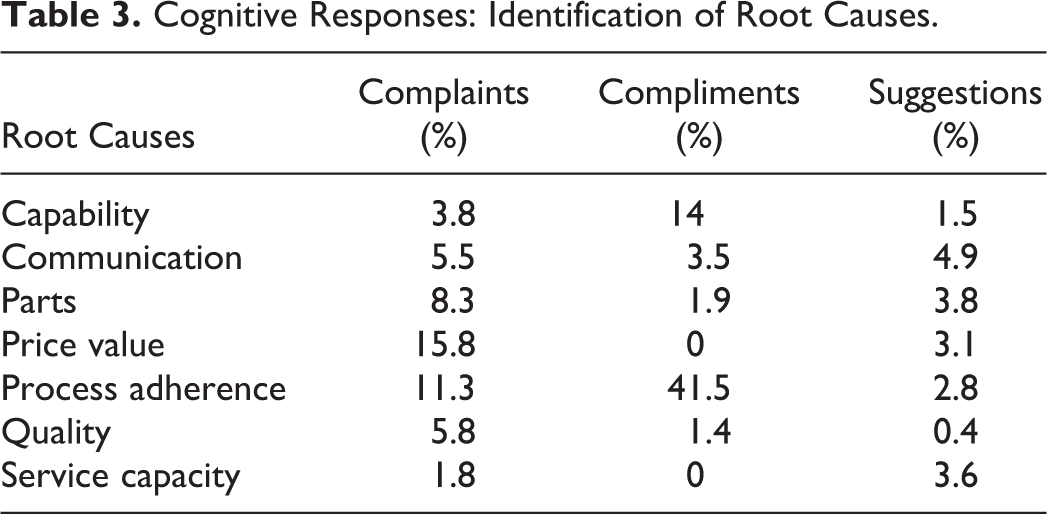
Our model provides insights into the CX across the different touchpoints, value creation elements, and discrete emotions, pinpointing which particular aspects of the experience received the most customer complaints, compliments, or suggestions, respectively (Table 3). These aspects of the experience that customers appear to attend to the most in their cognitive responses represent specific issues that (may) require attention. We call these distinct areas requiring attention root causes. Root causes, in essence, enable the translation of our customer-centric CX framework into the firm’s perspective so that needed changes can be implemented. The root cause will incorporate specific elements of value creation at relevant touchpoints, potentially from each of the individual value creation elements, as shown in Figure 2, but using the firm’s terminology and functions. For example, the “parts” root cause will have aspects of resources (online parts system), activities (customers picking up and collecting parts), context (availability on weekend), interactions (customers engaging with employees to get the parts), and customer role (active or passive). Thus, firms can directly operationalize our customer centric CX framework through root causes. The seven root causes identified from the analysis are as follows: capability, communication, parts, price value, process adherence, quality, and service capacity. In the section that follows, we discuss the specific root causes identified (as mentioned most often) from the distinct cognitive responses—complaints, compliments, and suggestions.
Cognitive Responses: Identification of Root Causes.
Complaints
The highest percentage of complaints are, respectively, from the following root causes: price value (15.8%), process adherence (11.3%), parts (8.3%), quality (5.8%), and communication (5.5%), respectively. The most common complaints center on price value, illustrated in the following customer comments “Some of their prices are ridiculous,” “labor and parts are too expensive,” and “every time they come out it’s over US$1,000.” The verbatim comments suggest that process adherence, specifically in field service, is also a problem. For example, “It always takes two, and sometimes three visits for them to fix the problem”; “This is not ideal. The ones they come with are very generic and are reams and reams of assessments that don’t represent the jobs they’re doing.”
Importantly, customers who give very high overall satisfaction scores still complain. The key root causes were identified as price value (12.8%), followed by process adherence (6.3%) and parts (5%). For example, regarding price value, customers commented, “value for money was poor for what we got,” “Reduce cost, the cost is horrendous, out of 10—zero,” and “Callout fees are too dear.” Concerns around process adherence focused on technician availability, waiting too long to be serviced, and the cancellation of many service visits. For instance, “we booked the service and it was cancelled a couple of times due to the technician’s availability,” “maybe one or two more technicians so we don’t have to wait for the servicing too long,” and “the service visit was cancelled 3 times before the technician actually came.” Parts availability and delivery service were concerns for loyal customers (5.0%). For example, as one customer commented, “very busy, struggling for a time, weren’t very quick placing the order and getting back to me, availability of parts was a struggle.”
Compliments
The model highlights compliments focused on specific aspects of the CX. For example, 63.8% of customers giving overall satisfaction scores of 9.5 and greater are happy with the overall process adherence, as evidenced by the following “compliment” comments “they’ve been good up to now, they do a good job”; “I am pretty happy overall I mean they come out and do the service that we ask for so I couldn’t really ask for more than that.” Furthermore, 10.2% complimented the firm on the engineers’ capabilities, especially their attitude, manner, professionalism, and technical knowledge. For example, “Both engineers were absolutely excellent. They arrived on time and date as promised. They completed the work on schedule. And we are very happy with the job they did.” Just under 3% complimented the firm on its communication. For example, “I’m very pleased with the service. The engineer liaised with me regularly. Showed me items which were faulty. Kept me informed.” Parts were another source of compliments (1%). For example, “There were just some keys and they arrived the next day, was perfect all good”; “No I don’t think so, we find them very good, it’s excellent.”
Suggestions
Our analytic identifies customer suggestions for improving specific aspects of the CX. Interestingly, the largest category of suggestions from customers giving 9.5 or greater is around price value. For example, many customers asked the firm to apply discounts at the different touchpoints, especially in field visits: “Reduce the initial fixed cost of calling an engineer. In my opinion, it is too excessive, I think the parts purchase should be cheaper because we purchase a lot from the company. These customers also suggested improvements in parts service. For example, “The technicians should have a good stock of lubrication oil in the van.” Also, customers suggested improvements to the online parts store. For example, “Could improve online parts store if the item is not available. Change contact dealer to where the availability of the part is and you don’t have to call.” Some customers suggested an increase in the stock level of parts in some depot locations. For parts delivery, customers suggested, “They should do more deliveries on the same day instead of just one.” Service capacity was another area for improvement, especially in manpower: “More technicians so they can get all the jobs done, some weekends there are a lot of jobs and there aren’t enough people to do it”; and “have more people available to get in contact with.”
Overall, our analyses enable firms to identify specific areas of the CX that need improvement. The model enables firms to link customer-centric CX elements from the conceptual framework (identified as potential pain points) to specific firm functions and jobs (identified as root causes) to take specific actions—within specific areas of the firm—to strengthen the CX.
Combining Quantitative and Qualitative Measures: Identifying a Hidden Segment of Customers at Risk of Leaving
Not only can our model provide insights into how customers evaluate the experience through cognitive responses and identify root causes as opportunities for improvement, it is also able to uncover customers who do not value the experience and are at risk of leaving the firm, even customers who give high satisfaction scores. The firm categorizes its customers based upon their responses on the satisfaction score as: “loyal” (9.5 and above), “vulnerable” (7.0–9.4), and “at risk” (<7.0). The status of many customers changed over the time period. For example, Customer A responded 47 times to the survey (26 times categorized as “loyal,” 19 as “vulnerable,” and twice as “at-risk”). Customers H and I were both categorized 8 times in the “vulnerable” category and 6 times as “loyal.” These customers would be seen by the firm as satisfied and therefore not identified by the firm as requiring attention, yet they are clearly voicing their concerns in the comments. Customer H laments, “I would like someone from [participant company] to read the comments in this survey and come out and inspect the machine and discuss it because I’d asked for an extended warranty on the machine because it wasn’t right for several months….” This suggests a heretofore unidentified segment of customers that is at risk of leaving because the firm is not responding to their complaints. Even small details can make a difference if they are considered important to the customer (Bolton et al. 2014), providing a much more nuanced and potentially proactive view.
Indeed, our analysis shows that 42% of customers who give scores of 9.5 and above actually complain and 17.2% provide suggestions for improvement. Many so called “vulnerable” customers who give scores between 7 and 9.4 provided complaints (44%) or suggestions (41%), while only 27% provided compliments. Interestingly, the so-called at-risk customers who gave scores of less than 7 do not tend to provide complaints. Only 15.3% of the comments provided by these “at-risk” customers are complaints, whereas 17.2% are suggestions. Surprisingly, 14% of “at-risk” customers provide compliments while scoring the overall experience below 7.
To further explore this issue, we built six clusters using k-means based on satisfaction scores, the monetary value of the customers, and whether “Alerts” were raised by the firm. (Alerts are when the firm identifies a problem with the CX, measured when the overall satisfaction score is less than 7, and takes steps to address the problem.) Interestingly, complaints made by customers who gave satisfaction scores of 7 or greater are ignored, despite these two groups being worth an average of US$250,997 and accounting for 54% of the average sales. Close inspection of sales figures shows that when concerns are not addressed, sales went down significantly. For instance, an individual customer’s sales went down from US$226,884 to US$1,840. Over the 2 years, the customer complained about the technicians yet the company did not respond to his comments or even identify it as a priority to be addressed. (Our model enables firms to predict customer satisfaction without actually having to measure overall customer satisfaction directly. We illustrate this process in Online Appendix 4.)
Using quantitative measures alone masks the underlying concerns, compliments, and suggestions for improvement. Over 90% of customers in the sample were giving overall satisfaction scores of 8.5 of the 10 or greater yet, for 90% of these customers, their open-ended comments actually focused on complaints on specific elements from our framework where the firm is not performing well. However, because the scores are viewed as high by the firm, they did not examine the comments or follow up on specific requests and complaints made. Such an approach masks underlying issues. These examples clearly show that relying solely on the quantitative measures fails to provide important insights into the pain points for the customer. Combining the quantitative measures and qualitative measures is essential to a deeper understanding of the CX. Finally, Online Appendix 5 shows that satisfaction results from open-ended responses are not always consistent with overall satisfaction measures, suggesting firms may be missing key underlying issues by using only quantitative measures.
Model Validation Results: Robustness Checks and Generalizability
We validated the results of our model in five ways: (1) manual linguistics validation, (2) a second data set validation, (3) a second firm validation, (4) feedback from the CX team at the focal organization, and (5) CHAID analysis to examine the classification power of our model.
First, we employed a linguistic graduate assistant to manually check and validate the text mining model output. Following Singh, Hillmer, and Wang (2011), we adopted a deductive approach to the manual validation using template analysis. The coder was given detailed instructions on the coding scheme, including a training exercise to manually code 30 random comments from the 100 already coded comments. The coder compared the text mining output and checked each comment identifying whether the text mining model mapped the comments correctly to a relevant root cause. A high level of accuracy was achieved with 87% of complaints being accurately assigned, 91% of suggestions, 90% of compliments, and 97% of neutral comments. Overall accuracy of the root causes is 91%. This validation suggests that the model is working well.
Second, we ran the model again on a new data set of 1,060 comments for a further complete 12 months of data from the same organization (2014–2015). The validation stage resulted in the automated capture of linguistic patterns in 940 comments from the entire data set of 1,060 comments. The analysis confirms that the highest percentage of pain at the touchpoints (translated to root causes) are price value (10.2%), process adherence (3.1%), parts (2.3%), and communication (1.7%), respectively. The lowest percentage root causes are quality (1.0%), capability (0.5%), and service capacity (0.4%). Although the communication root cause percentage is lower in the 2014–2015 data set compared to the 2012–2014 data set, customers are still highlighting issues in communication, especially when it comes to telephoning the company.
Third, we ran the model with a new data set from a different B2B heavy asset firm (n = 1,807; 2014–2015) to validate the model’s performance and demonstrate its robustness. The model captured 1,478 comments from the entire data set of 1,807 comments. Furthermore, the model automatically identified the root causes, which are price value (14.4%), parts (5.4%), process adherence (4.8%), and communication (1.7%). This analysis suggests that our tool is transferable to another firms’ CX data sets.
Fourth, we sought feedback from the firm’s CX team about the usefulness of our model. The response was resoundingly positive. The CX manager noted, “Applying this model would allow us to analyze customer feedback on a yearly basis. This will make us understand how the comments are changing over time. The model has many details and it is insightful. It has good accuracy.” Further, the service director observed, “This is a really great model to understand our priorities to deliver better CX.”
Finally, we examined the classification power of our model using the CHAID technique (Kass 1980; Magidson 1994) in the two phases of analysis (training and testing). We used two separate metrics to evaluate our predictive model: (1) coincidence matrices (for symbolic or categorical targets), which show the pattern of matches between each generated (predicted) field and its target field for categorical targets, and (2) performance evaluation which shows performance evaluation statistics for models with categorical outputs. This second statistic, reported for each category of the output field(s), is a measure of the average information content (in bits) of the model for predicting records belonging to that category. It takes the difficulty of the classification problem into account, such that accurate predictions for rare categories will earn a higher performance evaluation index than accurate predictions for common categories. Our model is accurate across both stages; however, there is a slight decrease in the percentage of error in the testing phase (78.7%) compared to the training phase (79.5%). We used Morrison’s (1969) proportional chance criterion (Cpro = 71%) to benchmark and evaluate our model’s accuracy results. Our model outperformed Morrison’s proportional chance criterion by 7%.
Managerial Implications
Our findings have several important implications for firms. Below is a step-by-step guide for practitioners to follow to put our model into action. To do so, practitioners should ask the following five questions: (1) What do managers need to consider when seeking to manage CX from the customer point of view?
Firms should start from the customer perspective when attempting to manage the CX. To do so, firms can apply our customer-centric conceptual framework that integrates prior CX research and recognizes that customers create value with a firm by integrating resources at multiple touchpoints through activities and interactions. We recommend that firms focus on understanding the value creation elements (resources, activities, context, interactions, role), customer discrete emotions, and customer cognitive responses at distinct touchpoints.
(2) What data do practitioners need to collect in order to manage CX?
Practitioners should collect both qualitative and quantitative data from various sources such as surveys, social media, and CRM to acquire a holistic view of the CX. Considering only the quantitative score without taking into account qualitative verbatim comments is misleading, as relying on the quantitative score alone may lead a firm to view customers giving high scores to be happy when in fact a considerable number (e.g., 42% in our study) are complaining. Numeric scores are easy to obtain, compare, and turn into impressive looking graphs, but they provide only limited insight into underlying concerns and/or suggestions for improvements. Certainly, manually analyzing verbatim comments is time-consuming and difficult due to the sheer numbers of comments, and it is easy to miss important details. This is where our text mining model can help.
(3) How do I build a text mining model to capture details that matter?
We recommend that practitioners apply our linguistics-based text mining model development approach (set out in Online Appendix 3). Specifically, practitioners need to first train the machine using a random sample of, for example, 100 comments from the full data set. The 100 comments range should be representative and provide rich text for data understanding and pattern development. It is important, as a first step, that coders manually analyze and make sense of these 100 comments. Second, practitioners should employ sentence-level analysis to extract insightful information about the CX journey based on our conceptual framework (i.e., touchpoints, value creation elements, discrete emotions, and cognitive responses; see Figure 2). Third, a detailed domain-specific library is recommended to build a specialized vocabulary that is used by the customers. Build the library of terms and group them according to the conceptual framework concepts we proposed. We suggest that the POS technique be used to deal with language ambiguities and macro development to include “literals” or “word strings” that are important to the analysis while excluding others that are irrelevant, all of which is easily doable in practice. We recommend using the linguistic patterns development to automatically map the customers’ terms to the touchpoints, value creation elements, discrete emotions, and cognitive responses and to map these to the root causes that will enable firms to identify opportunities for improvement.
(4) What are the insights practitioners need in order to manage their customers’ experience journey?
We suggest six main benefits that practitioners can extract from the model to better manage the CX journey. (1) Extract rich insights: by focusing on textual data from individual customer feedback, practitioners can extract rich insights about the respective touchpoints from the customer’s perspective, identifying which touchpoints are working well and those requiring attention. (2) Identify root causes: Practitioners can extract deep insights into how customers cocreate value with them through the identified value creation elements (resources, activities, context, interactions, and customer role) and can translate these customer insights into specific aspects of the firm’s offering that need to be addressed (root causes). (3) Uncover a hidden at risk segment: Firms can use longitudinal analysis to uncover a hidden customer segment at risk of leaving the firm (that without such analysis would be deemed very low risk) and identify actions needed to repair the relationship. Further, spotting when a customer has slipped to a lower category (satisfaction level, or NPS score) and who is likely to defect allows a firm to intervene to avoid losing that customer and can provide additional insights into the health of the overall customer base. (4) Capture customers’ emotional and cognitive responses: Firms should capture how customers feel about the service through discrete emotions. In addition, they should extract cognitive responses, conceptualized through customer evaluations (e.g., complaints, compliments, and suggestions). (5) Spot and prevent decreasing sales: Further, firms can segment customers based on their “alerts” and monetary value. When concerns are not appropriately addressed, sales are likely to decrease; thus, this analysis can help spot (and potentially prevent) decreasing sales. (6) Prioritize actions to improve CX: Finally, firms can use these insights to diagnose the underlying factors causing pain for customers and then prioritize which root causes need attention. This enables managers to develop strategies and specific actions to reduce the pain and to improve the CX. Actions might need to be codified and automated to expedite the recovery process.
(5) Can firms predict customer satisfaction without relying on quantitative measures?
The answer is yes. Practitioners can follow the process outlined in Online Appendix 4 to calculate customers’ sentiment scores for each comment, then use a binning technique (±1 mean and standard deviation) to categorize comments into main three categories: satisfied (C_score = 1), complainer (C_score = −1), and neutral (C_score = 0). We recommend the CHAID technique to build the classification model. The model could use, for example, the following predictive variables (such as region, store name, dealer division, complaint root cause categories, compliment categories, and suggestion categories in our example) to predict whether customers are satisfied, neutral, or a complainer. Further, firms should consider designing a short version of their quantitative customer survey and rely more on qualitative measures to capture the customer’s voice. Having a smaller number of questions could increase the customer response rate and result in finer-grained analysis and deeper insights into customer voice. Not only is this likely to result in greater accuracy, there would also be time savings as this can be undertaken automatically through machine text analytics.
Theoretical Contribution
Our work contributes to understanding and managing CX in several important ways. First, we provide a conceptual framework that integrates prior research in CX. We view the CX as consisting of value creation elements (resources, activities, interactions, context, and customer role), discrete emotions (joy, love, surprise, anger, sadness, and fear), and cognitive responses (complaints, compliments, and suggestions) at touchpoints. Consistent with taking a customer perspective, we build on foundational research in value creation by McColl-Kennedy et al. (2012) with later work by Macdonald, Kleinaltenkamp, and Wilson (2016) who highlight the importance of interactions at touchpoints and context, foundational work by Verhoef et al. (2009), and later work by Lemon and Verhoef (2016) that highlights the importance of both emotions and cognitive responses at the various touchpoints. We underscore the importance of viewing the CX as a journey, comprised of multiple (often complex) touchpoints over time.
Second, we illustrate how our conceptual framework can be applied in practice. We demonstrate the usefulness of a text mining model that combines qualitative and quantitative data, addressing Marketing Science Institute’s (2014, 2016) call for research into measuring and understanding the CX that combines qualitative and quantitative measures by developing and validating a novel CX analytic. Further, we demonstrate how to make sense of structured and unstructured big data that was foreshadowed as an important area to be addressed by Rust and Huang (2014).
Third, our data analytics tool enables organizations to better understand and manage the CX. We demonstrate that our tool is robust, accurately predicting across data sets of multiple touchpoints in complex B2B settings, offering more than existing tools. As summarized in Table 1, our model, for example, in contrast to Xiang et al. (2015), Tirunillai and Telliis (2014), and Villarroel Ordenes et al. (2014), is longitudinal, uses three data sets, and employs five forms of validation. In addition, our work is focused on postpurchase consumption in B2B settings, an especially neglected area. As such, we show that our study addresses critical gaps identified in our literature review section.
Further, we provide step-by-step guidelines for practitioners demonstrating how our analytic helps them identify pain points, prioritize and monitor them through root causes, and importantly, identify where to focus resources to adapt and potentially redesign the CX at problematic touchpoints, focusing on what really matters to customers and what actions need to be taken by managers. The deep insights gained from our approach should enable a fuller understanding of the complexity of CXs and ways to better manage the CX.
Future Research
To conclude, our study provides a solid platform for better understanding the CX. The complex B2B service setting selected for the study provides an excellent context for applying our conceptual framework. However, we encourage future research to further apply our conceptual framework and our step-by-step guidelines for implementation of our model in other service contexts. While our model captures emotions, future research should be undertaken to explore in more depth the little understood emotions of fear and sadness especially in B2B contexts. We used the customers’ own words to capture discrete emotions. However, future research could investigate the use of wearable or mobile technology to capture how customers are feeling at the various touchpoints in real time.
While we applied the conceptual framework using a complex data set and validated our model using a second full year of data and then with another organization’s data set, it would be interesting to continue to monitor CX over time and across the various touchpoints, noting where redesign of touchpoints resulted in further enhanced CXs and if certain redesigns resulted in only minor improvements in perceptions of the CX. Investigating how much effort was expended by the firm to adapt touchpoints vis-à-vis the reduction in customer effort required would be an interesting question for both theory and practice. Multinational organizations collect customer feedback in different languages other than English, and thus, future research should test our approach with other languages and better understand how different cultures report their emotions, cognitive responses, and value creation elements across touchpoints. Further, we encourage research into B2B settings with multiple transactions disentangling Lemon and Verhoef’s (2016) key phases of prepurchase—purchase—postpurchase during the customer journey.
This study employs a six step process following the established prior data mining and design science approaches of Chapman et al. (2000) and Hevner et al. (2004). Future research should consider employing the evaluation methodology suggested by Peffers et al. (2007). Their evaluation method involves implementing the solution in a firm to observe and obtain quantifiable measures of how effective the proposed model is in practice (e.g., measured by increased customer satisfaction or response time; Peffers et al. 2007).
In sum, our research represents a crucial first step to better understand, manage, and improve CX by offering a conceptual framework that integrates foundational work in CX. We demonstrate how our model can be applied in practice and provide step-by-step guidelines for implementation to practitioners. We encourage both researchers and practitioners to continue work on this important topic.
Supplemental Material
Supplemental Material, JSR_16-275_Web_Appendix_supplementary_material - Gaining Customer Experience Insights That Matter
Supplemental Material, JSR_16-275_Web_Appendix_supplementary_material for Gaining Customer Experience Insights That Matter by Janet R. McColl-Kennedy, Mohamed Zaki, Katherine N. Lemon, Florian Urmetzer, and Andy Neely in Journal of Service Research
Footnotes
Appendix A
Research methodology overview.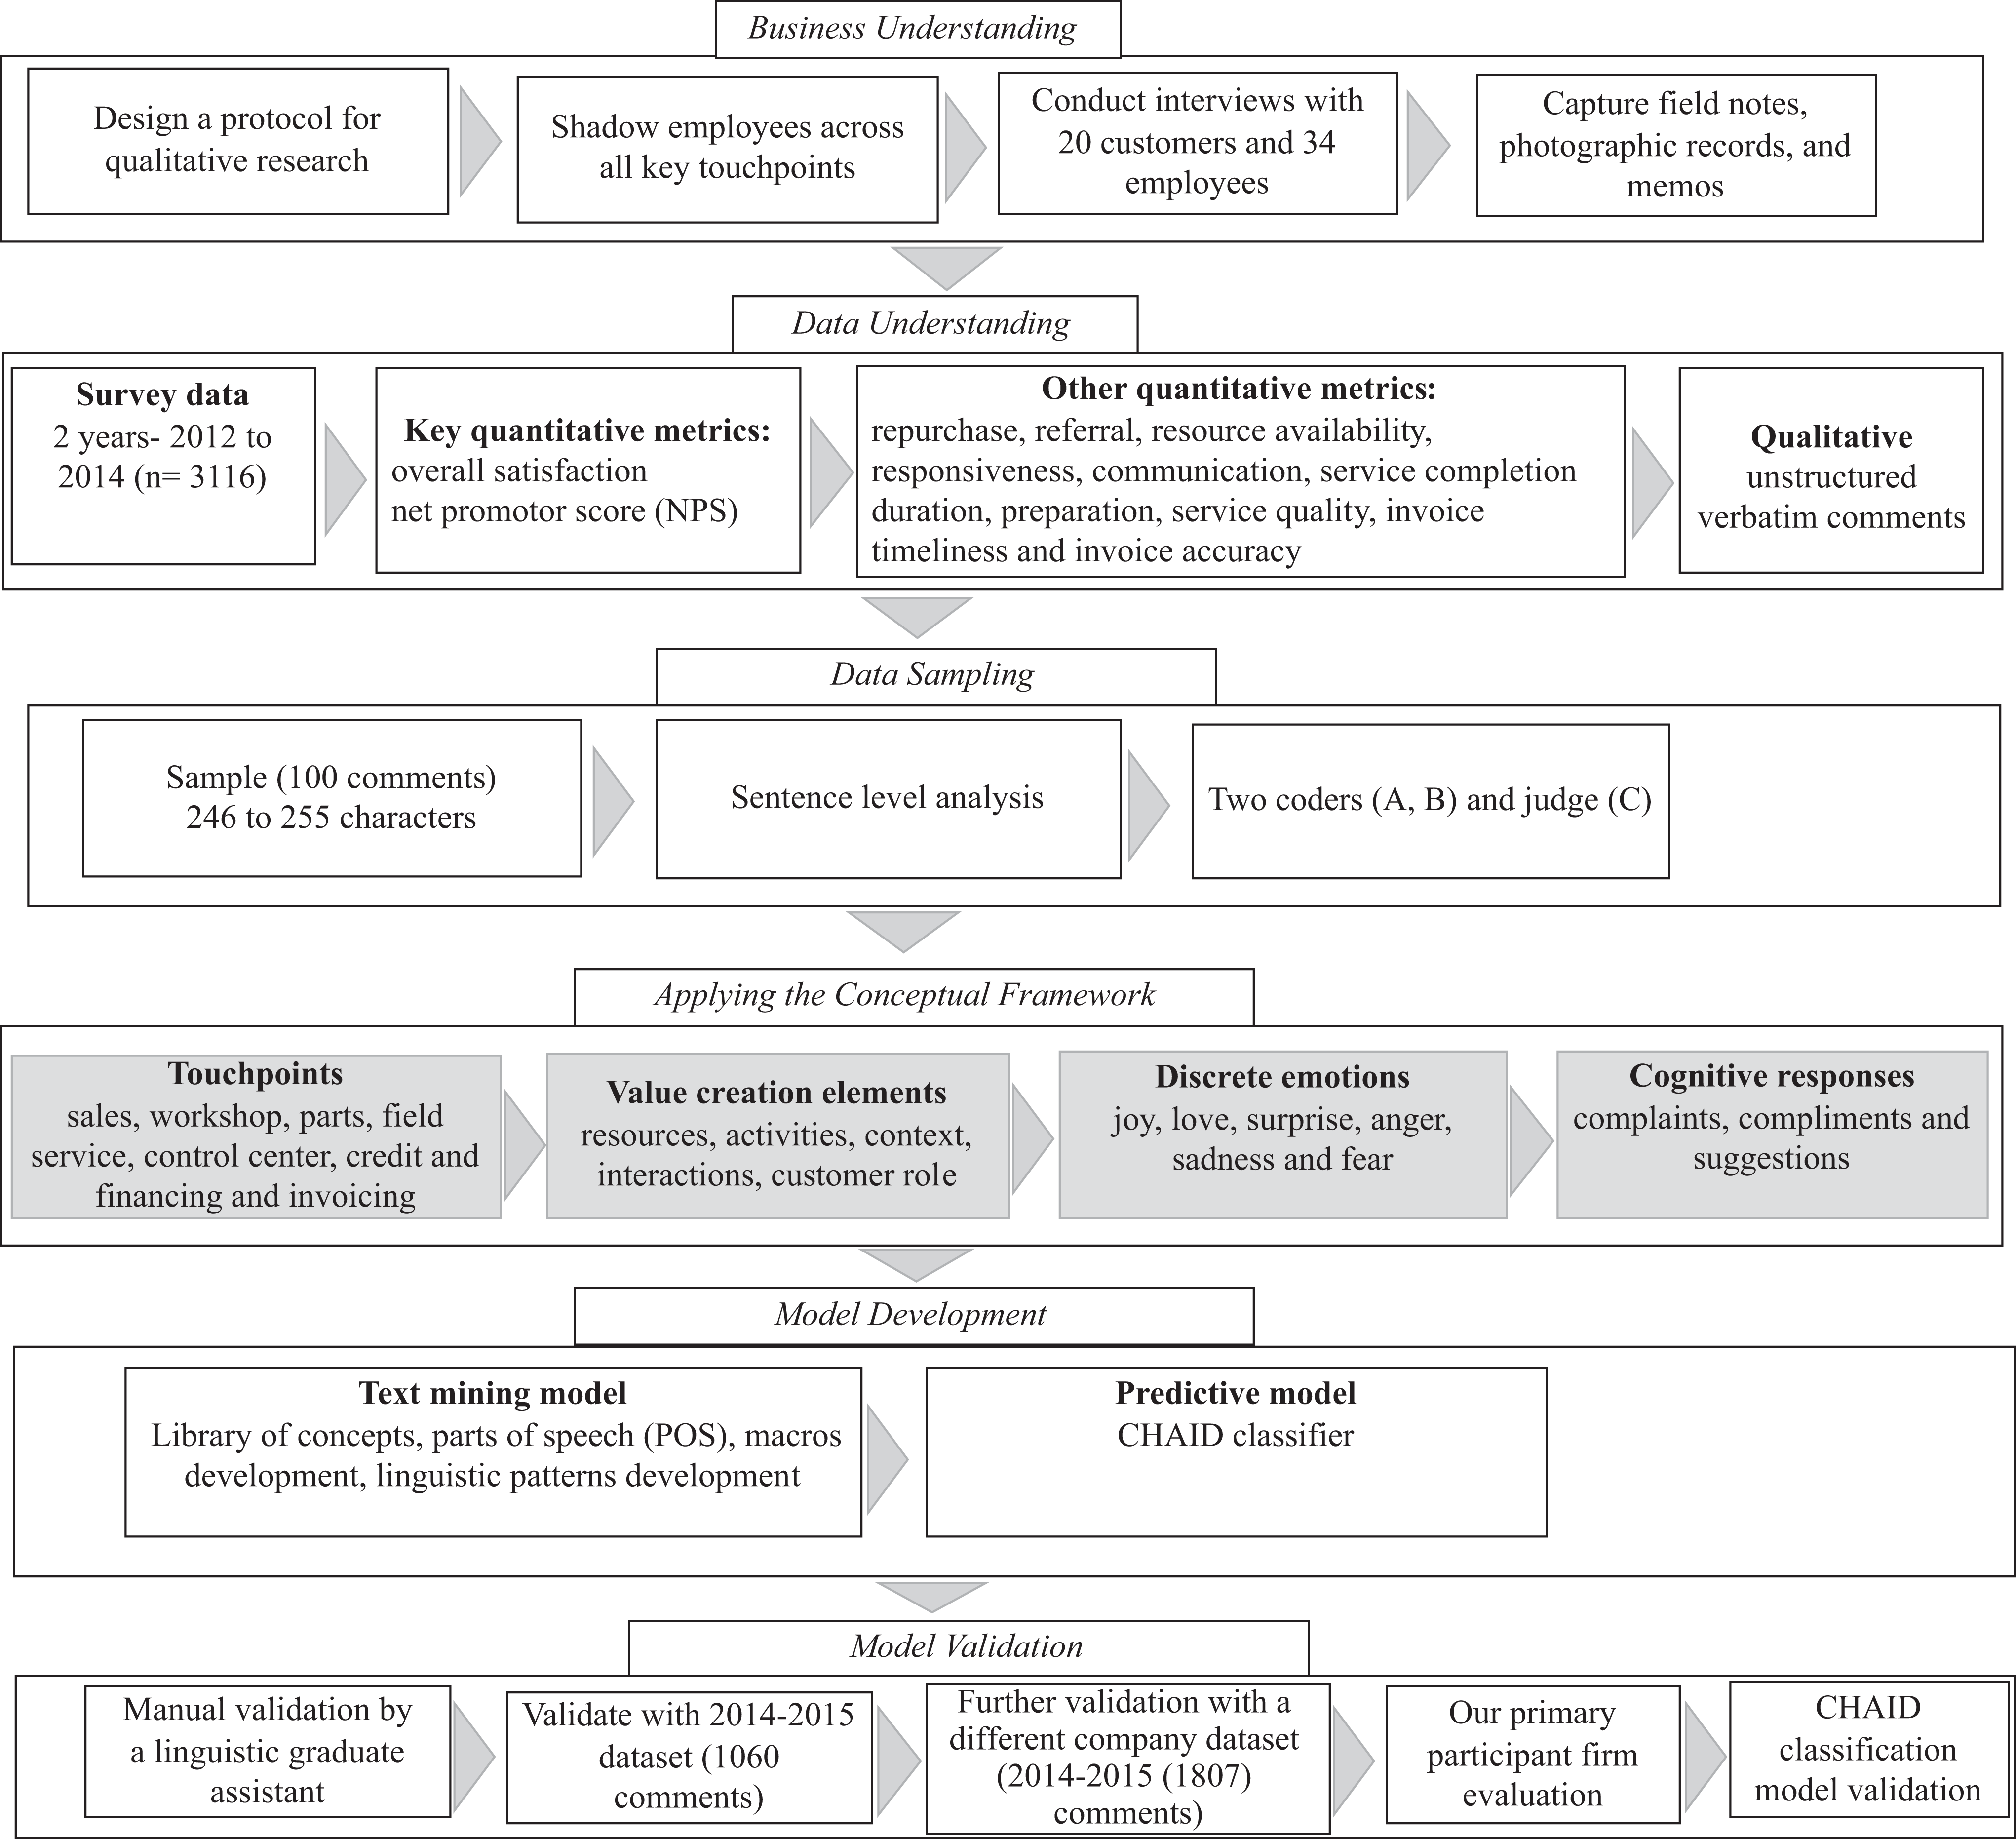
Declaration of Conflicting Interests
The author(s) declared no potential conflicts of interest with respect to the research, authorship, and/or publication of this article.
Funding
The author(s) received no financial support for the research, authorship, and/or publication of this article.
Supplemental Material
Supplemental material for this article is available online.
Note
References
Supplementary Material
Please find the following supplemental material available below.
For Open Access articles published under a Creative Commons License, all supplemental material carries the same license as the article it is associated with.
For non-Open Access articles published, all supplemental material carries a non-exclusive license, and permission requests for re-use of supplemental material or any part of supplemental material shall be sent directly to the copyright owner as specified in the copyright notice associated with the article.