



Abstract
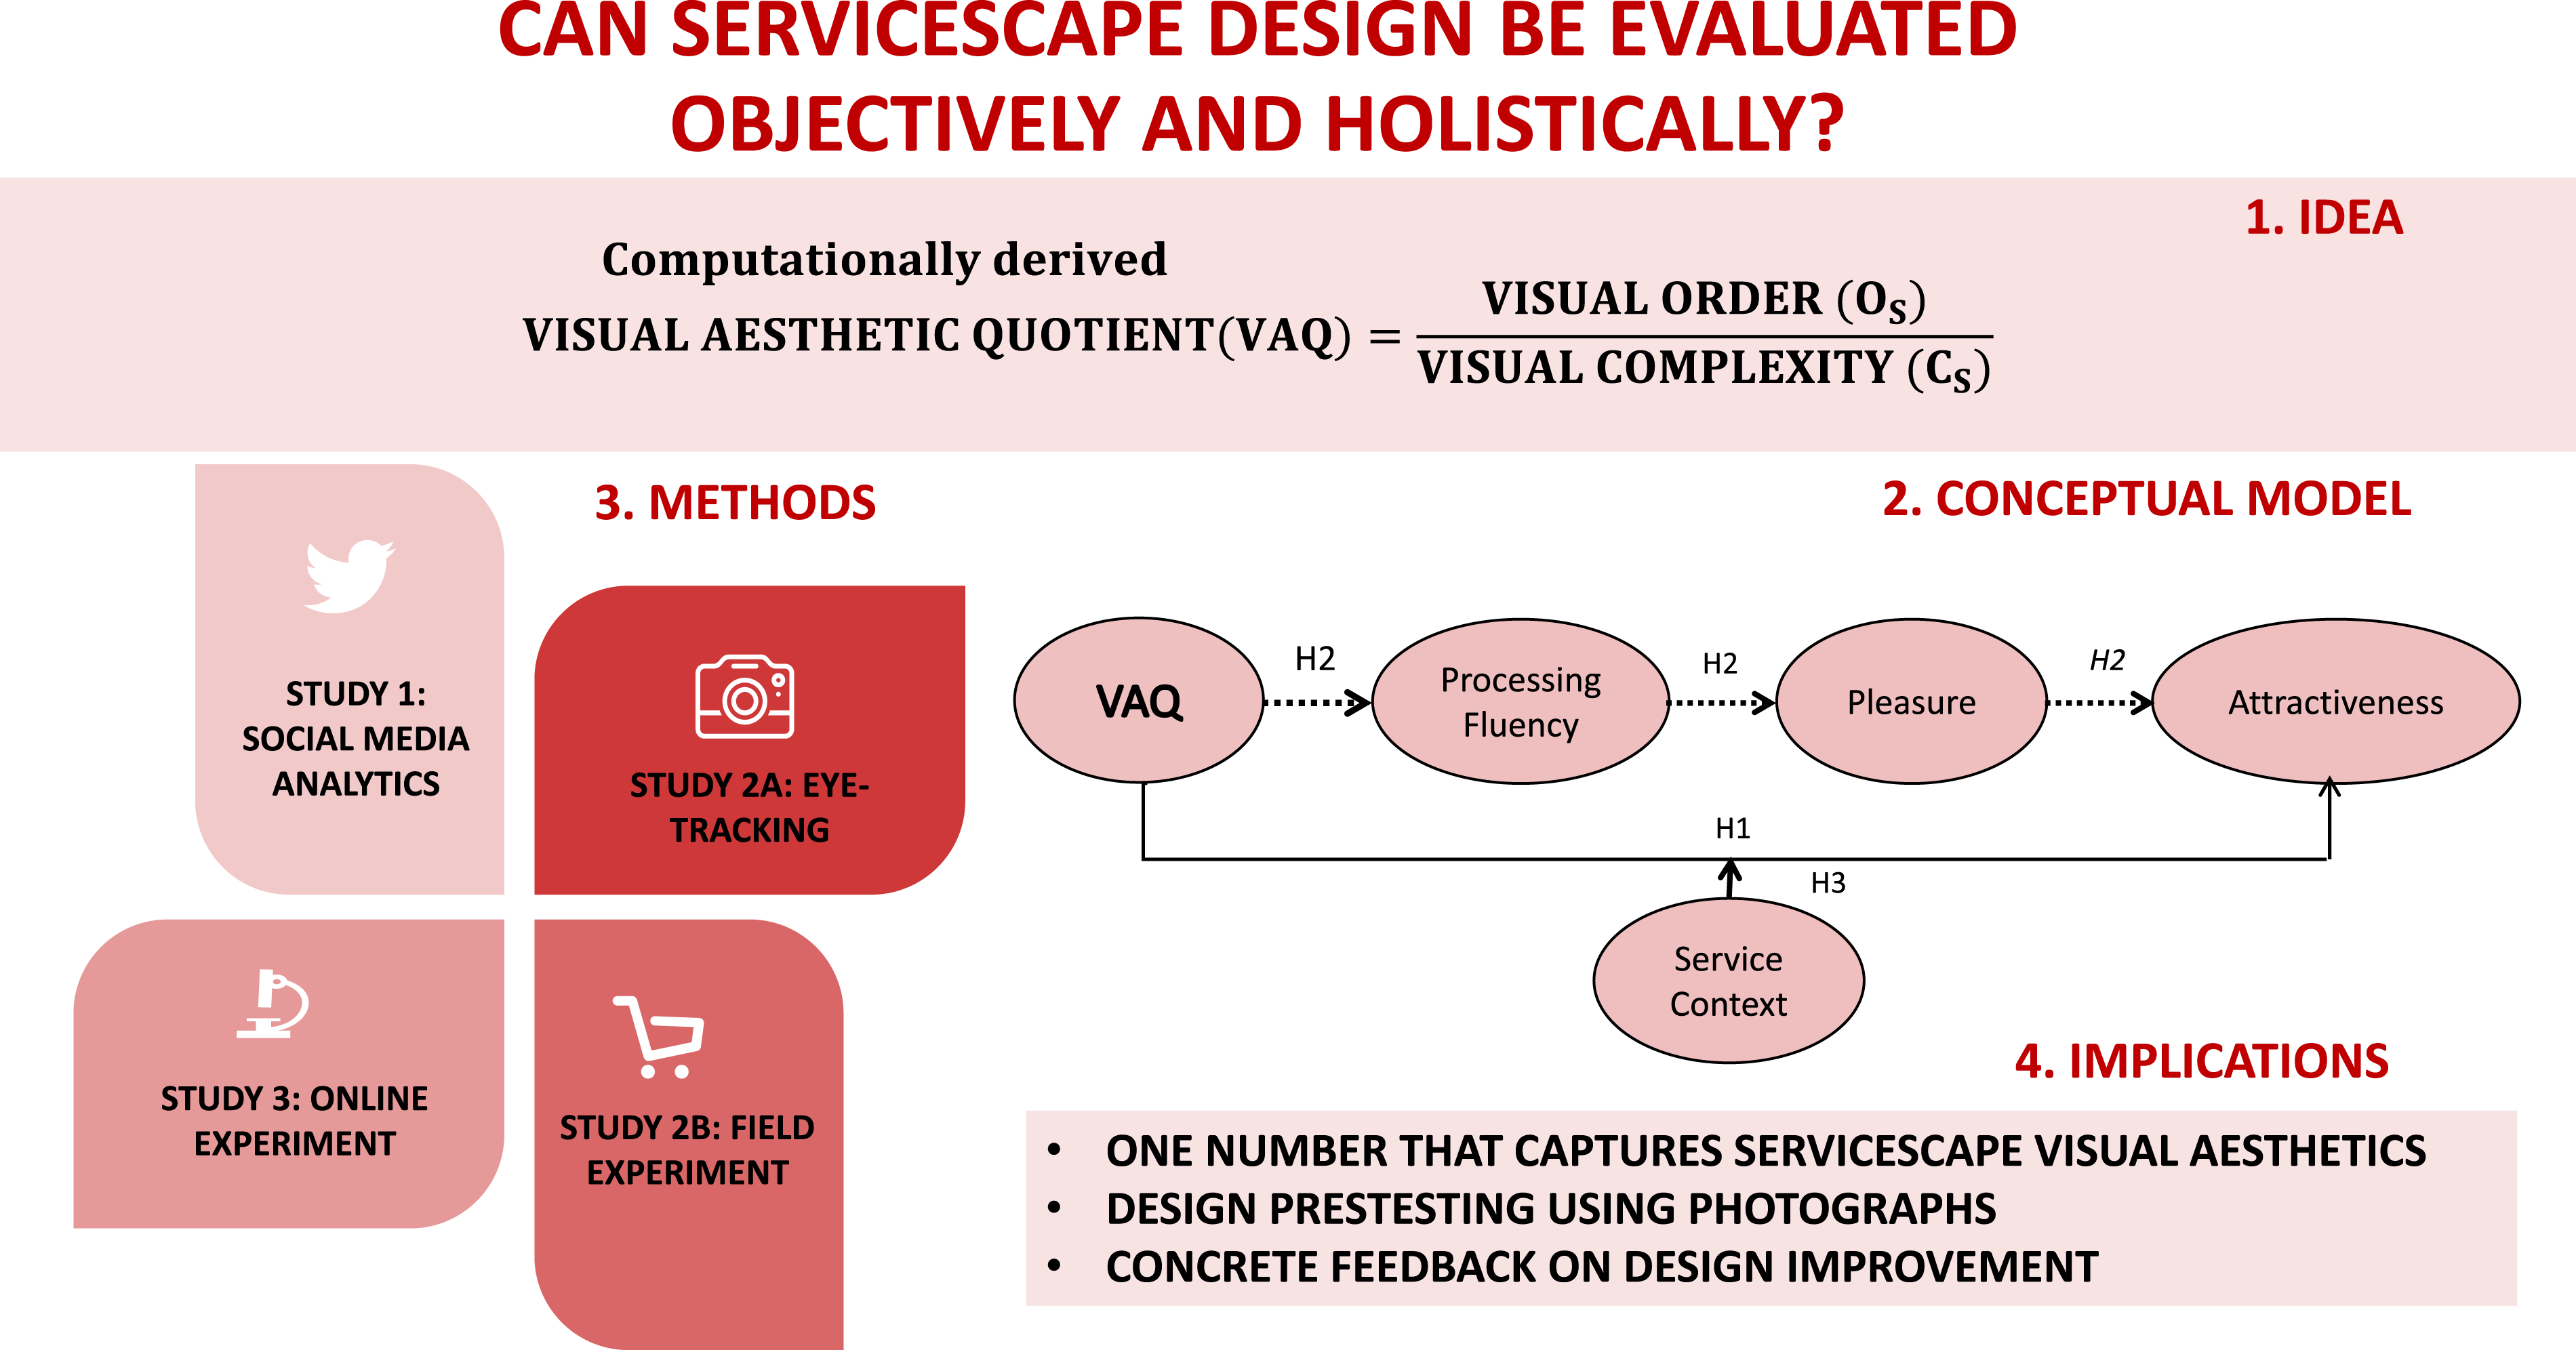
Visual aesthetics play a pivotal role in attracting and retaining customers in service environments. Building on theories of environmental psychology, this study introduces a novel and comprehensive aesthetic measure for evaluating servicescape design, which is called as the “visual aesthetic quotient” (VAQ). This measure is presented as the ratio of the dimensions of order and complexity in servicescape's visual design, and it aims to provide an objective and holistic approach of servicescape design evaluation. In addition, we introduce and validate a pioneering method for quantifying order and complexity objectively using algorithmic models applied to servicescape images. We investigated and established the influence of the VAQ on the perceived attractiveness of servicescapes, developing its role further in this context. The entire approach was comprehensively and rigorously examined using four studies (social media analytics, eye-tracking, a field experiment, and an experimental design), contributing to conceptual advancement and empirical testing. This study provides a novel, computational, objective, and holistic aesthetic measure for effective servicescape design management by validating computational aesthetic measures and establishing their role in influencing servicescape attractiveness; testing the mediation of processing fluency and pleasure; and examining the moderating effects of service context.
Keywords
Introduction
Store atmosphere has been gaining attention in business (Murry, Teller, and Elms 2019). Despite the rise in the popularity of online and multichannel retail formats, physical retail environments continue to play a vital role in enhancing customer value by fostering engagement (Zhang, Chang, and Neslin 2021) and enriching the shopping experience (Gottlieb 2021). By the end of 2023, global retail store sales are expected to exceed online retail sales by more than three times, with estimates of USD 20.8 trillion compared with USD 6.6 trillion for online retail stores (Tugba 2023). According to the Raydiant Consumer Behavior Report (2022), customers continue to favor in-person shopping experiences over online shopping for several reasons. These include the opportunity to physically engage with and experience products, promptness of product delivery, and the immersive atmosphere offered by physical stores. This is evident as many global brands continue to invest heavily in their physical retail environment designs (Ketzenberg and Akturk 2021). For instance, Apple Inc. has started recognizing its store as its most significant product, with store design as its hardware and the activities inside it as software (Jon 2018). This study investigates the visual aesthetics of servicescape design, encompassing physical retail environments, such as stores and service environments, which are collectively referred to as servicescapes, as conceptualized by Bitner (1992).
Servicescapes play a crucial role in retail services, such as hospitality and healthcare because service characteristics, such as inseparability and intangibility, dominate the service delivery and consumption process (Baker, Grewal, and Parasuraman 1994; Kumar, Purani, and Sahadev 2017). The visual aesthetics of servicescapes, encompassing the attractiveness of different design elements such as layout, merchandise, furniture, and style (Roggeveen, Grewal, and Schweiger 2020), have been known to attract new customers (Keh, Wang, and Yan 2021), enhance profitability (Bloch and Kamran-Disfani 2018), improve user experience (Triantafillidou, Siomkos, and Papafilippaki 2017), influence consumer choice behavior (Biswas 2019), and elevate in-store shopping experiences (Gottlieb 2021). However, given the multitude of visual stimuli present in servicescapes, conducting a comprehensive evaluation of visual aesthetics often poses a challenge to viewers (Juliá Nehme, Rodriguez, and Yoon 2020). Various elements contribute to a viewers’ information load, which refers to the maximum amount of visual information that can be absorbed and processed at a given time. If this load exceeds the optimal level, negative outcomes such as avoidance behavior may occur (Ketron 2018). Thus, achieving a harmonious spatial configuration of servicescape design elements poses a significant challenge that requires an understanding of the proper gestalt of the design elements (Jang et al. 2018; Kumar et al. 2017). Marketing studies currently lack a comprehensive model to identify and measure the visual configurations of various servicescape design elements.
The objectives of this study is (a) to introduce the visual aesthetic quotient (VAQ), an objective and holistic aesthetic index based on Birkhoff’s theory (Birkhoff 1933) to evaluate servicescape aesthetics by examining the systematic influence of order (Kotabe, Kardan, and Berman 2016) and complexity (Donderi 2006) on consumers’ aesthetic experience, (b) to develop a comprehensive methodological framework for assessing and computing VAQ using computational aesthetics (Hoenig 2005), (c) to investigate the relationship between VAQ and viewers’ perceived attractiveness, mediated by processing fluency (Reber, Schwarz, and Winkielman 2004) and aesthetic pleasure, and (d) finally, to explore the presence of a theoretically significant boundary condition-the moderating role of service contexts (hedonic vs. utilitarian contexts) on VAQ’s influence on attractiveness.
The research, consisting of four studies, confirmed that visual aesthetic properties can be assessed as a single measure using computational approach on digital photographs of servicescapes, thus mitigating the measurement challenges encountered in prior research. Through a comprehensive pre-test, we initially established a significant and positive correlation among the abstract, subjective aesthetic evaluation approach, and computational aesthetics approach to measure the VAQ. In the first study (Study 1), which analyzed social media posts (Twitter feeds), we demonstrated the impact of the VAQ on perceived attractiveness. Subsequently, in Study 2a, we tested the influence of the VAQ on enhancing processing fluency by employing an eye-tracking procedure; and in Study 2b, we established the mediating roles of processing fluency and pleasure in the relationship between the VAQ and perceived attractiveness by conducting a field experiment. In the final study (Study 3), we demonstrated that the influence of processing fluency on pleasure is moderated by service context using experimental vignette methodology. Particularly, we found that the utilitarian context exhibits greater sensitivity to order and complexity than the hedonic context. Collectively, these four studies provided evidence supporting the validity of the VAQ metric as a comprehensive measure for assessing servicescape aesthetics.
This study contributes to marketing literature in several aspects. First, Birkhoff’s aesthetic theory (Birkhoff 1933) is introduced as a VAQ to capture the holistic visual aesthetics of servicescapes. This novel approach enables marketers to determine an optimal aesthetic metric, striking a balance between minimalism and excessiveness, an unexplored concept in the marketing literature. Additionally, we introduced an advanced computational aesthetics methodology (Brachmann and Redies 2017) to service marketing studies, simplifying the measurement of holistic visual aesthetics. A clear understanding of objective, yet holistic, measures in space design evaluations can facilitate effective servicescape design management. Moreover, the VAQ offers flexibility for extending visual aesthetic evaluations to online retail environments such as e-servicescapes and m-servicescapes.
Conceptualizing VAQ for Servicescapes
Servicescape Aesthetics
Key Research Related to Visual Aesthetics Evaluation in Servicescapes.

As indicated in Table 1, research on the visual aesthetics of servicescapes does utilize a subjective approach (e.g., Kumar et al. 2017; Lin 2016; Orth and Wirtz 2014). However, subjective methods can be influenced by unobserved factors and potential confounding variables (e.g., age, gender, and individual differences), which may introduce bias into the model estimates and error terms (Bullock, Green, and Ha 2010). Conversely, numerous objective approaches have focused on specific attributes of servicescapes, such as shape and layout (Liu et al., 2018), colors (Lee, Noble, and Biswas 2018), and lighting (Reynolds-McIlnay, Morrin, and Nordfalt 2017). However, these objective approaches have limitations when evaluating servicescapes holistically. Therefore, we adopted an approach based on the holistic conceptualization of visual aesthetics, in which visual aesthetics are measured objectively by utilizing advancements in computer algorithms.
Within the field of aesthetics, numerous theoretical and experimental studies have provided evidence supporting the idea that visual aesthetic preference is connected to both visual complexity and order. However, investigations of order and complexity have often been largely conducted independently, rather than in conjunction (Van Geert and Wagemans 2020). We propose the use of visual complexity as a measure to develop the VAQ.
Visual Complexity
One of the significant gestalt measures of visual aesthetics is complexity (Donderi 2006), which refers to the number and variety of elements and features present in a servicescape (Orth and Wirtz 2014). Several marketing studies have investigated the significance of visual complexity in diverse domains, including product design (Cho and Schwarz 2010), package design (Orth and Crouch 2014), mobile shopping (Sohn, Seegebarth, and Moritz 2017), servicescapes (Ketron 2018; Orth and Wirtz 2014), and advertising (Pieters, Wedel, and Batra 2010). However, complexity alone may not predict the aesthetic properties of the stimuli comprehensively and parsimoniously. Therefore, we considered another crucial variable that influences consumer responses: Order (Van Geert and Wagemans 2020).
Visual Order
Order refers to the organization, symmetry, or balance in arranging various elements present in the environment (Kotabe et al. 2016). While there are multiple conceptualizations of order in previous studies (Van Geert and Wagemans 2020), following Bies et al. (2016), we considered the order of symmetry, a fundamental aspect of visual design that has been extensively studied in multiple contexts, such as product design (Bloch 1995), logo design (Bajaj and Bond 2018), and websites (Ruben et al. 2017).
Integration of Order and Complexity
Order and complexity are established as two prominent factors that shape aesthetic experience (Deng and Poole 2010). Although a few previous studies have explored the interactive effects of complexity and order (e.g., Van Geert and Wagemans 2020), the symbiotic nature of the relationship between complexity and order remains underexplored. Furthermore, Van Geert and Wagemans (2021) opined that the relationship between order and complexity should be explored further, a condition highlighted by Orth and Wirtz (2014), and servicescapes.
According to Birkhoff’s (1933) theory, the aesthetic measure of a stimulus is determined by the ratio of its objective properties of order and complexity, and the level of aesthetic appreciation tends to increase with higher ratio values (Rigau, Feixas, and Sbert 2007). Although Eysenck (1968) introduced other aesthetic measures derived from the product of order and complexity, subsequent studies have noted that the relationship between these measures lacks substantial theoretical support and tends to vary from one experiment to another (Boselie and Leeuwenberg 1985). Birkhoff's theory, which involves deriving judgments of beauty from intrinsic and quantifiable image-based factors, is widely recognized as the foundational concept in the advancement of computational aesthetics (Brachmann and Redies 2017; Rigau et al. 2007). Moreover, Birkhoff’s theory has been validated not only for visual stimuli, such as paintings and product designs, but also for auditory stimuli, such as music and poetry (Cardaci et al. 2009) (Web Appendix 1 provides a review of key studies related to the application of Birkhoff’s ratio to computational aesthetics). Hence, we use Birkhoff’s theory as the basis for developing our aesthetic measure, the VAQ, and extend it to servicescape design.
Computational Aesthetics
The computational aesthetics approach is based on the statistical properties of images, in which aesthetic attributes are extracted using computer-based algorithms (Amirshahi et al. 2012; Braun et al. 2013). This approach provides accurate measures that correlate well with subjective assessments of visual aesthetics for various stimuli (Donderi 2006; Hayn-Leichsenring, Lehmann, and Redies 2017; Landwehr, Labroo, and Herrmann 2011). Moreover, computational aesthetics using images has applications in diverse areas, including artworks and paintings (Hayn-Leichsenring et al. 2017), visual patterns (Gartus and Leder 2017), photographs of landscapes (Mayer and Landwehr 2018), perspective views of architectural design (Thömmes Katja and Hübner Ronald, 2018), website design (Reinecke et al. 2013), product design (Landwehr et al. 2011), and logos (Bajaj and Bond 2018). Figure 1 summarizes various approaches adopted in marketing studies to evaluate aesthetic stimuli. To the best of our knowledge, this study is the first to explore the application of computational aesthetics in servicescapes, as indicated by the analysis presented in Figure 1. Visual Aesthetic Studies in Marketing: Key Studies.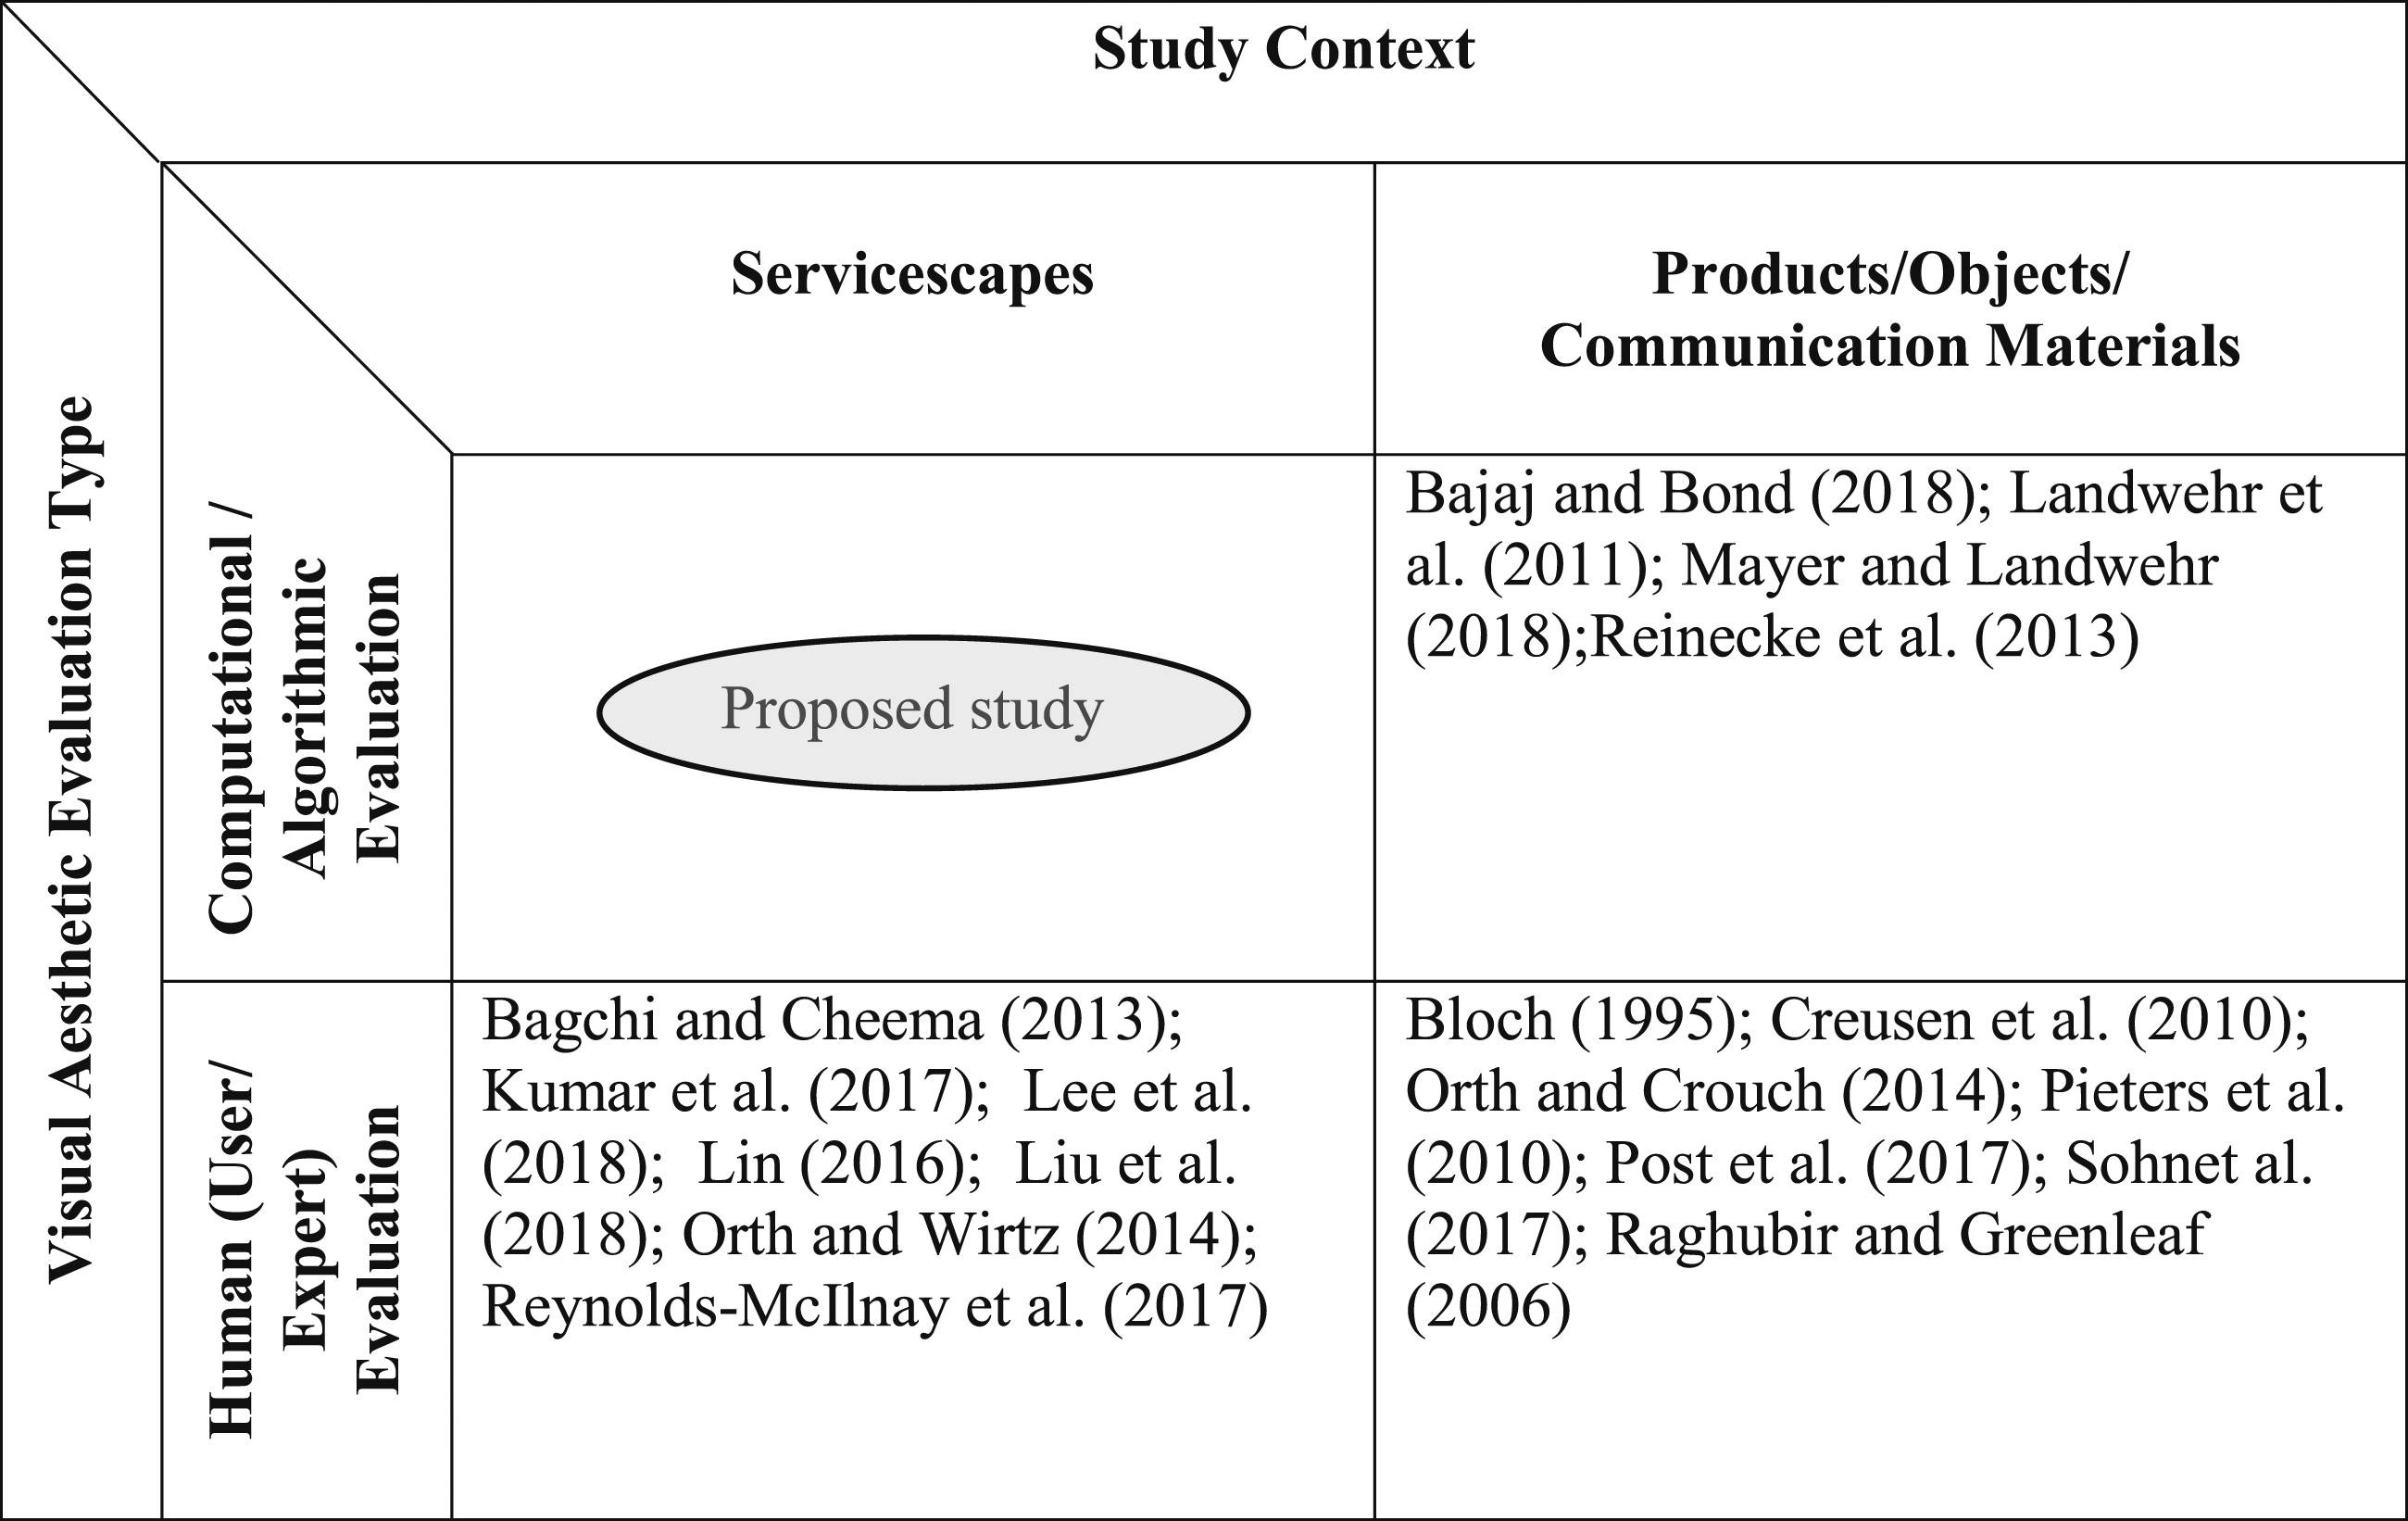
VAQ as an Algorithmic Measure
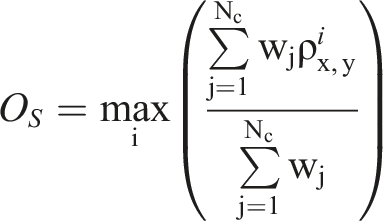
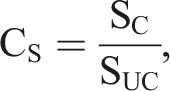
In computational aesthetics, Birkhoff’s ratio is calculated using algorithmic measures of order and complexity, which enables the prediction of the aesthetic ratings of photographs (Redies et al. 2012; Rigau et al. 2007). According to Mayer and Landwehr (2018), the calculation of order in the VAQ involves channelizing an RGB image of the servicescape into separate color channel images (Red, Green, and Blue). For each color channel, the correlation of the pixel density values between the right (top) and left (bottom) sides of the perceptual central vertical (or horizontal, for horizontal symmetry) is determined. These symmetry values are then combined across the three color channels to obtain an order measure. Complexity is computed as the ratio between the compressed and uncompressed image file sizes (Mayer and Landwehr 2018). The details of the computation for the order (symmetry average) and complexity are provided in Web Appendix 2.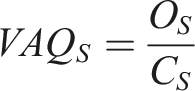
Conceptual Model and Hypotheses Development
VAQ’s Influence on Perceived Attractiveness of Servicescapes
Viewers, generally, assess the mental effort required to process any stimulus meta-cognitively (Reber et al. 2004). Complexity increases the effort required, whereas order reduces the effort required to process a visual stimulus. Birkhoff’s (1933) theory suggests that aesthetic experience starts with a preliminary attempt at attention, which is necessary for the act of perception, and this increases in proportion to its complexity, the number, and variety of units in the stimuli that require a conscious act of attention. This effect is rewarded by a feeling of value. This is counterbalanced by the need for harmony, in which stimuli contribute to the viewer’s aesthetic experience characterized by pleasant feelings (Douchová 2015). These pleasant feelings, resulting from a sensory understanding of the stimuli’s order, determine the viewers’ aesthetic appreciation (Hekkert 2006). Furthermore, according to gestalt psychology, increasing harmony in stimuli drives viewers’ perceptions of attractiveness (Henderson and Cote 1998). For a given level of complexity, as the order of a stimulus increases, its VAQ also increases, making it appear more harmonious and thereby enhancing viewers’ perceived attractiveness (Nickel, Orth, and Kumar 2020). Attractiveness is also intuitively associated with a stimuli’s visual aesthetics and is considered an appropriate aesthetic response variable (Graf Laura and Landwehr Jan, 2017). Furthermore, it has a significant influence on consumers’ purchases (Orth and Crouch 2014) and revisit intentions (Orth and Writz 2014). Thus, when the VAQ of the servicescapes increases, its harmony increases, making it appear more attractive. Accordingly, we framed the following hypothesis:
A servicescape design with a higher VAQ (high order-to-complexity ratio) will result in higher perceived attractiveness than a servicescape design with a lower VAQ (low order-to-complexity ratio).
The Mediating Role of Processing Fluency and Pleasure
Processing fluency refers to the viewers’ subjective experience of the ease and speed of processing a stimulus (Reber, Winkielman, and Schwarz 1998). Stimuli with high visual complexity require greater effort and time for processing, leading to lower processing fluency (Janiszewski and Meyvis 2001; Orth and Wirtz 2014). Conversely, increasing the order of the stimuli brings unity, coherence, and clarity to the environment and reduces the effort required to process it (Deng and Poole 2010). Moreover, order, expressed as average symmetry, increases processing fluency (Joye et al. 2016). This implies that a higher order-to-complexity ratio (or higher VAQ) is likely to increase viewer-processing fluency. Psychophysiological studies have established that fluent processing enhances viewers’ affective responses in viewers (Harmon-Jones and Allen 2001). This affective response is that of pleasure, a subjective experience directed toward a stimulus (Graf and Landwehr 2015). This is because, from an evolutionary perspective, humans always prefer safe environments and fluent stimulus signal safety (Winkielman and Cacioppo 2001). Consistent with the affect-as-information model (Schwarz and Clore 1983), the fluency hypothesis suggests that pleasure mediates the relationship between processing fluency and the resulting response of attractiveness (Reber et al. 2004). Moreover, perceived attractiveness influences viewers’ behavioral responses, including purchase and patronage intentions (Bullock et al. 2010). This relationship among fluent stimuli and positive affect (pleasure), perceived attractiveness, and liking in viewers has been established in the context of websites (Deng and Poole 2010) and servicescapes (Orth and Wirtz 2014). Therefore, extending this to the VAQ of servicescape designs, we proposed the following hypothesis:
The effect of servicescape’s VAQ on perceived attractiveness will be sequentially mediated by (a) processing fluency and the resulting (b) pleasure.
The Moderating Role of Service Contexts
We opine that situational differences such as service contexts moderate the impact of VAQ on the resulting attractiveness. Although multiple service context classifications exist in the literature, the widely explored category in servicescape studies is hedonic versus utilitarian (e.g., Kumar et al. 2017; Orth and Writz 2014). Previous studies have demonstrated that, depending on the service context, consumers enter a servicescape with a distinct goal, and accordingly, their motivations to explore the environment also vary (Babin, Darden, and Griffin 1994; Orth and Wirtz 2014). Utilitarian contexts provide functional utilities, whereas hedonic contexts provide consumers with excitement and playfulness (Jiang and Wang 2006). Thus, in a utilitarian context, consumers focus more on attaining the goal of functional efficiencies owing to functional motives. Anything that hinders a goal is likely to be a distraction that can cause more negative responses (Orth and Wirtz 2014). Hence, a higher VAQ induces automatic fluent processing and more pleasure in utilitarian context, whereas a lower VAQ, owing to lower processing fluency, can be a distraction, leading to lower levels of pleasure and attractiveness. This indicates that attractiveness varies directly with changes in VAQ levels in utilitarian settings.
However, in hedonic contexts, consumers’ motivation is likely to differ; consumers are likely to have a higher degree of intrinsic motivation while visiting a hedonic servicescape context (Blinda et al. 2019). Accordingly, in hedonic contexts, consumers are interested in exploring and experiencing the environment and hence are likely to have a higher interest in processing servicescape visual aesthetics (Orth and Wirtz 2014). Accordingly, the relationship between the VAQ and attractiveness is likely to differ in hedonic contexts, as explained by the pleasure-interest model of aesthetic liking (PIA-Model) (Graf and Landwehr 2015). According to the PIA-Model, viewers’ aesthetic judgment toward stimuli is likely to differ based on the processing approach. It establishes a dual system perspective on fluency-attractiveness linkages and suggests that even disfluent stimuli with sufficient (but not overburdening) potential can influence attractiveness through the mediation of interest because of the motivation of the viewer to stimulate cognitive engagement (Landwehr 2016). Under certain conditions of cognitive engagement, viewers may actively engage with stimuli, resulting in a cognitively driven disfluency reduction experience (Muth and Carbon 2013). Accordingly, a viewer with processing motivation may also like some disfluent stimuli because of their active, detailed, and deliberate interaction with them, referred to as “controlled processing” (Graf and Landwehr 2015). This reduction subdues the relationship between processing fluency and interest, implying that interest is negatively related to processing fluency (Graf and Landwehr 2017). In addition, under processing motivation, disfluent stimuli generate higher preferences through the supplementary cognitive route of interest (Landwehr 2016). Therefore, in a hedonic context, even at a lower VAQ (and subsequent lower processing fluency and pleasure), customers’ motivation to explore the servicescape is likely to trigger controlled processing, which may overwrite the automatic response (Graf and Landwehr 2015), resulting in higher perceived interest, which further induces attractiveness. This suggests that although attractiveness varies directly with changes in VAQ levels for utilitarian contexts (automatic processing through processing fluency and pleasure route), in hedonic contexts, consumers would be more tolerant toward lower VAQ levels owing to dual processing routes through pleasure (automatic processing when processing fluency is high) and interest (controlled processing when processing fluency is low), resulting in a weaker relationship between VAQ and attractiveness in the hedonic context than in a utilitarian setting. Thus, the relationship between VAQ and attractiveness is stronger in utilitarian contexts than in hedonic contexts. Hence, the following hypothesis is proposed:
The service context will moderate the effect of VAQ on attractiveness; specifically, the positive effects of VAQ on perceived attractiveness will be stronger for utilitarian contexts as compared to that in hedonic contexts.
Figure 2 below summarizes the comprehensive conceptual model. The next section presents the methodology employed for testing the hypotheses, starting with a pre-test. In the pre-test, we validated the appropriateness of employing objective algorithmic measures as substitutes for subjective, latent measures. In Study 1, we tested the influence of VAQ on attractiveness using engagement with social media posts. Through eye tracking and field experiments, Studies 2a and 2b showed that a higher VAQ increases viewers’ processing fluency. Finally, in Study 3, using an experimental design, we validated the moderating role of service context. We utilized servicescape images as stimuli in all studies, as our objective was to validate computational aesthetics in servicescapes following previous servicescape studies (e.g., Ketron 2018; Kumar et al. 2017; Orth and Wirtz 2014). In addition, we derived objective algorithmic measures in all our studies using imagefluency package in R (Mayer, 2021) which offers direct processing of color images and naturally interpretable outputs with higher statistical and predictive power than other algorithms. Furthermore, in imagefluency all available measures were normalized between zero and one (except for self-similarity). VAQ and Attractiveness—A Comprehensive Model.
A Pre-Test: Empirical Validation of the Computational Measure-VAQ
The pre-test aimed to validate whether objective computational aesthetics can replace subjective latent variables by establishing a correlation between subjective measures (survey data) and objective measures (image analytics) of complexity and order in servicescapes visual designs. Additionally, we assessed the suitability of using algorithmic measures of symmetry (average) and complexity as substitutes for order and complexity in the VAQ calculations, considering the multiple measures available in previous studies (refer to Van Geert and Wagemans 2020 for a comprehensive review).
Study Procedure—Survey Data and Image Analytics
We selected 60 servicescape images from various online sources meticulously with the assistance of three experts, including two practicing architects and one interior designer (PRL reliability indexes > 0.70 [Rust and Cooil 1994]). The experts assisted in selecting comparable images with similar orientations and eye-level views while ensuring the elimination of images with different design styles. All images were adjusted to 800 × 600 pixels (300 ppi resolution) and enhanced for brightness and contrast using Adobe Photoshop CS software. The computational aesthetic measures of complexity, order (average symmetry), contrast (a measure of dissimilarities within an image), and self-similarity (a measure of repeating visual patterns or scale invariance) for all images were calculated using the imagefluency package in R (Mayer 2021). All variables had a significant influence on processing fluency (Mayer and Landwehr 2018).
The subjective measures of complexity and order were adapted from Post Ruban et al. (2016) and Kumar et al. (2017) (the scale details are provided in Web Appendix 3). The survey involved presenting servicescape images on a computer screen and utilizing a physical questionnaire to collect responses. All images were uploaded to India’s leading educational institution’s web server, and to mitigate order effects, a Java-based applet with an HTML interface was designed to randomize the images for the four selected service types. A total of 350 respondents from five Indian cities provided subjective evaluations of the order and complexity of the selected images, with each participant evaluating four random servicescape photographs, resulting in 1400 responses (350 × 4).
Results and Discussion
We aggregated the responses at the stimulus level (to avoid issues related to the hierarchical data structure in the statistical analysis) and calculated correlation (n = 60) between the subjective measures of order and complexity and the four computational aesthetic measures of complexity, average symmetry, contrast, and self-similarity. Table 2 presents the results of the study. Means, SD, and Correlations of Pre-test Variables.
**p < 0.001 *p < 0.05
aComputational algorithmic measures using imagefluency package in R.
The findings revealed a significant positive correlation among the subjective complexity and algorithmic complexity measures (r = .938, p < 0.001), subjective order and algorithmic order measures (r = 0.864, p < 0.001), and subjective VAQ and image-based algorithmic VAQ measures (r = 0.907, p < 0.001), providing support for the strong correlation between computational algorithmic measures and subjective evaluations. In addition, the correlation coefficients reported in Table 2 further confirm the assumption that average symmetry (r = 0.864, p < 0.001) is a better measure of order in assessing servicescape designs than self-similarity (r = 0.015, p = n.s.) (Mayer and Landwher 2018). The findings of this study are in line with Landwehr et al.’s (2011) procedure for product design, which implies that computational aesthetic measures using photographs can serve as substitutes for subjective measures. Similarly, our results, which indicate that subjective ratings of order, complexity, and their ratios as VAQ can be captured using objective algorithmic measures of the images, are consistent with the findings of Mayer and Landwehr (2018). Having established its validity, in Study 1, we explored the influence of VAQ on consumers’ perceived attractiveness.
Study 1: Testing the Effects Of VAQ on Perceived Attractiveness of the Servicescapes
Study 1 aimed to test the H1 regarding the relationship between the VAQ and attractiveness. We conducted a study based on social media posts on Twitter to establish its ecological validity, as recommended by Humphreys and Wang (2017). Furthermore, Twitter feeds have been utilized in numerous studies in management (e.g., Shirdastian et al. 2019), including marketing (e.g., Hennig-Thurau, Wiertz, and Feldhaus 2015).
Study Procedure-Twitter Analytics
We conducted data mining on image posts from six specific Twitter handles (RetailDesignBG, HIMagazine, InteriorDesign, DreamHouse, TrendMagazine, and RetailFocus) related to various servicescapes using Python and the Twitter Application Program Interface (API). These handles were identified with the assistance of three experts, two architects, and one interior designer. We extracted 9695 tweets from six Twitter handles using the Tweepy library (http://docs.tweepy.org/en/v3.5.0/) in Python and collected the corresponding number of “likes,” a metric known to measure aesthetic appeal in previous studies (Thömmes and Hübner 2018). Moreover, we captured the tweet texts because the text field and the image can influence the “likes” for the post. The sentiment of the textual data (captured as polarity, ranging from −1 to 1, measuring the positivity or negativity of the text sentiment score, and subjectivity, ranging from 0 to 1, indicating the degree of subjectivity in the text sentiment score) was analyzed using TextBlob (Loria 2018) Python library. Four experts (two architects, one interior designer, and one retail showroom manager) evaluated and classified the images into different servicescape types, such as fashion retail, bars, restaurants, and others to ensure the appropriateness of the images for the study. Images that posed difficulties in categorization, social elements, brand names, and vertical orientations were excluded, resulting in 1197 images. These images were resized to 720 × 480 pixels with a resolution of 300 pixels per inch, and their brightness levels and contrast were balanced using Adobe Photoshop CS software. In addition, we calculated the order (average symmetry) and complexity using the imagefluency package in R (Mayer 2021) and their ratios as VAQ and measured contrast and self-similarity, which are likely to influence aesthetic preferences (Mayer and Landwher 2018).
Results and Discussions
We equated “likes” to attractiveness, as studies have indicated that liking and beauty judgment, such as attractiveness, are equivalent concepts that are correlated (Labroo and Pocheptsova 2016). We then employed an ordinary least squares (OLS) regression (using the lm package in R) predicting the “likes” of the tweets from VAQ, sentiment scores of texts (polarity and subjectivity), and other prominent computational aesthetic measures (contrast and self-similarity) reported in studies (Mayer and Landwher 2018). Furthermore, we controlled for sources (Twitter handles) and servicescape types (with the help of experts, as discussed above). Moreover, we controlled for this in the regression as “Time,
1
” as the number of “likes” an image receives depends on the time. The equation used is as follows: OLS Regressiona Results of Study 1. Note: **p < 0.001 *p < 0.05. aServicescape type and Source type are controlled.

The results confirm that VAQ, and time, successfully predicted the number of “likes”-attractiveness (R2 = 0.611, F (1,197) = 102, p ≤ 0.001), thereby supporting H1. Although self-similarity and text polarity have a weaker influence (at a 10 percent significance level) on “likes,” contrast and text subjectivity do not have any significant influence. Finally, we found that “time” negatively influences the number of “likes” (
Study 2: Explaining Effects of VAQ Through Mediators
To understand the mechanism (the role of processing fluency) through which VAQ leads to the effect on consumers as hypothesized in H2, we conducted two studies: Study 2a used an eye-tracking methodology to establish initial support for the mechanism we hypothesized, and Study 2b used a field experiment where the mediating relationships were tested.
Study 2a: Testing the Effect of VAQ on Processing Fluency
This study aimed to understand the influence of VAQ on processing fluency, which results in higher attractiveness for higher VAQ. We used an eye-tracking camera to analyze viewers’ eye-movement behavior because it has been proved that eye-tracking methods are effective in capturing users’ attention patterns toward visual stimuli (Kahn 2017). Research findings indicate that aesthetic reactions to visual stimuli can emerge within the first 50 of viewing, influencing subsequent experiences (Djamasbi et al. 2011), whereas long-lasting aesthetic judgments can be formed from glances at information, with variations depending on the type of stimuli (Verhavert, Wagemans, and Augustin 2018).
Study Procedure-Eye Tracking
Eye-movement characteristics were recorded during a visual exploration task using a GP3 eye tracker (Gazepoint®, sampling rate 60 Hz); and we employed a within-subjects design, as commonly applied in eye-tracking studies (e.g., Li, Huang, and Christianson 2016), with the voluntary participation of twenty-eight postgraduate students, all from a leading university in the United Kingdom, possessing normal or corrected-to-normal vision. Eight images were chosen from the image pool used in Study 1 (four each with high [>1.0] and low [< 0.5] VAQs). The images were resized to 720 × 480 pixels at a resolution of 300 dpi and adjusted for tone, color, and contrast using Adobe Photoshop CS. The presentation of images was randomized, each displayed for 10 (Kaspar Gameiro, and König 2015), with a 10-second intertrial interval featuring a black screen and a central dot. After a 9-point calibration of the equipment, eye fixation recordings began, and participants were instructed to fixate on a central dot on a black screen before each trial to ensure consistent measurement and initial viewing conditions.
Measures
We focused on mean fixation duration (in milliseconds), the mean number of fixations within an image (>150 ms), and eye travel distance as eye-tracking measures (Franěk et al. 2018). Additionally, pupil dilation and blink rates were measured (Venkatraman et al. 2015). The mean fixation duration reflects the viewers’ cognitive processing effort (Wang et al. 2020), whereas a higher number of fixations (with durations under 250 ms) indicates automatic processing (Meißner and Oll 2019). Eye travel distance (within an image) reflects exploration and ease of processing (Franěk Marek et al., 2018), pupil dilation indicates emotional responses (Venkatraman et al. 2015), and blink rate serves as an indicator of cognitive load (Valtchanov and Ellard 2015). The mean fixation duration, mean number of fixations, pupil dilation, blink rate, and eye travel distance were calculated as suggested by Chassy et al. (2015) for each participant and averaged across images at each VAQ level.
Results and Discussion
A one-way Repeated Measures-Analysis Of Variance (RM-ANOVA) results revealed a significant effect of VAQ on the fixation duration (F (1,27) = 311.85, p < 0.001, ƞ 2 = 0.858), number of fixations (F (1,27) = 307.85, p < 0.001, ƞ 2 = 0.907), and eye travel distance (F (1,27) = 15.86, p < 0.001, ƞ 2 = 0.129). However, its effect on pupil dilation (F (1,27) = 0.300, p = 0.585, ƞ 2 = 0.003) and blink rate (F (1,27) = 0.338, p = 0.562, ƞ 2 = 0.003) were not significant. Furthermore, the average fixation duration for the high-VAQ images was significantly lower than that for the low-VAQ images (μ high = 0.242 vs. μ low = 0.307, SE = 0.004, p < 0.001). A longer fixation duration indicates increased cognitive effort for stimuli processing (Wang et al. 2020) and deeper information processing (Pfeiffer et al. 2020), whereas shorter fixation durations signify higher processing fluency (Bae 2019). Thus, it can be inferred that lower-VAQ images demand higher cognitive effort than high-VAQ images. Moreover, high VAQ stimuli exhibit significantly more fixations than low VAQ stimuli (μ high = 26.49 vs. μ low = 20.954, SE = 0.316, p < 0.001), indicating faster gaze changes and suggesting automatic processing (Meißner and Oll 2019). Again, the eye travel distance (saccadic amplitude) is significantly different between high VAQ and low VAQ images (μ high = 40.86 vs. μ low = 34.265, SE = 1.656, p < 0.001) with longer saccadic amplitudes indicating higher processing fluency in high VAQ images than lower VAQ images (Orth and Crouch 2014). Finally, we did not obtain significant results for pupil dilation or blink rates.
Given the methodology employed (brief stimulus presentation-10s, absence of post-viewing measures), it is reasonable to conclude that the participants exhibited notable differences in viewing high-VAQ images compared to low-VAQ images. We conducted a field experiment to establish the applicability of the VAQ in an actual setting and test the mediating roles of processing fluency and pleasure.
Study 2b: Confirming the Proposed Model With Serial Mediators
The field experiment aimed to test H2 on how the VAQ impacts attractiveness by examining processing fluency and pleasure. This study aimed to validate these effects in a real-world context with actual users, thereby enhancing ecological validity.
Study Procedure-Field Experiment
A field experiment was conducted for 6 weeks at one of South India’s largest home-furnishing retail stores, where the merchandise displays of one section of the store (the Curios section) were manipulated to have two levels of VAQ (high and low). One store floor was manipulated with the assistance of two practicing architects to create two levels of VAQ (high and low) in the merchandise display. They helped us alter the arrangement of stores systematically. An adequate inventory was maintained for the display items to ensure that they were not sold during the experiment. The store’s modular display furniture allowed for convenient rearrangements, making manipulations relatively effortless. There were no differences in lighting, windows, or other atmospheric elements between the two levels, as the location of the manipulations remained unchanged. We manipulated the scene by attempting different configurations concerning vertical symmetry to obtain different levels of VAQ. Five trials were conducted, capturing photographs of each setting at the same eye level using consistent camera settings. The VAQ 3 scores were calculated using the imagefluency package in R (Mayer 2021). We selected a high (low) score as the high (low) VAQ (Web Appendix 4 shows the two arrangements selected) among the possible options. The first arrangement (with high VAQ) was maintained for 3 weeks, starting from November 20, 2020, followed by the second arrangement (with low VAQ) on display for 3 weeks, starting from December 11, 2020. 4
In a store intercept study, visitors were asked about their willingness to participate in this study in exchange for a free discount coupon (10 percent discount on their purchases of INR.1000 [approximately USD 12] for any products from the store). This was performed immediately after they entered the chosen floor of the store before browsing. Interested participants were then asked to complete a paper-and-pencil survey regarding store and interior displays based on their initial views upon entering. The measures in the study include (a) attractiveness, a single item 7-point semantic differential scale adopted from Graf and Landwehr (2017); (b) processing fluency (α = 0.864), measured using a 3-item 7-point semantic differential scale adopted from Landwehr et al. (2011); and (c) pleasure (α = 0.787), 2-item 7-point semantic differential scale adopted from Graf and Landwehr Jan (2017). Moreover, we measured the perceived complexity and order of stores using the same items used in Study 1 5 (the scale items are available in Web Appendix 2). Finally, we collected the respondents’ details about gender and customer type: First-time visitors or repeat visitors.
Results and Discussion
One hundred and thirty three respondents from regular stores voluntarily participated in the study (n = 133 6 ; 68 for high VAQ and 65 for low VAQ; 24.8 percent females and 75.2 percent males; 15 percent repeat customers and 85 percent new visitors). A Multivariate Analysis of Covariance (MANCOVA) was conducted with VAQ (high vs. low) as fixed factors; gender and customer type as covariates; and attractiveness, processing fluency, and pleasure as dependent measures. The results indicated a significant effect of the VAQ (Wilks’ λ = 0.623, F (4, 126) = 19.091, p < 0.001). Regarding the influence of the covariates, gender did not indicate any significant effect (Wilks’ λ = 0.955, F (4, 126) = 1.469, p = 0.216), whereas customer type had a significant effect (Wilks' λ = 0.922, F (4, 126) = 2.659, p < 0.05) on the dependent variables. A high VAQ setting induces a significantly higher level of attractiveness (μ high = 5.017 vs. μ low = 4.551, SE = 0.186, p < 0.05), thereby supporting H1. Moreover, processing fluency (μ high = 4.599 vs. μ low = 3.994, SE = 0.178, p < 0.05) and pleasure (μ high = 5.017 vs. μ low = 4.551, SE = 0.186, p < 0.05) were significantly different for higher VAQ, as compared to lower VAQ settings.
We employed serial multiple mediator models (PROCESS Model 6; Hayes 2017) to test the serial mediation effect of the model: VAQ → Processing Fluency → Pleasure → Attractiveness. The results of a bootstrapping mediation analysis (5000 resamples) of the model indicated that the indirect effect of the VAQ on attractiveness through processing fluency and pleasure was both positive and significant (IE = 0.811, SE = 0.039, 95 % CI: [0.0141, 0.1515]). However, the direct effect of VAQ on attractiveness was not significant (DE = −0.2523, SE = −0.1620, 95 % CI: [−0.5728, 0.0681]), indicating a full mediation effect. Thus, the findings of this field study suggest that higher VAQ levels increase viewers’ processing fluency. Increasing processing fluency positively influences pleasure, leading to perceived attractiveness, and supporting H2. Furthermore, to validate the results with order manipulated using both vertical and horizontal symmetry and to test the hypothesized moderating conditions, we conducted the third study using an online experiment.
Study 3: Testing the Overall Model With Boundary Condition-Moderating Role of Service Contexts
Study 3 aimed to test H3 and explore the moderating effects of the service context on the VAQ-attractiveness relationship. To achieve this, we utilized an experimental vignette methodology combined with visual stimuli of servicescapes, following the approach of Aguinis and Bradley (2014). We selected two service contexts, grocery retail as utilitarian and fashion retail as hedonic, based on the opinions of three experts (marketing professors). Accordingly, two practicing architects created four images (high vs. low VAQ) of grocery and fashion retail stores using 3D modeling and rendering software (3D Studio Max and Lumion) as stimuli (the visual stimuli are provided in Web Appendix 5). These images (developed using the same settings for modeling and visual rendering) were then tested for VAQ levels using the imagefluency package in R (Mayer 2021).
Manipulation Check
A pre-test of the images was conducted to check the effectiveness of the manipulation in the servicescape designs. The respondents were recruited from postgraduate and executive program participants (n = 67, μ age = 33.5 years; 73 percent male) from India’s leading business school. All four images were randomly presented to the respondents using the Qualtrics platform. We evaluated the subjective VAQ (from order and complexity measures using the scales employed in the Study 1) to test the effectiveness of manipulation. Furthermore, as the design typicality can influence processing fluency (Graf and Landwehr 2017), we tested the images for their perceived typicality (using a single-item scale) adopted from Mayer and Landwehr (2018)-(“In comparison to a typical [fashion retail/grocery] retail store, this store looks: very atypical – very typical”) along with the perceived complexity and order. Finally, we checked the perceived realism in the objects, using the 2-item scale adopted from Dabholkar (1994) (“The store image was realistic” and “I had no difficulty imagining myself in the store”). A paired-sample t-test was conducted to check the effectiveness of the manipulation between the high- and low-VAQ images. The results showed significant differences between the high and low VAQ measures for both grocery retail (μ VAQ high = 1.324 vs. μ VAQ low = 0.809, t = 9.463, p < 0.001) and fashion retail images (μ VAQ high = 1.318 vs. μ VAQ low = 0.889, t = 10.499, p < 0.001), establishing the effectiveness of the manipulation. The RM-ANOVA results showed no significant differences in the perceived typicality scores (F = 0.571; p = 0.605; Greenhouse-Geisser ε = 1.941), suggesting that all four images had no significant differences in perceived typicality. Finally, the results of one sample t-test indicated that the perceived realism for all images was significantly higher than the mean value of 5 ([Image 1: μ difference = 1.566, t = 13.362, p < 0.001], [Image 2: μ difference = 1.307, t = 10.870, p < 0.001], [Image 3: μ difference = 2.318, t = 15.777, p < 0.001], [Image 4: μ difference = 1.566, t = 13.362, p < 0.001]), suggesting that the images were appearing real.
Study Procedure-Online Experiments
We recruited 151 individuals (mean age = 29 years; 48 percent female) via the online recruitment platform Prolific (www.prolific.co), which provides high-quality data (Peer et al. 2017). Participants received compensation of USD1.75, and the experiment lasted for approximately 12 minutes. The study setup was a 2 (VAQ: Low, high) × 2 (service contexts: Utilitarian fashion retail, hedonic grocery retail) mixed design, where the VAQ was manipulated as within-subjects and the service context as between-subjects. Every respondent was shown a vignette asking them to imagine that they were going to shop with utilitarian/hedonic intentions and was asked to evaluate two images, obtaining 302 responses (152 for utilitarian and 150 for hedonic contexts) for analysis. We used a visual analog scale with an internal resolution of 10 continuous increments to measure processing fluency (α = 0.738), attractiveness, pleasure (α = 0.872) (using the same scale items used in Study 2b), interest (α = 0.837) (using 2-item scale adopted from Graf and Landwehr 2017) to evaluate the effectiveness of the manipulation, and subjective order (α = 0.823) and complexity (α = 0.713) (to calculate the VAQ) using the same visual analog scale with an internal resolution of 10 continuous increments.
Results and Discussion
The paired sample t-test was conducted once again to test the effectiveness of manipulations, that is, whether the VAQ levels between high vs. low VAQ images were significantly different for both grocery retail (μ VAQ high = 1.469 vs. μ VAQ low = 0.890, t = 10.372, p < 0.001) and fashion retail images (μ VAQ high = 1.882 vs. μ VAQ low = 0.969, t = 9.022, p < 0.001). The results confirmed that the VAQ manipulations were effective.
Next, a mixed-ANOVA on the dependent variables using VAQ levels as a within-subjects factor and service context as a between-subjects factor found a significant main effect of the VAQ (Wilks’ λ = 0.209, F (4, 146) = 138.125, p < 0.001), a significant main effect of service contexts (Wilks’ λ = 0.693, F (4, 146) = 20.638, p < 0.001), and a significant interaction effect between these two variables (Wilks’ λ = 0.575, F (4, 146) = 27.018, p < 0.001). Moreover, there is a significant interaction of VAQ and service context on attractiveness [F (1, 149) = 40.651, p < 0.001, Greenhouse-Geisser ε = 44.617, η
2
p
= 0.214]; and there was a significant difference between attractiveness (μ
high
= 8.260 vs. μ
low
= 5.836, SE = 0.136, p < 0.001) across high and low VAQ levels, whereby supporting H1. Additionally, processing fluency (μ
high
= 7.634 vs. μ
low
= 5.951, SE = 0.103, p < 0.001) and pleasure (μ
high
= 7.633 vs. μ
low
= 5.333, SE = 0.150, p < 0.001) had significant difference across high and low VAQ. Furthermore, the mean difference between attractiveness scores for the two levels of VAQ was significantly different between the utilitarian (μ
difference
= 3.187) and hedonic conditions (μ
difference
= 1.647), as depicted in the interaction plots in Figure 3, which supports H3. Service Context Moderation of VAQ effects.
Additional analysis of the results indicated that, although a significant interaction of VAQ and service context on processing fluency [F (1, 149) = 8.028, p < 0.001, Greenhouse-Geisser ε = 6.169, η 2 p = 0.051] and interest [F (1, 149) = 41.207, p < 0.001, Greenhouse-Geisser ε = 63.743, η 2 p = 0.217] was observed, the interaction was not significant for pleasure [F (1, 149) = 2.204 p = 0.14, Greenhouse-Geisser ε = 3.734, η 2 p = 0.015].
We employed serial multiple mediator models for within-subject repeated measures (MEMORE; Montoya and Hayes 2017) with bootstrapping mediation analysis (5000 resamples) by considering VAQ at two levels (high and low) to test H2, the serial mediation effects of the model VAQ → Processing Fluency → Pleasure → Attractiveness. The results revealed that the indirect effect of the VAQ on attractiveness through processing fluency and pleasure was positive and significant (IE = 0.257, SE = 0.094, 95 % CI: [0.092, 0.458]), while the direct effect of the VAQ on attractiveness was significant (DE = 1.653, SE = 0.238, 95 % CI: [1.184, 2.123]), thereby supporting H2.
We conducted a mediation test to check for the mechanism of moderation using serial multiple mediator models for within-subject repeated measures (MEMORE; Montoya and Hayes 2017) with bootstrapping mediation analysis (5000 resamples) by splitting the data into two sets based on hedonic and utilitarian retail contexts. In the utilitarian context, the indirect effect of the VAQ on attractiveness through processing fluency and pleasure was positive and significant (IE = 0.355, SE = 0.171, 95 % CI: [0.071, 0.729]), while the direct effect of the VAQ on attractiveness was significant (DE = 2.145, SE = 0.302, 95 % CI: [1.544, 2.747]). Moreover, we tested the mediation effect of the model for utilitarian contexts to rule out that interest rather than pleasure drives the results: VAQ → Processing Fluency → Interest → Attractiveness. The results suggest that the indirect effect of the VAQ on attractiveness through processing fluency and interest was not significant (IE = −0.0005, SE = 0.039, 95 % CI: [−0.093, 0.077]), although the direct effect of the VAQ on attractiveness was significant (DE = 2.549, SE = 0.279, 95 % CI: [1.993, 3.105]). This finding implies that only the mediation path through processing fluency and pleasure is significant in the utilitarian context.
For hedonic contexts, the indirect effect of VAQ on attractiveness through processing fluency and pleasure was positive and significant (IE = 0.278, SE = 0.0136, 95 % CI: [0.027, 0.557]), whereas the direct effect of VAQ on attractiveness was not significant (DE = 0.505, SE = 0.314, 95 % CI: [−0.12, 1.131]). The indirect effect of VAQ on attractiveness through processing fluency and interest was negative and significant (IE = −0.226, SE = 0.122, 95 % CI [−0.487, −0.005]), while the direct effect of VAQ on attractiveness was significant (DE = 1.152, SE = 0.289, 95 % CI [0.576, 1.729]). This suggests that pleasure is positively correlated with processing fluency, whereas interest is negatively correlated with it. These findings explain the moderating mechanism of the retail context on the relationship between VAQ and attractiveness through mediating variables.
Discussion and Implications
In the contemporary competitive marketing landscape, where experiences have emerged as the primary driver of value (Lemon and Verhoef 2016), it is crucial to predict the aesthetic quality of servicescapes accurately. However, this is a major challenge, as the crux of the solution lies in the identification and measurement of visual design configurations, which often comprise a multitude of individual elements that can arouse pleasure and interest among customers. In this study, we propose a solution to this challenge based on computational aesthetics with algorithmic measures. We introduced a computational metric for evaluating servicescape aesthetics which is both objective and holistic.
By integrating insights from two different research streams, that is, objective and computational aesthetics, this study proposes a comprehensive metric-VAQ of servicescapes-by considering the well-established parameters of visual aesthetics measures, namely, complexity and order. Until now, both these measures were abstract and prone to measurement issues, especially in terms of achieving high levels of reliability and validity. Through four different studies, this research established that visual aesthetic properties can be measured accurately using digital photographs of spaces, reducing the measurement problems faced in previous studies. Furthermore, the proposed methodology immensely helps marketers reduce the complexity of measuring holistic visual aesthetics.
Overall, Studies 2a, 2b, and 3, using three different methods, namely, eye-tracking, field, and vignette experiments, proved that a higher VAQ increases viewers’ processing fluency. This is an important result in servicescape studies, as it indicates that the conjoint inclusion of two prominent visual aesthetic dimensions,’ complexity and order, is an important input for the holistic evaluation of the visual aesthetics of a servicescape. Processing fluency is crucial in servicescape aesthetics, as previous studies have established that increased processing fluency can influence several positive consumer responses, such as higher valuation judgments and more money spent shopping (Graf and Landwehr 2015). The findings of this study suggest that low VAQ (low order-to-complex ratio) designs can be detrimental to servicescape attractiveness because they reduce processing fluency and pleasure.
The results from Studies 1, 2b, and 3 indicated that a higher VAQ leads to higher levels of attractiveness in servicescapes. Studies 2b and 3 further showed that while VAQ might have a direct impact on attractiveness, there are indirect mechanisms as well through which high levels of VAQ lead to heightened perceptions of attractiveness. Through field and vignette experiments, we demonstrated that VAQ drives process fluency, which in turn influences pleasure and leads to greater perceptions of the attractiveness of a servicescape. In Study 4, we confirmed that the service context moderates the influence of processing fluency on pleasure, as utilitarian settings are more sensitive to order and complexity than hedonic ones. Thus, these four studies proved the validity of the VAQ metric as a comprehensive visual aesthetic metric for evaluating servicescape aesthetics.
This study makes important theoretical and methodological contributions to servicescape research and marketing. First, to the best of our knowledge, this study is the first to introduce Birkhoff’s aesthetic theory (Birkhoff 1933) to marketing studies, especially to explain the visual aesthetics of servicescapes. Further, this study adopted an advanced computational aesthetics methodology (Brachmann and Redies 2017) in marketing studies. According to Landwehr et al. (2011), computational aesthetics in marketing is a relatively new approach that can facilitate theoretical advancement.
Furthermore, this study aids managerial decision making in several ways. By establishing a cause-effect relationship between VAQ and consumer responses, this study helps managers quantify the visual aesthetics of servicescapes quickly and reliably. This allows managers to perform design pre-testing of the proposed shopping and service environments to predict the desired responses and improve the servicescape design before actual implementation. The findings can help evaluate the servicescape design from the customers’ perspective without any detailed customer surveys based on easy computational methods. These measures require only digital images to assess VAQ, making the process much easier and more objective for managers.
Additionally, the design–ambient–social–trialability (DAST) framework by Roggeveen et al. (2020) suggests a broader role of atmospherics beyond the in-store experience. The idea of capturing servicescape aesthetics as an index can help marketers extend aesthetics to other touchpoints, including in designing digital marketing environments such as mobile apps, websites, and other online domains and in providing designers with tools with aesthetic consistency.
Limitations and Future Directions
This research has some limitations. All four studies used only one image of the servicescape from a specific angle. In practice, viewers experience servicescapes from various angles and places. Future studies should consider computing the VAQ measures using images from multiple points and conducting an overall assessment of the servicescape to make it more holistic. Although the VAQ has substantial explanatory power for attractiveness, other aesthetic measures (e.g., Eysenck 1968) combining order and complexity can also be established. Future studies should explore the suitability of such measures using a computational aesthetic approach. We used only one aspect of order—average symmetry as a measure of order. The order includes other aspects also, such as unity and harmony, which were not considered in this study. This study employed algorithmic image measures from the imagefluency package (Mayer 2021) in R, regardless of measures beyond its scope. Therefore, substitution with other computational measures for order and complexity (Van Geert and Wagemans 2020) and the inclusion of other computational aesthetic variables, such as fractal dimensions (Braun et al. 2013), entropy (Grebenkina et al. 2018), and anisotropy (Braun et al. 2013) in the model, can be examined in future studies. The field study was conducted in a home furnishing store, and the results of the field experiment may have been limited to that setting. Future studies should explore this issue in the context of multiple servicescapes. In addition, owing to store layout constraints, order manipulation in the field study was limited to vertical symmetry. The inclusion of horizontal symmetric manipulations can provide more insightful results. Although only the perception measure of respondents was captured during the field study (and not sales) in this research, because the data were collected over a long period of time, there could be a possibility of time-varying confounding factors such as seasonality. In addition, the VAQ manipulations were performed over the within-subjects design in Study 4. Within-subject designs are susceptible to demand effects, in which respondents are likely to understand the purpose of the study and provide biased responses (Pany and Reckers 1987). Similarly, the inclusion of individual differences in aesthetic appreciation can provide richer insights. Finally, future expansions of the VAQ to understand the effects of other aesthetic stimuli, such as auditory cues (e.g., music), to increase in-store designs’ aesthetic consistency can also be attempted.
Supplemental Material
Supplemental Material - Visual Aesthetic Quotient: Establishing the Effects of Computational Aesthetic Measures for Servicescape Design
Supplemental Material for Visual Aesthetic Quotient: Establishing the Effects of Computational Aesthetic Measures for Servicescape Design by Deepak S Kumar, Sunil Sahadev, and Keyoor Purani in Journal of Service Research
Supplemental Material
Supplemental Material - Visual Aesthetic Quotient: Establishing the Effects of Computational Aesthetic Measures for Servicescape Design
Supplemental Material for Visual Aesthetic Quotient: Establishing the Effects of Computational Aesthetic Measures for Servicescape Design by Deepak S Kumar, Sunil Sahadev, and Keyoor Purani in Journal of Service Research.
Footnotes
Acknowledgment
The authors wish to express their gratitude for the assistance provided by Dr. Sangeeta Gunashekar, Ms. Soorya Sudhakar and Mr. Karthik K. Additionally, we would like to extend our appreciation for the support received from M/s. Instyle Creations in facilitating the field experiments.
Declaration of Conflicting Interests
The author(s) declared no potential conflicts of interest with respect to the research, authorship, and/or publication of this article.
Funding
The author(s) disclosed receipt of the following financial support for the research, authorship, and/or publication of this article: This work was supported by the research grant (SGRP/2019/107) received from the Indian Institute of Management Kozhikode, India, for doing a part of this research work.

Supplemental Material
Supplemental material for this article is available online.
Notes
Author Biographies
References
Supplementary Material
Please find the following supplemental material available below.
For Open Access articles published under a Creative Commons License, all supplemental material carries the same license as the article it is associated with.
For non-Open Access articles published, all supplemental material carries a non-exclusive license, and permission requests for re-use of supplemental material or any part of supplemental material shall be sent directly to the copyright owner as specified in the copyright notice associated with the article.
