



Abstract
This study examines the effect of geographic dispersion on the short-run and long-run initial public offering (IPO) performance of restaurant firms. Sample of the study consists of 103 restaurant IPOs conducted between 1981 and 2011. The study finds that being geographically dispersed or concentrated in a small area does not lead to a significant difference in the initial returns of restaurant IPOs. Yet the analysis shows that restaurant firms with geographically dispersed operations have significantly higher long-run returns in the post-IPO period compared with their local counterparts. This is evidenced by the significantly larger cumulative abnormal returns for geographically dispersed restaurant firms in the post-IPO period.
Introduction
Being a significant corporate event in the life cycle of a company, an initial public offering (IPO) drastically changes the prospects of firms and introduces them to new challenges such as compliance with extended regulations, greater monitoring, and loss of ownership control. At the same time, an IPO provides certain advantages to issuing firms such as raising significant financing at a single equity issue, higher credibility in the financial markets, and improved public appearance among others (Maksimovic & Pichler, 2001; Zingales, 1995). The utmost concern to both issuing firms and investors at an IPO event is the substantial first-day undervaluation of IPO stocks (Ibbotson, Sindelar, & Ritter, 1988; Ritter, 1991; Ritter & Welch, 2002) and negative long-run returns in the post-IPO period (Eckbo & Norli, 2005; Keloharju, 1993; Loughran & Ritter, 1995; Ritter, 1991). A major cause of the significantly high initial returns of IPO stocks—undervaluation from issuing firms’ perspective—is often argued as the asymmetric information between IPO issuers and investors (Welch, 1992). Having limited information about IPO firms, investors associate IPO investments with high risk and expect substantial first-day returns from these investments, which originates the long-discussed underpricing phenomenon. Moreover, operating in a whole new business environment, IPO firms tend to have a decline in their stock returns as the initial investors realize their gains and stock prices normalize subsequently. This in turn leads to poor long-run return performance for issuing firms (Ritter, 1991).
To cope with these so-called performance anomalies, short-run underpricing and long-run poor performance, previous research has suggested a set of certifications that are contemplated to reduce the information asymmetry between IPO firms and investors. These certifications are supposed to disseminate the quality of the issuing firms to IPO investors, make investors more informed about the issuing firms and consequently help them form their return expectations on rational grounds. Underwriter (investment bank) quality, involvement of a venture capital firm, and auditor quality are the most prominent of these certifications that are extensively used and cited in the IPO literature (Balvers, McDonald, & Miller, 1988; Beatty & Ritter, 1986; Carter & Manaster, 1990; Megginson & Weiss, 1991; Michaely & Shaw, 1994). The current study examines the potential of geographic dispersion (diversification) of IPO firms at the time they go public in revealing further information to the IPO markets, and affecting initial returns and post-IPO return performance.
Firms strive to expand geographically in order to tap into locational assets such as skilled workforce, larger customer base, proximity of natural resources, and corporate tax breaks (Gao, Ng, & Wang, 2008). On these grounds, geographic diversification appears to be a value-adding corporate strategy. Nevertheless, with the increased geographic dispersion, information asymmetry between units and headquarter degrades and makes the internal control within the firm problematic (Gao et al., 2008). Moreover, per agency theory, external monitoring by shareholders diminishes as the geographic dispersion increases (Gao et al., 2008). Increased information asymmetry between units and headquarters and alleviated controlling and monitoring problems lead to increased business risk for dispersed firms. At an IPO event where there is limited information about the issuing firms, the state of geographic dispersion of issuing firms might have great relevance to the pricing decisions of investors. If investors perceive the geographic dispersion as an additional risk to their investment, they may require a greater compensation for bearing this risk. Being aware of this expectation, issuing firms, under the supervision of underwriters, may deliberately prefer to discount their offer prices so that they can respond to greater compensation demands of investors. This would consequently result in higher initial returns on the IPOs of geographically dispersed firms. Contrary to this presumption, on the roots of the investor recognition hypothesis, Merton (1987) discusses the locational bias of the stock investments. He claims that local (concentrated) firms tend to offer higher returns to their investors in order to compensate them for the lack of diversification. If the IPO issuers behave in accordance with Merton’s investor recognition hypothesis, local firms would be inclined to provide more first-day returns to their investors than dispersed firms. Following these two opposing arguments for stock returns, the current study seeks to answer whether being concentrated in one or two regions (localized) versus being widely dispersed across several regions affects a restaurant firm’s initial return performance at an IPO event. Furthermore, the study attempts to answer whether geographical dispersion affects the long-run stock returns of IPO firms in the post-IPO period.
The study uses restaurant IPOs to test its hypotheses. There are two reasons behind the selection of restaurant IPOs for the sample of the study. First, the restaurant industry provides a convenient laboratory for the current research context. At the time of an IPO, issuing firms disclose limited and concise information in their IPO prospectuses about their operations. Thus, it is quite challenging to construct a measure of dispersion for IPO firms based on the information released in prospectuses. However, in the IPO prospectus, restaurant firms disclose names of states in which they operate managed or franchised restaurants. This specific information enables the researcher to construct a geographic dispersion proxy used in this study. Second, the previous IPO research has focused its attention mainly on large companies and excluded small capitalization (small-cap) companies from their samples (Dalbor & Sullivan, 2005). Therefore, interpretations of the larger scope, mainstream studies are not always representative of the small-cap firms’ IPOs like restaurant chains. In the past three decades, over 250 restaurant firms have gone public according to Securities Database Corporation’s (SDC) new issue database. The number of restaurant IPOs over the years has varied significantly due to the market conditions that affected the entire IPO market in general. Yet the numbers are indicative that when times are good and appealing for private firms to go public, restaurant firms are no exception. Despite the interest of restaurant firms in going public, there is little knowledge about the IPO performance of restaurant firms. Only a few previous studies seem to shed some light on the restaurant firms’ IPOs. Dalbor and Sullivan (2005), Canina (1996), Canina and Gibson (2003), and Canina, Chang, and Gibson (2008) conducted initial restaurant industry–specific IPO studies providing robust evidence of consistent IPO underpricing for restaurant firms in line with larger studies. The primary purpose of these studies was to examine the IPO initial return phenomenon in the hospitality industry. Among them, for instance, Canina et al. (2008) reported an average of 17.1% underpricing for all hospitality firms and 17.13% for the restaurant firms particularly for the period of 1981 to 2001. In a similar fashion, Atkinson and LeBruto (1995) examine the first-day IPO returns of 14 U.S. casino firms that went public in 1992 and 1993, and documented 30.60% average first-day returns for the issuing firms. These initial studies provided significant insights for hospitality firms that contemplate raising equity via an IPO. Yet they were broad in their scope and mostly exploratory in nature. Therefore, the current study does not only attempt to contribute to the mainstream IPO literature by examining the role of geographic dispersion on the IPO initial and long-run returns but also extends the knowledge in the area of hospitality firms’ IPOs, particularly for the restaurant firms.
The rest of the study is organized as follows. In the next section, theoretical background is discussed and hypotheses are provided. Data and statistical methods are explained in the methodology section. Results of descriptive and empirical tests are reported in the results section. The article concludes with discussion of findings, limitations, and suggestions for future research.
Theoretical Background And Hypotheses
Efficient Markets Hypothesis
Efficient markets hypothesis (EMH), first argued by Eugene Fama (1970), asserts that securities markets are highly efficient in reflecting information about individual stocks and the stock market as a whole. In a more formal definition, Malkiel (1992) states the market efficiency as follows:
A capital market is said to be efficient if it fully and correctly reflects all relevant information in determining security prices. Formally, the market is said to be efficient with respect to some information set, Ω
t
, if security prices would be unaffected by revealing that information to all participants. Moreover, efficiency with respect to an information set, Ω
t
, implies that it is impossible to make economic profits by trading on the basis of Ω
t
. (p. 739) From this definition, it should be noted that investors incorporate any news released in the securities market into the pricing of an individual security or the market as a whole. Type of the information released leads to the form of market efficiencies that are most commonly entertained in the EMH literature (Timmermann & Granger, 2004). If the information set, Ω
t
, comprises only the past and current asset prices then the market is said to be in the weak form. Expanding Ω
t
to further include all publicly available information alleviates the market to the semistrong efficient market form. Lastly, if the Ω
t
comprises all public and private information, market efficiency is in the strong form. Most empirical studies on the predictability of stock market returns use either weak or semistrong form of market efficiency to test their hypotheses (Timmermann & Granger, 2004). In the further discussion of the impact of geographic dispersion on IPO returns that are shaped on the dynamics of semistrong form of market efficiency, the current study adheres to the EMH theory. After all, IPO issuing firms’ geographic dispersion is a piece of information that is expected to be priced in the securities of the issuing firms.
1
IPO Initial Returns and Information Asymmetry
A significant number of studies provide evidence that IPO firms experience a severe underpricing and leave significant potential proceeds on the table (Ibbotson et al., 1988; Loughran, Ritter, & Rydqvist, 1994; Ritter & Welch, 2002). Primarily, money left on the table is the result of issuers’ own intention to encourage investors to reveal their true valuation for the issues. Having possession of the prospectuses, investors have a good deal of knowledge about issuing companies to form their true price expectations, but they do not voluntarily reveal this information. Instead, investors prefer to keep their valuations private and tend to offer unrealistically low prices for the shares of IPO firms (Canina & Gibson, 2003). This is the basic crux of the IPO underpricing issue. Issuers try to learn the true valuation of investors; and investors try to keep their valuation private unless they are compensated with a reward. In the IPO context, this reward is the underpricing of the issues to enable regular investors to realize a gain on their investments. From an investor’s perspective, high initial returns in the first trading day are a compensation for bearing the unanticipated risk of investing in IPO firms.
Over the course of the book-building process, certain certification mechanisms were introduced to signal to the investment market the true quality of the issuing firms and entice investors to reveal their true valuation. These certifications were necessitated mainly due to the lack of pricing history of private firms switching from private to public domain, and because of the inability of traditional valuation tools to price IPOs (Dalbor & Sullivan, 2005). To overcome this difficulty, investors make use of three widely used certifications: underwriter quality, venture capital investment, and auditor quality (Balvers et al., 1988; Beatty & Ritter, 1986; Carter & Manaster, 1990; Megginson & Weiss, 1991; Michaely & Shaw, 1994). Beatty and Ritter (1986) raised a preliminary argument that in the process of book building, involvement of a prestigious underwriter signals the market true quality of the issuing firms because prestigious underwriters develop a strong reputation and they do not wish to jeopardize this reputational stake by underwriting risky and mispriced firms’ IPOs. Accordingly, investors value the presence of a prestigious underwriter in an IPO issue and form rational and assumedly true valuations. Carter and Manaster (1990) provide further evidence that firms that are taken public by a prestigious underwriter tend to have lower underpricing compared with those firms that are underwritten with less prestigious underwriters. Involvement of a venture capital firm in an IPO issue also induces investors to behave in the same way as the presence of a prestigious underwriter. Since venture capitalists invest only on value promising firms, and develop a reputational stake via their investments in various firms, association of a venture capitalist with an IPO is regarded as a good signal for the prospects of an IPO company (Megginson & Weiss, 1991). Moreover, investors believe that venture capitalists play a crucial monitoring role on the firms they have an investment in (Barry, Muscarella, Peavy, & Vetsuypens, 1990), reflecting the quality of issuing firms in the IPO markets. Megginson and Weiss (1991) empirically test the role of a venture capitalist in the IPO market. Their results suggest that IPOs associated with a venture capitalist experience lower underpricing than the IPOs with no venture capital involvement. A third certification tool that has been broadly accepted as an indicator of an issuing firm’s true quality is the external auditor of the company. Audit firms, akin to underwriters, have also reputational stake they build over time and wish to keep it strong so that they can attract prospective firms considering an IPO (Balvers et al., 1988). Hence, high-quality auditors are highly selective in choosing IPO firms to run a comprehensive financial audit before the prospectuses are released to public. The thorough financial audits conducted by prestigous audit firms for IPOs lead to rise of a positive perception on the investors’ side that IPO firms associated with prestigious audit firms are less prone to post-IPO litigation risk (Balvers et al., 1988). Therefore, investors are inclined to set more rational return expectations from these firms. Previous studies reported evidence for this effect by reporting significantly lower initial returns for the IPO firms audited by a prestigious audit firm compared with the IPO firms audited by a nonprestigious audit firm (Balvers et al., 1988; Carter, Dark, & Singh, 1998; Jain & Martin, 2005; Michaely & Shaw, 1994).
Geographic Dispersion
The role of geographic dispersion on corporations has been scrutinized in various settings. A fundamental observation about geographic dispersion is that geographic dispersion and corporate decision making are closely related (Landier, Nair, & Wulf, 2009). As Landier et al. (2009) discuss, information quality may be compromised when decision makers are farther away from decision units for which the decisions are relevant. In that regard, distance is often used as a proxy for information asymmetry (Coval & Moskowitz, 1999; Garmaise & Moskowitz, 2004; Landier et al., 2009) because it affects the ways of information flow and acquisition. Previous studies provide convincing evidence that being local or geographically dispersed has certain effects on a variety of corporate matters. In their extensive study, Landier et al. (2009) demonstrate that social and informational considerations bias management to favor their own interest as opposed to shareholders’ interests. Taking their motivation from this management bias, which is stemmed from geographic dispersion, Gao et al. (2008) examine the valuation implications of geographic dispersion and report that geographically dispersed firms, on average, experience 6.2% valuation discount compared with their geographically concentrated peers. They further report that valuation discount increases as the degree of dispersion increases. A further study that mostly resembles the current study examines the role of geographic dispersion on stock returns (Garcia & Norli, 2012). Using a large sample of U.S. publicly traded firms, Garcia and Norli (2012) show that the stock returns of truly local firms far exceed the stock returns of geographically dispersed firms.
Looking specifically into the hospitality industry, which the restaurant business is a part of, there is some degree of evidence about the impact of geographic dispersion on hospitality firms’ corporate performance. For instance, Kang and Lee (2014) report a positive association between geographic dispersion and return on assets (an accounting performance measure), and Tobin’s q (a market performance measure) in the U.S. lodging industry. In an examination of the U.S. casino industry, Kang, Lee, Choi, and Lee (2012) provide contrary results to those of Kang and Lee (2014) by reporting a negative impact of geographic dispersion on Tobin’s q. To the best of the researcher’s knowledge, no research examines the relationship between geographic dispersion of hospitality firms and their stock returns, which remains a gap to be filled in by the current research.
Securing an effective information flow is essential between units and headquarters to make sure that management and shareholder interests are aligned. This is particularly important for private firms when they switch to public domain because at this stage, uninformed IPO investors try to make use of any bit of available information to make an informed investment decision. It is well documented that as the firms expand geographically, the severity of asymmetric information worsens between executives and business units, as well as issuers and investors (LiPuma, 2012). This occurrence is in line with the propositions of agency theory (Jensen & Meckling, 1976). With increased information asymmetry, both cost of monitoring and level of uncertainty increase leaving investors at a disadvantage position. Being aware of this investor disadvantage, geographically dispersed restaurant firms should leave large amounts of proceeds on the table to attract demand to their IPOs, which leads to high underpricing in the first trading day for these firms. Thus,
Hypothesis 1a: Per the information asymmetry hypothesis, geographically dispersed restaurant firms’ IPO initial returns are higher than local firms.
Another stream of research in the stock returns marks that local firms operating in a small regional area have higher stock returns than firms whose operations spread over a large geographic area (Garcia & Norli, 2012). This finding is well explained by Merton’s (1987) investor recognition hypothesis that stocks with lower investor recognition offer higher expected returns to compensate investors for insufficient diversification. As Garcia and Norli (2012) put it that it is plausible to expect that stocks of local firms have a smaller investor base, and therefore lower investor recognition than the stocks of geographically dispersed firms. Following Merton’s investor recognition hypothesis, it could be expected that local restaurant firms should provide high initial returns to compensate their investors for diversification disadvantages at an IPO event relative to geographically dispersed firms.
Hypothesis 1b: Per Merton’s investor recognition hypothesis, local restaurant firms’ IPO initial returns are higher than geographically dispersed firms.
Long-Run Returns
There exists robust evidence that long-run returns of IPO-issuing firms are lower than those of nonissuing firms over some holding periods (Eckbo & Norli, 2005; Loughran & Ritter, 1995; Ritter, 1991). Consistent with the stock returns, the operating performance of IPO-issuing firms also appears to underperform that of nonissuing firms in the post-IPO period (Chi & Padgett, 2006; Jain & Kini, 1994). Among studies that examine the long-run return performance of IPO firms, Loughran and Ritter (1995) inspect the long-run return performance of IPO firms and seasoned equity offerings during the period of 1970 to 1990. Their findings suggest that over a 5-year holding period, IPOs and seasoned equity offerings bring about 5% and 7% return, respectively. In a similar study, Keloharju (1993) examines the long-run underperformance phenomenon in the Finnish stock market (Helsinki Stock Exchange) and reveals that investing in a value-weighted index brings about 21% more return than investing in an IPO firm over a 3-year holding period. The most prominent explanation for the long-run poor return performance of IPO firms is the investors’ overoptimism in IPO stocks (Teoh, Welch, & Wong, 1998) at the time of IPO. Firms, especially those in need of large proceeds from their IPOs, tend to manage their earnings and exhibit a well-dressed financial position to the IPO market, which consequently increases the optimism in the market for issuing firms. However, in the aftermarket, as more information is disclosed and stock prices tend to descent to their true value, IPO firms experience long-run return deteriorations. Timing of IPOs also tends to influence an IPO’s long-run returns affected largely by the market conditions (Ritter & Welch, 2002). For instance, examining three consecutive time periods, Ritter and Welch (2002) report significantly different long-run returns over a 3-year holding period for the time periods 1980 to 1989, 1990 to 1994, and 1995 to 1998 with returns of 6.9%, −12.7%, and 11.6%, respectively.
It is evident that geographically dispersed firms have certain advantages such as having easy access to skilled workforce, possesing larger customer base, proximity of natural resources, and benefiting from corporate tax breaks (Gao et al., 2008) relative to local firms. Furthermore, based on the economies of scope and synergy hypothesis, diversification allows firms to efficiently transfer their core capabilities such as product lines, knowledge base, and experience across their businesses (Penrose, 1959; Rumelt, 1982). In addition to these resource-based advantages of diversification, it has also been shown that diversification can reduce the volatility of cash flows (CFs). Using the pure-financial diversification as their diversification construct, Amit and Livnat (1988) report that diversification results in more stable operating CFs. If geographically dispersed restaurant firms make use of these advantages in their post-IPO life, they can sustain a less severe decline in their post-IPO returns. Also, if these advantages associated with geographic dispersion are perceived as a positive signal, it could further contribute positively to the post-IPO returns of restaurant firms. To test this proposition, following hypothesis is formulated:
Hypothesis 2: Geographically dispersed restaurant firms yield higher long-run returns in the post-IPO period relative to local restaurant firms.
Methodology
Sample of the Study
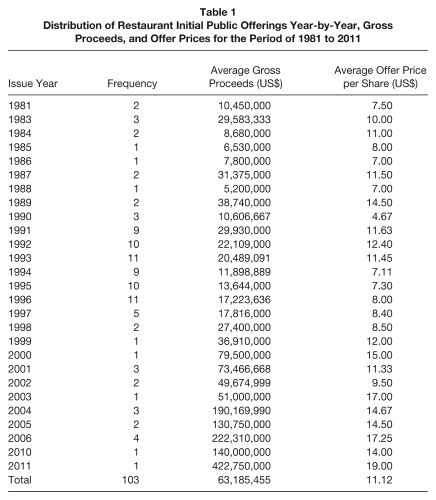
The sample of restaurant IPOs is derived from SDC’s new issue database. An initial search of this database, using the Standard Industrial Classification (SIC) code 5812 for “Eating Places,” returns a total of 222 restaurant IPOs conducted between 1970 and 2012 in the U.S. financial markets. Of this total, 118 issues were initially eliminated due to the lack of access to their IPO prospectuses. IPO prospectuses are collected from Thomson One Banker’s database. A significant number of restaurant IPOs that are initially eliminated from the study belongs to older time periods for which electronic copies of prospectuses are not available at the Thomson One Banker’s company filings. For other excluded IPOs, neither electronic copies nor paper copies were available at Thomson One Banker’s company filings or in Securities Exchange Commission’s (SEC) Edgar Online database. After eliminating those issues and one issue with no pricing information available, the final sample included 103 IPOs. Then the remaining issues were merged with Compustat and CRSP (The Center for Research in Security Prices) files to obtain accounting and return data of the IPO-issuing firms. Monthly Fama–French factors are collected from the CRSP database to construct Fama and French (1993) three-factor model returns for long-run return hypothesis. Table 1 exhibits the distribution of restaurant IPOs over the three decades along with average offer prices and gross proceeds generated from their issues.
Distribution of Restaurant Initial Public Offerings Year-by-Year, Gross Proceeds, and Offer Prices for the Period of 1981 to 2011
Dependent Variables
The current article focuses on two performance indicators, one of which is the short-run IPO performance as observed in the first trading day. The second is the long-run stock performance, which is observed over a 3-year period in the post-IPO period. In accordance with previous IPO studies, the study employs initial stock returns as the indicator of short-run IPO performance (Loughran & Ritter, 1995; Ritter, 1991) and uses cumulative abnormal returns (CARs) as the long-run IPO performance (Fama, 1998). Initial returns are operationalized as the difference between the closing price of first trading day and the offer price, divided by the offer price (Carter et al., 1998; Ritter, 1987; Ritter & Welch, 2002). For this operationalization of initial returns, offer prices were collected from SDC database, and IPO prospectuses when they are not available on SDC database. First-day closing prices come from the CRSP daily return files. Below is the operationalization of initial returns:

where IR is the initial returns in percentages, Pricec is the first-day closing price, and Priceo is the offer price for the IPO shares.
Previous research on IPO long-run returns predominantly use two return measures: CARs and buy-and-hold returns (Fama, 1998; Loughran & Ritter, 1995; Ritter, 1991). The current study follows the broadly used operationalization of long-run returns and adheres to CARs for a period of 3 years subsequent to IPO issue date. CRSP value-weighted and equal-weighted market indices are used as the ordinary benchmarks of market performance. To construct the value-weighted and equal-weighted CARs, first monthly abnormal returns are computed as follows:
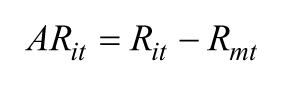
where Rit is the monthly return for firm i in event month t, Rmt is the return on the CRSP value-weighted index or the CRSP equal-weighted index in the event month t. To test the difference in CARs between local and dispersed restaurant firms, CARs are calculated as follows:
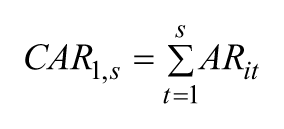
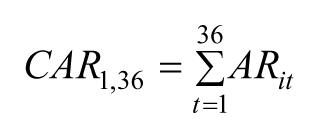
where ARit is the abnormal return for firm i in event month t. For the post-IPO difference tests in the first, second, and third year-ends, CARs are basically sum of the abnormal returns over 12, 24, and 36 months for each firm. In the regression estimations of long-run returns, the study uses the firm level 3-year CARs as the dependent variable. It is simply the sum of monthly abnormal returns of firm i over 36 months subsequent to the IPO month.
In addition to the use of CRSP value-weighted and equal-weighted indices for computing abnormal returns, the study also employs Fama–French three-factor model (Fama & French, 1993) to construct a market model based abnormal return measure for the long-run return hypothesis. In the Fama–French three-factor model, excess return on a firm’s stock is explained by three main factors: market excess return, size (SMB), and book-to-market ratio (HML). The model is specified as follows in Fama–French’s original work:

where Ri is the monthly raw return on firms i, Rf is the risk-free interest rate on 1-month U.S. Treasury bill, Rm − Rf is the excess return on the market (the value-weighted return on all NYSE, AMEX, and NASDAQ stocks [from CRSP] minus the 1-month Treasury bill rate), SMB (Small Minus Big) is the average return on the three small portfolios minus the average return on the three big portfolios, and HML (High Minus Low) is the average return on the two value portfolios minus the average return on the two growth portfolios. Then the abnormal return using this market model is simply the raw return minus the expected return from the Fama–French three-factor model.

Independent Variables
The main variable of interest of the current study is a firm’s geographic dispersion. Previous studies have defined geographic dispersion in several ways. For instance, Garcia and Norli (2012) define a firm as geographically dispersed if its business activities are spread over more than two U.S. states, local otherwise. To construct their measure of geographic dispersion, they extract the state name counts from annual reports filed with the SEC on form 10-K. Based on the state name counts on form 10-K, they classify firms as geographically dispersed if a large number of states are mentioned in the annual report, and as local if only one or two states are mentioned. Other studies such as those of Gao et al. (2008) relate the geographic dispersion of a firm to having main subsidiaries outside the region of the firms’ headquarters, and classify firms as geographically dispersed if a firm has at least one main subsidiary outside the region where the headquarter is located, local otherwise. This study adapts the same operationalization as used in Garcia and Norli (2012); however, the state name counts are extracted from IPO prospectuses rather than form 10-K since the prospectus is the only available company report at the time of IPO. An IPO prospectus is a comprehensive registration document filed with SEC and provides detailed and inclusive information about the filing firm. The type of information included in the prospectuses ranges from the summary of recent performance to specific business activities. The operationalization of geographic dispersion, as used in Garcia and Norli (2012), relies on creating a dummy variable, which is used as the base model in this study (Model 1). If a restaurant firm has operations in more than two U.S. states, the firm is classified as geographically dispersed and the dummy variable (DISP) takes a value of 1. If the firm’s operations are limited to two or less U.S. states, then the firm is classified as local, and the dummy variable (DISP) takes a value of 0. The current study also uses median number of state name counts as the threshold of being local or dispersed (Model 2); and natural logarithm of number of state name counts (Model 3), which examines the effect of degree of geographic dispersion on initial returns and postevent long-run returns of restaurant IPOs.
Control Variables
To control for the potential confounding effects of previously examined constructs in explaining the variation in IPO initial returns and long-run returns, the study includes a set of control variables in the regression models.
Consistent with previous research, the current study includes underwriter quality, venture capital backing, and auditor quality as the signals of quality of issuing firms. The positive effect of underwriter quality on reducing information asymmetry between issuers and investors has been evidenced in several studies (Carter & Manaster, 1990; Carter et al., 1998; Johnson & Miller, 1988; Megginson & Weiss, 1991; Michaely & Shaw, 1994), which consistently report lower initial returns for issues underwritten by prestigious underwriters. This study uses the underwriter quality metric (hereafter CM metric) developed by Carter and Manaster (1990). This metric ranks the investment bankers based on their appearance on the “tombstone announcements” of IPOs. Those investment bankers that grant a prior appearance on the tombstone announcement is ranked higher versus another one that appears later in the announcement. They develop a scale from 1 to 9 to rank the investment bankers on this basis and investment bankers on the higher tail are regarded more prestigious compared with those in the lower tail of the scale. The median value of CM metric (7.001 in the current sample) is used as the cutoff point, and those issues with a CM value of higher than 7.001 are classified as being underwritten by a prestigious underwriter. All other issues are classified as having a nonprestigious underwriter. Venture capitalists are also regarded a significant role player in the IPO issues for their part in revealing the low risk profile of the issuing firms. Venture capitalists bring managerial expertise to the firms they take part in; and often invest in potentially value promising firms (Megginson & Weiss, 1991). Besides, venture capital involvement in an IPO significantly reduces the risk associated with that issue because of the monitoring power of venture capitalist on the invested firms (Barry et al., 1990; Megginson & Weiss, 1991). With the reduced risk led by the certification of venture capital backing on IPO issues, lower initial returns are expected on the IPOs of firms that have some sort of venture capital investment in their capital structure. This study, therefore, controls for the potential effect of venture capital involvement in the analysis by including a dummy indicator that indicates whether an IPO firm has any venture capital funding or not at the time of issuance. If there is venture capital funding, the dummy variable takes on a value of 1, 0 otherwise. The last control variable for certification matter is the auditor quality. Previous studies in IPO literature, as well as in broader finance and accounting research, point out to positive role of auditor quality on signaling an event firm’s true quality to the related stakeholders. The certification role of high-quality auditors in the IPO context relies on the presumption that high-quality auditors have reputational stake built over time for their expertise and success in accurately and truthfully auditing disclosing firms, and that they desire to protect this reputational stake to secure future business prospects (Balvers et al., 1988; Carter et al., 1998; Jain & Kini, 1994; Jain & Martin, 2005; Michaely & Shaw, 1994). Therefore, IPO firms audited by prestigious auditors are expected to disclose truthful and faithful representation of their financial position at the time of their IPOs. In turn, this truthful and faithful representation is presumed to divulge positive signal to the investors leading to lower risk expectation and consequently less underpricing for these firms. Hence, to control for this further certification factor the study includes a dummy variable for auditor quality. To define whether an auditor is a prestigious one or not, the study adheres to widely used construction of Big-4 auditors. If the auditor of issuing firms is one of Big-4 auditors, the dummy variable takes on a value of 1, 0 otherwise. 2 Further control variables of the models are issue size and age of the issuing firms. Natural logarithm of gross proceeds is included in the base regression models to account for any systematic influences depending on issue size. Issue size is often used as the proxy of the firm size (Carter et al., 1998; Ritter, 1991). Ritter (1991), for instance, reports that smaller firms tend to have worse post-IPO return performance compared with larger firms. Firm age at the time of IPO is also a significant contributor to explain IPO initial returns. Naturally, firms with longer business history possess extensive operating and managerial experience as well as considerable market awareness. On the other hand, younger firms suffer drastically from lacking experience, especially at an IPO event. Therefore, these firms are more speculative compared with older, more established firms and the risk associated with the younger firms is relatively higher (Carter et al., 1998; Hensler, Rutherford, & Springer, 1997). It is also evident that older firms perform better in the post-IPO period compared with younger firms (Ritter, 1991). To control for this age affect, natural logarithm of one plus the age of the firm at the IPO date is included in the empirical models. Last, to account for any macro-level factors that could affect all the IPO issues in the same way in a given year, year dummies are included in the regression models, but not reported in the findings for clarity and brevity.
Results
Descriptive Statistics
Table 1 displays the number of restaurant IPOs year-by-year along with average gross proceeds and average offer prices. Average offer prices show slight swings across the years dipping a low of $4.67 in 1990, and reaching a maximum of $19 in 2011. After 1998, average offer price of restaurant IPOs consistently attains two digits, and follows an upward trend thereafter. Average gross proceeds of restaurant IPOs also demonstrate an increasing pattern following the first part of 1990s. Over the three decades, the average restaurant IPO has generated $63.2 million. This is considerably higher than the $26 million reported in Dalbor and Sullivan’s (2005) sample of 59 restaurant IPOs. Yet the average offer price of $11.12 is quite consistent with their reported average of $10.03. Table 2 presents summary statistics for the measure of geographic dispersion along with initial returns, long-run returns and issue-specific characteristics. During the years of 1981 to 2011, 103 restaurant IPOs examined in the current study experience 18% underpricing in their first trading day. This particular finding is quantitatively similar to the one (18.4%) reported in Dalbor and Sullivan’s (2005) study. To compare the current study’s findings with those of larger studies covering multiple industries in their sample, particular time periods need to be observed. The reason for doing so is that IPO initial returns show significant year-by-year variation and could be best assessed in their respective time period (Ritter & Welch, 2002). For instance, Ritter and Welch (2002) reported IPO first-day returns increasing from 7.4% in the 1980s to 11.2% in the early 1990s, to 18.1% in the mid-1990s, and to 65% in 1999 and 2000, before reducing back to 14.0% in 2001. In these time periods, restaurant IPOs experience an underpricing of 10.44% in the 1980s, 18.97% in the 1990 to 1999 period, 43.54% in the 1999 to 2000 period, and 18.17% in the 2000 to 2011 period. Although there is some discrepancy, restaurant IPOs’ first-day returns are quantitatively close to average returns in respective time periods. An interesting finding is that in hot–IPO markets such as that of “Internet Bubble” period of 1999 to 2000, during which a large number of small information technology firms went public, even restaurant firms promoted their issues with extensive first-day returns of 43.54%. Value-weighted and equal-weighted 3-year CARs of restaurant IPOs were found to be −18.1% and −17.15%, respectively. Table 2 also displays descriptive statistics related to the characteristics of the restaurant firms in the sample of this study. Average number of states a restaurant firm operates in is 10.13, ranging from as low as 1 to all 50 states of the United States. Based on Garcia and Norli’s (2012) construction of geographic dispersion, 66% of the sample firms are geographically dispersed whereas 34% are classified as local. Thirty-nine percent of the restaurant IPOs were underwritten by a prestigious underwriter by the CM scale, and 38% of them had at least one venture capital fund in their capital structure at the IPO date. A large portion, 77%, of the restaurant IPOs was audited by a prestigious audit company at the time of their IPO. Average firm age at the time of IPO was 10.57 years. Eight restaurant firms issued an IPO at the same year of their incorporation.
Summary Statistics of Selected Data for the Restaurant IPOs Conducted During 1981 to 2011
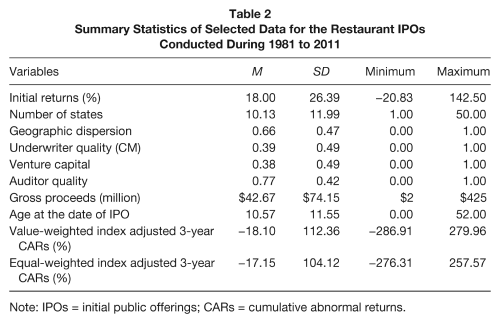
Note: IPOs = initial public offerings; CARs = cumulative abnormal returns.
Empirical Findings
Geographic Dispersion and Initial Returns of Restaurant IPOs
The empirical analysis begins with running a set of difference tests to examine the restaurant IPOs’ initial returns. The goal of this preliminary analysis is to find out whether first-day returns of geographically dispersed restaurant firms are different from the returns of local firms. Panel A of Table 3 reports the result of the difference tests for the case in which a restaurant firm with operations in more than two states are defined as being geographically dispersed, local otherwise. Both conventional t test and nonparametric Wilcoxon rank-sum test results are reported. Average first-day returns of geographically dispersed and local restaurant firms are quantitatively similar and no statistical difference is observed between the mean returns based on both parametric (t statistic = −0.25) and nonparametric (z statistic = −0.105) test statistics. Panel B resembles the analysis of Panel A. In this analysis, restaurants having operations in a number of states that is more than the median number of state name counts (4.5) are categorized as geographically dispersed. This further sensitivity analysis offers support for the prior finding of no statistical difference in the mean first-day returns between dispersed and local restaurant firms. Table 3 also illustrates that CFs and accounting performance, return on assets, of geographically dispersed restaurant firms are no different from the local firms at the year of IPO.
Difference Tests of Initial Returns, Cash Flows, and Accounting Performance (ROA)
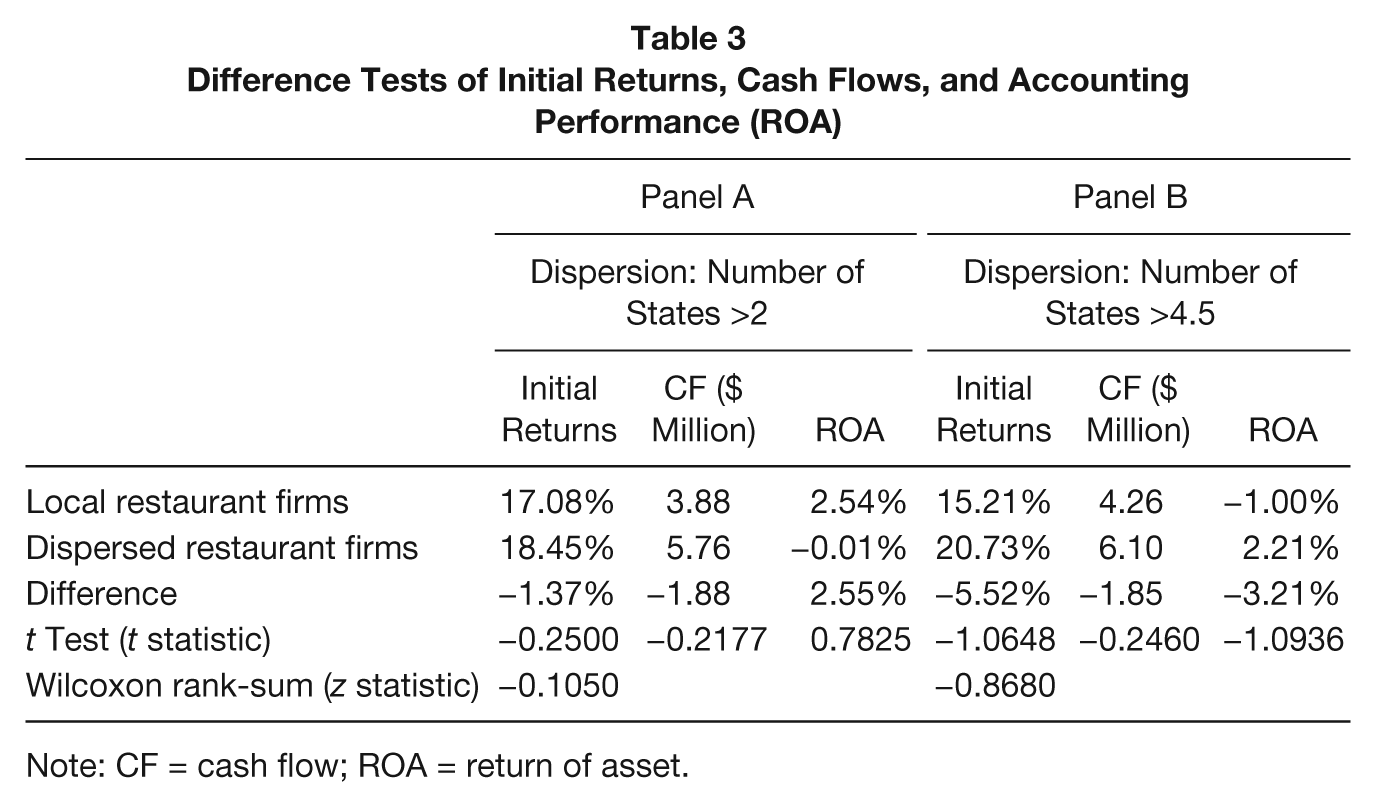
Note: CF = cash flow; ROA = return of asset.
Cross-Sectional Regression of IPO Initial Returns
In this section, three baseline regression models that are structured to examine the effect of geographic dispersion on the short-run IPO performance of restaurant firms are estimated. Model 1 uses the operationalization of Garcia and Norli (2012) as the proxy of geographic dispersion. Model 2 uses the median number of state name count as the cutoff point to separate geographically dispersed restaurant firms from local restaurant firms. Model 3 employs the degree of geographic dispersion rather than a dummy indicator. Degree of geographic dispersion is defined as the natural logarithm of the number of state name counts collected from the IPO prospectuses (Sorenson & Sorensen, 2001). All three regression models are estimated via ordinary least square regression (OLS). Potential multicollinearity among the independent variables is investigated by examining the bivariate correlations before the models are estimated. No significant correlation is detected among independent variables before the regressions are run. As a postestimation check, variance inflation factors are computed after running regressions. None of the variance inflation factors for the explanatory variables is higher than the suggested cutoff value of 10 (Hair, Black, Babin, & Anderson, 2010) suggesting no significant multicollinearity.
Results of Model 1 are reported in Panel A of Table 4. As shown in Panel A, the study finds no significant effect of geographic dispersion on the initial returns of restaurant IPOs. Thus, neither the information asymmetry Hypothesis (1a) nor the investor recognition Hypothesis (1b) is supported in the particular examination of effect of geographic dispersion on initial returns. Three control variables included in the base regression models to account for previously discussed certification factors—underwriter quality, venture capital backing, and auditor quality—produced positive coefficients with the first two being statistically significant. These findings are contrary to most previous research in the IPO literature, but consistent with Dalbor and Sullivan’s (2005) restaurant-industry study. As it was previously discussed, these IPO-specific qualities are contemplated to expose positive signals to the IPO investors about the true quality of issuing firms and therefore are assumed to reduce the magnitude of initial returns. Yet the current sample of restaurant firms does not conform to this expectation. Restaurant firms associated with a prestigious underwriter or a venture capitalist in their IPO experience higher IPO underpricing. Quantitatively, being underwritten by a prestigious underwriter leads to 18.889 percentage point increase in the initial returns; and having a venture capital investment at the time of IPO results in 13.004 percentage point increase in the initial returns of restaurant IPOs. Firm size, on the other hand, does not relate to restaurant firms’ initial returns for the sample firms. Age, as expected, reduces the restaurant firms’ initial returns about 9.034 percentage points. Estimation of Models 2 and 3 provide almost identical results to those of Model 1. In both models, geographic dispersion of restaurant firms does not seem to relate to restaurant firms’ IPO initial returns. Underwriter quality and venture capital indicators have significant coefficients in both models with slightly different magnitudes from Model 1. Firm age is consistently negative and implies a reduction of about 8% in the initial returns as firms grow 1 year older at their IPO date.
Cross-Sectional Regression of Initial Returns on Dispersion and Control Variables
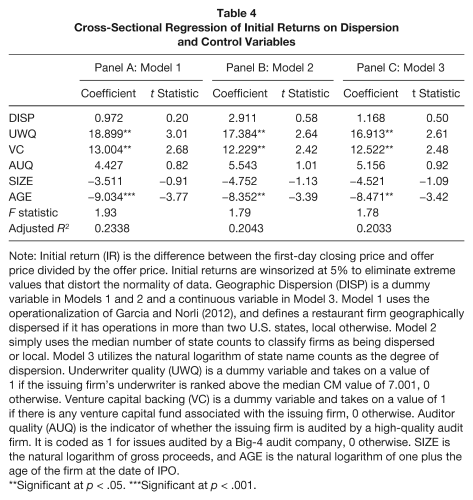
Note: Initial return (IR) is the difference between the first-day closing price and offer price divided by the offer price. Initial returns are winsorized at 5% to eliminate extreme values that distort the normality of data. Geographic Dispersion (DISP) is a dummy variable in Models 1 and 2 and a continuous variable in Model 3. Model 1 uses the operationalization of Garcia and Norli (2012), and defines a restaurant firm geographically dispersed if it has operations in more than two U.S. states, local otherwise. Model 2 simply uses the median number of state counts to classify firms as being dispersed or local. Model 3 utilizes the natural logarithm of state name counts as the degree of dispersion. Underwriter quality (UWQ) is a dummy variable and takes on a value of 1 if the issuing firm’s underwriter is ranked above the median CM value of 7.001, 0 otherwise. Venture capital backing (VC) is a dummy variable and takes on a value of 1 if there is any venture capital fund associated with the issuing firm, 0 otherwise. Auditor quality (AUQ) is the indicator of whether the issuing firm is audited by a high-quality audit firm. It is coded as 1 for issues audited by a Big-4 audit company, 0 otherwise. SIZE is the natural logarithm of gross proceeds, and AGE is the natural logarithm of one plus the age of the firm at the date of IPO.
Significant at p < .05. ***Significant at p < .001.
Geographic Dispersion and Long-Run Returns of Restaurant IPOs
This section examines the post-IPO performance of restaurant stocks and provides evidence regarding the effect of geographic dispersion on the long-run return performance. The analysis begins with constructing local and dispersed restaurant firm groups based on the state name counts collected from the prospectuses. As it was discussed in previous sections, the study includes restaurant IPOs in the dispersed group if the number of state names mentioned in an IPO prospectus is greater than two. All other issues are included in the local group. The measure of long-run, post-IPO return performance for restaurant firms is 3-year CARs. Conventional t tests for 12-, 24-, and 36-month CARs of local and geographically dispersed restaurant firms are run in an attempt to see whether being dispersed versus being local makes a difference in the stock returns of restaurant firms following their IPOs. Table 5 shows the results of this analysis. The notable observation is that local restaurant firms suffer drastically in the post-IPO period with a monotonic decline in their long-run returns. The magnitude of the difference for CARs of local and dispersed restaurant firms is considerably small at the end of first post-IPO year, but it gets severe in the second and third years. However, it should be noted that the difference in the CARs of local and dispersed restaurant firms is only significant at the end of third year. The magnitude of difference as well as the significance level is robust to specifications of value-weighted CARs and equal-weighted CARs. When long-run returns of restaurant IPOs are adjusted using Fama–French three-factor model, both local and dispersed firms yield positive returns in the first post-IPO year. Starting with the second year, local restaurant firms’ returns revert to negative whereas the dispersed firms continue to have positive returns till the end of the third post-IPO year. In light of this preliminary analysis, it can be cautiously concluded that geographically dispersed restaurant firms offer a better future return prospect compared with local firms in the 3 years following an IPO event. Previous studies (Carter et al., 1998; Ritter, 1991) consistently report negative long-run returns for IPO stocks over 3- and 5-year periods. Consistent with those prior findings, the current study also finds −18.10% and −17.15% 3-year return using value-weighted and equal-weighted index adjusted CARs for the entire sample which is mostly close to the long-run underperformance (−19.92%) of IPO stocks reported by Carter et al. (1998). Although the findings of the current study are mostly consistent with the findings of long-run return studies mentioned above, negative value-weighted and equal-weighted 1-year CARs for restaurant IPOs are contrary to that of only other restaurant industry-related long-run return study. Canina (1996) reports 14.96% 1-year post-IPO excess returns for a group of restaurant firms. 3 Fama–French three-factor model adjusted 1-year post-IPO returns of the current study are similar to the results reported in Canina (1996) in the sense of yielding positive returns.
Long-Run Returns of Local and Dispersed Restaurant Firms Over 12, 24, and 36 Months
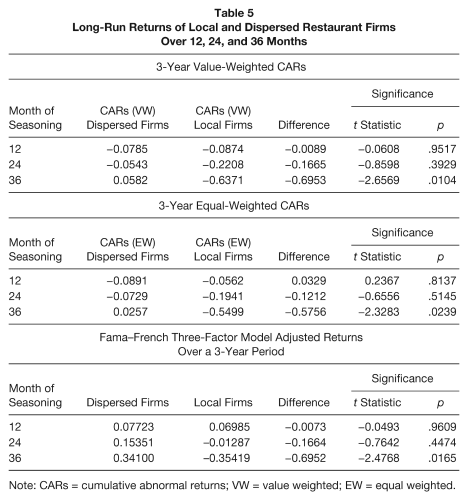
Note: CARs = cumulative abnormal returns; VW = value weighted; EW = equal weighted.
Cross-Sectional Regression of Long-Run Returns
The previous section provides preliminary evidence that in the post-IPO period restaurant firms with geographically dispersed operations experience less negative long-run returns compared with local restaurant firms in the 2 years subsequent to IPO date and achieve positive returns in the third year. The current section tests the long-run return hypothesis via OLS regression. Three-year value-weighted and equal-weighted CARs and Fama–French three-factor model adjusted returns are regressed on the main interest of dispersion variable along with control variables previously discussed. Issues with high initial returns tend to have worse long-run returns than issues with lower initial returns (Ritter, 1991). To control for this effect, initial returns are also included in the long-run return models as an additional control variable. Table 6 provides the results of these estimations. First and foremost observation from Table 6 is the positive relationship between geographic dispersion and long-run returns of restaurant IPOs. The positive coefficients on the dispersion (DISP) variable are suggestive that geographic dispersion increases the value-weighted CARs by about 0.94 (t statistic = 3.23) percentage point and equal-weighted CARs by about 0.84 (t statistic = 3.07) percentage points, on average. Likewise, the abnormal returns from the Fama–French three-factor model yields a statistically significant positive coefficient on the dispersion variable, 0.9444 (t statistic = 3.28), suggesting 0.94 percentage point difference in the long-run abnormal returns of geographically dispersed and local restaurant firms in favor of dispersed firms. Overall, OLS estimations confirm the findings of preliminary difference tests and imply that having geographically dispersed operations gives certain advantages to small-cap restaurant firms in the post-IPO period to achieve better long-run returns. These advantages may be driven from the resources attainable in a wide array of locations, improved market share in those locations, and perceived managerial talent expected to be developed via operations in various markets. It should reasonably be argued that investors are aware of these advantages and positively incorporate this information into their pricing activity. Yet it should also be noted that there is a clear negative trend in the post-IPO stock returns of geographically dispersed firms as expected and seen in most IPO issues, yet this negative trend reverses to positive toward the end of third year. In the same time period, local restaurant firms consistently suffer from large negative returns.
Cross-Sectional Regression of Long-Run Returns

Note: CAR = cumulative abnormal return; VW = value weighted; EW = equal weighted. Initial return (IR) is the difference between the first-day closing price and offer price divided by the offer price. Geographic Dispersion (DISP) is a dummy variable that takes a value of 1 if number of state counts is greater than 2, 0 otherwise. Underwriter quality (UWQ) is a dummy variable and takes on a value of 1 if the issuing firm’s underwriter is ranked above the median CM value of 7.001, 0 otherwise. Venture capital backing (VC) is a dummy variable and takes on a value of 1 if there is any venture capital fund associated with the issuing firm, 0 otherwise. Auditor quality (AUQ) is the indicator of whether the issuing firm is audited by a high-quality audit firm. It is coded as 1 for issues audited by a Big-4 audit company, 0 otherwise. SIZE is the natural logarithm of gross proceeds and AGE is the natural logarithm of one plus the age of the firm at the date of IPO.
Significant at p < .1. **Significant at p < .05.
Consistent with previous studies, the current study reports that long-run returns are negatively related to restaurant IPOs’ initial returns (Ritter, 1991). This particular finding is evident by statistically and economically significant negative coefficients of −0.4481, −0.4080 and −0.4199 on the initial returns variable in three models. The study further provides evidence that restaurant IPOs underwritten by a prestigious underwriter tend to perform better in the long-run compared with those IPOs taken public by less prestigious underwriters consistent with Michaely and Shaw (1994) and Carter et al. (1998).
Robustness Tests
Traditional asset pricing models such as capital assets pricing model and/or Fama–French three-factor model have been extensively used to examine the average stock returns. However, it is also argued that these traditional pricing models have lost their ground over the past decades primarily due to the fact that beta is found to be inadequate in explaining cross-sectional differences in average returns. Hence, researchers have explored the effect of firm-specific variables such as price-to-earnings (P/E) ratio (Basu, 1977), debt-to-equity (D/E) ratio (Bhandari, 1988), and asset growth (Cooper, Gulen, & Schill, 2008) on average stock returns. P/E ratio is claimed to be an indicator of future investment performance of a security (Basu, 1977). Proponents of this indicator argue that low P/E securities tend to outperform high P/E stocks. Likewise, Bhandari (1988) suggested D/E ratio as an additional risk proxy to explain the difference in expected common stock returns. He documented a positive association between expected common stock returns and D/E ratio controlling for the beta and firm size. Last, Cooper et al. (2008) reported a statistically and economically significant difference in the future common equity returns between firms with low asset growth (ASG) rates and firms with high ASG rates, and concluded that asset growth rate has a substantial potential in predicting cross-section of stock returns. Therefore, in this section, these three additional firm characteristics are added into the long-run return models to provide evidence for the robustness of the main results in the presence of these new variables.
Results of the robustness tests are provided in Table 7. Primary findings from the main tests are supported with these additional tests for value-weighted and equal-weighted CARs. Main interest of variable, geographic dispersion, retains its significance and direction in the sensitivity tests, however, the magnitude of the effect slightly decays as evidenced by a lower coefficient value. Other control variables also produce quantitatively similar results to those reported in Table 6. D/E ratio returns a statistically significant positive coefficient, which supports the claim that highly levered firms’ common equity is associated with higher future returns. Basically, as debt financing of restaurant firms increases, so do the expected returns. ASG produces an intriguing positive signal that is opposite to the argument raised and supported by Cooper et al. (2008). In light of these additional tests, the main results of the study are further supported, which increases the confidence in the study’s empirical models.
Effect of Additional Firm Characteristics on the Cross-Section of 3-Year CARs
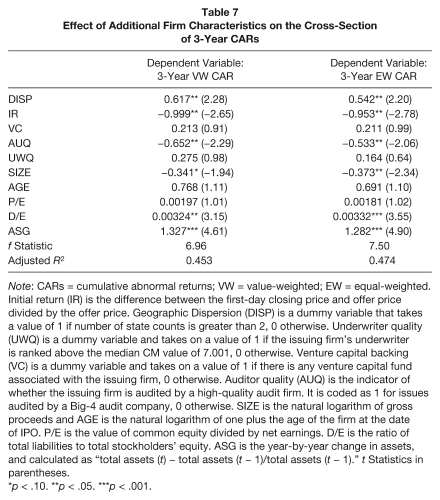
Note: CARs = cumulative abnormal returns; VW = value-weighted; EW = equal-weighted. Initial return (IR) is the difference between the first-day closing price and offer price divided by the offer price. Geographic Dispersion (DISP) is a dummy variable that takes a value of 1 if number of state counts is greater than 2, 0 otherwise. Underwriter quality (UWQ) is a dummy variable and takes on a value of 1 if the issuing firm’s underwriter is ranked above the median CM value of 7.001, 0 otherwise. Venture capital backing (VC) is a dummy variable and takes on a value of 1 if there is any venture capital fund associated with the issuing firm, 0 otherwise. Auditor quality (AUQ) is the indicator of whether the issuing firm is audited by a high-quality audit firm. It is coded as 1 for issues audited by a Big-4 audit company, 0 otherwise. SIZE is the natural logarithm of gross proceeds and AGE is the natural logarithm of one plus the age of the firm at the date of IPO. P/E is the value of common equity divided by net earnings. D/E is the ratio of total liabilities to total stockholders’ equity. ASG is the year-by-year change in assets, and calculated as “total assets (t) − total assets (t − 1)/total assets (t − 1).” t Statistics in parentheses.
p < .10. **p < .05. ***p < .001.
Discussion
The current study examines the initial returns and long-run performance of restaurant IPOs and tries to explain the effect of geographic dispersion on these IPO performance measures. The expectation for IPO initial returns of restaurant firms was twofold. First, the restaurant chains that are highly dispersed are subject to a greater degree of information asymmetry; therefore, the risk associated with them should be perceived higher. Awareness of this high risk profile should then entail higher initial returns for geographically dispersed restaurant firms. Second, by Merton’s (1987) investor recognition hypothesis, local restaurant firms should offer larger returns to compensate their investors for the lack of insufficient diversification. Basing the predictions on these grounds, the study uses the number of states a restaurant firm operates in as the measure of geographic dispersion. The study finds no significant effect of dispersion on the restaurant firms’ IPO initial returns. This finding suggests that there is no clear pricing implication of restaurant firms’ geographic dispersion at the time of an IPO event. The analysis finds support neither for the information asymmetry hypothesis nor for the investor recognition hypothesis for restaurant IPOs. The insignificant finding is intriguing, and contradictory to the predictions of investor recognition hypothesis as discussed in Garcia and Norli (2012). By Merton’s (1987) investor recognition hypothesis, firms with limited geographic diversification are already disadvantaged because they are unable to provide diversification to their investors. Hence, they deliberately offer high returns to their investors. It follows from here that at an IPO event, in which firms are highly unknown to the investors and there are few avenues to extract information about issuing firms, the magnitude of suffering from inadequate diversification should be exacerbated. Yet the findings are indicative that local restaurant firms do not underprice their issues to a greater degree than the dispersed firms. One of the reasons for this finding might be related to the fact that there exists no established and knowledgeable investor community for restaurant IPOs. This is tightly related to the fact that restaurant IPOs are always argued to be undervalued and not being covered by equity analysts because of the small-cap nature of the industry (Madanoglu & Karadag, 2009). Lack of industry analyst coverage as well as no strong emphasis in the small-cap firms might be causing further informational disadvantages for the restaurant firms at an IPO event and making important information such as geographic dispersion irrelevant for investors. Alternatively, investors of restaurant IPOs might not see the geographic dispersion as much destructive as expected in this study, because dispersion may also provide certain advantages for an IPO firm both at the date of IPO and in the post-IPO period. Therefore, investors may be perceiving dispersion as a two-sided signal and find it irrelevant or risky to incorporate it into their initial pricing decision. Furthermore, the findings indicate that restaurant IPOs with a prestigious underwriter and venture capital backing experience higher initial returns. There is not an easy explanation of this finding because these certifications have consistently been shown to reduce the level of underpricing. Therefore, the positive coefficients on these variables can perhaps be explained by an anomaly related to sample of the study. From this standpoint, the insignificant finding for the geographic dispersion hypothesis might be just another anomaly pertained to the sample.
Post-IPO poor returns are an illustration of initial overoptimism on the IPO firms and the consequent normalization of stock returns. This clear underperformance of IPO firms is no surprise for the financial markets. Considerable amount of research have provided evidence that firms go public when the market players are overly optimistic about the growth potential of IPO issuing firms (Loughran & Ritter, 1995). Also, as researchers claim that marginal, most optimistic investors tend to set share prices at IPO issues and as time passes and information flow enriches in the post-IPO period divergence of expectations narrows and prices move downward. In the case of the restaurant firms, we see that returns are sensitive to the adjustment benchmarks used. When the value-weighted and equal-weighted returns are used to calculate abnormal returns, long-run returns of restaurant IPOs underperform the market significantly. However, the magnitude of suffering is far less for dispersed restaurant firms, and in the third year-end returns of dispersed restaurant firms exceed the market returns. Fama–French three-factor model adjusted returns yield different results. When these returns are used as the measure of long-run returns, it is observed that dispersed restaurant firms continuously produce positive long-run returns whereas local firms suffer from negative long-run returns starting with second year following an IPO event. This quantitative difference between the value (equal)-weighted index adjusted returns and Fama–French three-factor model adjusted returns is no surprise though, because as Fama (1998) argue that long-term returns are sensitive to the methodology used to construct the abnormal returns. Despite the quantitative differences between market adjusted and Fama–French three-factor model adjusted returns, it can be said that dispersed firms promise a better long-run performance in the post-IPO period as evidenced by the findings of difference tests and regression results. Hence, the results of the study suggest that largely documented negative returns in the after-market are mitigated to some extent by the advantages of dispersed operations. IPO investors on the restaurant stock with long-holding horizons may utilize this information to their best advantage to discern value-promising firms from others. Furthermore, this particular result regarding the long-run returns offer further insights for private restaurant firms and their managers that plan an IPO about their future stock performance given their dispersion status. Although the current study does not shed significant light on the timing of an IPO in the corporate life cycle of a restaurant firm, findings imply that a priori geographic diversification helps maintain strong stock returns in the post-IPO period relative to remaining local.
The study’s findings regarding the long run returns provide valuable insights not only for the IPO literature, but also for diversification literature. Hospitality firms’ diversification strategies have been examined in few prior studies, and there does not seem to exist a consensus on whether diversification is value enhancing corporate strategy or not. For instance, Lee and Jang (2007) provided clear evidence of a positive impact of within-industry diversification on hotel firms’ stability of financial performance. In a further study, Jang and Tang (2009) exhibited a moderating effect of international diversification on the relationship between financial leverage and profitability in the hotel industry. Likewise, Tang and Jang (2010) reported that firm value discounts are present for hotels with high international diversification. Specific to the restaurant industry, Park and Jang (2012) examined diversification–profitability relationship, and suggested a convex-type curvilinear relationship. Their results imply a decreasing profitability at low levels of diversification of restaurant firms, followed by upward turn in profitability after a certain threshold is attained in diversification. Along with these prior studies, the current study reveals that restaurant firms’ stocks with geographically diverse operations perform better in the long-run (in the 3-year study period) compared with local restaurant firms following a major corporate event. From firms’ perspective, this occurrence is a proof of successful implementation of a well-adopted corporate strategy for restaurant firms, which is likely to result in higher confidence and trust in the equity of the firms. This is especially important for investors looking for diversification in a firm structure, because these knowledgeable investors are aware that diversification is an effective strategy in reducing variability in earnings (Lee & Jang, 2007). Furthermore, better long-run performance of geographically dispersed restaurant firms are in accordance with the resource-based view (Barney, 1991; Wernerfelt, 1984). Dispersed restaurant firms are able to establish resources and capabilities to achieve competitive advantages that help position themselves at superior position compared with local restaurant firms that lack a lot of resources that are easily accessible by dispersed firms. Obviously, this phenomenon would not go unnoticed by the investors, and the pricing is adjusted accordingly. In addition to portfolio diversification of investors and resource-based view explanations of superior return performance of dispersed restaurant firms versus local restaurant firms, the results also demonstrate a clear association between returns and financial leverage D/E as suggested by the fundamentals of capital markets. Leverage is obviously an important form of raising capital for firms to fund expansion through various markets. In untabulated results, the current study finds that D/E ratio and geographic dispersion is positively correlated, which is an expected finding assuming that expansion firms are in need of intensive capital inflow and are ready to bear the risk brought by high leverage. Yet in the long-run, as expected, leverage affects returns positively confirming that higher risk of financial leverage is compensated with higher returns.
The current study is not free from limitations. The measure of geographic dispersion is constructed based on a simple count of state names of which a restaurant firm operates in. Therefore, many can find it a crude proxy to reflect geographic dispersion of restaurant firms. However, it should be noted that IPO prospectuses provide limited information regarding whole geographic operations of the IPO firms. Further studies may attempt at constructing a more fine-grained measure of geographic dispersion. A potential measure could make use of store counts in each U.S. state to construct a proxy based on Herfindahl index if this information could be obtained from either prospectuses or other sources. Another limitation of the current study is the low number of IPOs used in the study primarily due to data availability. The current study did not have access to many restaurant IPO prospectuses because they were not available in electronic format in SDC database, and hard copies were not available in reach. Further studies, especially attempts in the United States, can collect hard copies from major libraries to increase sample size.
It should be noted that the current study makes use of a certain industry mainly because the restaurant industry provides an appropriate setting for the research question of this study. Therefore, the results should be interpreted with caution. Although using a single industry confines the findings to the particular industry, they may still be applicable to other industries with similar characteristics.