
Abstract
Several sustainable development strategies in rural areas have relied on tourism as a tool for economic growth and job creation. The alternating peak and valley periods that seasonality entails—and their corresponding negative economic, environmental, or social impacts—may somewhat condition the success of these policies. The aim of this article is to analyze whether rural destinations suffer from higher levels of seasonality as compared with those of beach and urban tourism. The analysis is applied to Andalusia, a region in southern Spain, one of the major tourist destinations in Europe and a provider of diverse tourist products. The methodological innovation and contribution of this study is to measure seasonality intensity by means of a DP2 synthetic indicator that gathers information derived from various facets of seasonality, ultimately allowing us to overcome the disadvantages of single-variable assessment. We conclude that seasonality in rural tourism should not be evaluated generally, since each destination has specific conditions that determine stability or seasonality in the area. We obtain evidence that some rural areas show a lower level of seasonality than cultural-urban destinations (the most stable in terms of annual activity). Thus, rural destinations will not suffer from the problems associated with high seasonality. Due to the great differences among rural destinations, this methodology should be applied to regions with different characteristics to complement the conclusions drawn from this study and determine which destinations call for public policies and specific strategies to reduce seasonality.
Introduction
Tourism seasonality implies unequal distribution of the tourist activity at a certain destination and generates alternation of overcrowded periods with others during which resources are underutilized. Seasonality of demand is generally considered one of the major challenges in the tourism business. Seasonality may jeopardize sustainable development of tourism due to its impact on the economy, environment, society, and the labour market. This impact endangers economic development, conditioning citizens’ attitude toward tourism (Koenig-Lewis & Bischoff, 2005; Martín, 2018). As Martín, Salinas, Rodríguez, and Jiménez (2017, p. 1693) argue “a low degree of seasonality is a necessary or desirable condition, at least, since a steady flow of annual income, activity and employment is needed to position tourism as a real development alternative.” “Many economic activities are highly dependent on tourism and are at risk because the high seasonality of the tourist destination does not allow continuity in commercial and economic operations during the whole year” (Brida, Osti, & Faccioli, 2011, p. 365). This is particularly true for tourist destinations whose characteristics make them more vulnerable to systematic fluctuations of demand, for instance, destinations located in poorly developed areas or areas with a weak business network or high unemployment rate (Kastenholz & Lopes de Almeida, 2008). Managers of tourist enterprises and policy makers may consider seasonality as a “disgrace,” especially when they have to address its consequences for unemployment, migration, less income, disinvestment, and so on (Candela & Castellani, 2009).
In the literature on this issue, few analyses of seasonality examine rural tourism or regions far from the great tourist spots (Goulding, 2006), even though these less-visited destinations constitute a very important line of research due to the recent expansion of rural tourism. Many authors note the lack of studies on specific aspects of seasonality and the need to increase understanding of this phenomenon. Higham and Hinch (2002, p. 176) argue that “seasonality is one of the most prominent features of tourism, yet, paradoxically, it is also one of the least understood.” Koenig-Lewis and Bischoff (2005, p. 201) indicate that “considerable gaps still exist in published research in this area and it argues that the field lacks a sound theoretical framework. It also suggests that adopting a more exacting quantitative perspective might facilitate and accelerate progress.” Our study’s contribution responds directly to these issues.
We can define tourism seasonality from the point of view of either supply or demand. This twofold approach affects the measurement of seasonality. As Martín, Jiménez, and Molina (2014) argue, the variable used to measure intensity of seasonality will determine the ranking of regions or destinations analyzed. Most studies of tourism seasonality consider only one variable when performing the analysis, for instance, the monthly number of tourist arrivals, the monthly number of overnight stays or the average length of stay for each month—all of which condition the conclusions in different ways. We therefore need a measurement that can consider the information provided by each expression of seasonality jointly. Such expressions of seasonality may include fluctuations in number of tourist arrivals, variation in number of overnight stays, changes in average length of stay, variation in number of staff employed, and so on.
This study analyses seasonality intensity in a group of rural destinations while comparing it with urban and coastal destinations located in the same region. Its goal is to determine whether tourism seasonality in rural destinations is higher compared with other types of destination. Such a situation has negative impacts on the region and reduces the profitability of businesses linked to tourism, as stated above. The second goal of this article is to propose a methodology to measure seasonality intensity to provide more accurate assessment than methods that consider only one variable. This methodology can be replicated in areas with different characteristics from those involved in this study, complementing the conclusions to be reached here and enabling comparison with conclusions about those areas. These analyses are useful when determining which type of rural destination suffers from the highest level of seasonality. Furthermore, such analysis enables definition of public policies and business strategies to alleviate the problem. Such strategies are also necessary to enable monitoring of the evolution of seasonality levels and to assess how successful newly-implemented policies are.
The methodology used to achieve our goal is based on a synthetic indicator that starts from a group of variables or partial indicators to evaluate different expressions of this phenomenon and combine them in a single piece of information. The proposed index establishes a classification using Pena’s Distance Method (DP2; Pena, 1977), which permits measurement of disparities between different areas (Somarriba & Pena, 2008; Zarzosa, 1996). We propose a synthetic indicator that combines the variables of supply and demand. This approach makes a methodological contribution to the literature because it allows for analysis of seasonality intensity using multiple variables at the same time. Choosing DP2 has a series of advantages that will be explained below.
Our comparative analysis includes different forms of tourism and is applied to the region of Andalusia, in southern Spain. We chose this region as the case study for this article for several reasons. First, it is one of the most important tourist destinations in Europe, hosting 28.2 million tourists annually, a third of whom are foreign (Empresa Pública para la Gestión del Turismo y del Deporte de Andalucía, 2016). Second, and most important, Andalusia’s tourist destinations all have very different characteristics (sun and sand, urban/cultural, rural). Such heterogeneity is necessary to this study. Moreover, all of these types of destinations host a large number of visitors. The region is also an excellent area to study due to the importance of tourist activity to its economy. Although not the main mode of tourist activity in the region, rural tourism is expanding greatly. The number of visitors lodged in rural establishments has grown 60.68% in the past 10 years, as compared with 14.93% growth in beach tourism and 37.21% in the main urban destinations (Instituto Nacional de Estadística, 2017). Rural tourism has developed more slowly in Spain than in the rest of Europe. The recent development of this idea is grounded in a view of rural tourism as a diversification strategy and an alternative to types of tourism that are less respectful toward the environment based on mass tourism (Canoves, Villarino, Priestley, & Blanco, 2004).
Andalusia’s statistical public services also offer detailed monthly data for every type of destination and every variable used by the researchers in this study. Although it is important to determine how intense seasonality is at each type of destination with a certain level of consolidation, this study also pursues a second goal—to provide a methodology that can be replicated in any region, making it possible to gather evidence from destinations with different characteristics. Such a methodology is useful and necessary to complement and compare the conclusions obtained from this study.
This study analyses data provided by the National Institute of Statistics of Spain, considering monthly data for each destination analyzed: eight urban destinations, five coastal destinations, and nine rural destinations. Because each of these destinations hosts the largest volume of visitors of its respective type of destination in the entire region, we can obtain monthly data, since the National Institute of Statistics provides data on only the most significant destinations in terms of number of visitors. Availability of data thus determined the number of destinations to which we can apply the study. Since it is possible to retrieve data relative to each partial indicator for the corresponding year, the data analyzed correspond to 2016. The monthly data with which we worked vary on representative indicators of the tourist activity: monthly data on visits by national visitors, visits by international visitors, number of overnight stays associated with national visitors, number of overnight stays associated with foreign visitors, staff employed in tourist activities, beds available in tourist accommodations, average stay, degree of occupancy of beds available, and degree of occupancy on weekends. The main limitation concerning data derives from the few available monthly indicators that provide enough details on each tourist destination.
In sum, this study does not aim to analyze the effects of tourism seasonality on rural development or its causes. Instead, it focuses on determining degree of seasonality developed at rural destinations as compared with other modes of tourism in a region, since it is understood that modes of tourism with greater annual stability make a greater contribution to development than do modes that lack annual stability. The study’s second contribution addresses the need for a methodology that enables objective comparative analysis of the intensity of seasonality among destinations. To achieve this goal, we propose an indicator that combines information from different expressions of the phenomenon of seasonality to provide a summary value. This indicator does not describe the causes of seasonality, but instead analyses the ways in which seasonality is expressed. The study begins with a review of the literature on the causes and effects of seasonality within the tourism sector, the analysis of tourism seasonality, role of tourism in rural development and effect of seasonality on these development processes. It then explains the methodology chosen to achieve the main goal and finally presents the results and conclusions.
Rural Tourism, Development, and Seasonality
Tourism Seasonality
Generically, seasonality can be defined as the seasonal variations in business enterprises that characterize these as recurring movements in a time series during a particular time of the year (Moore, 1989). Hylleberg (1992, p. 4) gives a more complete definition: Seasonality is the systematic, although not necessarily regular, intra-year movement caused by changes in the weather, the calendar, and timing of decisions, directly or indirectly through the production and consumption decisions made by the agents of the economy. These decisions are influenced by the endowments, the expectations and the preferences of the agents, and the production techniques available in the economy.
Seasonality is a common characteristic of many economic activities, such as agriculture and some industries, and could be said to affect tourism to a greater extent than it affects many sectors (Cisneros-Martínez & Fernández-Morales, 2015). In focusing on the tourism sector, we define seasonality as proposed by Butler (1994, p. 332): “a temporal imbalance in the phenomenon of tourism, [which] may be expressed in terms of dimensions of such elements as numbers of visitors, expenditure of visitors, traffic on highways and other forms of transportation, employment, and admissions to attractions.” This definition uses tourist demand as a reference, although seasonality can also be defined from the point of view of supply. Taking supply into consideration, tourist seasonality is described as the temporary imbalance that takes place in tourism when the marketing of products for tourists is concentrated in one or several periods (López & López, 2006), connecting the meaning of marketing to the use of facilities, number of beds available, development of promotional activities, and so on.
Causes and Consequences of Tourism Seasonality
To understand the phenomenon of the tourism seasonality in rural areas correctly, we must understand its causes. Tourist seasonality can be explained by attending to general and particular causes at the destination. Hylleberg (1992) defines three groups of factors: meteorological conditioners, factors related to festivals and religious events, and factors related to time planning, such as school and work vacation, fiscal and accounting periods, and so on. Butler (1994) complements the factors described by adding inertia in decision making and social pressure. Higham and Hinch (2002) relate the main causes of tourist seasonality to the constraints of the tourist activity itself. In addition to global causes, specific causes of seasonality are determining factors. These are factors believed to be factors conditioning each destination. The destination’s resources—both natural and artificial—and climate conditions define how the destination is exploited. As Martín et al. (2014) argue, destinations with a diversified product and less dependency on climate enjoy greater annual stability. To complement the foregoing we include diversification of segments and issuing markets, a factor that can generate annual complementarity, reducing seasonality (Fernández-Morales, 2003).
The negative consequences of seasonality are related to effects during both peak periods and periods where attendance is minimal, implying the coexistence of periods of great activity with periods of underutilization. These imbalances can affect economic growth of the regions that opt for tourism as a means of development. According to the literature on this topic, the effects of tourist seasonality can be classified into the following categories: economic effects, effects on the labor market, sociocultural effects, and ecological effects. As to economic effects, instability in annual activity leads to potential loss of profits (Cuccia & Rizzo, 2011) and inefficient use of infrastructure (Georgantzas, 2003; Getz & Nilsson, 2004; Rosselló, Riera, & Sansó, 2004). From a business point of view, service quality may be affected in periods of maximum concentration (Koc & Altinay, 2007), while many firms may close in the off season, generating a negative image of the destination (Flognfeldt, 2001). The local community will also suffer as a result of instability, as families must compensate for reduced income by saving during periods of greater activity (Murphy, 1985). Distortions in the labor market are also clear. Tourist companies may find it difficult to hire qualified staff (Murphy, 1985) without loss of service quality (Baum, 1999). Seasonal activities are usually supported by staff with lower qualifications (Mill & Morrison, 1998), who often do not receive properly structured training plans due to instability. However, such jobs tend to represent an opportunity for those who need temporary work, such as students or employees in other sectors like agriculture (Flognfeldt, 2001). These economic and labor effects condition the effect of tourism as an element of development, since destinations with less variation in annual activity will have more stable benefits for the labor market and economies and will thus be able to achieve greater consolidation of development. Ecological effects refer fundamentally to the impacts derived from concentration of tourists at specific times of year—increase in waste production and noise, and interference in local ecosystems, among others. Assuming the negative effect of periods with a high concentration of visitors, some authors argue that the off season provides an opportunity for environmental recovery (Ioannides & Petersen, 2003; Lusseau & Higham, 2004). Finally, sociocultural effects include impact on both local communities and tourists who visit, including increase in the price of goods and services, lines for access to tourist resources, insufficient parking, congestion on roads, and general interference in residents’ lifestyle (Kuvan & Akan, 2005; Waitt, 2003). An additional type of interference derives from the need to hire extra staff during high season to provide public services. Paying for extra staff may involve raising taxes, with the attendant repercussions for residents (Murphy, 1985).
Measurement and Analysis of Tourism Seasonality
As Koenig-Lewis and Bischoff (2005) explain, we lack statistical procedures capable of describing some aspects of the phenomenon of seasonality, including comparison among regions. According to these authors, although different measures of seasonality have been proposed, none has been accepted as authoritative. The empirical studies that have analyzed how to compare and quantify seasonal patterns are relatively few (Koenig-Lewis & Bischoff, 2005). Many studies focused on the analysis of the seasonality of tourism are based on work with data series. These studies focus on improving forecasts of seasonality, analyzing its temporary behavior and determining which factors condition its cycle. Many studies use this approach, including those that measure seasonality at a specific destination (e.g., Cuccia & Rizzo, 2011; Nieto & Amate, 2000; Pegg, Patterson, & Vila, 2012), studies from the perspective of demand (e.g., Boffa & Succurro, 2012; Coenders, Espinet, & Saez, 2003; Espinet, Fluvia, Rigall-I-Torrent, & Salo, 2012; Koenig-Lewis & Bischoff, 2004), and studies that compare measures of seasonality and present their strengths and weaknesses (e.g., De Cantis, Ferrante, & Vaccina, 2011; Koenig-Lewis & Bischoff, 2003, 2005; Kulendran & Wong, 2005; Lundtorp, 2001; Wanhill, 1980). Stochastic and deterministic procedures have been used to detect seasonal behavior (e.g., Alleyne, 2006; Chang & Liao, 2010; Koc & Altinay, 2007; Kulendran & Wong, 2005; Lim & McAleer, 2001, 2002; S. Shen, Li, & Song, 2009). Spectral analysis has also been proposed (Chan & Lim, 2011), as well as fractionally integrated time series models and seasonal long memory models (Gil-Alana, 2010). Both the former and the latter attempt to expand knowledge of how activity cycles behave in tourism. Predictions are an important element of analysis of seasonality and can be developed as a deterministic or stochastic component in a series of analyses (Song & Li, 2008). Since panel data are suitable to measure the effects of variables with small changes within countries and greater variability across countries (Turrión-Prats & Duro, 2018), it is possible to determine the impact that certain variables have on seasonality intensity and its characteristics.
One of the most extended lines of analysis focuses on estimation of concentration indexes, which are used to quantify a destination’s degree of seasonality intensity. Concentration index values provide a measurement of the degree of concentration of tourist activity throughout the year (Fernández-Morales, 2003; Lundtorp, 2001; Rosselló et al., 2004; Wanhill, 1980). The most common such procedures are the Gini Index (GI), Coefficient of Variation (CV) and Theil Index (TI). Taking the literature on tourism seasonality as a reference, we confirm that the GI is the procedure most widely used to measure seasonality intensity (e.g., Baum & Lundtorp, 2001; Fernández-Morales, Cisneros-Martínez, & McCabe, 2016; Koenig-Lewis & Bischoff, 2003; Martín, Salinas, & Rodríguez, 2019; Nastassios & Sitouras, 2004; Wanhill, 1980), in other words, the concentration or equal distribution of tourist activity during each month. Traditionally, the GI has been used to measure disparities in income levels, but this methodology is widely accepted in the literature on tourism when measuring inequalities in the annual distribution of the activity. The GI provides a measure of the intensity of seasonality in tourism for each year analyzed, since it analyses imbalances in the monthly distribution of a variable tied to tourist activity, such as number of visits or overnight stays (Grainger & Judge, 1996). Various arguments favor this system. Fernández-Morales (2003) indicates that it is the most frequently used measurement system, although many others have been proposed. Lundtorp (2001) views it as the most stable indicator of seasonality. For Aguiló and Sastre (1984), the GI fulfils the Pigon–Dalton principle. Other measures of concentration proposed as alternatives to the GI are the TI and the CV (Fernández-Morales, 2003; Lundtorp, 2001; Rosselló et al., 2004; Wanhill, 1980).
The GI shows the range of cumulative frequency of the observations, beginning with the lowest value (Lundtorp, 2001). The Gini coefficient, equal to the area between the Lorenz curve and the line at 45 degrees that divides the area under that line, can be expressed as follows:

where n corresponds to number of observations (e.g., 12 months per year), ‵x represents the average value of the observations, and x1, x2, x3, . . . xn individual observations in descending order of magnitude (Weaver & Oppermann, 2000). The results of the index must be between 0 and 1, 0 indicating equidistribution within each month and 1 a maximum concentration in a single month. In reality, the measure of a single GI based on a specific variable shows only part of the phenomenon.
The Role of Tourism in Rural Development
In recent decades, rural tourism has grown in numerous countries from being a secondary commercial activity to establish itself as an independent sector (Busby & Rendle, 2000). It is a growing activity, particularly in areas where agriculture is not especially competitive in economic terms (Canoves et al., 2004). Rural tourism is largely a domestic phenomenon that is disparate in nature across countries and continents (Gartner, 2004; Sharpley & Roberts, 2004). This diversity explains why the current literature on rural tourism includes a significant number of case studies on countries and rural tourism attractions in different countries (Gao, Huang, & Huang, 2009). Sharpley and Roberts (2004) identify two main lines of research in rural tourism: analysis of rural tourism as sustainable economic activity and its potential as a tool of development. Among the benefits of tourism, one can stress its ability to be more respectful of the rural environment than alternative forms of development (Ceballos-Lascurain, 1996; Master, 1998), as well as its commitment to some degree of conservationism as a goal (Doswell, 1997). Other benefits may be underscored, namely, diversification of the local economy, creation of new companies, up-keep of local services, external contact with isolated communities or repopulation (Canoves et al., 2004; Paniagua, 2002; Roberts & Hall, 2001). If we consider the previous statement, it is true that potentially negative impacts exist that must be identified and countered to the extent possible, such as impacts on the natural and social environments (Puczkó & Rátz, 2000). The magnitude of these impacts will depend on factors such as volume of tourists, activities tourists perform, fragility of the natural environment, and robustness of the local culture (Roberts & Hall, 2001). Rural tourism should respect and preserve the environment in which it is developed, while also supporting economic diversification in a viable way in the long term (Lane, 1994; Puczkó & Rátz, 2000).
Along these lines, our study contributes by evaluating the capability of rural tourism to act as a tool of sustainable development, specifically by giving proof of its annual stability relative to other modes of tourism. According to the studies on tourism seasonality presented next, instability in volume of tourist arrivals generates a series of negative effects in the destinations that can reduce the positive effects of tourist activity on rural development.
Consequences of Seasonality for Rural Tourism
Tourism seasonality has been poorly analyzed in rural contexts (Guaita, Martín, Salinas, & Mogorrón-Guerrero, 2019). Some studies analyze tourism seasonality in certain types of destinations, however. These studies are useful for comparing the conclusions drawn from this article. In a longitudinal study performed in Andalusia, Fernández-Morales (2003) notes growth in the intensity of seasonality at coastal destinations as compared with other modes of tourism. In Andalusia, Martín et al. (2014) use aggregate data to indicate that coastal tourism is the most seasonal (in contrast to urban) but do not provide conclusive data on rural tourism. They indicate the limitations of their investigation, which was developed with only a single variable to express seasonality and did not even take individual data from each destination. Duro (2016) speaks of lower levels of seasonality in Spanish enclaves with a high cultural component, such as Seville, Granada and Cordoba, cities that compose one of the control groups this study uses as a reference for low seasonality. This author argues the influence of international visitors on intensity of seasonality at Spanish destinations, since these international flows complement national ones temporarily, thus reducing seasonality. Rural tourists’ lengths of stay are usually shorter, preventing such complementarity. For Hernández, Suárea-Vega, and Santana-Jiménez (2016), communication infrastructures are a decisive factor in the form of rural tourism, which is based on shorter trips dispersed throughout the year, potentially conditioning the tourism’s seasonality. Shorter trips aside, F. Martínez and Rodríguez (2006) indicate that the determining factors of demand for rural tourism are not extremely different from those of other modes of tourism, such as coastal. The rural tourist destination conditions some characteristics of the travel itself, such as length of stay. Length of stay can also be conditioned by poor accessibility of rural destinations (Correia, Silva, & Moço, 2008; Nicolau, Zach, & Tussyadiah, 2016). Previous studies note that the destination’s financial income depends on number of tourists and length of stay (Alegre & Pou, 2006; Barros, Butler, & Correia, 2010; Barros & Machado, 2010; Nicolau et al., 2016). Kastenholz and Lopes de Almeida (2008) argues that a number of strategies should be developed to improve annual stability of the tourist activity and thus achieve an income level that compensates for the low profitability of valley seasons.
The literature review of rural tourism shows that approximating the causes of seasonality at rural destinations and the possible solutions for it are complex issues. As Molera and Albaradejo (2007) indicate, rural tourism should not be treated as a homogeneous classification, since it is developed by individuals with different characteristics, needs, and desires. To this complexity, we must add the different characteristics of rural destinations, which generate very diverse conditions that affect seasonality. According to Cánoves et al. (2004), however, landscape and natural environment are the main reasons tourists choose rural destinations, a motivation that could generate stable conditions throughout the year. Fuentes (1995) defines the average profile of the Spanish rural tourist and his or her motivations, although the study conclusions do not provide evidence of seasonality. Specific motivations for rural tourism may also condition seasonality level. Some studies highlight, for instance, relaxed or exciting situations or activities that bring the family closer together (Duk-Byeong & Yoo-Shik, 2009; Kim, 2005; Song, 2005). Yagüe (2002) argues that sex, age, and interest in natural resources are the only variables that differentiate between rural tourism and other traditional categories.
The World Tourism Organization (2004) includes tourism seasonality as one of the seven subdimensions of economic sustainability: tourism seasonality, leakages, employment, tourism as a contributor to nature conservation, community and destination economic benefits, tourism and poverty alleviation, and competitiveness of tourism businesses (Qiu, Fan, Lyu, Lin, & Jenkins, 2018). Seasonal operations of tourism—which have brought about decreased occupancy rates, transportation difficulties, and increased prices—were considered as a chief factor in the sustainability of tourism corporations (Altinay, 2000; H. Shen, Luo, & Zhao, 2017). Qiu et al. (2018) believes that one of the factors that can condition tourism sustainability is reaching the maximum level of activity and surpassing the destination’s carrying capacity, which is aggravated during peak seasonal periods. It is thus not only important to consider the low levels of activity during valley seasons but also during activity peaks. Ribeiro and Marques (2002) notes that rural tourism faces challenges such as lack of professionalization, problems in finding adequate professionals, and low wages, all of which can be related to seasonality.
Research Aims
The literature review on seasonality and rural tourism shows some gaps, both methodological and theoretical, on which this study focuses. First, while comparing rural tourism with other types of tourism, this article aims to provide new empirical evidence on the intensity of seasonality in rural tourism. This goal complements those of studies on the capacity of tourism to contribute to rural development. While it has been argued that seasonality causes negative effects from the economic, environmental, labor-related and social points of view, a stable activity can help reduce unwanted effects, improving the contribution tourism makes to development. Few studies analyze seasonality in rural tourism, and even fewer make comparisons with other destinations. None has included a set of variables as complete as the set we propose here. It is fair to recognize that the conclusions of this study may not fit completely in different rural destinations, whose particular characteristics generate a different balance of annual stability. We thus propose a methodology replicable in other areas to help complement empirical evidence on the seasonality of rural environments and improve conclusions across the board. This study thus also makes a methodological contribution to measuring seasonality, whose explanation and justification can be found in the following section.
Policy makers and managers of companies in the tourism sector need analytical tools with which to diagnose the specific state of the destinations. Such diagnosis proves to be of help when assessing their potential, the possibility of reaching viable and sustainable development and the most adequate strategies to consolidate the destination (Blancas, Caballero, González, Lozano-Oyola, & Pérez, 2010; Blancas, Lozano-Oyola, González, Guerrero, & Caballero, 2011; Landford, 2009; Yunis, 2004). To cover all of these needs, we propose an indicator of seasonality that will help measure this phenomenon’s intensity and control its evolution and the success of the policies applied to counteract it. Diverse proposals of systems of indicators have been developed internationally, many of which focus on theoretical definitions instead of quantifying the phenomena studied (Bell & Morse, 2001; Bosh, 2002; Dhakal & Imura, 2003; Farsari & Prastacos, 2002; Gudmundsson, 2003; Hezri, 2004; Innes & Booher, 2000). As explained above, the literature on seasonality has not improved in quantification and analysis methodologies. Moreover, the spatial studies comparing destinations or regions are scarce, and the effect of the remote location of some destinations on seasonal concentration has yet to be studied (Cannas, 2012; Goulding, 2006). Our analysis does not focus on the importance of location as a factor conditioning seasonality, but it provides evidence of the degree of seasonality found in rural destinations. Some studies analyze the intensity of the use of tourist resources available at rural environments and the pressure put on them, but these studies do not analyze whether this pressure is consistent every month of the year (Blancas et al., 2011).
Having recognized the problem of the partial view obtained when working with a single indicator of seasonality (Martín et al., 2014) and the critical role of choice of indicators in the study of seasonality (Ahas, Aasa, Silm, & Roosaare, 2005), we propose a synthetic indicator that integrates the partial indicators described. This indicator has various advantages over alternatives, since it improves the process of aggregating variables with different units, proposes a nonarbitrary criterion for distributing the weights of the variables and solves the problems both of duplicate information provided by the variables (Murias, Martínez, & Miguel, 2006; Ravallion, 2010; Somarriba & Pena, 2009; Somarriba, Zarzosa, & Pena, 2015; Zarzosa & Somarriba, 2013) and of nonredundant information provided by each variable (Rodríguez, Holgado, & Salinas, 2015). The literature shows different alternatives for construction of synthetic indicators using nonlinear techniques (Nardo & Saisana, 2008). Our study proposes a synthetic indicator based on the DP2 developed by Pena (1977), which has recently been applied with new interest in various areas of social science (Canaviri, 2016; Holgado, Salinas, & Rodríguez, 2015; O. Martínez, Lombe, Vazquez, & Coronado, 2016; Ray, 2014; Rodríguez, Jiménez, Salinas, & Martín, 2015; Sánchez & Prada, 2015; Somarriba et al., 2015; Somarriba & Zarzosa, 2016). This indicator enables us to compare more precisely the different levels of seasonality intensity among destinations. Not much evidence can be found in the scientific literature on seasonality level in rural tourism, although this type of tourism model is conditioned by patterns different from those of mass tourist destinations. For instance, the growth of rural destinations is attributed to changes in leisure patterns and segmented holidays, which occur mostly as long weekends (Canoves et al., 2004), possibly conditioning seasonality levels. Nicolau et al. (2016) notes the importance of performing comparative studies between rural, urban, and coastal destinations, assuming their different characteristics. The use of synthetic indicators built specifically to analyze a complex phenomenon is starting to spread in the field of tourism, for example, in analyses of the sustainability to reduce subjectivity when aggregating variables (Blancas et al., 2010; Blancas et al., 2011).
Methodology
From the methodological point of view, this study proposes a system to measure tourism seasonality that enables comparison of the different levels of intensity in each type of destination. After analyzing the possible measurement systems and their limitations, we propose a system that overcomes these limitations. This proposal must consider information derived from different facets of tourism seasonality expressed by partial indicators aggregated by means of an objective procedure that removes redundant information.
To overcome the limitations of applying the GI to a single variable as an instrument of average seasonal magnitude at a destination, we propose construction of a synthetic indicator based on aggregation of information that provides partial GIs calculated over different dimensions/variables capable of measuring the seasonality intensity of a destination as a whole, providing a measurement that combines the effects on both supply and demand. The partial indicators used in this study have been chosen from the literature on seasonality. The indicators—representations of different facets of seasonality—have been drawn from other papers, but in this case they will be analyzed jointly.
This study proposes calculating partial indicators (GIs) that reflect various expressions of tourist seasonality. Choice of the GI is justified by the wide acceptance this indicator enjoys as a methodology to measure intensity of seasonality. Furthermore, this methodology is supported by many prestigious researchers, as noted above. The indicators are calculated through monthly data on visits by national visitors, visits by international visitors, number of overnight stays associated with national visitors, number of overnight stays associated with foreign visitors, staff employed in tourist activities, and beds available in tourist accommodations. Since the GI must be constructed using cumulative data, we propose calculating other partial indicators complementary to these using the CV, another indicator recommended in numerous studies as a tool to measure degree of seasonality. We thus add the following indicators: average stay, degree of occupancy of beds available, and specific degree of occupancy on weekends. The CV measures dispersion of a data series around an average, as a percentage of that average. In the formula, S expresses the standard deviation and

This study works with secondary data provided by Spain’s National Institute of Statistics, an organization that collects monthly tourism data at country, region, and destination level (in the case of the main Spanish destinations). We work with monthly data relative to each type of destination analyzed here, of which eight are urban destinations, five are coastal destinations, and nine are rural destinations, which we take as a reference to compare level of seasonality among them. All destinations are located in the region of Andalusia, in southern Spain. This region is one of the most important tourist spots in Europe and offers a great variety of tourist products, a characteristic essential to performing this comparison. The data are from 2016, since that year provides data for each partial indicator selected.
The synthetic indicator proposed verifies properties that ensure that the weight granted to the partial indicators is assigned in a nonarbitrary way (Canaviri, 2016). In addition to fulfilling the conditions of distance in a metric space (triangular inequality, nonnegativity, competitiveness), the DP2 indicator fulfils the set of properties required of a good indicator (Pena, 1977; Somarriba & Pena, 2008; Zarzosa, 2005), specified as follows: monotony, invariance in comparison with the base reference, existence and determination, neutrality, uniqueness, conformity, quantification, additivity, invariance, exhaustiveness, transitivity, and homogeneity of degree one (Escobar, 2006; Rodríguez, Holgado, & Salinas, 2012; Zarzosa, 1996).
Data envelopment analysis (DEA) could be used to compose a synthetic indicator like the one proposed here (Carrillo & Jorge, 2016; Murias et al., 2006; Y. Shen, Hermans, Brijs, & Wets, 2013), but DEA has some limitations relative to our method, such as arbitrariness in choice of variables (Zarzosa & Somarriba, 2013). Furthermore, this system does not fulfil the properties of singularity and monotony necessary to preserve variation in changes of origin and/or scale of units of measure or to guarantee interdependence of the indicators (Pena, 2009). Furthermore, DEA does not permit discrimination power in classification of the areas analyzed (Cuenca & Rodríguez, 2010). The DP2 provides a series of advantages over DEA (Mishra, 2007; Montero, Chasco, & Larraz, 2010; Ram, 1982). Furthermore, as Zarzosa and Somarriba (2013) and Somarriba et al. (2015) indicate, this method fulfils the mathematical property of homogeneity of degree one necessary to reflect cardinality.
The DP2 indicator proposed as a measure of seasonality provides a cardinal measure useful for comparing regions (Montero et al., 2010; Somarriba & Pena, 2008). This indicator solves the problem of heterogeneity of measurement units by dividing the indicator by the standard deviation so that the partial indicators are expressed in abstract units (Ray, 2014). The properties that this indicator fulfils guarantee that the weight of the partial indicators is not established arbitrarily, granting these indicators an economic interpretation (Rodríguez, 2014; Rodríguez, Holgado, et al., 2015; Rodríguez & Salinas, 2012; Somarriba & Pena, 2009; Somarriba & Zarzosa, 2016).
The value of the DP2 calculated for tourist destination j is defined by the following expression (Pena, 1977; Zarzosa & Somarriba, 2013):

where
The coefficient of determination
The resulting value is an abstract number independent on the units in which each partial indicator is expressed (Rodríguez, Salinas, & Ubiña, 2011). The problem derived from the partial indicators being expressed in different units is solved by dividing this value by the standard deviation. In this way, the values are expressed in abstract units (Somarriba & Zarzosa, 2016). The set of properties fulfilled by this indicator makes it ideal for the measurement proposed in this study. The reader interested in learning about them in detail can consult Zarzosa and Somarriba’s (2013) work. We cannot include them here due to space limitations. To select the indicator, we considered the total number of variables proposed, so that reliability of the partial indicator’s results can be guaranteed and loss of information is minimal (Zarzosa, 1996, 2005). When we reduce the number of partial indicators, greater efficiency in computational terms is obtained, since this new situation contributes to the convergence of the mathematical algorithm. In addition, we can state that the results obtained are of higher quality, as they increase the accuracy of the estimators in econometric models. In this case, we can define two indispensable requirements that the indicators must meet; on the one hand, these indicators must be discriminating for the destinations (using dispersion measures) and, second, the indicators must provide new information, not contributed by the previous ones (statistical correlation measures are used to guarantee this; Zarzosa & Somarriba, 2013).
The relative weight assigned to each partial indicator is determined by the entry order established by an algorithm that is stabilized and reaches convergence to verify the condition of conformity with a nonrandom method that is neutral for classification of the partial indicators. One of the main advantages of the methodology on which the construction of the PD2 indicator is based is that it permits the objective allocation of the weights that are granted to each partial indicator. This allocation is conditioned by the amount of useful information that each partial indicator contributes to the construction of the synthetic indicator. The order of entry of the partial indicators in the calculation process is conditioned by the relative importance of each of them in terms of linear correlation with the final synthetic indicator (Zarzosa, 1996). In this process, the partial indicators are sorted in descending order taking their correlation with the first indicator as criterion, while irrelevant information is eliminated (Somarriba & Pena, 2008). The distance associated with the value of each partial indicator, which is established between the data of a specific tourist destination and the reference tourist destination, is weighted by the percentage of new information that the indicator provides and that has not been provided by indicators introduced in the model previously (Chasco, 2014; Somarriba & Zarzosa, 2016; Zarzosa, 2009). Before performing the calculations, the indicators must be expressed in the same direction. The order of entry is determined by the correlation criteria discussed previously. Initially, the synthetic indicator does not exist, so we assume that no variables are correlated with themselves (Pena, 1977). Starting from this situation, the value taken by the coefficient of determination R2 is equal to 0 and the correction factors have a value of 1. The result of this process is the Frechet indicator, which shows the maximum value that the indicator DP2 could take in each tourist destination.
Once this stage has been carried out, the order of entry of the indicators in the next iteration are determined again in descending order in accordance with their coefficients of correlation with the DP2, repeating the process in successive cycles. After the first iteration, the order of entry of the partial indicators is determined by referring to the coefficients of correlation. This generates new values for the indicator PD2, which continue in the following cycles until the indicator converges to a concrete value. For more information about this process, studies focusing on the methodology underlying the DP2, such as Zarzosa (1996), Pena (1977), and Somarriba (2008) are recommended.
Results
Area of Study
The region analyzed in this study, Andalusia, is located in the south of Spain. It occupies an area of 87,268 km2 and has 8.4 million inhabitants. Tourism in Andalusia is organized primarily around three major territorial areas: coastal areas, inland capitals, and inland areas (Junta de Andalucía, Consejería de Turismo, Comercio y Deporte, 2007). Spanish tourist destinations have diversified their offer because of the growing tourists’ demand for new experiences (Ruiz, Molina, & Quesada, 2018). In 2015, tourism accounted for 13% of the regional GDP and directly supported 372,100 jobs (12.9% of the total), more than any other sector of the economy (Empresa Pública para la Gestión del Turismo y del Deporte de Andalucía, 2016). In 2015, Andalusia hosted 28.2 million tourists, a third of whom were foreign (Empresa Pública para la Gestión del Turismo y del Deporte de Andalucía, 2016). By virtue of regional, state, and European Community legislation as well as international agreements and laws, the region of Andalusia is composed of a network of protected natural areas. These include National Parks (2) and Natural Parks (24), the latter enjoying a higher level of protection. According to Spain’s National Statistics Institute, rural tourist activity is located in nine of these Natural Parks. No data are available from the other areas due to the minimal development of tourist activity in them. Our study focuses on these nine Parks, all of which are located inland.
We have defined two groups for comparison. The first is composed of touristy coastal areas in this region. The coast of Andalusia is 945 km long and serves as the border of Spain. Of this coastline, 550 km are beach areas, classified as five tourist areas. Due to the volume of visitors arriving annually, over 10.3 million people were lodged in official establishments in 2016. Beach areas are the main tourist product of the region, even though its dependence on temperature and hours of sun are clear limitations. The last comparison is to urban-cultural tourism, organized around the capitals of provinces. We chose the eight capitals—Granada, Sevilla, Jaén, Huelva, Cádiz, Jaén, Málaga, and Córdoba. These cities accommodate 5.5 million visitors in official lodgings (Instituto Nacional de Estadística, 2017). Andalusia has seven recognized World Heritage sites—five cultural, one natural, and one both cultural and natural. The three main urban tourist destinations—Seville, Granada, and Cordoba—contain enclaves declared UNESCO World Heritage Sites, namely, the Alhambra, the Generalife, and the Albayzín (Granada); the Cathedral, Alcázar, and Archivo de Indias (Seville); and the Historic City Centre of Córdoba (including the Mosque). These cities provide a tourist product with greater potential for exploitation throughout the year, although high temperatures limit summer visits. Table 1 shows the areas analyzed. As 2016 was the last year with definitive data, we take 2016 as a reference.
Areas of Analysis
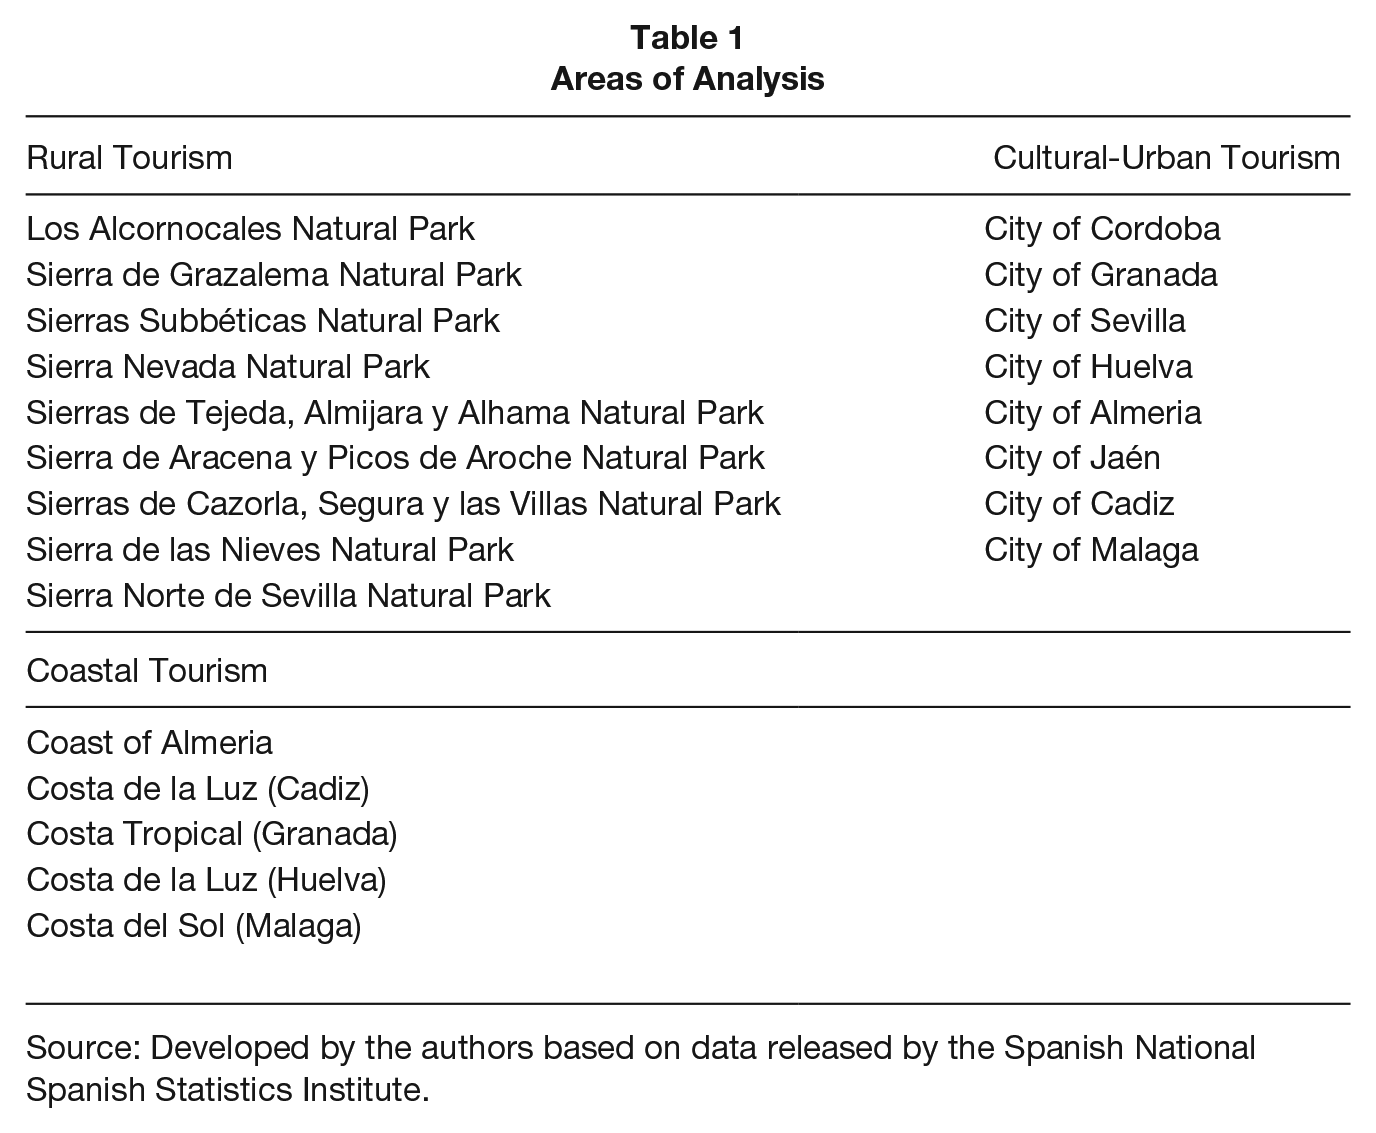
Source: Developed by the authors based on data released by the Spanish National Spanish Statistics Institute.
Main Results
The nine variables described above provide a very precise image of a destination’s seasonality, as they combine variables of supply, demand, job market, and international value of seasonality. Table 2 presents measurements of the seasonality level obtained by means of each partial indicator. Remember that these indicators measure seasonality by taking into account each of the variables affected by the unequal distribution of activity throughout the year. The table clarifies that the destinations of the region are very different among themselves in terms of tourism seasonality, since the characteristics of each destination condition the annual stability of tourism in a different way.
Partial Indicators of Tourist Seasonality by Type of Tourist Product and Geographic Area in the Region of Andalusia. Year 2016.
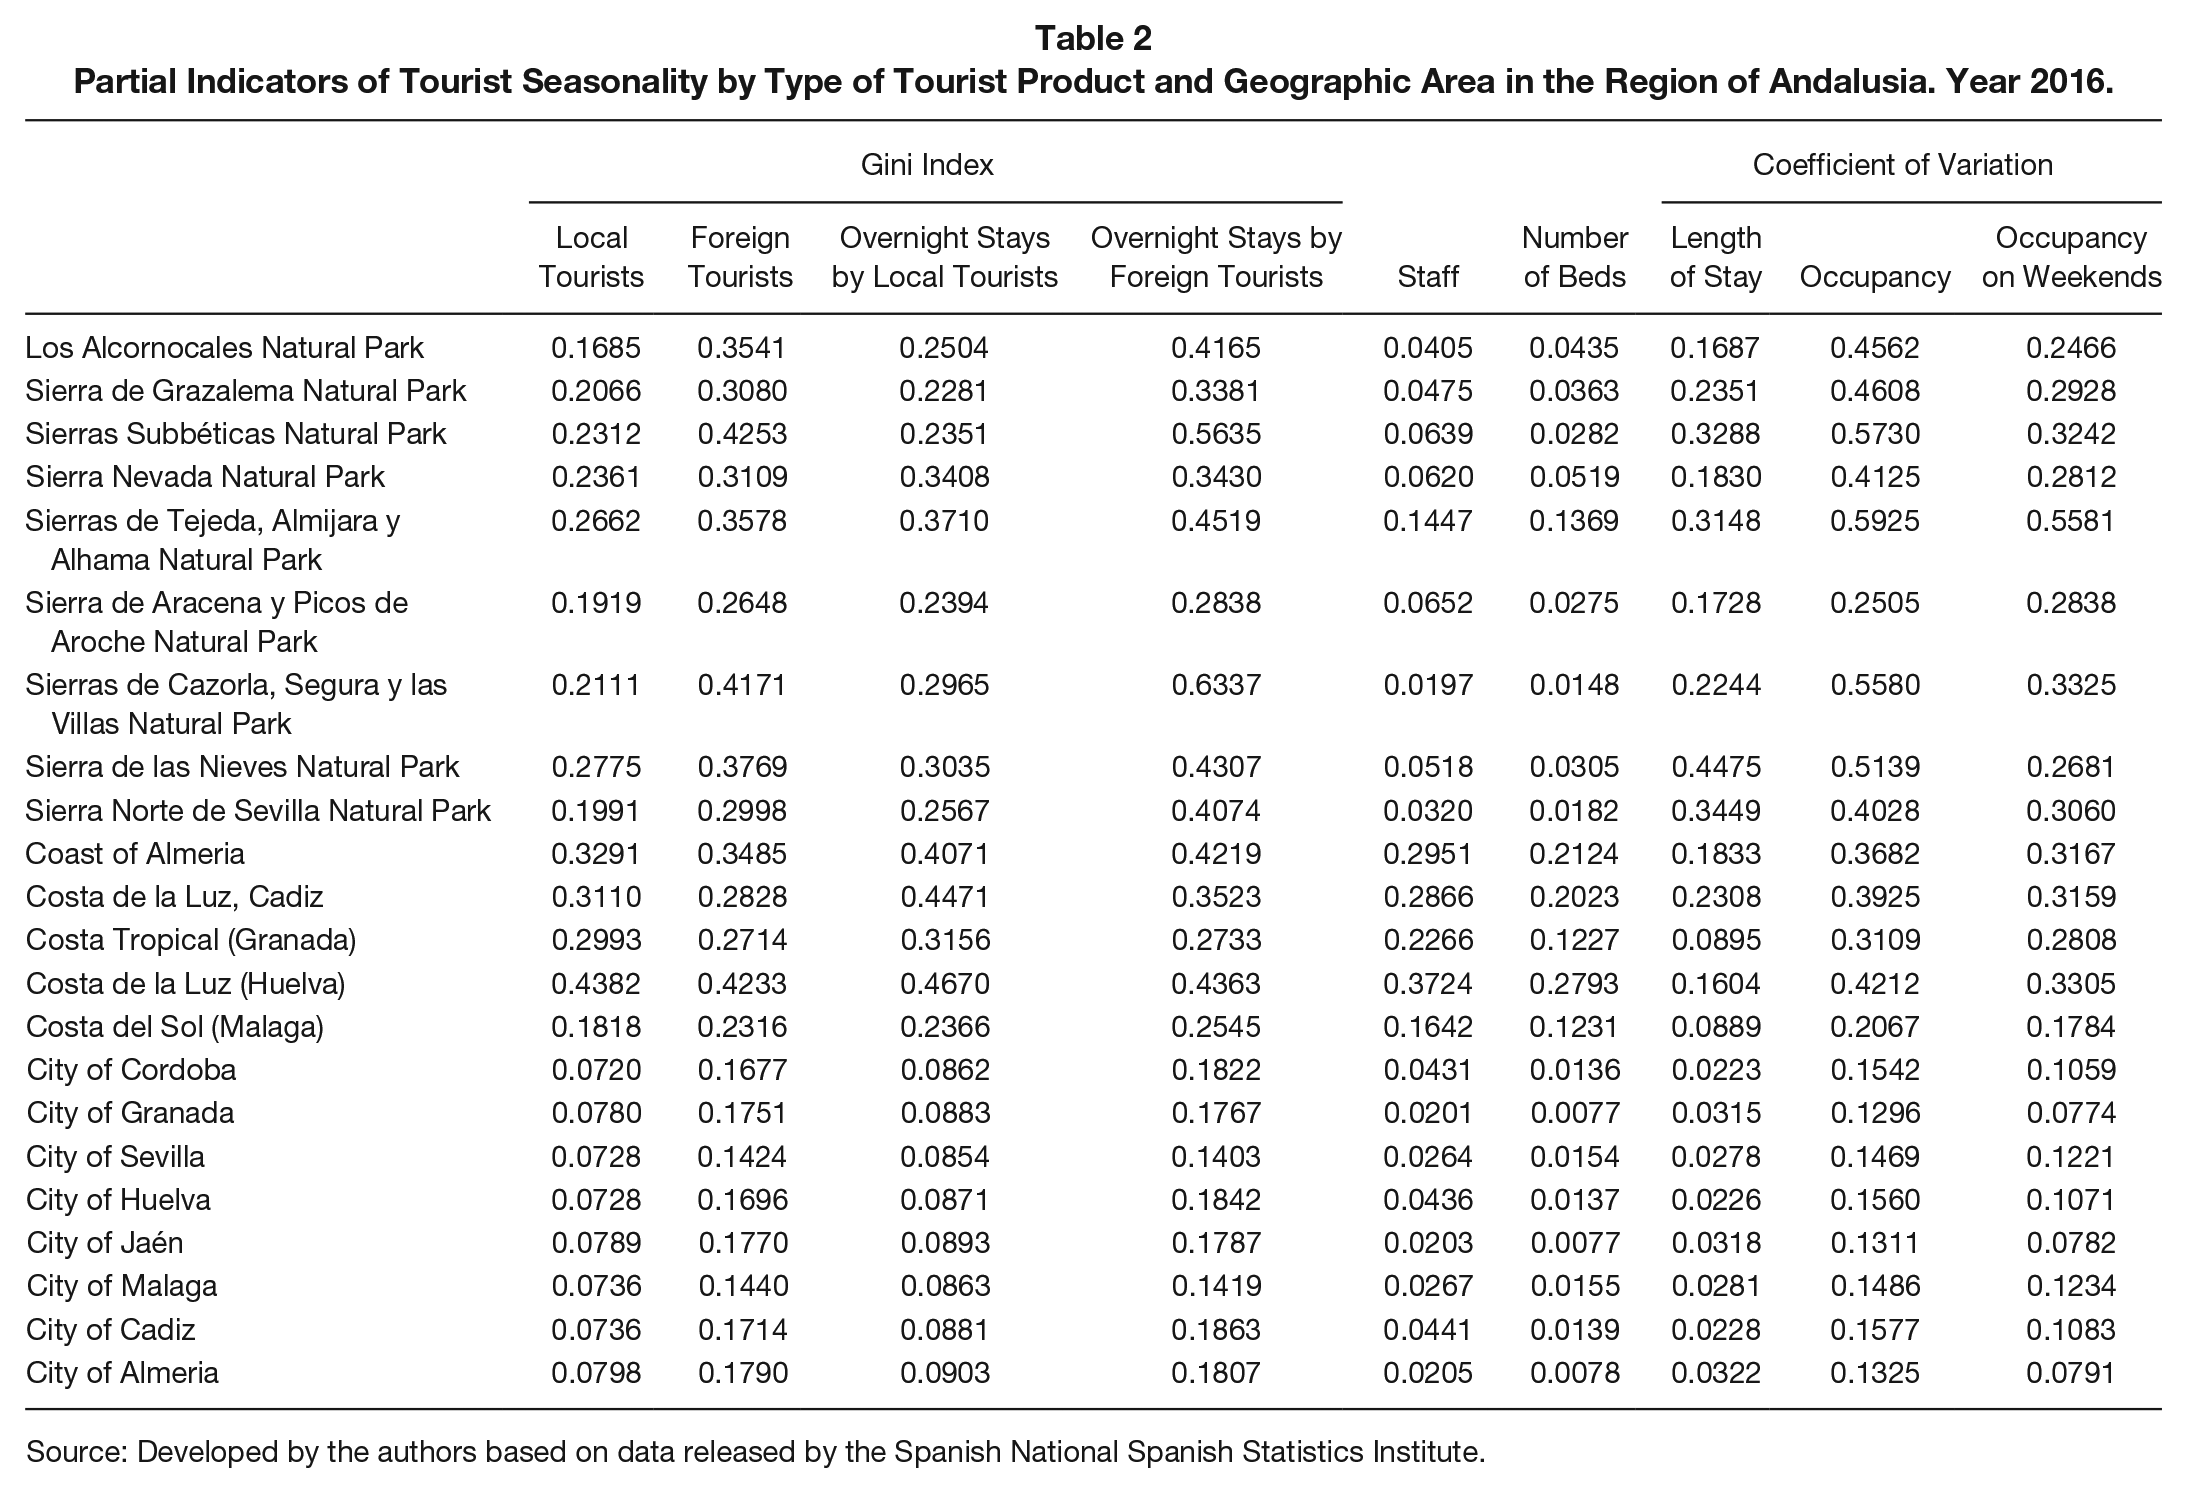
Source: Developed by the authors based on data released by the Spanish National Spanish Statistics Institute.
The values of the partial indicators were introduced in the model with a negative sign, such that a higher value of the DP2 indicator reflects a worse position in the ranking of the variables. This value expresses the distance from the “most desired” theoretical scenario (Murias et al., 2006). A value of 0 thus corresponds to the ideal scenario, the least seasonal as defined in the synthetic indicator. Destinations with a DP2 value greater than 0 are farther from the reference point. The baseline represents the results for an imaginary region with the best possible scenario for every simple indicator and would be assigned the value 0 (Zarzosa & Somarriba, 2013).
Tourism seasonality can manifest itself in diverse ways, for instance, in changes in tourist arrivals, international arrivals, average length of stay, number of people employed in the tourism sector, supply of beds, and so on. All of these manifestations are consequences of changes in activity level. Each partial indicator—whether constructed using the GI or the CV—provides information on each manifestation of seasonality for each destination. Each partial indicator stands for one measurement of the intensity of tourism seasonality associated with different variables. These variables are representative of the tourism industry and seem to be affected by the unequal distribution of activity throughout the year. The higher the value of this partial indicator, the more intense the seasonality. A large number of variables representing the different manifestation of changes in the activity levels should be taken into consideration when assessing comprehensively the changes that have taken place in activity level throughout the year.
Table 3 displays the results of DP2 indicator of tourist seasonality with large gaps between tourist zones/products. From an intuitive point of view, the indicator takes a higher value where the tourism developed at the destination has more annual seasonality, indicating greater intensity of seasonality. This ranking follows the same logic of the partial indicators, in which the highest values also refer to higher levels of seasonality, specifically for each variable. The values produced for each destination do not provide interpretable information in isolation. Their value lies in comparison within a group of destinations—in this case, 22 destinations belonging to three different modes of tourism. The higher the value of the indicator, the less homogeneous the tourist activity developed at that destination throughout the year, as a combined expression of the different partial indicators of seasonality.
Synthetic Indicator of the Tourist Seasonality for the Different Tourist Forms in Andalusia: Regions Ranked by Their DP2 Value (2016).

Note: DP2 = Pena’s Distance Method.
Source: Developed by the authors based on data released by the Spanish National Spanish Statistics Institute.
The results obtained demonstrate that the city of Seville has the best situation in terms of annual tourism stability, with a distance of 0.187 from the baseline, followed by Granada and Cordoba, with values of 0.267 and 0.296, respectively. As this ranking does not always match the classification provided by each partial indicator, it is very important to use a synthetic indicator. This result proves very consistent with the literature on tourism seasonality, as the destinations are related to the seasonal landscapes that directly and indirectly produce most of the tourist attractions (Ahas et al., 2005; Palang, Fry, Jauhiainen, Jones, & Sooväli, 2005; Silm & Ahas, 2005). Along these lines, the tourist product defined by these cities is not based on seasonality-dependent attractions but on their provision of cultural tourism, conferences, and business events.
From these data, we can identify a group of rural destinations with more annual stability than five of the eight urban destinations considered as well as more stability than all coastal destinations in this region. We thus find a group of destinations with excellent conditions of seasonality. The value of the indicator at these destinations ranges from 2.852 to 4.367. The destinations have better annual stability than those that aided tourist development of this region more intensely: the coastal destinations (Martín et al., 2014). In the coastal destinations, the indicator of seasonality takes values of 6.312 − 5.739. Seasonality thus does not limit the value of rural tourism as a tool for development, at least in certain areas. Nevertheless, a second group of rural destinations shows extreme seasonality, higher than in the coastal areas, with values of the seasonality indicator ranging from 6.331 to 7.579. This level of seasonal intensity could interfere in the role of tourism as a development tool. In the coastal destinations, the drop in activity levels is outweighed by heavy flows of visitors at other times of year, a phenomenon that does not occur at the rural destinations. The coastal destinations in this region received 9.1 million visits in 2016, and rural destinations only 150,900 visits (Instituto Nacional de Estadística, 2017), proving that seasonality can condition rural destinations to a larger extent.
We determine that evaluation of the rural tourism as a supporting tool for economic growth is complex. Instead of trying to judge annual stability of overall rural tourism definitely, each destination should be analyzed individually. Along these lines, we note rural destinations like the Natural Park Sierra de Aracena y Picos de Aroche, which contains the second largest number of local arrivals and enjoys a very controlled level of seasonality. At the other extreme, the Sierras de Tejeda, Almijara y Alhama Natural Park ranks as the first destination, with the highest number of arrivals in the region, but also shows extreme seasonality. We cannot therefore consider rural tourism as a homogeneous type of tourism. Rather, the destinations have specific characteristics that condition their potential as a tool for rural development relative to their stability. In this case, the indicator defines two different groups of destinations.
We find evidence of regions with very low seasonality levels as compared with urban-cultural destinations, in which seasonality is not a limiting factor for establishing tourism as a tool for development. The small scale of this activity measured by number of tourists, combined with low levels of seasonality, make of this type of tourism a great alternative for development. In the second group of destinations, the measurement is different, since the extreme seasonality they suffer leads to periods with lower versus higher concentration of activity, conditions that are not beneficial for the environment and the local community.
Conclusions
If tourism is considered as a tool for rural development in several regions, intraannual stability of this activity is necessary to guarantee a consistent alternative for economic growth, employment creation, and rational use of resources. Following the majority opinion of researchers in this field, the imbalances that occur throughout the year in this activity generate negative economic, work-related, social, and environmental effects. For example, the rural destinations considered in this study lose 25% of the labor force directly associated with tourism in the off season, although this figure is below 9% in the least seasonal group of destinations (Instituto Nacional de Estadística, 2017). The literature on this topic shows some positive aspects of seasonality, however.
This study intends to analyze the intensity of seasonality in rural destinations to compare it with that of coastal and urban destinations. We seek to determine whether rural tourism suffers more from this problem. The region of Andalusia, in southern Spain, has been taken as the case study. Since the variable analyzed as a reference alters the ranking of destinations according to intensity of seasonal trends, we must establish a comprehensive evaluation system that uses an ensemble of supply and demand variables as a reference to define the phenomenon as a whole. The methodology which the construction of the synthetic indicator DP2 is based on offers very good results, as it makes it possible to determine the weight of each partial indicator objectively, and this methodology avoids problems arising from work with variables expressed in different units and eliminates duplication of information. This is our article’s second contribution: defining an indicator that is both able to measure tourism seasonality by taking into consideration its different manifestations and replicable in any geographical destination.
The results obtained using the synthetic seasonality indicator show that rural tourism cannot be evaluated as a homogeneous type of tourism. Rather, each destination has unique characteristics. Some destinations show tremendous stability, superior even to that of consolidated destinations. In other areas, the annual concentration is extreme. Moreover, since the number of arrivals is lower in rural areas than in other destinations, the possibility of generating resources in off-peak periods is lower than at coastal destinations. For some destinations, the small scale of activity measured by number of tourists combined with low levels of seasonality make this type of tourism an excellent alternative for development. In contrast, other destinations obtain different evaluations, since the extreme seasonality they suffer leads to periods with little activity as well as periods with higher concentration, a situation not beneficial for either environment or local community. These results provide empirical evidence in the same direction as previous studies, which indicate the error of evaluating rural tourism as a homogeneous category (Canoves et al., 2004). Instead, each destination is defined by the characteristics of the rural environment in which it is located, the people involved and the goals of public administrations. As each destination creates specific conditioning factors, it is necessary to adjust antiseasonality policies (diversifying supply, attracting new segments of demand, and improving infrastructure) to each case.
Nevertheless, this methodology has some limitations that must be taken into account. The first is lack of data. Not all tourist regions have reliable monthly data on the different variables that this indicator proposes. Our study takes as reference for its focus the territorial units defined by the Natural Parks, although the limits of influence of a homogeneous tourist product may differ from each other. We accepted this limitation due to availability of reliable data. One of the biggest limitations derives from the fact that we must work with a particular case study. Although the region of Andalusia offers a heterogeneous tourist product, it cannot cover every alternative a rural destination can adopt. Intensity of seasonality may thus differ. To overcome this limitation, we propose applying this methodology to other environments so that the results can be compared to enhance the conclusions. These complementary studies will help establish the circumstances or conditions under which rural tourism enjoys a low level of seasonality, since, as we indicate, it is not possible to analyze this type of destination as a homogeneous category.
Our recommendations complement the conclusions published by other previous studies that indicate the heterogeneity of rural tourism. Analyzing rural tourism and its capacity to act as a factor of development must be tackled through application to each destination, through case studies that analyze the nature of the demand, the location’s tourist resources, and the markets it attracts. Among future lines of research and recommendations for public policy, we suggest identifying which resources, geographic areas or environmental conditions guarantee greater annual stability, and thus better possibilities for contributing to rural development. This proposal will improve planning of rural destinations in both private and public sectors. The methodology proposed is useful for this purpose, as it enables full comparison of the evolution of seasonality intensity by analyzing its expressions. The main line of research should thus include replication of this study in areas with characteristics different from those portrayed by southern European regions, such as areas with cooler climates or inland regions. We also propose complementary future lines of research, such as analysis of how inhabitants of rural areas perceive seasonality, the influence of factors such as proximity to large population centers, the role of international tourism and the most successful strategies to reduce seasonality.
Footnotes
Authors’ Note:
The authors gratefully acknowledge the financial support to the Ministry of Economics, Industry and Competitive of Spain (Project ECO2017-86822-R).