
Abstract
One of the weaknesses of past tourism benchmarking studies is treatment of all indicators as equally important, which is oftentimes a consequence of lack of data. Therefore, implications derived from such analyses may not be given a full attention by the affected stakeholders, as in real life situations, they are more likely to allocate a different weight on different objectives for their organizations/destinations. This is where the current study comes in: it delves into inspecting the impact of managerial judgment (i.e., weights) in city destination benchmarking by applying data envelopment analysis (DEA). A rather interesting finding is that the benchmarking partners are allocated based on the weighting of each objective. Thus, this clearly points toward the importance of taking the stakeholders’ judgment into account if aiming at a more complete interpretation of the efficiency scores—an area that is indisputably fully unexplored within the destination benchmarking domain to date.
Introduction
One of the weaknesses of past tourism benchmarking studies is treatment of all indicators as equally important, which is oftentimes a consequence of lack of data. Therefore, implications derived from such analyses may not be given a full attention by the affected stakeholders, as in real life situations, they are more likely to allocate a different weight on different objectives for their organizations/destinations. For instance, objectives of Vienna Tourist Board could differ from the objectives of Marketing Edinburgh when it comes to defining their cities’ tourism success. Furthermore, they may want to benchmark with others who have a similar weight allocation in mind, as these are the comparable competitors for them.
Taking above into account, the current study delves into inspecting the impact of managerial judgment (i.e., weights) in city destination benchmarking by applying data envelopment analysis (DEA). In more detail, it is not presupposed that every indicator is equally important for every city. Instead, the individual weight factors, which stem from arguably the most important city destination decision makers, the city destination management organizations (DMOs), are added to the indicators. Both non-weighted (i.e., all indicators equally important) and weighted DEAs are run on a sample of 21 European cities for which data are available, irrespective of the heterogeneity of their ratings. This is done with the purpose of inspecting the changes in efficiency scores induced by introducing weights. This is also what differentiates the current research from previous (exclusively non-weighted) benchmarking studies: it is a first attempt of venturing into non-weighted versus weighted approaches within the destination benchmarking and wider tourism domains.
Thus, with the current study, destination managers get a full insight into the efficiency standing of their destinations and a better reflection of real life situations. Researchers are encouraged to include managerial judgment into their analyses as otherwise they may see only partial results and not a full picture.
Literature Review
Destination Benchmarking
The study and application of benchmarking practices have come a long way over the past three decades. Attention grew rapidly after 1989, when Xerox manager Robert Camp published a book on benchmarking which evoked the interest of numerous authors and resulted in a growing number of studies (Kozak, 2004; Wöber, 2002). Benchmarking subsequently became a popular management tool in both public and private sectors (Dorsch & Yasin, as cited in Lennon et al., 2006), and is nowadays presupposed by many industries and sought after for applications as diverse as the management of hospitals, banks, and destinations.
Concentrating on the tourism industry specifically, benchmarking still remains an under-researched area (Kozak & Nield, 2001; Wöber & Fesenmaier, 2004). Whereas a number of benchmarking studies have been performed within the field of hospitality (i.e., organization benchmarking studies), destination benchmarking studies are very limited (Kozak, 2004; Kozak & Rimmington, 1999a; Wöber, 2002). Kozak and Rimmington (1999a) attempted to address this issue by noting that the context of destination benchmarking is much more “generic” in contrast to organization benchmarking, “due to its multidimensional, heterogeneous, and interrelated (multirelated) features” (p. 33). In other words, greater number of attributes, both intangible and tangible, can be associated with destinations in comparison with organizations, which adds to the complexity of destination benchmarking studies and makes the whole process quite lengthy. In a similar vein, one can argue that failure to address heterogeneity—in the context of dissimilarity or diversity of, and within, tourism destinations—is one of the major limitations of the past studies, and a major challenge for future destination benchmarking studies that may deter researchers from embarking on such a daunting project (Merriam-Webster, n.d.; Wöber, 2001).
Interestingly enough, a review of literature within this research area shows that the most comprehensive studies rarely ventured beyond the scope of regions or single countries (e.g., Barros et al., 2011; Benito et al., 2014; Bosetti et al., 2006; Botti et al., 2009; Cracolici et al., 2008; Kozak & Rimmington, 1999b; Önder et al., 2017; Wöber & Fesenmaier, 2004). The majority of these macro applications were restricted to the European context (e.g., Italy, France, and Spain), hence encompassing minimal variability in terms of geographical distribution, particularly relative to the more numerous organizational applications. To date, the researcher has come across only one case of a comprehensive destination performance analysis which goes beyond the regional and single country studies (study by Assaf & Josiassen, 2012), which also corroborates the above challenges. Some authors (e.g., Cracolici et al., 2007; Cracolici et al., 2008) have worked repetitively with the same indicators in their works, arguably due to data availability and not because the main stakeholders have deemed them as important.
On a related note, a number of industry reports have been published by the World Tourism Organization (UNWTO; 2001, 2012, 2014) that emphasized the significance of urban/city tourism on a global scale (Europe, the United States, the Far East, and Australia in particular). Moreover, cities have been labeled as “the world’s greatest tourism destinations” (UNWTO, 2012, p. 4), and it has been further argued that “cities of all sizes can be competitive” (UNWTO, 2014, p. 10), which renders cities as highly appealing objects for destination benchmarking. The success and continuous growth of European city tourism over the past years has been attributed primarily to the growth of the source markets (ECM, 2018). In spite of the importance of city destinations, comprehensive measurement attempts and city benchmarking initiatives are still rather limited to a handful of approaches, one of the most noteworthy being the annual European Cities Marketing (ECM) Benchmarking Report (UNWTO, 2014). The 14th edition of this report included an impressive sample of 126 cities all across Europe, yet their performance was evaluated solely across two indicators—bednights and capacities—on which rankings were based and corresponding benchmark values were calculated using the standard arithmetic mean (ECM, 2018).
Furthermore, UNWTO (2014) has singled out several noteworthy city benchmarking initiatives: (1) the European Tourism Indicators System (ETIS) by the European Commission (EC), which is a set of indicators intended to measure competitiveness and sustainability of European destinations; (2) the Tourism Marketing Information System (TourMIS, see www.tourmis.info), which is very likely the most comprehensive and the most up-to-date database on city tourism statistics such as arrivals, bednights, and bedspaces, and is thus used as the basis for the aforementioned ECM Benchmarking Report; and (3) UrbanTUR, a report so far issued only once in 2012 by Exceltur on the competiveness of the 20 most visited Spanish cities based on 6 pillars, 15 fields, and 57 indicators.
Arguably, the most well-known initiative is the Travel & Tourism Competitiveness Report by the World Economic Forum (WEF) that produces the ranking of the countries though while employing 90 indicators (WEF, 2017). However, a lot of criticism has been geared toward this particular initiative, due to the fact that all of these 90 variables are treated as equally important for all countries. Additional concerns that can be raised in regards to the above endeavors relate to: (1) justifying the resources needed for continuous data collection in the context of doubt regarding the importance of these variables to stakeholders; (2) availability and comparability of the data, especially on a long term basis; and (3) applications going beyond mere ranking instruments and the compilation of comprehensive databases. Thus, Heeley’s (2011) argumentation that “presently benchmarking is very much ‘work in progress’ and a challenge for all involved in city marketing” (p. 36) is still very much applicable today.
Moreover, DMOs constitute the most popular target groups addressed by extant scholarly literature and several studies have emphasized the need to involve them into the benchmarking variable selection process, yet this acknowledgement comes only in the conclusive parts of these papers (e.g., Bosetti et al., 2006). In addition, many of these studies (e.g., Cracolici et al., 2007; Fuchs, 2004) also highlighted the inseparable link between the DMOs and overall destination efficiency: some actually equating efficiency to competitiveness. What is essentially implied is that DMOs are the ones who need to utilize the destination resources more efficiently if they are to make their destinations more competitive. d’Angella and Go (2009) characterized the DMO as the central actor “orchestrating” the decision making processes among other stakeholders within the tourism businesses network. For these reasons, it can be argued that the inclusion of the managerial judgment of the main destination stakeholders (i.e., DMOs) into the benchmarking analyses is one of the critical procedural elements that has been omitted in both existing industry initiatives and the academic literature on destination benchmarking. Thus, the current study makes its contribution by focusing on this very issue.
Performance Measurement and Efficiency Evaluation in Tourism
When it comes to performance measurement and efficiency evaluation, it can be posited that various approaches have been employed in the existing tourism benchmarking research. For instance, based on his review of the benchmarking and methodological literature, Kozak (2004) argued in favor of employing multiple performance measures in the analyses, both qualitative and quantitative. Hence, the suggested qualitative criteria of destination performance were ranging from tourist motivations, level of tourist satisfaction, complaints, comments, attitudes, image, and future behavior to repeat tourists’ perceptions of changes in the destination, intermediaries’ perceptions of destination performance, and lastly, tourism suppliers’ comments and complaints. Concerning the quantitative criteria, the emphasized ones were as follows: volume of tourist arrivals, repeat visits, tourism receipts, level of tourist expenditure, annual occupancy trends, and average length of overnight stays (Kozak, 2004).
Arrivals and tourism revenues were also suggested by Lennon et al. (2006), in addition to principal existing markets, emerging markets, and seasonality, whereas Wöber (2002) offered growth in demand, capacity utilization, competitiveness, internationality, seasonal distribution, and guest mix distribution as his examples of the success criteria for the city destinations. Heeley (2011) discussed four different types of measurement that should be taken into account when analyzing city tourism in specific, and deemed accurate measurement of those as fundamental: (1) volume/industry measures (e.g., tourist trips, bednights, and hotel occupancy); (2) value/community measures (e.g., tourist expenditure, income, and jobs); (3) marketing effectiveness/marketing measures (e.g., marketing evaluation studies, return on investment (ROI) calculations); and (4) intercity comparison/benchmarking (using any of the proposed measures). Thus, even a brief glimpse into the proposed measures by several authors demonstrates that there is a lack of consensus regarding the choice of performance measures in spite of the certain overlaps. Moreover, the majority of the aforementioned measures are quantitative.
With respect to analysis, on one hand, the following four methods were recommended in the attempt to monitor changes in the destination performance: (1) establish gaps between the destination and competitors, (2) establish gaps between current and past years’ performance, (3) express standard values, and (4) use of multivariate statistical tests (Kozak, 2004). One could argue that this approach is overly simplistic (i.e., not too concerned with more complex methodologies and their advantages).
On the other hand, Wöber (2002) provided an elaborate overview of the input/output transformation models (multiple input-multiple output, z-score analysis, and the balanced scorecard), as well as of the various methods for estimating the production function: (1) central tendency methods (average ratio analysis, simple regression models, random coefficient models, and mixture models); and (2) frontier models (DEA and stochastic frontier models), all of which were thoroughly explained and could be employed when measuring the business performance. The term “business” was used quite broadly and could also refer to destinations. Out of all methods discussed, DEA was singled out “as the most powerful technique which fulfills many of the requirements related to a good benchmarking endeavor” (Wöber, 2002, p. 196).
One of the more recent publications on this topic was the article on review and meta-analysis concerning the frontier studies by Assaf and Josiassen (2016). In more detail, they discussed the traditional approaches to performance measurement in the hospitality and tourism literature by focusing on accounting-based indicators, the cost volume profit analysis, yield management, the balanced scorecard, and importance–performance (IP) analysis method. Furthermore, it was argued that each of these approaches has its advantages and disadvantages; however, none of them can “provide a measure of performance relative to optimal performance” (Assaf & Josiassen, 2016, p. 613); most of them are also not able to incorporate the multiple indicators; frontier methods can overcome both of these limitations.
Thus, the authors argued in favor of using non-parametric (e.g., DEA and Free Disposal Hull [FDH], which is merely a variation of DEA) and parametric frontier (e.g., the stochastic frontier approach [SFA], the distribution-free approach [DFA], and the thick frontier approach [TFA]) methods. It must be taken into account though that both parametric and non-parametric approaches have their own advantages and disadvantages that should be accounted for. There are also studies that combine the parametric and non-parametric approaches in their empirical components (e.g., Cracolici et al., 2008). From the review of frontier studies in tourism, the popularity of DEA was very much evident in both micro (e.g., hotels, travel agencies) and macro-level (i.e., whole tourism industry) applications, namely: 49 micro studies = 35 DEA + 14 SFA; whereas out of 8 macro, 7 were the DEA studies (Assaf & Josiassen, 2016). As the current study is focused on the non-weighted and weighted DEA approaches, this powerful benchmarking methodology is introduced next.
Methodology
Data Envelopment Analysis
The first indication of DEA can be found in the work by Charnes and his colleagues Cooper and Rhodes in the late 1970s that was actually built upon Farrell’s seminal work on the measurement of productive efficiency dating back to 1957 (for more information on background and history of DEA, please see Cooper et al., 2004). What is clear from the literature is that there exists a number of definitions of this non-parametric, multivariate technique, which can be simply described as “an application of linear programming used to measure the relative efficiency of operating units with the same goals and objectives”; meaning, assessing the efficiency of one unit in comparison to all other units in the data set (Anderson et al., 2008, p. 189). Moreover, it is known “as a method for performance evaluation and benchmarking against best-practice” (Cook et al., 2014, p. 1). Within a DEA context, these operating units or peer entities are labeled as Decision Making Units (DMUs), as proposed by Charnes et al. (1978). When DEA is applied in destination benchmarking, DMUs are destinations, as for instance in the aforementioned studies by Cracolici et al. (2008) and Önder et al. (2017).
In line with the current study, an area of the DEA research that is of interest concerns weight restrictions and value judgments, where the main idea is to incorporate prior information in the assessment of relative efficiency of DMUs, which was perceived “as a natural by-product of real life applications” (Allen et al., 1997, p. 14). In other words, preferences of decision makers should not be omitted in the efficiency analyses; not every variable is equally important. Furthermore, a number of arguments for the use of weight restrictions and value judgments were proposed in the literature; some of these are listed below and have consequently resulted in various DEA extensions:
To incorporate prior views on the value of individual inputs and outputs
To relate the values of certain inputs and/or outputs
To incorporate prior views on efficient and inefficient DMUs
The assessed efficiency needs to respect the economic notion of input/output substitution
To enable discrimination between efficient units (Allen et al., 1997, pp. 15-17).
In addition, Forsund (2013) stated that imposing the weight restrictions could lead to reducing the number of efficient DMUs (for instance, if zero weight was assigned to the worst performing input/output factor as per Thanassoulis et al., 2004; or if the sample size was too small as per Cooper et al., 2004), whereas Banker and Morey (1989) and Podinovski and Thanassoulis (2007) suggested the use of weight restrictions as one of the ways one can improve discrimination in DEA.
Pedraja-Chaparro et al. (1997) also argued in favor of imposing restrictions, underlying the fact that weights attached to factors in DEA are not specified a priori. On one hand, this no a priori assignment (“total flexibility”) was considered as one of the major strengths of DEA in most of the scholarly literature, as for instance, inefficient units could not put the blame on the weight constraints for their score. However, this approach was criticized elaborately for reasons such as:
Factors of secondary importance may dominate a DMU’s efficiency assessment
Important factors may be all but ignored in the analysis (Pedraja-Chaparro et al., 1997, p. 219).
Banker and Morey (1989) pointed toward the same practical advantages and disadvantages of no a priori assignment, yet still underlined the need for incorporating the judgmental information. Further arguments raised were that weights should not really vary tremendously from one unit to another, as in the end, DMUs are homogeneous units, and if the information concerning importance of factors already exists, it should be included in the analyses (Ali et al.; Golany, as cited in Pedraja-Chaparro et al., 1997).
Dyson et al. (2001) did nonetheless caution about some of the pitfalls that should be accounted for when incorporating the weight restrictions, such as their justification, probable non-transferability across models, interpretation of results, and so on. Cooper et al. (2004) did suggest that some (not all) situations call for imposing certain levels of control. Hence, it is apparent that even those who opposed the “total flexibility” were not in favor of the other extreme (i.e., “no flexibility”), and that there is no one overall approach in dealing with this complex issue, as it is briefly shown in the continuation. For instance, Allen et al. (1997, pp. 17-24) reviewed three approaches when it comes to modeling value judgments in DEA:
Direct restrictions on weights (using various categories of weights restrictions (i.e., assurance regions of types 1 and 2, and absolute weight restrictions) and estimating parameters to be used in DEA weights restrictions)
Adjusting the observed input–output levels to capture value judgments (using cone-ratio approach by Charnes et al. and the Golany method)
Restricting the virtual inputs and outputs (not restricting the actual DEA weights, but instead restricting the proportion of the virtual ones)
On a relative note, contingent virtual weight restriction was recommended by Pedraja-Chaparro et al. (1997) as the alternative, most appropriate approach, whereas Thanassoulis et al. (2004, pp. 107-118) differentiated between the two types of methods that either:
Apply restrictions on the DEA weights – weight restrictions or
Change the comparative set of DMUs – changing the data set (either by transforming the data so that the new data reflects the value judgments or by adding new DMUs that reflect the DM’s value judgments to the data set)
Both types were also discussed in the work by Allen et al. (1997). The aforementioned methods are the most common ones when it comes to reducing the flexibility of DMUs by incorporating the value judgments; however, it should be borne in mind that other methods besides value judgments may be used for the same purpose, such as work done by Olesen and Petersen on restricting the facets of the efficient frontier, constrained facet analysis (CFA) by Bessent et al., and controlled envelopment analysis (CEA) by Lang et al., to name a few of the alternative approaches (as cited in Thanassoulis et al., 2004).
Likewise, the claim was also made that even the value judgments appear in many forms, so this may justify many different methodological approaches, each with its advantages and disadvantages, which should be taken into account together with the objectives of the analysis. It has been argued that some of the methods have been fully explored in the DEA literature (i.e., assurance regions, cone-ratios), whereas for instance, the opposite holds true for imposing the restrictions on virtual inputs and outputs. Moreover, involvement of decision makers in restricting the models seems to be a very welcome approach (Thanassoulis et al., 2004). However, overall agreement in the literature is that evidently none of the methods is “all purpose” and that a lot is yet to be done in this area (Allen et al., 1997; Pedraja-Chaparro et al., 1997; Thanassoulis et al., 2004).
Sampling and DEA Model
As a part of an elaborate destination benchmarking study, a survey instrument was developed that targeted the DMOs of European cities: in particular, the ECM members as they are the main representatives of city tourism in Europe. In order to achieve the aim of the current study and inspect the impact of managerial judgment on the efficiency scores, a pairwise comparison scaling question was asked in the aforementioned survey, the purpose of which was to get an insight into the priority vectors and weights (in other words, the relative importance of one objective over another). The sampling method was convenience sampling as the DMOs of the individual cities were approached in person during their annual events: the ECM Annual Conference and General Assembly and the TourMIS workshop. Based on the results of unfolding analysis, hierarchical clustering was done to demonstrate the similarities in weight patterns among the 37 respondents coming from 28 cities. As shown in Supplement Figure 1 (available in the online supplement), several distinct weight patterns are apparent. More specifically, respondents who ranked all objectives similar are grouped together in one cluster, each cluster with its own pattern—for instance, Lisbon is in cluster by itself (no other respondent/city had a similar weight allocation); both respondents from Bratislava are in the same cluster, and so forth.
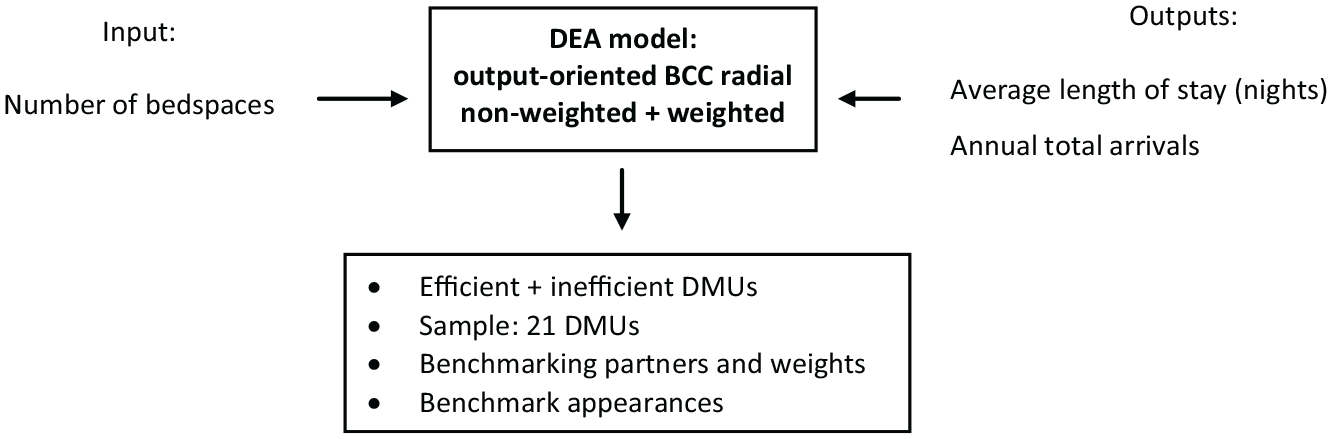
Regarding the sample for the non-weighted and weighted DEA runs, the attempt is made to inspect the scores of as many cities as possible (see Supplement Figure 1, available in the online supplement), subject to the data availability and irrespective of their fluctuating sets of ratings. Therefore, it is possible to include 21 cities (i.e., after excluding cities with missing data and treating multiple respondents from the same city as one DMU, respectively). Next, decision on indicators for DEA has to be made by taking into account the small sample size and corresponding conditions that should be met for the analyses in terms of number of DMUs in relation to number of input/output indicators. An additional deciding factor concerning the availability of importance weights for the individual indicators must be taken into account as well. In other words, only indicators for which weights are available can be modeled. Taking all these points into consideration, the most plausible approach is to work with number of bedspaces on the input side, along with annual total arrivals and average length of stay (nights) on the output side. This model, shown in Figure 1, is deemed to be the most straightforward one, as it clearly shows how the controllable input variable (bedspaces) is transformed into the volume figures (arrivals, average length of stay). Moreover, as elaborated before, these indicators are also among the commonly used measures of destination performance (e.g., ECM, 2018; Kozak, 2004; Lennon et al., 2006). All data refer to 2009 due to the availability of weights. Yet, the year of analysis is irrelevant given that the purpose of this study is to inspect the discrepancies between the non-weighted and weighted approaches, and as such can serve as the benchmarking example.
The Proposed DEA Model
Results and Discussion
Non-weighted DEA
The DEA model employed in the current study is the output-oriented BCC (Banker, Charnes, Cooper) radial, which maximizes outputs (Scheel, 2000). Resulting efficiency scores can be found in Table 1 and are in range from 58.31% (Madeira) to 144.84% (Bratislava).
Non-weighted DEA Results

Note: DEA = Data Envelopment Analysis; DMUs = Decision Making Units.
Out of 21 cities, 13 are inefficient in terms of the chosen indicators, whereas the remaining ones are efficient (61.9% of the cities inefficient vs. 38.1% efficient). In more detail, the most inefficient DMU in the sample is Bratislava with the score of 144.84%, which merely implies that the city has the potential to improve at least one of its outputs by almost 45%, while keeping its input value constant. Three benchmarking partners are suggested for Bratislava: Barcelona, Opatija, and Valencia; the most important being undoubtedly Opatija with the weight of 0.72. Vilnius and Tallinn follow Bratislava and are among the top three inefficient cities by being 34.73% and 33.19% inefficient. Three distinct benchmarks are proposed to Vilnius: Malmö, Opatija (0.65), and Valencia, whereas Tallinn has the identical benchmarks like Bratislava, yet the most important being Valencia with the weight of 0.73. Hence, it is rather interesting that these top three inefficient cities are suggested almost identical best practices to learn from. The scores of other inefficient cities range from being 6.19% (the least inefficient city in the sample = Amsterdam) to 32.38% inefficient (Turin, closely approaching Tallinn).
Eight cities are efficient. More specifically, Madeira is heading the list, followed by Opatija and Berlin. Ljubljana is the only city that has “big” as its efficiency score, which implies its extremely high efficiency (Boljuncic, as cited in Wöber & Fesenmaier, 2004). Moreover, both Madeira (58.31%) and Zagreb (99.50%) are efficient cities in the current analysis, yet Madeira is outperforming Zagreb by 41.19%. On a relative note, the latter city is the only efficient city that has zero benchmark appearances, whereas the absolute top performer in this respect is Opatija with 11 appearances, followed closely by Valencia (benchmark for eight cities), and Barcelona (seven cities). Thus, it can be argued that Opatija is the case of best practice for almost the entire sample with 11 out of 13 possible appearances.
Weighted DEA
Prior starting with the second run of DEA, data set has to be modified in order to incorporate the importance weights. The first step is normalization of the weight values. Caution has to be taken with respect to inclusion of the appropriate weights. If having a look at the sample visualized in Supplement Figure 1 (available in the online supplement), it is apparent that in case of seven cities with multiple respondents (Bruges, Vienna, Berlin, Vilnius, Amsterdam, Valencia, and Bratislava), the average of weights of their respondents is deemed as the most plausible approach to take. Moreover, one of the respondents from Genoa, Tallinn, Valencia, and Zagreb did not attempt to answer the question on importance of objectives, so for these cities there is no dilemma in terms of which weights to include.
Weights are imposed on the output variables only as they represent managerial objectives. As such, they have a “natural” weight derived from the managers’ subjective importance of these objectives. Furthermore, another argument for such a decision is simply due to the managerial aim to boost the output variables, whereas input anyhow remains constant in the output-oriented DEA model. Original output values are consequently weighted (original value * weight), thus, weighted outputs being merely managerial judgment-corrected outputs. As a result, the weighted data set understandably has lower values for both outputs; however, that does not matter as a relative size is actually relevant. Overall, justification for such weight inclusion approach is based on a simple fact that the same output variable (arrivals, average length of stay) has a different importance for different DMOs and destination managers.
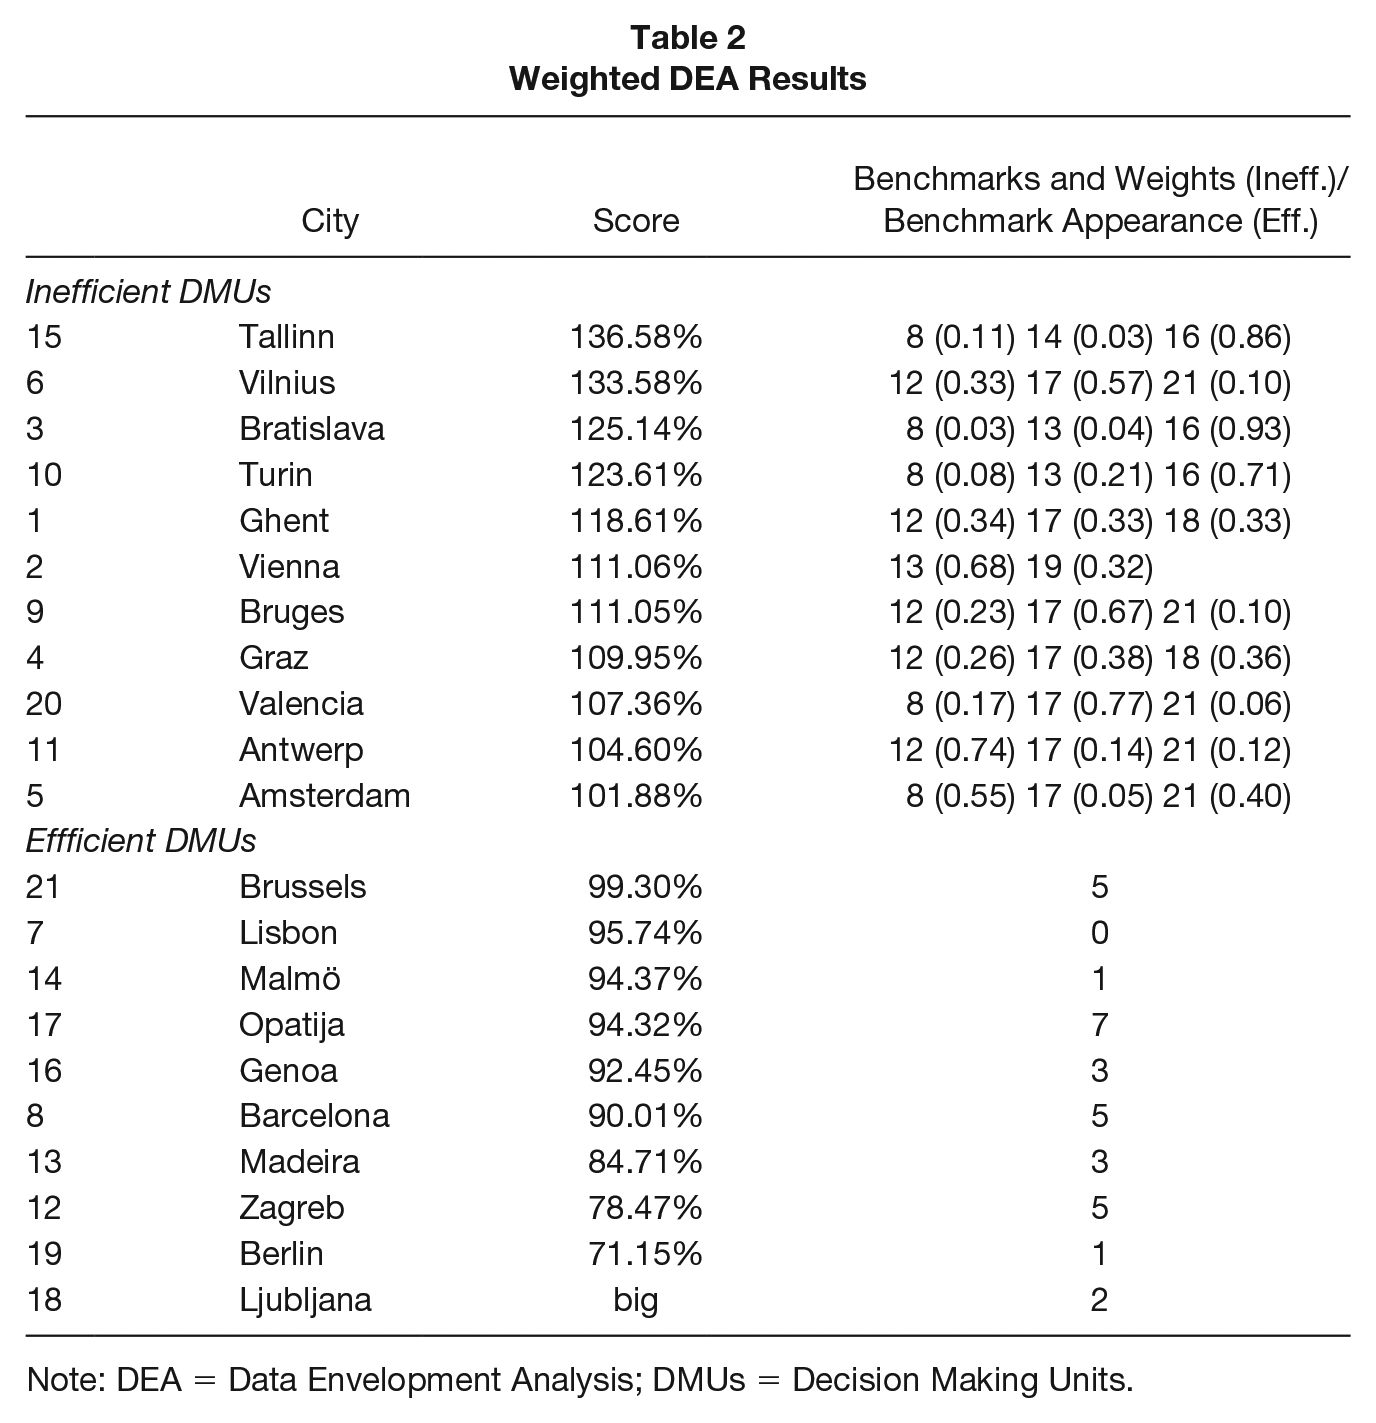
Such edited, weighted data set is used in the same DEA model as in the non-weighted analysis. The new efficiency scores (Table 2), now in range from 71.15% (Berlin) to 136.58% (Tallinn), reflect the situation where the output is evaluated according to the objectives the DMO managers pursue for their respective destinations.
Weighted DEA Results
Note: DEA = Data Envelopment Analysis; DMUs = Decision Making Units.
On one hand, 11 cities out of 21 are inefficient, with Tallinn being the most inefficient city with the improvement potential of 36.58%. Three benchmarking partners are identified for Tallinn: Barcelona, Malmö, and Genoa (the most important benchmark for Tallinn with the weight of 0.86). Vilnius and Bratislava are second and third ranked most inefficient cities, with the improvement potential of 33.58% and 25.14%, respectively. Zagreb, Opatija (0.57), and Brussels are identified as the best practices for Vilnius, while Barcelona, Madeira, and Genoa (0.93) are the most important benchmarking partners for Bratislava. Hence, Tallinn and Bratislava share the same city, Genoa, as the most important benchmark by far out of three cities proposed to each. Scores of the remaining eight inefficient cities are in range from 101.88% (= Amsterdam, marginally inefficient) to 123.61% (Turin, closely approaching Bratislava).
On the other hand, 10 cities are efficient, Ljubljana (with “big” score) and Berlin (71.15%) being the two most efficient ones. On this occasion, Brussels is the efficient city that is closest to the cut-off point with the score of 99.30%, which also means that Berlin is outperforming Brussels by 28.15% despite the fact that both are classified as efficient. The only city that has zero benchmark appearances is Lisbon, whereas Opatija is leading by being identified as the benchmark for seven inefficient cities. Brussels, Barcelona, and Zagreb follow with five appearances each.
Non-weighted Versus Weighted DEAs
When drawing the line between the two approaches, number of observations can be made. Table 3 brings the summary of the efficiency scores, both nonweighted and weighted for each city (alphabetical listing).
Non-weighted Versus Weighted Efficiency Scores

If looking into inefficient cities first, it is apparent that there are 10 cities (Amsterdam, Antwerp, Bratislava, Bruges, Ghent, Graz, Tallinn, Turin, Vienna, and Vilnius) that are inefficient regardless of the approach, which merely implies that the inclusion of soft data does not make much of a difference on the scores. The top three inefficient cities in both approaches are Tallinn, Vilnius, and Bratislava; however, their ranking is not identical—Tallinn and Bratislava swapped the ranks between the two approaches. Interestingly, DMOs of both cities have placed more emphasis on average length of stay (63.78% and 64.86%); however, this does not make much of an impact in terms of the utilization of their bedspaces. Overall, on the inefficient side, it could be argued that there are no major discrepancies between the cities’ scores; Bratislava has the most notable improvement of approximately 20% while still being inefficient. Amsterdam is the least inefficient city regardless of the inclusion/exclusion of weights. Hence, a clear message of underutilization of the bedspaces for these 10 cities.
However, it is not sufficient to look into the scores only if one is to get a full story on the impact of managerial judgment. Proposed benchmarking partners differ between the two series of scores, as shown in Tables 1 and 2. For instance, in the non-weighted approach, the most important benchmarking partner for Tallinn is Valencia (0.73), whereas in the weighted approach Genoa is identified as such (0.86). DMOs of Tallinn and Genoa have both placed a higher emphasis on average length of stay (63.78% and 74.55%) than on arrivals. Concerning Bratislava, the following scenario could be observed: Opatija (0.72) is its most relevant benchmark in the non-weighted approach and Genoa (0.93) in the weighted one, which does not come as a surprise as DMOs of Bratislava and Genoa have put more importance on average length of stay (64.86% and 74.55%), whereas DMO of Opatija rated arrivals higher (58.40%). Continually, the most important best practice for Vilnius in both approaches is Opatija; however, this is not a surprising element as both DMOs have weighted arrivals more favorably. Thus, these examples signal that allocation of the benchmarking partner is based on the weighting of each objective.
Four cities, Brussels, Genoa, Lisbon, and Valencia, are shifting between the efficiency/inefficiency zones and for that reason, are rather interesting cases for examination as they show that the overall result may indeed change if one does not treat the output variables as equally important. On one hand, Brussels, Genoa, and Lisbon are inefficient in the non-weighted approach; however, inclusion of the managerial preferences meant a major positive shift in their positioning, and all of them are now categorized as efficient (improvement of 16.13% for Brussels, 27.36% for Genoa, and last, 32.97% for Lisbon; Genoa is outperforming both Lisbon and Brussels). Such results imply that the input variable may have actually been utilized properly, which evidently, is not the case if looking at their non-weighted scores. Exactly the opposite happened with Valencia. Valencia’s DMO has put a slightly more emphasis on average length of stay (53.87%) than on arrivals (46.13%), and as a result, the city is now 7.36% inefficient. Hence, it could be argued that there is still identifiable room for improvement when it comes to optimizing the usage of bedspaces in Valencia, in spite of this not being evident in the non-weighted analysis, which is rather important implication for its DMO.
Seven cities, one third of the sampled cities, are efficient in both non-weighted and weighted approaches. Ljubljana is the only city with “big” efficiency score in both DEAs. Scores that are derived in the weighted approach for Berlin, Malmö, and Zagreb are improved in comparison with the non-weighted ones, especially in the case of the latter city (21.03%), whereas Barcelona, Madeira, and Opatija experience the opposite, negative trend, yet still remaining within the efficient zone. On a relative note, Opatija is the absolute top performer in terms of benchmark appearances in both series, although the number of its appearances decreases from 11 to 7 in the weighted analysis. Opatija’s DMO has put a higher weight on arrivals than on average length of stay (58.4% vs. 41.6%), thus, it can be argued that this weighting has made a difference in terms of its allocation as the best practice. Another interesting case is Zagreb with zero benchmark appearances in the non-weighted approach, whereas it is proposed as the benchmark for five cities in the weighted one. Valencia is identified as the best practice example for eight cities in the non-weighted analysis; however, once the managerial judgment is imposed, the city itself becomes inefficient. Thus, it can be concluded that dissimilarities are present, particularly when it comes to the allocation of benchmarking partners.
Lastly, Spearman rank correlation and Pearson correlation tests are run to inspect the correlation between the non-weighted and weighted efficiency scores of the individual cities. Both coefficients have the value of 0.75, which points toward the existing correlation between the two series of scores. Moreover, in both cases p values are < 0.001, which confirms the significance of the correlation. What needs to be taken into account though is that two series have only 56% of variance in common, whereas 44% of variance is unique, which implies that the correlation, in spite of being significant, is not particularly strong and that weighting does play a role for some cities. Two additional tests, a parametric t-test and a nonparametric Wilcoxon test for paired samples, are run due to the fact that correlation ignores the difference in the mean values. In more detail, both tests examine whether the mean values (or ranks in case of Wilcoxon) of the non-weighted and weighted series are significantly different. The p values are about 0.20 (0.27 for the paired t-test and 0.20 for Wilcoxon—higher than the conventional 0.05 limit). Thus, taking into account that the sample is very small, it can be argued that the two series are moderately correlated and do not differ significantly.
Conclusion and Recommendations
On a conclusive note, the innovative part of this study lies in transforming a non-weighted data set into a weighted one by incorporating the stakeholders’ value judgments and comparing the efficiency scores of two resulting benchmarking analyses. While some results are corroborated across analyses, a rather interesting finding is that the benchmarking partners are allocated based on the weighting of each objective. This is an important practical implication for DMOs: it is highly recommended for them to look closely toward the individually proposed benchmarks with the aim of achieving a maximum of output and consequently improving their own performance. Furthermore, it would be a very welcome addition to repeat this type of analysis in order to monitor the impact over time as the current analysis was static (i.e., one moment in time) and its generalizability is therefore limited. Another limitation of the current study is the sample size. Although the effort was made to collect data from as many cities as possible during the two major ECM events, it was possible to analyze only 21 cities in both non-weighted and weighted approaches, given that the sample had to remain identical across the two DEA runs. Subject to data availability and further data collection phases, more cities should also be included in the sample, especially since DEA measures relative efficiency. Thus, even a minor change in the sample may impact the efficiency scores. No changes were introduced to the sample in the current study (i.e., no elimination of DMUs) due to its size. Having more cities in the sample would enable modeling more indicators, which may also show to have an impact on the efficiency scores. Moreover, it would be interesting to investigate whether the managerial judgment changes over time (i.e., whether the DMOs continue to put the same weight on the individual indicators or this allocation changes) and run the benchmarking analyses.
In reality, non-weighted scores could be calculated by anyone who possesses the data on the modeled indicators, but has no knowledge on which objectives are more important to DMOs and how they assess their performance. One could go as far as to argue that having the “insider information” can indeed change the overall picture, and further demonstrates that exclusion of the managerial judgment may result in a somewhat misleading efficiency analysis. One should bear in mind that managerial judgment is understandably a subjective, soft data; however, if and whenever possible, the most sensible approach would be to conduct both analyses in order to get a more complete overview of the units’ efficiency and a better reflection of real life situations. This is an area that is indisputably fully unexplored within the destination benchmarking domain to date. Ultimately, such benchmarking exercises bring more value to the respective stakeholders and will likely prompt them to engage in such processes more eagerly and on a continuous basis.
Supplemental Material
Supplemental_Material – Supplemental material for Managerial Judgment In City Benchmarking
Supplemental material, Supplemental_Material for Managerial Judgment In City Benchmarking by Bozana Zekan in Journal of Hospitality & Tourism Research
Footnotes
Author’s Note:
The author would like to thank all members of the European Cities Marketing for their valuable contribution and willingness to participate in the empirical part. In addition, a special thank you goes to Professors Karl Wöber, Josef Mazanec, and Gunther Maier for their helpful comments and suggestions for improvement.
Supplemental Material
Supplemental material for this article is available online.
References
Supplementary Material
Please find the following supplemental material available below.
For Open Access articles published under a Creative Commons License, all supplemental material carries the same license as the article it is associated with.
For non-Open Access articles published, all supplemental material carries a non-exclusive license, and permission requests for re-use of supplemental material or any part of supplemental material shall be sent directly to the copyright owner as specified in the copyright notice associated with the article.