
Abstract
The user-generated content (UGC) published on the internet offers great advantages as a source of data. This study proposes a way to make better use of its potential to measure tourism destination image, based on the recommendations of Echtner and Ritchie. These authors indicate that in order to obtain a comprehensive picture of tourism destinations, it is necessary to carry out a holistic and attribute-based analysis using unstructured and structured data, respectively. Since UGC provides both types of data, here we propose its use to study and compare the images of five tourist cities. Our results demonstrate that UGC is a valid source for the study of tourism destination image, confirming the need to adopt a holistic and attribute-based approach to this concept. They also show that not all attributes influence the overall impression of a destination.
Keywords
Introduction
Since the mid-1970s, tourism destination image (TDI) has become a concept that has raised a great deal of interest in the tourism marketing sector. The great concern with studying TDI can be explained by a general agreement regarding its importance to the viability and success of tourism destinations (Tasci & Gartner, 2007). In fact, it is thought that in order for a destination to be successfully promoted, it must be favorably differentiated from its competition and positively positioned in the minds of the consumers (Echtner & Ritchie, 1993; Toral et al., 2018). To define this concept, researchers often use the simple definition that Crompton proposed in 1979: “the sum of beliefs, ideas and impressions that a person has of a destination” (Crompton, 1979, p. 18). However, the large number of studies on different facets of TDI have made it apparent that it is a highly complex concept (Gallarza et al., 2002).
One of the most widely followed approaches today to analyze TDI is that developed by Echtner and Ritchie (1991, 1993), who describe its construction around three aspects: attribute–holistic, functional–psychological, and common–unique. They assert that destination image must be analyzed in a holistic sense, keeping in mind that each of its attributes contains functional and psychological characteristics which, at the same time, may be common to other destinations or unique. Several other authors have argued the supremacy of a holistic concept of destination over an attribute-based vision, contending that a holistic image is greater than the sum of its parts (Brown et al., 2016; Smith, 1994). However, to understand a tourism product, each of its elements must be identified separately and objectively (Smith, 1994).
Gunn (1988) provides another perspective in the study of TDI by distinguishing between the induced and organic image. The organic image is based mainly on information assimilated from noncommercial sources. However, the induced image is developed after the consumer has made an effort to use commercial sources of information. The tourist will form an image of the destination in accordance with the quantity and quality of the information available (Baloglu & Brinberg, 1997). In this regard, in the current digital age, user-generated content (UGC) increasingly contributes to the formation of the organic image that tourists have of destinations. While still the subject of debate, there are a considerable number of studies that underline that visitors tend to consider the electronic word-of-mouth resulting from UGC to a greater extent than official sources, as it is based on the experience of users and is less related to potential commercial interests (Marine-Roig, 2017; Toral et al., 2018; Tsai et al., 2020).
Therefore, UGC in the tourism sector is a priori a very interesting source of data that offers many advantages. First, now that online opinions are generated on a massive scale, it provides a vast amount of texts and assessments that are produced every day (Mayer-Schönberger & Cukier, 2013). This enables access to a large number of thoughts and tastes expressed spontaneously (Cardon, 2011) and unintrusively (Lu & Stepchenkova, 2015). It thus follows that UGC makes it possible to overcome some of the weaknesses of traditional surveys noted by Bourdieu as early as 1979: namely their artificiality and their tendency to impose not only the questions but sometimes also the answers on respondents. In addition, the data can be obtained continuously in real time (Kotras, 2020) and are easily accessible and low cost (Lu & Stepchenkova, 2015).
In order to correctly make use of the opportunity offered by UGC, the methodological discussion that Echtner and Ritchie began in their work on the measurement of tourism destinations in 1991, in addition to its subsequent reprinting in 2003, must be considered, as should the empirical application they carried out in 1993. These three publications (which, according to Google Scholar Citations, to date have 2,211, 1,356, and 2,591 citations, respectively) made it evident that structured and unstructured data sources need to be combined so as to capture the intrinsic complexity of the concept of TDI. However, despite the popularity of their work, many of the current research in this field based on UGC is using solely unstructured data sources (Liu et al., 2019; Marine-Roig, 2017; Toral et al., 2018). It is in this regard that this study aims to make a contribution, by establishing the suitability of UGC as a source of both unstructured and structured data in the study of TDI, with the advantages that the use of this source entails. The nature of online reviews is very varied, facilitating access to both experiential narratives and ranked ratings, in the style of TripAdvisor bubbles. This enables the extraction of useful data for the study of TDI not only from the holistic dimension but also from the attribute-based dimension. Consequently, this combination of data makes it possible to extract a more complete destination image and, therefore, to more efficiently design tourism marketing campaigns.
Measuring Tourism Destination Image
The most important meta-reviews of research on TDI (Dolnicar & Grün, 2013; Gallarza et al., 2002; Tasci et al., 2007) demonstrate that there has been a clear dominance of studies based on structured or quantitative data compared with unstructured or qualitative data. Fundamentally, these structured data are collected using Likert-type scales and other semantic differential scales, requiring an individual to subjectively score a set of predetermined attributes, or to characterize a series of stimuli using standardized scoring scales (Jenkins, 1999; Line & Costen, 2017). Using this score, a certain profile of the destination image is obtained that goes no further than the sum of the attributes considered (Echtner & Ritchie, 1991). In other words, because this type of procedure involves a list of attributes designed a priori by the researcher that the individual must assess, it may be that said attributes are totally insignificant to the tourist, or that some attributes they consider relevant are missing (Jenkins, 1999; Sahin & Baloglu, 2011). However, the advantage of this structured approach lies in that it is easily administered, it produces data that can be easily coded and analyzed, and it facilitates comparison between destinations.
This type of work has mainly focused on the study of functional attributes, such as monuments, hotels, and restaurants (Eid et al., 2019; Formica & Uysal, 2006). Hospitality, friendliness, and receptiveness are the exceptions, as they are the most widely used psychological attributes (Cracoli & Nijkamp, 2009; P. Murphy et al., 2000). Using these assessments, the most common approach is to compare different aspects of a single destination (Toral et al., 2018). However, although to a lesser extent, there have also been authors who have compared some destinations with others, as they believe that when a tourist evaluates a place, they do so by comparing it with others (Cracoli & Nijkamp, 2009; Formica & Uysal, 2006).
An approach based on unstructured data, however, uses an alternative form of measurement, employing unguided descriptions to measure image (L. Murphy, 2000). In these cases, the interviewee is the one who freely describes their impressions of the tourism destination. For this purpose, researchers use techniques such as focus groups, semistructured interviews, open-ended questions, or questions which use images (Deng et al., 2019; Echtner & Ritchie, 1993). The main advantage of this approach is its capacity to capture the holistic components, unique characteristics, and affective component of a destination (Echtner & Ritchie, 1991, 1993; Govers & Go, 2003). However, in general, unstructured data allow for limited analysis, as they are subject to interpretive biases to a greater extent than structured data (Gallarza et al., 2002; Stepchenkova & Li, 2014).
Echtner and Ritchie (1991, 1993) argued that both attributes as well as tourists’ holistic impressions of a place should be studied because the omission of either of these aspects would result in an incomplete measurement of the destination’s image. Consequently, they designed a general questionnaire that included a series of functional and psychological attributes. They also proposed carrying out some kind of prior research, for example, conducting a literature search on the destination, performing a study using the critical incident technique, or holding a focus group with experts in the field, in order to determine the most relevant attributes of the destination to be analyzed. The attributes finally selected are those that respondents will be asked to rate. Together with this set of attributes, they add three open-ended questions in the questionnaire to collect the holistic impressions of destinations and their unique attributes: (1) What images or characteristics come to mind when you think of XXX as a vacation destination? (2) How would you describe the atmosphere or mood that you would expect to experience while visiting XXX? (3) Please list any distinctive or unique tourist attractions that you can think of in XXX.
After these papers were published, there was a notable increase in the number of studies that followed their recommendations and used both structured and unstructured data sources, although with variations (Tasci et al., 2007). Some studies combined both sources, but sequentially. In other words, they were limited to reviewing both the academic and promotional literature and consulting groups of experts or the tourists themselves to extract the relevant attributes of the destinations considered and, based on that information, created a list of attributes that would subsequently be evaluated quantitatively by those surveyed (L. Murphy, 2000; Tan & Wu, 2016).
Other authors used a combination of methodologies more in accordance with the proposal of Echtner and Ritchie (1991, 1993), although not always in a literal fashion (Sahin & Baloglu, 2011; Wang et al., 2017). However, in many of these cases, even though the survey respondents are asked open-ended questions, they are directed in some way, as they are asked, for example, to say phrases or words related to any aspect of the destination (Lai & Li, 2012; Sahin & Baloglu, 2011). Furthermore, because the open-ended questions in surveys are often placed after the closed-ended questions, responses to the former may be influenced by the attributes listed in the initial stages of the survey (Sahin & Baloglu, 2011).
Today, with the boom in studies on TDI based on online UGC, authors are changing this tendency and once again focusing on the use of a single source of data, but this time unstructured data (Stepchenkova & Li, 2014). These data are essentially being collected through the comments that tourists freely make on social networks, traveler communities, blogs, and other tourism forums (Choi et al., 2007; Pan et al., 2007). Techniques such as most frequent keywords within the text corpus and content analysis to determine the important attributes of each destination are being used frequently (Rodrigues et al., 2017; Toral et al., 2018).
In general, the results of analyses carried out using unstructured data collected from UGC do not differ from those found offline, confirming that the holistic aspects, unique attributes, affective components that tourists have of the tourism destinations come to the surface (Lai & Li, 2012; L. Murphy, 2000; Pan & Li, 2011; Wang et al., 2017). This holistic conception is reflected by the fact that one of the most frequently mentioned words when users express themselves freely is the name of the destinations being analyzed; tourists use the name repeatedly in general descriptions of the destination, that is, they see the destination as a whole (Marine-Roig, 2017; Pan & Li, 2011).
In any event, despite the existence of a broad consensus of the need to explore all of the facets of destination image, the use of UGC is still restricted to one type of data source. In other words, because users today not only provide unstructured comments and information but also offer assessments and scores expressed in quantitative form, there is still a range of opportunities that researchers can use to their benefit. Several platforms on which users rate different destination attributes can be used for this purpose, including TripAdvisor, Booking, Opentable, Yelp, and Google Maps.
Besides the other advantages offered by the use of UGC as a source of data, in the specific case of obtaining numerical scores there is an important additional advantage over traditional methods using Likert-type scales: the assessment is based on experiences rather than on individuals surveyed. In other words, the attribute scores posted by individuals reflect their ratings of attributes that they have experienced, usually after the experience has occurred. Thus, the attribute’s rating is generated by user experience. In traditional surveys in contrast, each respondent awards a score to generic categories of attributes. For example, on TripAdvisor, visitors can rate specific museums, such as the Louvre or the museum of counterfeiting, both in Paris. However, a traditional survey would usually ask about perceptions of a generic category of “museums,” and the respondents’ answers would represent an extrapolation of their particular experience to all the museums in a city. Thus, continuing with this example, with traditional methods, the mean score for museums would be calculated from the total number of respondents rather than from the total number of experiences with each museum, which would be the more accurate measure.
Taking all of the above into account, the aim of this article is to propose the use of UGC as a source of both structured and unstructured data in order to measure TDI, adopting the approach proposed by Echtner and Ritchie (1991, 1993). To this end, this methodological proposal is applied to a set of tourist destinations in order to measure and subsequently compare their images. Correct use of this data source allows for access to channels of information and effective tools that offer a greater understanding of the complex concept of TDI (Özgen & Kozak, 2015).
Methodology
Data Sources and Subject of Study
With the aim of studying the suitability of UGC to measure TDI by using a combination of structured and unstructured data sources, the main objective of this article, the first task was to identify the different types of sources available online from which data could be extracted. Thus, TripAdvisor was considered as a source of structured data, as it is one of the most popular tourism websites in the world (Oliveira et al., 2020). On this website, scores are given for public and private establishments, activities, and places of interest that are represented on the portal, and the average score is published for each based on the scores given by users. This is what the website itself calls bubble rating, with one bubble being the worst score and five the best. Although these scores reflect the satisfaction of tourists with the evaluated attributes, they serve as a guide to potential tourists who, based on them, form their image. On the other hand, given that it allows for scores and reviews to be filtered according to the language used, in order to narrow down the type of tourist it was decided to restrict the study to Spanish, the third-most used language on the internet (Internet World Stats, 2020).
Additionally, for a source of unstructured data, and to be consistent with the above, the collaborative network minube was chosen, which is very popular among Spanish-speaking tourists (Serna et al., 2015). According to the data published on their own website (www.minube.com), this virtual community of travelers has over 800,000 text reviews in Spanish from users and around 4.5 million photos shared.
The second task consisted of choosing the cities to which the study would be applied. For this purpose, and in line with earlier studies, it was decided to carry out a comparative study of destinations (Cracoli & Nijkamp, 2009; Formica & Uysal, 2006; Toral et al., 2018). Thus, New York, Rome, Paris, London, and Venice were chosen, as these five cities have a large volume of tourists according to the Top 100 City Destinations Ranking (Euromonitor International, 2019).
Data Collection and Analysis Techniques
Using quantitative data obtained from their Likert-type scale questionnaire, Echtner and Ritchie (1993) performed a factor analysis to determine the dimensions that define the image of destinations. However, given that our methodological proposal is aimed at conducting a comparative analysis of TDIs, we used these scores to perform a simple correspondence analysis and to draw a positioning map. To this end, following the classification performed by the TripAdvisor platform, the eight types of attributes that had the greatest number of scores for the elements to be evaluated in the five cities to be studied were chosen: (1) sights and landmarks, (2) museums, (3) tours, (4) concerts and shows, (5) shopping, (6) nightlife, (7) hotels, and (8) restaurants. Through a visual count that collected the total scores until January 2018, the percentage of elements of said attributes that were within three scoring levels was calculated: “excellent” with a score equal to or greater than 4.5 bubbles; “average” with a score of four bubbles; or “bad” with a score below four bubbles. The percentage of elements with a certain score according to the users’ evaluations was calculated in relation to the total number of elements within each type of attribute. For example, the percentage of “excellent hotels” in New York was obtained according to the total number of hotels in the city that appear on TripAdvisor.
Once the percentages were calculated for the different attributes with scores of “excellent” or “bad” in each city, the technique chosen was to create a perceptual map based on a simple correspondence analysis. This technique is very useful, and therefore has been used frequently in tourism research (Choi et al., 2007; Rojas-Méndez & Hine, 2017), as it allows for a comparative study of the image of the five destinations being studied.
With regard to the data collected from the virtual travelers’ community minube, using the same procedure as Echtner and Ritchie (1993), keywords were identified from the comments, which are those most frequently used by users. Content analysis is generally based on a count of the frequency of words because, despite its defects, the words most commonly mentioned are thought to reflect greater levels of interest and concern (Marine-Roig, 2017; Stemler, 2001). Specifically, the 100 most recent comments at the time the data was extracted for each city were collected. This occurred for all cities during the months of January 2018. ATLAS.Ti 7, a computer-assisted text analysis program, was used for the qualitative analysis. Last, 25 words were selected per city. These words were used to carry out the qualitative analysis of the image of the chosen destinations. It is important to note that, given the difficulty that often exists when the meaning of a word must be interpreted, as said meaning depends, among other things, on the context in which it is framed, there is a methodological debate regarding the suitability of computerized tools for performing qualitative analyses. Because of this debate, in this study, we have chosen a semiautomatic analysis, following the recommendations of some studies which conclude that human involvement is still needed, as the creation of computer programs for content analysis is still being researched (Kirilenko et al., 2018; Serna et al., 2015).
Results and Discussion
Analysis of Destination Image Using a Structured Data Source
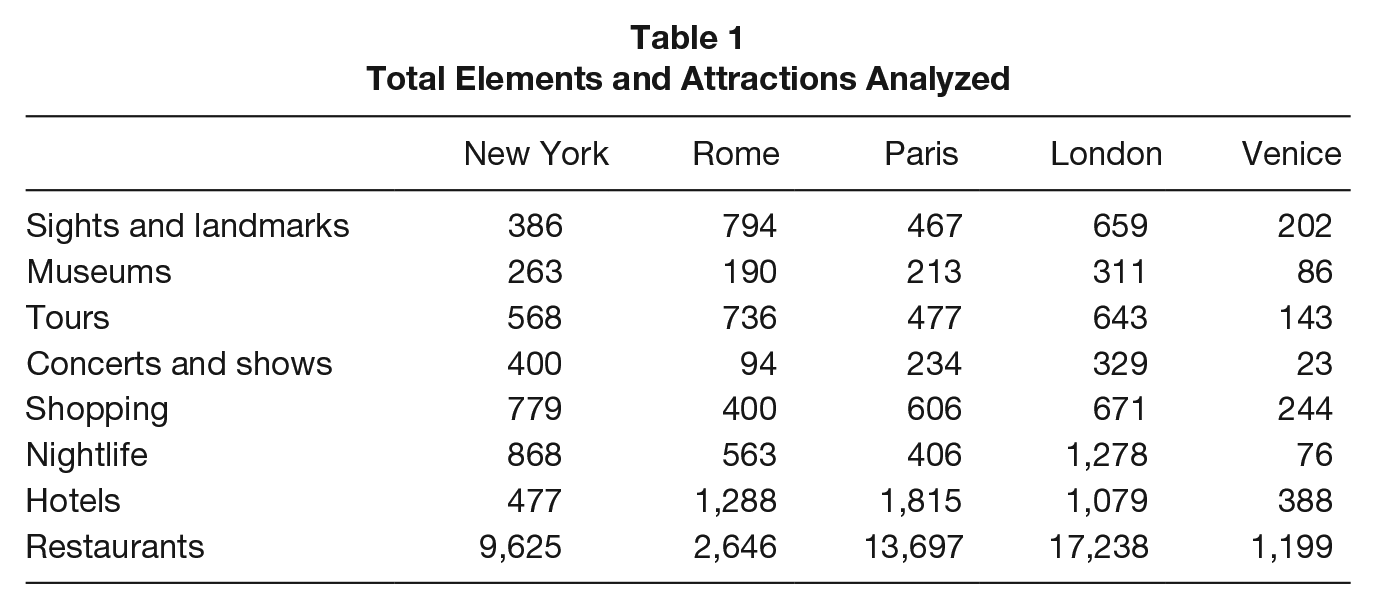
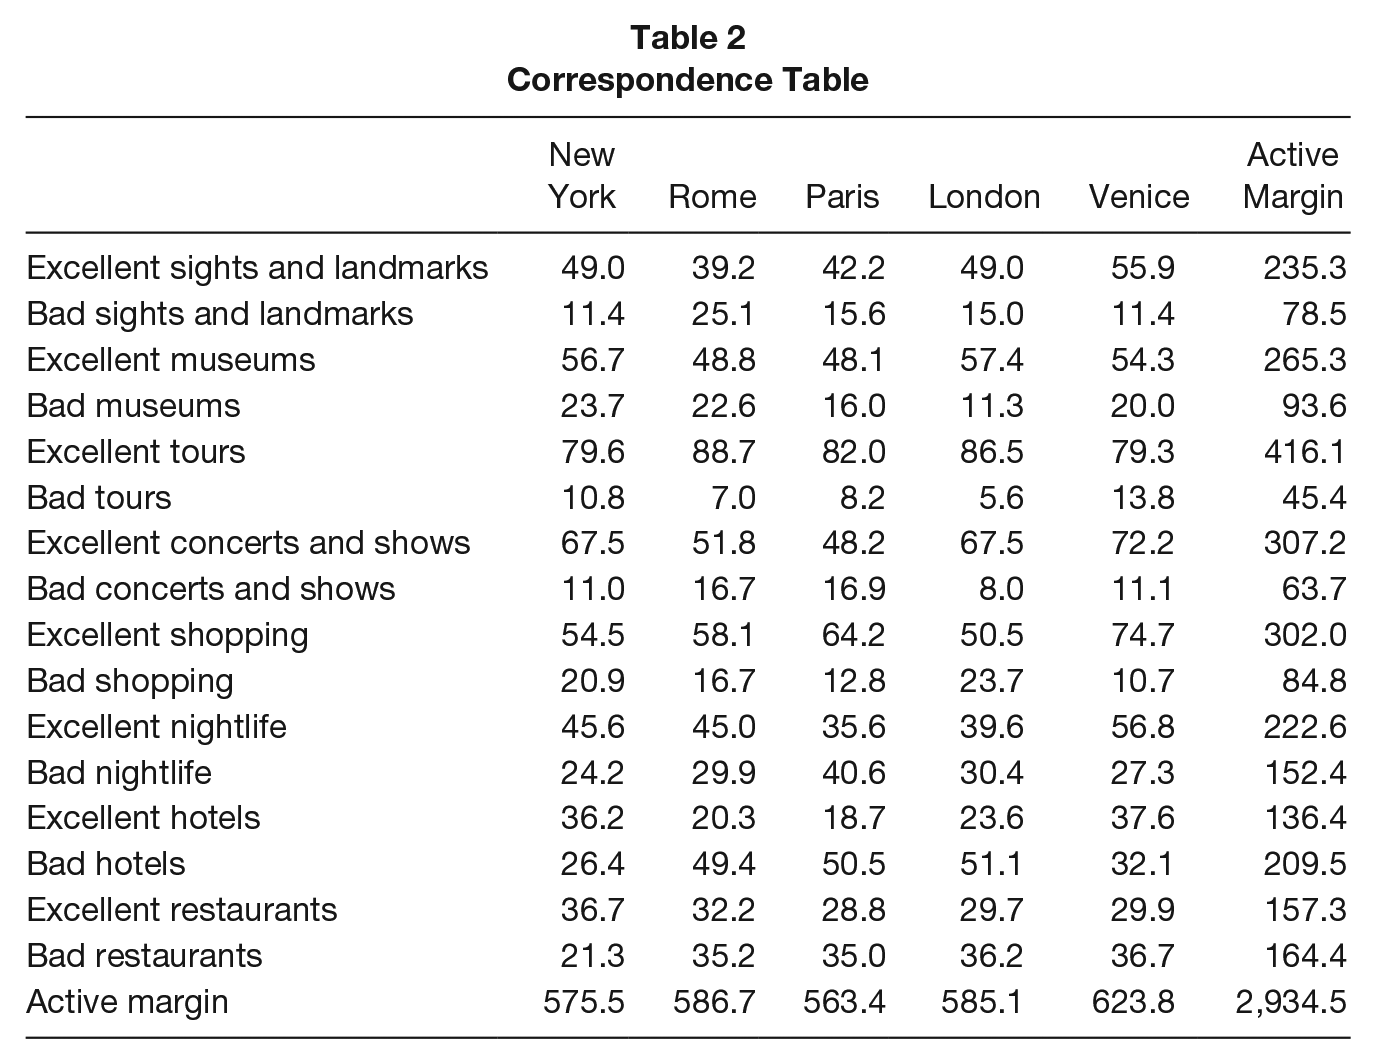
The total number of elements considered to carry out the correspondence analysis is shown in Table 1. Using this total, the percentages of elements classified as “excellent” or “bad” were calculated, as shown in Table 2, according to the average score of all users that evaluated them, thus creating the correspondence table that was used.
Total Elements and Attractions Analyzed
Correspondence Table
As reflected in Table 3, there is statistical dependence between the rows and columns in the correspondence table (χ2 = 87.766, degrees of freedom = 60, p < .05), that is, there are significant differences in the proportion of attributes with good and bad scores from the different cities. In the proposed model, the first dimension explains 57.3% of the total inertia. Similarly, dimensions two, three, and four explain 22%, 14.6%, and 6.1% of this inertia, respectively. Because the first two dimensions explain 79.3%, the third and fourth dimensions were eliminated from the analysis. Having just two dimensions allows for the data to be represented in a two-dimensional space, which helps with interpretation (Doey & Kurta, 2011).
Summary Statistics
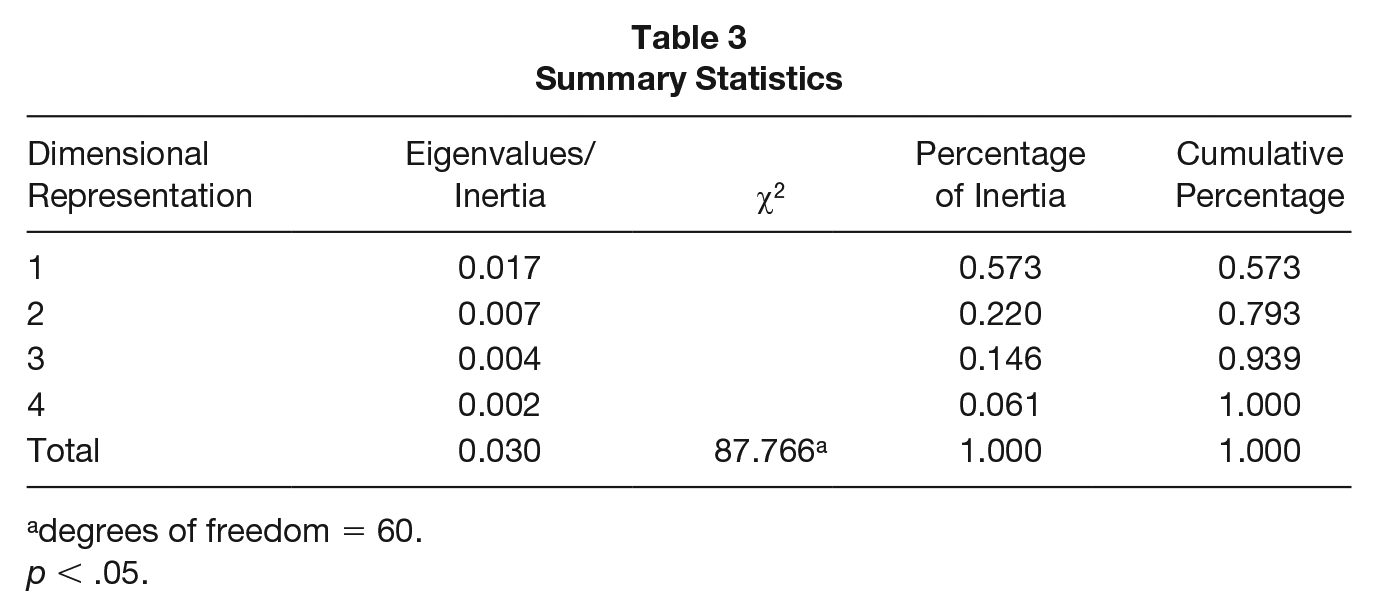
degrees of freedom = 60.
p < .05.
The results of the correspondence analysis can be shown in a symmetrical or asymmetrical plot. Although it has been found that the differences in the interpretation of data between them are minimal (Rojas-Méndez & Hine, 2017), in this study, to be cautious, both types of plot were created. Since the results between the two were consistent, the recommendations of Greenacre (2007) were followed, who states that the symmetric plot (shown in Figure 1) is the one that should be used by default.
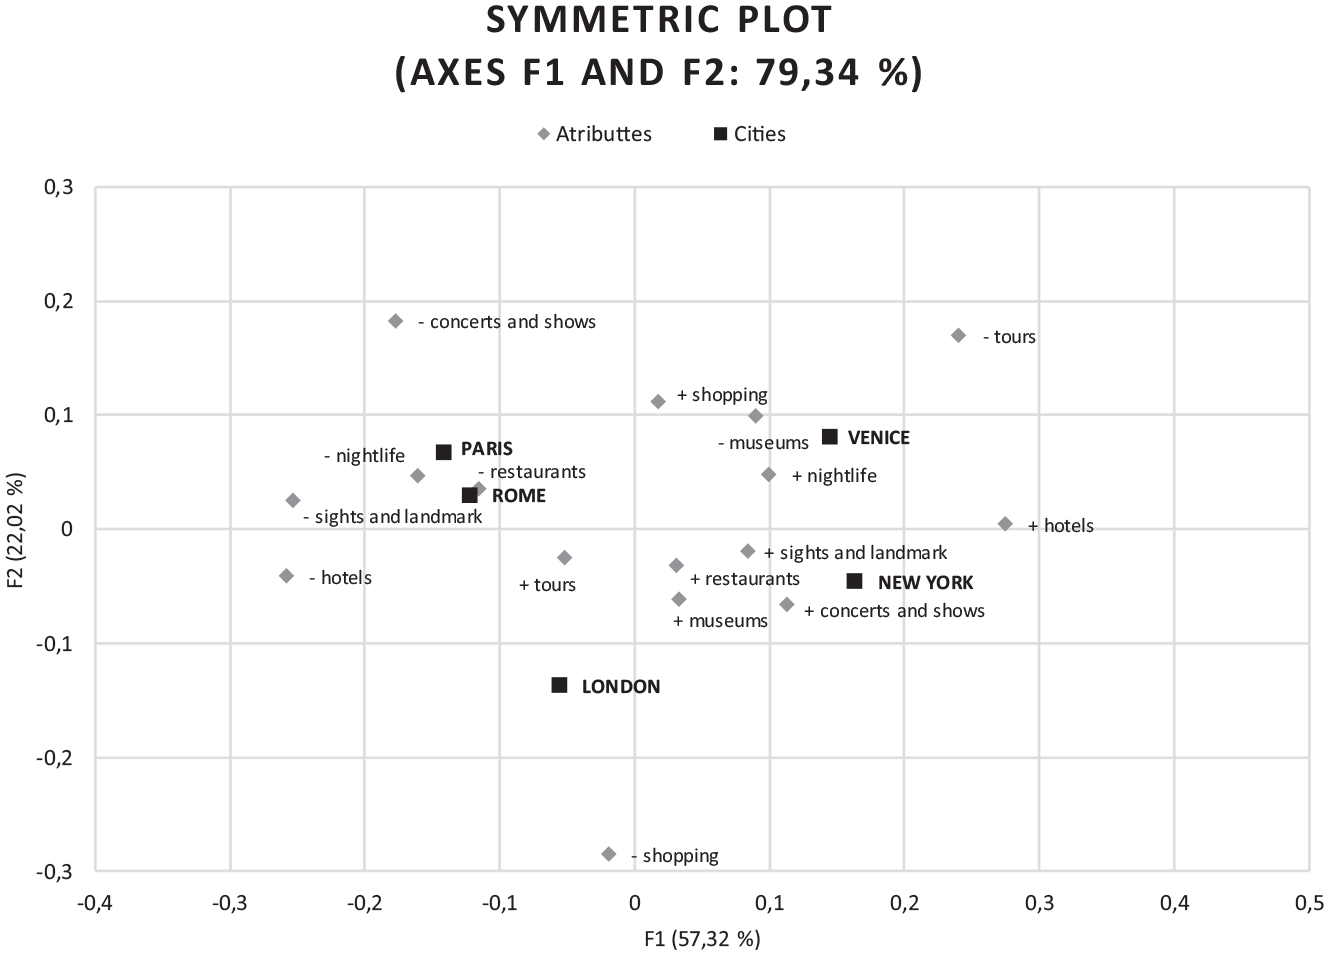
Symmetric Plot
According to this graphical representation, to interpret the similarities and differences in the cities’ profiles, we must look at their positions in relation to the attributes. The cities that are grouped close to an attribute indicate a certain score of said attribute (good or bad), in a greater proportion than the other cities. The point where the axes cross represents the average profile of the destinations. If we look at the horizontal axis, which explains more of the variance than the vertical axis, we see that the profile of New York is similar to that of Venice, while Paris is horizontally close to Rome. However, when we consider the vertical dimension, there is less separation between the cities, with London and Venice as the furthest away.
Nevertheless, not only proximity is important, but rather the importance of each factor must also be kept in mind for each category and attribute score, which are better the closer the squared cosine is to one (Greenacre, 2007), as can be seen in Table 4. Keeping these aspects in mind, it can be seen that Paris and Rome have a proportion of negative scores that is relatively higher than the other cities with regard to nightlife, monuments, hotels, shows, and restaurants, which are all important categories for factor one, except the last two. The most important positive aspects of these cities are the tours and shopping, which are relevant for the horizontal and vertical dimension, respectively.
Squared Cosines of the Rows

There are similarities between New York and Venice, which contrast with Rome and Paris, as the proportion of excellent monuments, excellent hotels, excellent nightlife, and excellent shows is comparatively higher, with the positive score for hotels being especially relevant, given its importance in explaining Factor 1. Venice is also characterized by a very positive score for shopping, an essential aspect for the formation of Factor 2, as it is the aspect that contributes most to the vertical difference between the cities. New York also has a very good score for its museums. The only aspect which is a negative point for Venice is its bad tours; New York has no negative characteristic that stands out in comparison to the other cities. These scores give New York and Venice a fairly positive view from TripAdvisor users, in contrast to the negatives that, in general, can be deduced from the positioning of Paris and Rome. London, however, is different from the other cities, mainly due to the poor score for it shopping and hotels, but also because of the excellent classification of its museums and tours. It seems to be, therefore, the city with the least defined positioning, as there is a greater balance between good and poor scores according to the attributes analyzed. However, these results must be interpreted in their context. That is, it should be kept in mind that the conclusions extracted from structured data sources using the evaluation of attributes and the creation of a perceptual map depend in large part not only on the attributes selected but also on the destinations being compared (Mackay & Fesenmaier, 1997; Prebensen, 2007).
Analysis of Destination Image Using an Unstructured Data Source
To begin the analysis, comments were collected by city in a word processor. After the first results were obtained from the ATLAS.Ti program, problems were detected that had to be solved in order to perform the most precise analysis possible. First, a revision was carried out to correct spelling and writing errors. Furthermore, words that were proper nouns and therefore appeared together on many occasions, such as the city name “New York,” were joined with dashes, thereby avoiding their being counted separately. Moreover, those terms which, without being strict synonyms, could be considered such for the purposes of our analysis were joined with a slash and counted as a single word. This is the case of plurals and singulars and of the words “Food/Eat.” Once these changes were made, the 25 most frequently repeated words in the comments for each city were selected.
The word that appears most frequently for all cities is the name of the city itself. Specifically, New York appeared 90 times, Rome 129, Paris 110, London 90, and Venice 128. Although sometimes it is observed, through the context of the comments in which the word appears, that this name is used simply as a way to reference the destination being talked about, on many other occasions the word is used to describe the city, seeing it as a whole. In other words, this result is in accordance with Echtner and Ritchie (1991, 1993) and later studies (Marine-Roig, 2017; Pan & Li, 2011), which established that holistic impressions emerge when tourists give a free account of their experiences of a destination.
Leaving aside the city names, we proceeded to classify the other words. With the purpose of facilitating analysis, it was decided that there should be mutually exclusive criteria. Thus, a preliminary analysis allowed us to detect that there were a large number of comments that alluded to overall assessments of the destinations, whereas others focused on specific aspects. This made us think of a holistic dimension of the destination versus another dimension focused on specific aspects of the destination. We observed that within the comments that made an overall assessment of the destination, there are descriptions that use positive words, whereas others are neutral assessments that, in principle, do not reflect any emotion. In no case were there words with negative connotations. In the comments about specific attributes, we saw that these tended to deal with either city icons or more practical matters. Keeping all of this in mind, we divided the words according to the following criteria, as show in Table 5: holistically, which in turn is divided into neutral and positive words, and by attributes, which encompasses unique and common attributes.
Classification of Most Repeated Words by Cities
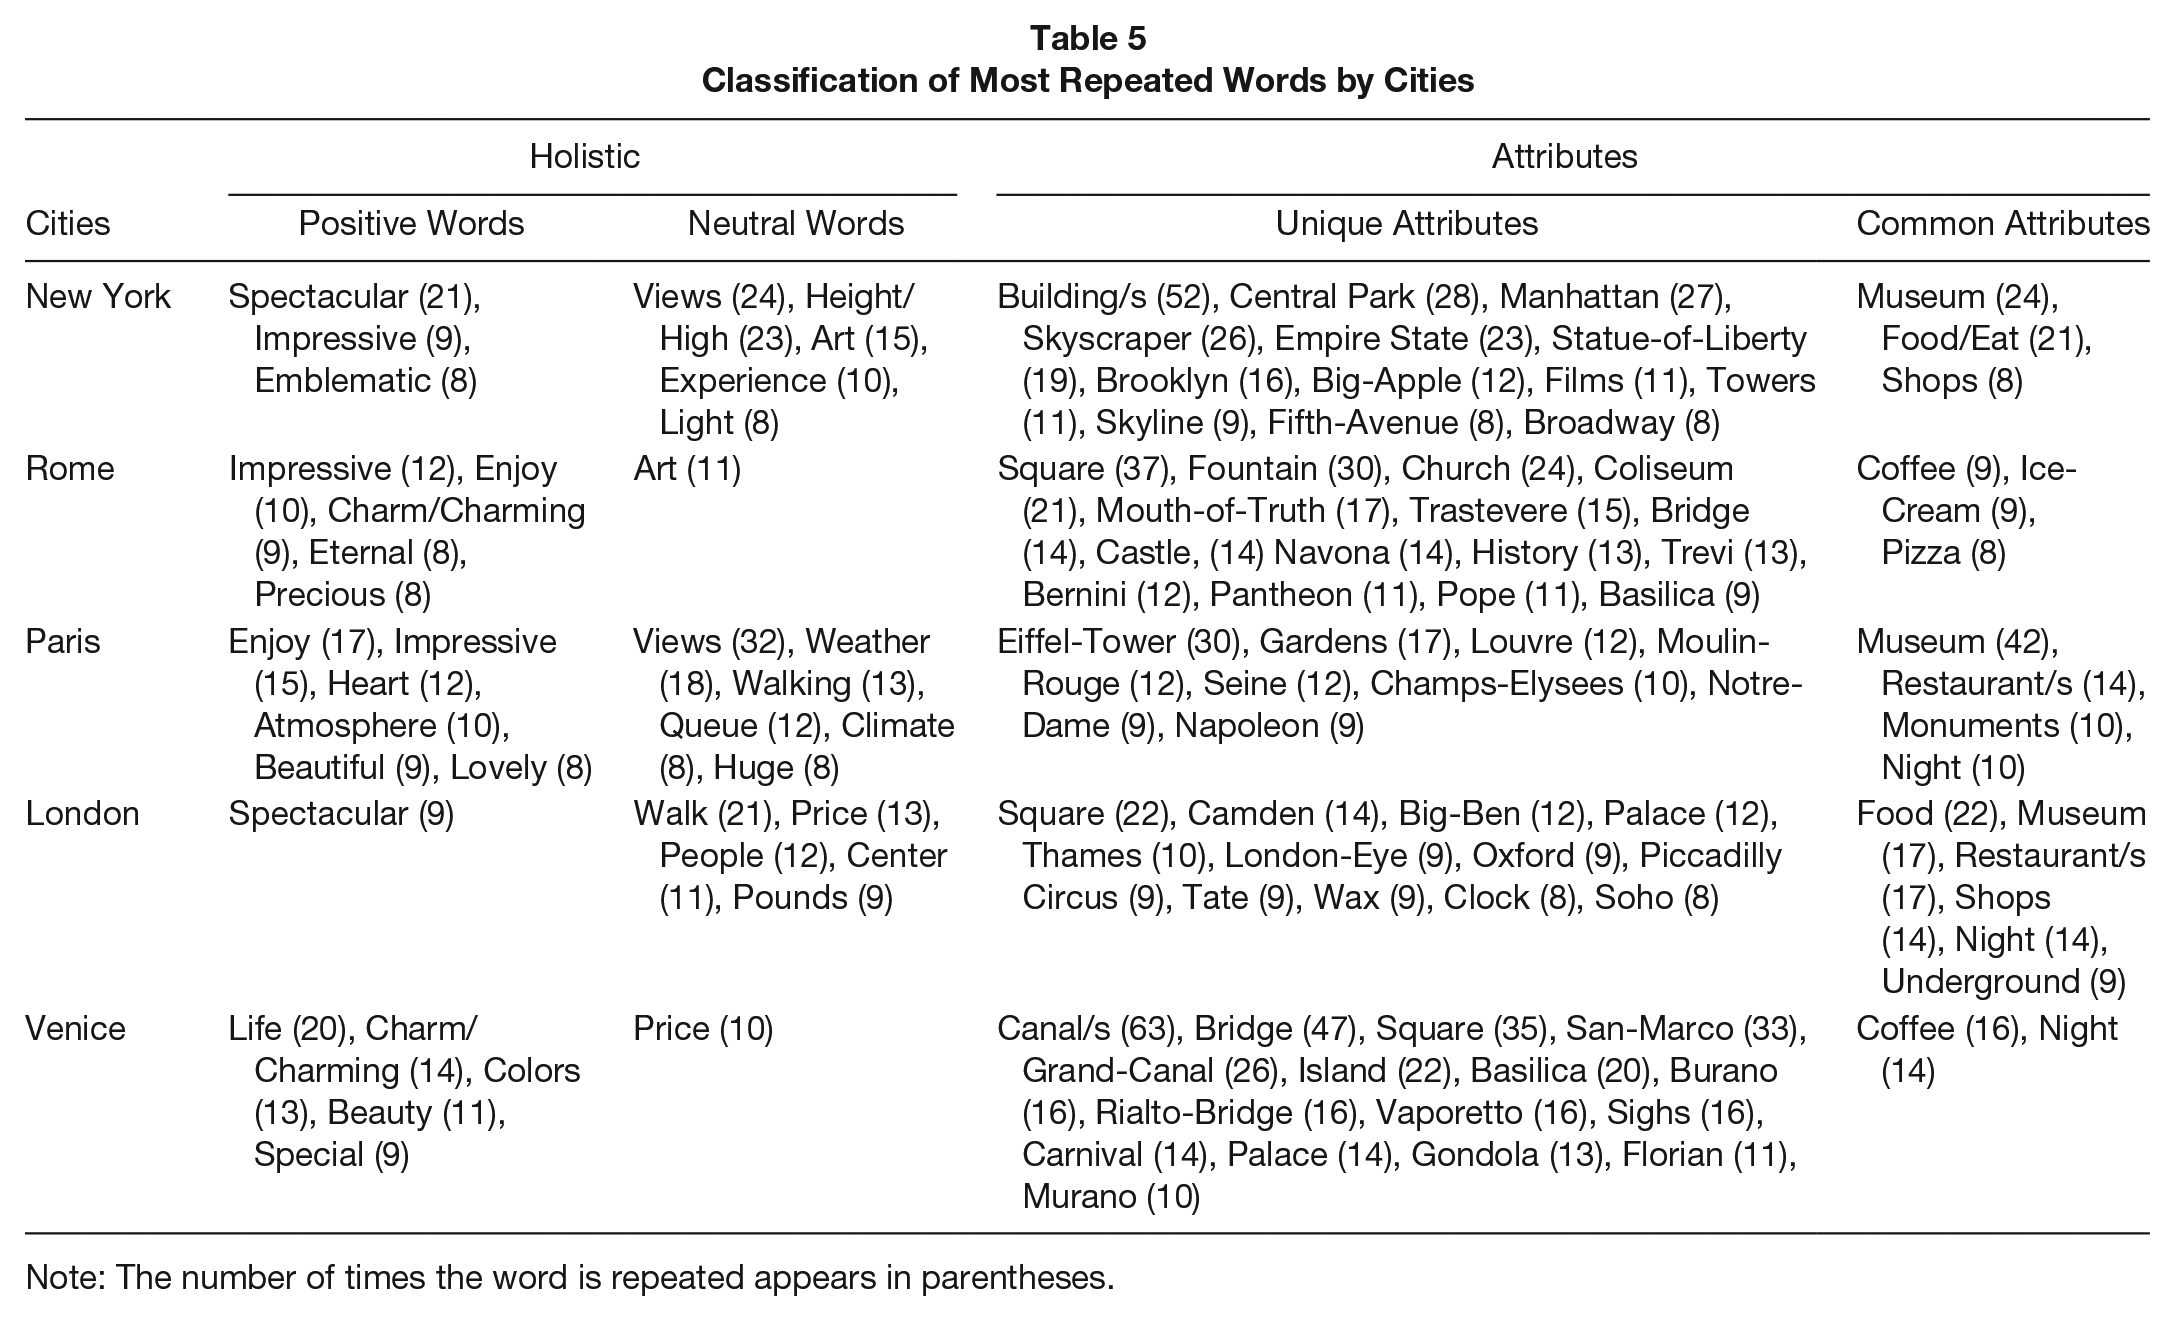
Note: The number of times the word is repeated appears in parentheses.
Given the difficulty and the degree of subjectivity that this type of analysis sometimes requires, in the cases where the classification of a word was not clear, we returned to the comments to determine the general meaning in which it was being used. These cases were particularly common for the city of Rome, for example, with words like “eternal,” which we were not sure whether to consider a unique attribute or a positive word, given that in the comments it was mainly used to express a positive emotion toward the city.
If the number of times the word was repeated is considered, viewing it as an indicator of its relevance, it is possible to calculate the percentage of representation that each category has in the comments posted on the virtual community for each of the five cities. Thus, as can be seen in Figure 2, the dominance of words that describe unique attributes of the destinations becomes clear. Again, this conclusion is in line with Echtner and Ritchie’s (1991, 1993) postulates concerning the capacity of qualitative techniques to capture opinion about the unique characteristics of each destination. These unique attributes mainly refer to the emblematic monuments of the cities, such as the Empire State Building in New York, or the Eiffel Tower in Paris, although they also include museums (“Louvre” in Paris), shows (“Broadway” in New York), rivers (“Seine” in Paris), neighborhoods (“Soho” in London), or city clichés (“Films” in New York). While unique attributes are the most relevant aspect of the five destinations analyzed, if we compare the cities, Venice and Rome have the greatest number of comments that include these types of attributes.
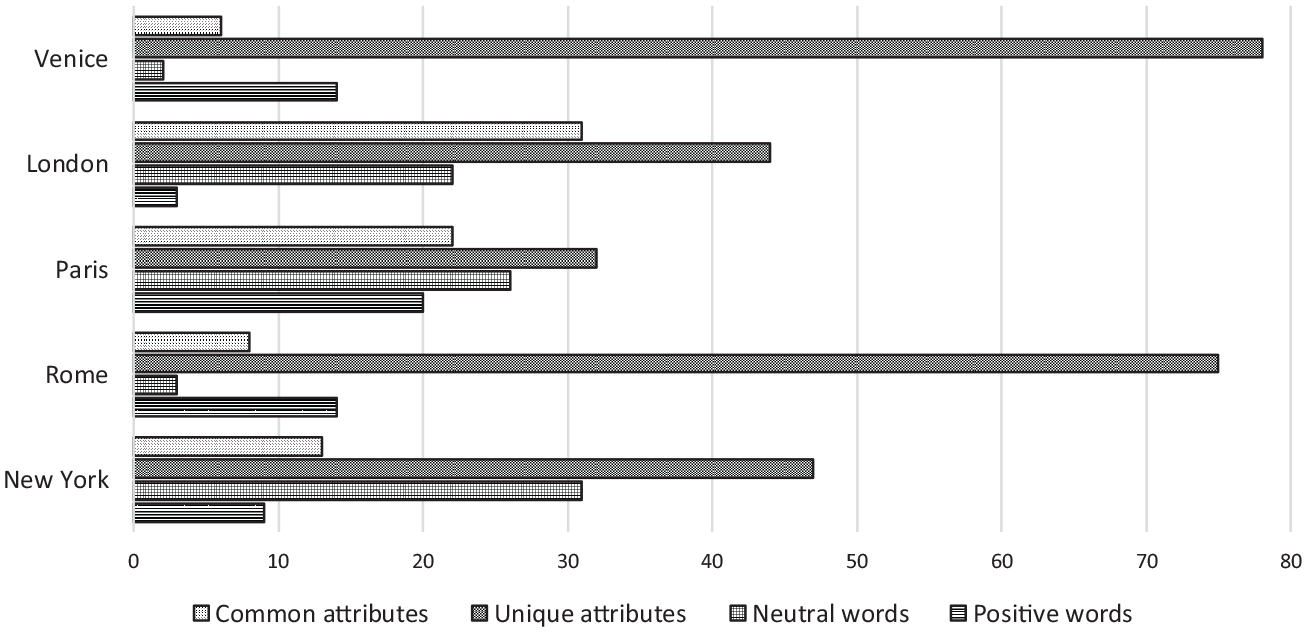
Percentage of Words in Each Category
Similarly, neutral expressions, words with positive connotations, and the common attributes of the destination are also distributed unevenly depending on the city analyzed. Thus, whereas for Rome and Venice the expressions which denote a good experience in the destination are more common than those that refer to common attributes, for New York, Paris and, above all, London, the opposite is true. However, it is interesting to note that all of the cities inspire descriptions with an affective component through positive feelings expressed with adjectives such as “Spectacular,” “Impressive,” “Precious,” or “Beautiful.” These findings are in line with previous studies on destinations that are not especially dangerous, poor, or dirty (Marine-Roig, 2017; Pan & Li, 2011; Prebensen, 2007).
However, when reviewing the user comments, it was becoming apparent that the fact that there were no adjectives or words with negative connotations at all did not necessarily indicate general satisfaction with the destination. These results are in line with Dwivedi’s (2009) assertion that tourists do not feel obligated to present solely the positive side of the destination. However, the interesting part of the results from our study is that, when users write negative reviews they do not use express adjectives, but rather look for other, less direct and emotional ways of expressing themselves, offering more rational explanations.
Moreover, common attributes are related to more practical aspects of the trip, which essentially include food, nightlife, and shopping. The fact that users comment on this type of attribute demonstrates that, in effect, not just unique attributes are relevant, but rather common attributes may also play an important role in configuring TDI, as has been noted in prior research (Kozak & Nield, 1998; Mackay & Fesenmaier, 1997), so much so that for cities such as London and Paris, they are an essential component.
Ultimately, it is seen that the construction of a city’s image is configured in different ways. In fact, there are cities that inspire descriptions with a greater affective component, such as Rome and Venice. Others are described with more functional aspects, such as New York and, above all, London; the latter presents the lowest emotional component. Paris is the destination with the greatest balance between the different elements that comprise its image.
Combined Analysis of Destination Image
Having followed the approach of Echtner and Ritchie (1991, 1993), which advises the combination of structured and unstructured data sources, both of which were extracted here from UGC, a more complete image of the cities analyzed can be obtained and a comparative analysis of them can be conducted. First, for the combined interpretation of the results according to the methodologies carried out, it may be useful to compare the aspects that imply some sort of assessment. These aspects would be the percentage of attributes with the score “excellent” and “bad,” according to the first analysis, and the percentage of positive words, according to the second. That is, if the average of the percentages of excellent attributes is compared with the average of bad attributes and the percentage of words with positive connotations for each city, it can be seen that the two data sources provide complementary images, as shown in Figure 3. Thus, Paris and Rome, despite having a poor average score in terms of attributes, with a low percentage of excellent attributes and a high percentage of bad ones, are the cities that inspire the greatest proportion of positive words. Conversely, New York, which is very highly rated in terms of its attributes, does not inspire many favorable feelings that are expressly manifested when users speak about the city in the virtual travelers’ community. Venice presents some of the most balanced proportions, although the rating of attributes is higher than its affective rating in a more holistic sense. London, with an average rating of its attributes, has the lowest favorable affective component.

Impression of the Five Cities
This apparent contradiction of results, in which one city may have a bad rating for attributes and a high positive affective component, or vice versa, is in agreement with what Hsu et al. (2004) established. They indicated that not all attributes of image have an influence on the general impression of a destination. There is even a broad current of authors who go even further and conclude that it is the affective component that has a greater influence on assessments of destinations (Baloglu & Brinberg, 1997; Baloglu & McCleary, 1999; Elliot & Papadopoulos, 2016).
However, it must be said that the opposite reading could also be true. That is, the fact that a destination has a good image based on its affective component does not necessarily imply a good rating of its attributes. Therefore, ignoring that the destination has aspects that could clearly use improvement may have long-term consequences for its image (Žabkar et al., 2010). This reinforces the need to continue to study destination image in a combined fashion.
Having the results from both sources also allows for the results obtained from each one to be put into context. Thus, although according to the correspondence analysis Paris gets a bad score for its hotels, this situation does not seem to overly concern tourists, as there were not many comments on hotels in the qualitative analysis. Conversely, the bad score for Paris’ nightlife according to the perceptual map could be a larger problem, as it was shown to be an important attribute in the content analysis. Similarly, New York and London have a factor that very positively affects their image in their museums, given that, in addition to being very highly rated quantitatively, they are of great interest to tourists according to the high number of comments made about them. The same occurs with Venice, whose nightlife offers a clear, positive differentiating aspect.
Conclusions
This study proposes a way to make better use of the potential of UGC as a data source to measure TDI based on the argument advanced by Echtner and Ritchie (1991, 1993) concerning the need to use structured and unstructured data sources to obtain a correct measurement. This is possible because today tourists post both narrative-style comments and scores expressed quantitatively online regarding different aspects of the destinations to which they travel. Specifically, the application of this approach to an analysis of the image of the five cities analyzed shows that not all attributes influence the overall impression of a destination, and also that holistic and attribute-based approaches are both necessary and complementary. Our study indicates that unstructured data sources are particularly valuable due to their capacity to capture the holistic components, unique characteristics, and affective component of a destination. Meanwhile, an attribute-based assessment facilitates an evaluation of functional and common components. This confirms that the postulates advanced by Echtner and Ritchie (1991, 1993) are also valid when all the data used to measure TDI are obtained exclusively from UGC.
This validity of UGC as an instrument to measure image is reinforced by the fact that it is a data source that continuously provides abundant up-to-date information that is easily accessible and low-cost, which allows managers and researchers to obtain sufficient representativeness in their results. Additionally, it should be noted that UGC data also offers a great degree of spontaneity, as it is based on undirected opinions and reviews. Thus, in contrast to traditional opinion collection methods, such as questionnaires containing Likert-type scales or more open-ended interviews, users talk about aspects they have experienced during a trip and to which they attach importance, without their responses having been elicited through the intervention of a researcher (Rojas-de-Gracia et al., 2021). This spontaneity is crucial because, among other things, it reveals the main attributes that define each destination. Consequently, this method can dispense with the previous stages in which, based on qualitative techniques, these attributes must be identified, as recommended by Echtner and Ritchie (1991, 1993). As a result of these advantages, UGC offers a range of possibilities from both an academic and professional standpoint for the study of TDI.
Big data techniques can be very useful to leverage the full potential of UGC, but still present challenges in terms of data collection, analysis, and interpretation (Lu & Stepchenkova, 2015). Not without reason, researchers have observed that it is not so much a question of big data as of good data (Webster, 2015). In this respect, the “6Vs” model describes the challenges facing big data techniques (volume, variety, velocity, variability, veracity, and value). In sum, the data must be converted into useful information for decision making (Sinaeepourfard et al., 2018).
It should also be noted that UGC is currently the subject of heated debate regarding its ethical use, where the advantages offered by peer-to-peer interaction are set against its potential dangers. For many, intensive use of social media fosters a so-called “surveillance society” in which public or private institutions, and even members of an individual’s own network of contacts such as family or friends, control our tastes and activities (Silverman, 2015), diminishing users’ spontaneity and autonomy. In addition, aspects such as demographic and psychographic information on the creators of UGC are problematic from the perspective both of data availability and ethics (Johnson et al., 2012).
Apart from these general considerations on the use of UGC, the main limitation of our methodological proposal is that today, the platforms that allow for numerical scores to be given to destination attributes are mainly based on functional attributes, and leave out those with a more psychological component. That is, although they allow for a quantitative assessment of hotels, restaurants, and even of the unique attributes of each destination, aspects such as hospitality or the general ambiance are not usually among the scoring options. We believe that it would be interesting if the online platforms that allow users to evaluate the most practical and tangible aspects of tourist destinations, such as TripAdvisor or Booking, also allowed them to rate a destination’s psychological attributes, which could help other users to make decisions.
In sum, the methodological approach described here offers an interesting practical implication in that that it shows researchers and destination marketing organizations the usefulness of UGC as a data source for the study of TDI. For all these reasons, it is essential for the industry to encourage tourists to write and leave reviews on several types of platforms. Those data will allow for a greater understanding of the strong points to promote for tourism destinations and the weak points which should be improved, resulting in more effective marketing campaign design.