
Abstract
Traditional methods of evaluation are limited in their ability to answer key questions often of interest to process evaluators, such as heterogeneity in the ways individuals adopt new programs. In this article, we demonstrate how a statistical approach, Latent Class Analysis, can help improve the quality of process evaluations and illustrate its use in an evaluation of an educational technology integration program in a large school district. In this illustration, we were interested in detecting variability in the ways teachers adopted the new program. We defined classes based on a set of innovative teaching strategies associated with educational technology. Results showed five distinct subgroups of teachers, based on level of program adoption. Results also demonstrate that specific school support strategies (professional development and personalized computing devices) facilitated program adoption. These findings can help to inform individualized support for teachers to optimize the ease and quality with which they are able to adopt new skills in the classroom.
The classic quantitative approach to process evaluation involves looking at aggregated measures of implementation, such as mean fidelity scores. While these so-called variable-centered methods are useful for understanding the “typical” or average behavior, they focus exclusively on one program component in isolation and provide minimal information about how individuals adopt the program in different ways. From a process evaluation standpoint, variability in program adoption is widespread (Hall & Hord, 2014; Katz et al., 2013). In this article, we demonstrate how person-centered approaches to data analysis—specifically, latent class analysis (LCA)— can help move away from traditional measures of implementation and capture variability in the ways individuals adopt change. We illustrate the approach by examining how teachers differ in their adoption of a technology integration program in a large school district. This kind of analysis may allow schools and districts to tailor specific supports to individual teachers based on their particular rate and style of adoption.
Traditional Methods Are Often Ill-Suited for Process Evaluation Questions
Individuals adopt new programs at different rates and in different ways (Hall & Hord, 2014). Differences in program adoption can be expected because of the human element involved in implementation. Individuals have different attitudes, beliefs, and perceptions about implementation that must be considered when evaluating the implementation process (Hall & Hord, 2014). Hall and Hord (2014) describe how individuals respond to new programs in their concerns-based adoption model, which outlines (1) a continuum of concerns related to program adoption referred to as “Stages of Concern” and (2) phase of program adoption—referred to as “Levels of Use.” In multifaceted programs, such as those commonly seen in education and social interventions, practitioners may differentially adopt aspects of the program (different “Level of Use”) based on their Stages of Concern of that component (Hall & Hord, 2014).
Measuring Differences in Level of Use
Process evaluations measure the extent to which a new innovation is being implemented in the way it was intended (Rossi, Lipsey, & Freeman, 2004). The use of a high-quality process evaluation is recognized as a critical step in successful implementation of innovations (Dane & Schneider, 1998; Durlak & DuPre, 2008; Meyers et al., 2012; Rossi et al., 2004; Sloboda et al., 2009; Wandersman, 2009). Process evaluation questions have traditionally addressed questions of fidelity to program core components (Fagan, Hanson, Hawkins, & Arthur, 2008; Meyers et al., 2012; Mowbray, Holter, Teague, & Bybee, 2003). However, evaluators have advocated for more comprehensive process evaluation questions that address additional aspects of program delivery (Berkel, Mauricio, Schoenfelder, & Sandler, 2011; Dane & Schneider, 1998; Durlak, 2010; Durlak & DuPre, 2008; Lamont, Wright, & Wandersman, 2013; Meyers et al., 2012; O’Donnell, 2008), noting that fidelity is a necessary but insufficient condition to reach high-quality implementation. Aspects of program delivery, including measuring the dosage of the innovation, the quality of the innovation’s delivery, the participant responsiveness to the implementation process, degree of program differentiation, program reach, and documenting all adaptations that are made to the innovation, are considered critical to high-quality implementation (Meyers et al., 2012). Equally important to collecting rich data is selecting an analysis strategy that matches the evaluation question. Often, rich data are obtained, but the analysis focuses on variable-centered aggregation of this data, for example, mean fidelity scores. This is problematic because classic evaluation methods may hide or misconstrue change that is happening (Kravitz, Duan, & Braslow, 2004; Lamont et al., 2016), particularly when Level of Use varies across implementers and/or program components. A high Level of Use among some implementers and low Level of Use among others may result in a mild average effect. Differences in program adoption may lead evaluators to conclude that little change is occurring. This can be very discouraging for stakeholders who have invested time, energy, and resources into implementation. This conclusion, however, may be faulty. Despite a small average effect, there may be a great deal of change happening. The problem may arise from reliance on average effects (an “evaluation failure”; Wandersman, 2009). There is a need for more nuanced assessments of variability in program adoption.
Applied evaluators have long recognized that focusing on the average response is insufficient and have drawn upon multiple methods to assess variability in implementation (Oesterle, Hawkins, Fagan, Abbott, & Catalano, 2014). For example, researchers may split the sample into a priori groups to see how fidelity or dosage differs between known groups (Redd et al., 2015). Alternatively, existing tools and frameworks such as FORECAST (Katz et al., 2013) or Innovation Configuration or “IC” maps (Hall & Hord, 2014) can provide rich qualitative data on the types of change that are happening. These methods are important for describing change and understanding how well the innovation is being implemented as planned. Still, these methods rely on unidimensional behaviors that are directly observable, and analysis of these data typically relies on aggregated comparisons.
LCA as a Method for Assessing Differences in Program Adoption
Fortunately, statistical techniques are available that can help evaluators understand the different ways in which individuals adopt new programs. One such method, LCA, may be particularly informative. LCA is a person-centered, latent variable model used for detecting unobserved subgroups of individuals within a population. The approach is similar in concept to a cluster analysis in that the variables of interest are distinct subgroups that capture heterogeneity in multivariate data. The goal is to understand systematic differences in the way groups respond to a set of observed variables. Similar to other factor models, the latent variable in an LCA is derived from common variance associated with imperfectly measured indicators, and the resultant factor is considered to be error free. The major difference between an LCA and other factor models is in the underlying distribution of the latent variable: LCA assumes a nominal (or ordered) distribution of the latent, while factor analysis assumes a continuous, normal distribution. Each level of the latent variable in an LCA represents a qualitatively distinct class of individuals within the population (see Collins & Lanza, 2010, for an overview).
LCA has been applied previously in prevention science, often as a means to uncover heterogeneity of a set of behaviors in a population (Lamont, Woodlief, & Malone, 2014; Lanza & Rhoades, 2011), but has not yet been used in the field of applied evaluation. Several features of LCA make it especially valuable for a process evaluation. First, LCA allows for subgroups of individuals to be defined by a range of behaviors. In the case of our evaluation (presented below), subgroups were defined by fidelity to a multicomponent educational technology initiative. One of our primary motivations for using LCA in the current evaluation was our suspicion that there were distinct subgroups of individuals who were similar in their pattern of responses across multiple behaviors. We suspected it was not enough to simply understand average levels of fidelity to each program component separately. To truly understand how teachers were adopting the program, we considered how the different components were being adopted together—for example, we asked, “are the same teachers who score high for technology the same teachers that score high on pedagogy?” and “how do these program components cluster together during the process of program adoption?”
Second, we see LCA as particularly relevant for process evaluation because in an LCA, variation in behaviors is empirically determined from the data. This is important because it does not require the evaluator to know a priori the varying ways in which programs will be adopted. Evaluators simply need data that measure indicators of level of implementation for each key component of the innovation. Indeed, if variability in the change process was known ahead of time, evaluators would be able to simply divide individuals into groups and examine differences (Lubke & Muthén, 2005). It is our experience as evaluators that this type of knowledge is rarely known. Even if differences in program adoption may be indicated in the literature or previous evaluations, we find that local factors play an important role in the way programs are implemented (Lamont, Wright, Wandersman, & Hamm, 2015; Meyers et al., 2012), and an empirical exploration of how individuals differ in how they adopt programs is warranted.
1TWO1: An Educational Technology Integration Initiative
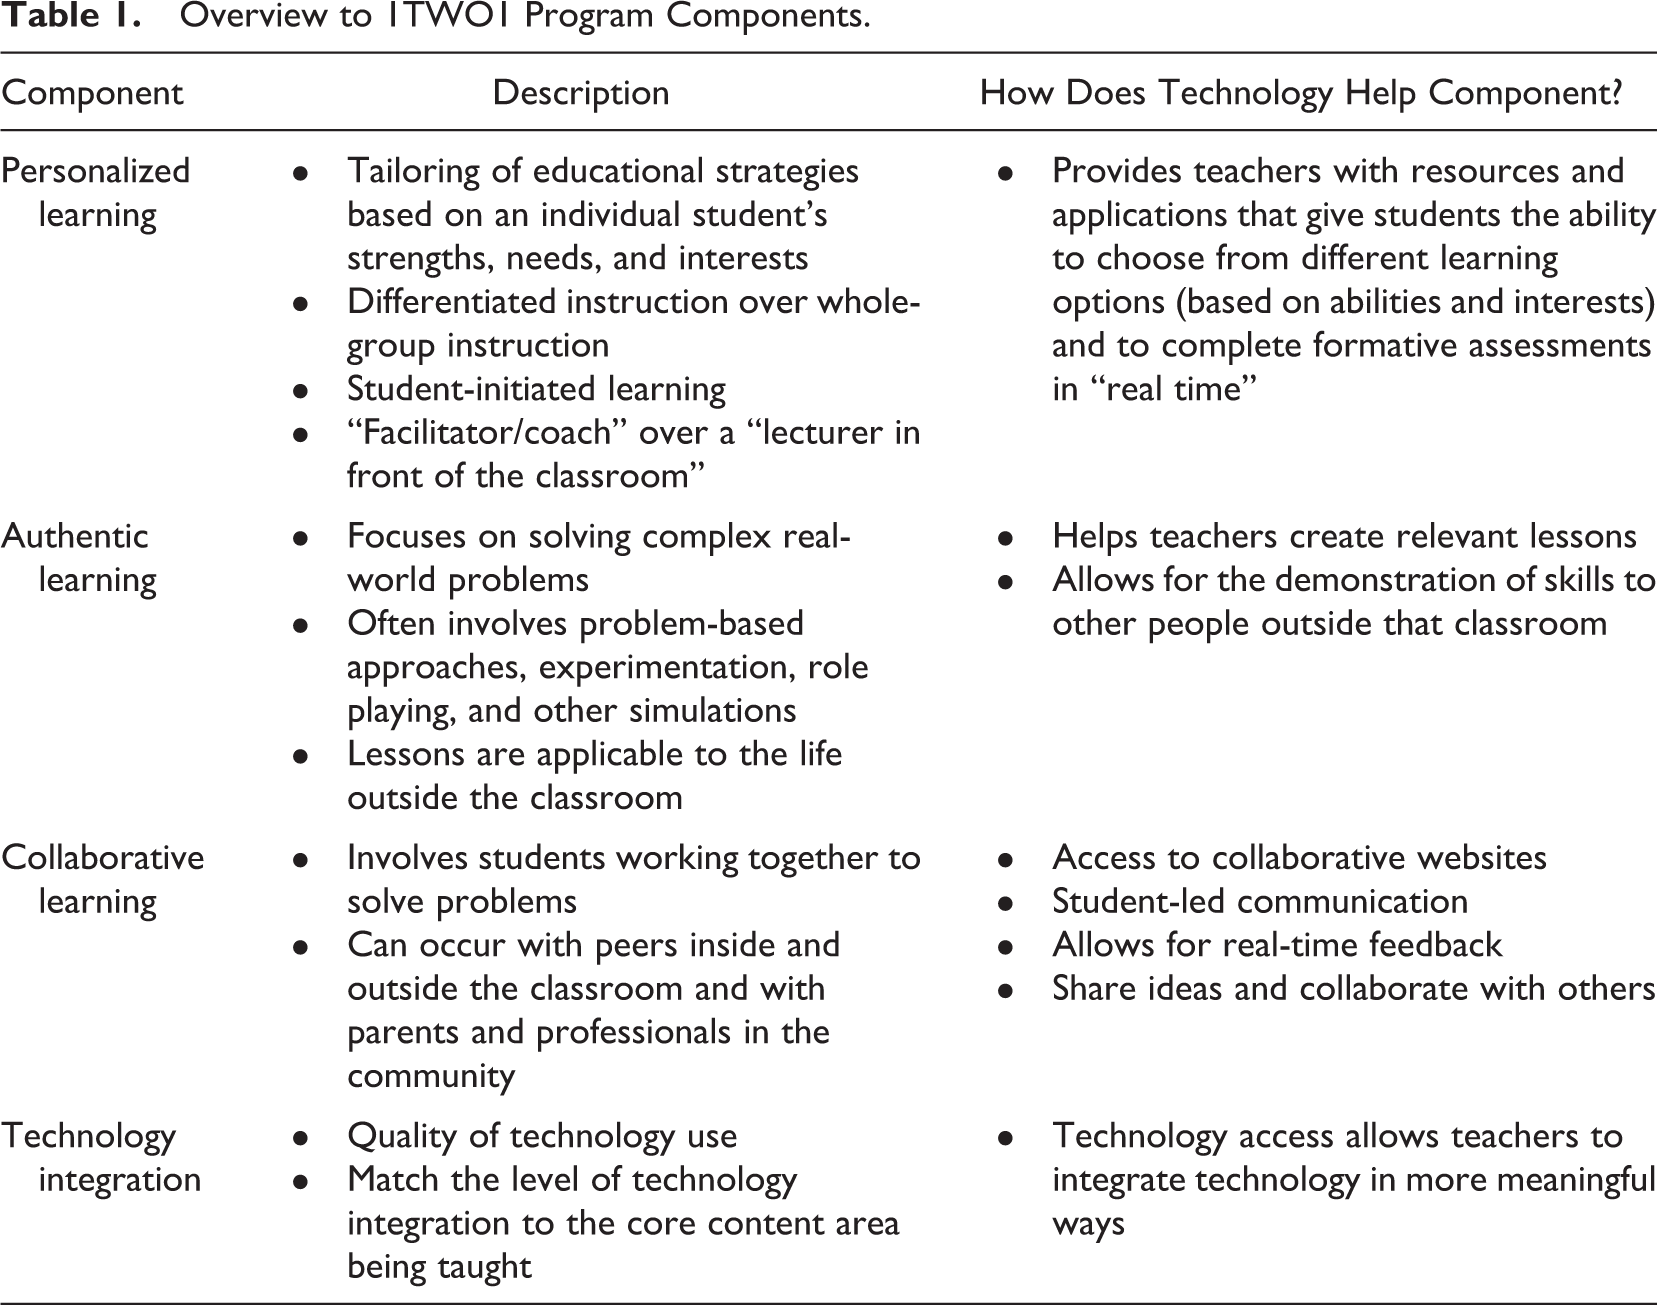
Our evaluation focuses on a school district-wide initiative to transform education through the introduction of educational technology in the classroom, referred to as “1TWO1 computing” (based on a play on words from the district name and one-to-one computing). All students in Grades 3–12 were provided with a personalized computing device to be used by teachers as a pedagogical tool. Rooted in leading educational frameworks, the major aim was to provide teachers with the technological resources needed to provide high-quality instruction in the classroom. The overall goal of the program was to increase student engagement in learning and improve academic achievement. Core program components of the initiative are described in Table 1. Given the complexity of the initiative, the district anticipated that teachers would adopt core components in fundamentally different ways and that understanding these differences would help them develop targeted support strategies such as professional development (PD).
Overview to 1TWO1 Program Components.
Research Aims
The purpose of the current study is to demonstrate how we used LCA as part of the process evaluation to identify and describe distinct subtypes of teachers defined by their adoption of a technology integration program. The innovative teaching style associated with the initiative differed substantially from a traditional educational approach, which would require time and practice to acquire. Thus, we hypothesized that during Year 2 of the initiative, there would be substantial variability in the teaching styles adopted by teachers in the district. We expected that differences in program adoption would not solely be a matter of degree—that is, not simply high/low on each individual program component—but rather we anticipated that we would detect subgroups of teachers who adopted the program in functionally different ways.
Second, we examined whether any subgroups that emerged could be differentiated based on support strategies and teacher characteristics. Specifically, we aimed to see whether subgroups were differentiated by having personalized computing devices in the classroom and the provision of PD. We hypothesized that teachers with personalized computing devices would be further along the continuum of program adoption. This hypothesis is consistent with the program theory of change that personalized computing devices would facilitate innovative teaching in the classroom. Similarly, consistent with empirical evidence on organizational support (Wandersman, Chien, & Katz, 2012), we hypothesized that PD would improve program adoption.
Method
Sample
Data for this study came from a large evaluation of an educational technology integration initiative in a large school district in the southeastern United States. The district has 39 different schools and centers. Data used in this study came from survey data in Year 2 of the initiative, when all fourth- to seventh-grade students and roughly two thirds of high school students were given a personalized computing device. The district has a history of a commitment to technology, with nearly 17,000 computers in classrooms prior to the start of the 1TWO1 computing initiative and a strong commitment to innovative teaching. Thus, classrooms that did not yet have a personalized computing device in Year 2 had access to other technology resources, and teachers were trained in innovative teaching. The difference was in whether they had a personalized technology device as a tool to support innovative teaching. A total of n = 1,246 teachers participated in an anonymous online survey. Eighty-six percent of teachers were female; 52% taught elementary, 22% taught middle, 21% taught high school, and the remainder taught at either specialized centers or multiple schools.
Procedure
Data were obtained through an online survey administered to teachers in May 2013. The survey was developed by the evaluation team and distributed by the district’s Director of Research and Accountability to the principals in each school, who then distributed to teachers. All responses were anonymous and were not linked to performance evaluations. Schools with a high response rate were entered into a raffle to win a gift. Response rates were generally high, with 71% of all teachers in the district completing surveys in Year 2 of the initiative. Due to the district’s requirement to keep all teacher surveys anonymous, a comparison between responders and nonresponders was not possible. Distributions of grade level, teacher sex, and schools in the sample were representative of the district as a whole. Descriptive data for all observed variables appear in Table 2.
Descriptive Data for All Observed Data.
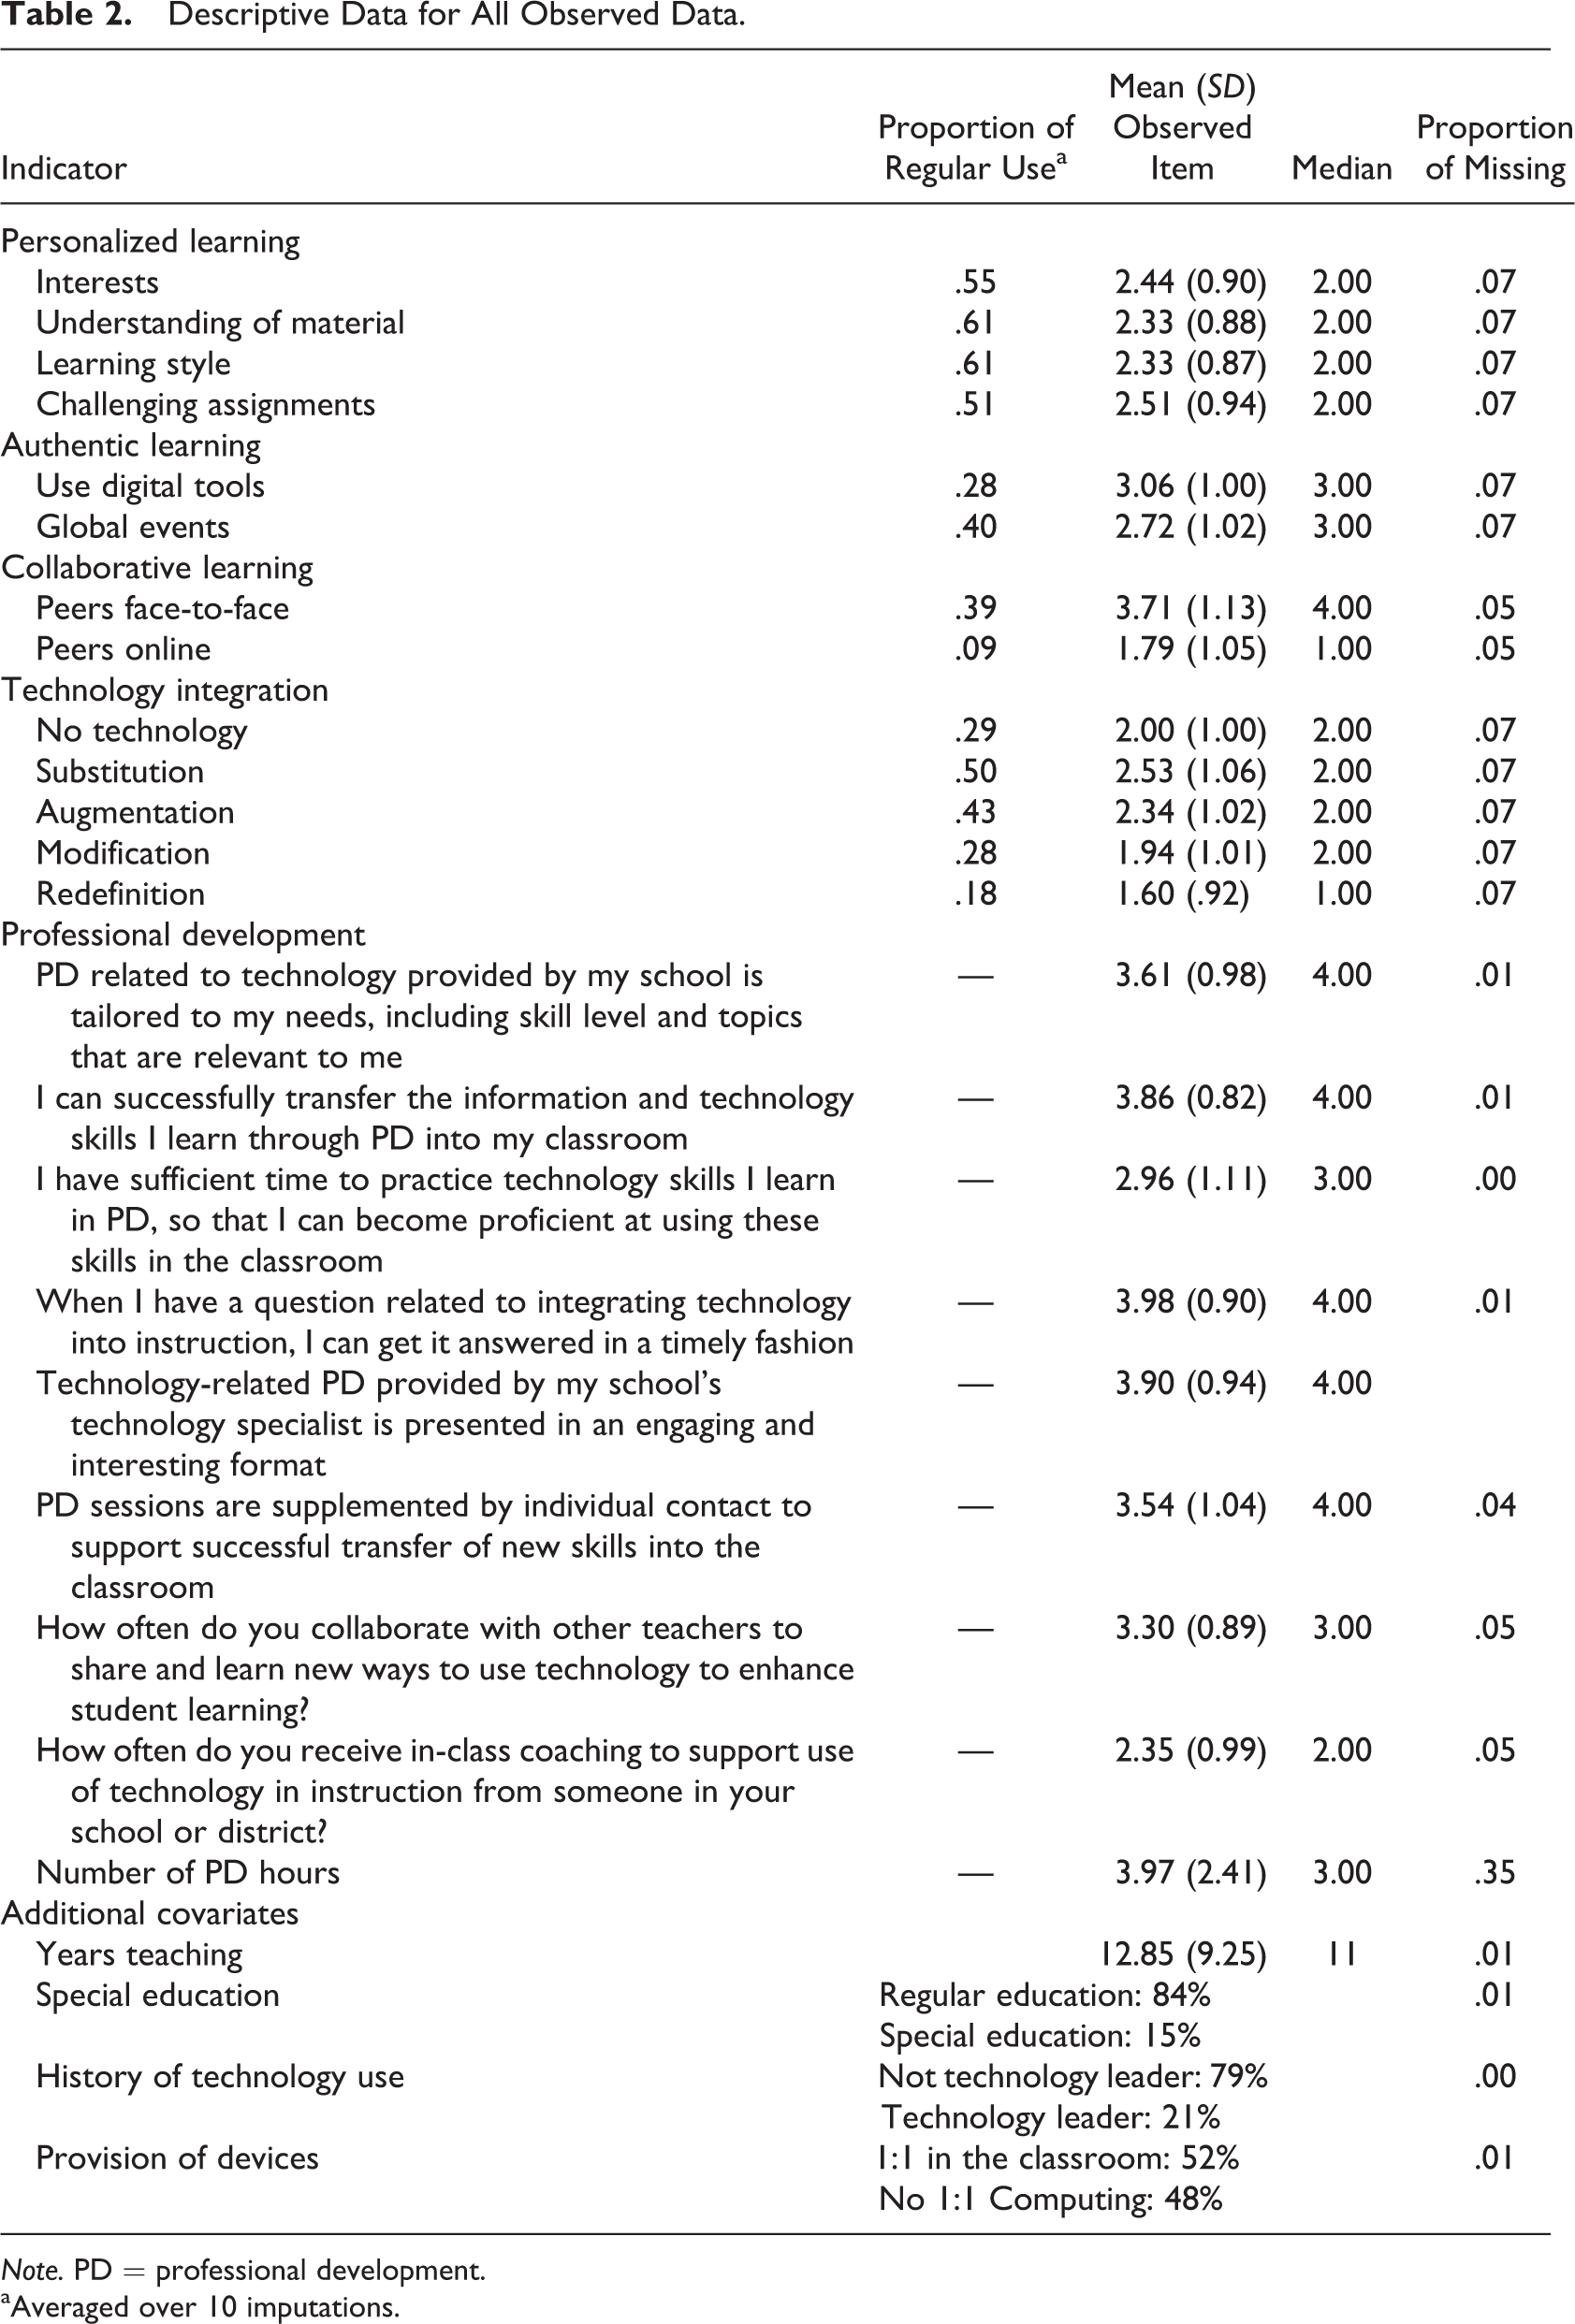
Note. PD = professional development.
aAveraged over 10 imputations.
Measures
Measures in this study cover two areas: observed indicators of latent classes and predictors of latent class. The former refers to the observed variables that are used to define the latent variable, which describes subgroups of teachers. The latter refers to variables that differentiate membership in each subgroup.
Indicators of latent classes
Outcome indicators used to derive latent classes (subgroups) were selected to reflect the core instructional components of the 1TWO1 program (see Table 1). All items used in this study were self-reported by teachers.
Personalized, authentic, and collaborative (PAC) learning
Due to a lack of standardized measures in the literature at the time of the evaluation, the evaluation team developed items to measure domains of PAC learning. Items were created by the evaluation team based on the International Society for Technology in Education (2015) standards for teachers, which are a set of widely recognized standards for learning, teaching, and leading in the digital age. Input from content area specialists and the school district was gathered, and all items were pilot tested with teachers for usability prior to use. Pilot testing was used to determine the usability of the survey and as a preliminary test of validity of items. Items that did not behave as expected in validity checks or were reported as problematic by the school were discarded. Each item was included as a separate indicator of the latent variable. Personalized learning measured the degree to which teachers utilized differentiated instruction based on students’ learning needs and interests. Teachers reported how often they personalized assignments to fit an individual student’s (1) interests, (2) understanding of material, (3) learning style, and (4) how often they asked students to move to more challenging assignments when they have finished their work. Authentic learning referred to the level of perceived relevance of classroom material to the student’s life outside the classroom. Teachers were asked how often they asked students to use digital tools and resources to explore and solve real-world issues and how often they brought students’ attention to current global (international) issues through an in-class activity. For personalized and authentic learning, all items were measured on a 5-point scale ranging from never to always. Collaborative learning measured the extent to which students were engaged in collaborative tasks and assignments. Teachers reported the proportions of classroom assignments that required students to collaborate with peers face-to-face and online (“almost none,” “<25%,” “25–50%,” “51–75%,” “>75%”).
PAC items were dichotomized to reflect “regular” use of the instructional strategy versus “irregular” use. Regular use was defined as using the strategy more than 50% of the time or very often or almost always, depending on the variable’s scale. This cutpoint was selected a priori through collaboration with the district and content experts. The district expected that teachers would implement core components as they deemed appropriate to the instructional aim, rather than 100% of the time. Thus, we determined that if teachers were implementing these components 50% of the time or at least very often, we would consider this adherent to the program. Items were dichotomized to facilitate the interpretation of classes in the LCA model, especially considering the number of indicators.
Technology integration
The quality of technology integration was measured based on the SAMR model (Puentedura, 2006), a leading taxonomy for technology integration that focuses on how well technology is integrated into instruction. SAMR defines four levels of integration: (1) Substitution (technology is used as a replacement for a classroom activity with no functional improvement), (2) Augmentation (technology replaces a nontechnology tool with functional improvement), (3) Modification (technology allows for significant classroom task redesign), and (4) Redefinition (technology allows for classroom activities that would be inconceivable without technology). Best practice for SAMR is to match the level of technology integration to the lesson. Since there was no validated measure for SAMR in the literature at the time of the evaluation, the evaluators created a series of items that asked teachers to indicate the proportion of all classroom tasks in the past 2 weeks that were best taught at each SAMR level (including no technology use). Responses were provided on a 4-point scale (“<25%,” “25–50%,” “51–75%,” “>75%”). For this study, items were dichotomized to reflect whether or not a teacher reported using each level of technology integration 50% of the time or more. Again, dichotomization was done for ease of interpretation and to be consistent with the LCA model.
Predictors of subgroups (latent classes)
In this section, we describe variables used to differentiate (or predict) teachers in each subgroup (latent class). We specifically evaluated how the school efforts, that is, provision of computing devices and school support of instructional change, helped teachers adopt change.
Provision of computers
The district followed a 3-year rollout plan for the procurement and distribution of devices. This study took place in Year 2, when some teachers had received devices and others had not. A dichotomous variable indicating whether the teacher reported that they taught in a classroom where all students had access to a personalized computing device was included in analyses (1 indicated computer access).
Support of instructional change
School support for teachers was operationalized as the provision of PD (skill building) related to 1TWO1. We assessed both the quantity of PD sessions and the quality of PD. For quantity of PD, teachers reported the number of hours of 1TWO1-related PD they attended in a group format by the school and/or district and how many hours of individual or in-class coaching for using technology they received by the school and district in the past year. Items were summed for a total number of PD hours. The quality of PD was assessed through 8 items developed by the evaluators. These items were derived from a review of the educational literature and through collaboration with educational specialists at the district and on the evaluation team. Items measured the extent to which teachers perceived that PD incorporated seven quality characteristics of PD that were previously demonstrated to be associated with high instructional quality (active learning, integration, collaboration, time for practice, coaching, tailoring, and feedback). All items were pilot tested prior to use. In-depth interviews with pilot teachers were used to assess usability of the items, and preliminary validity checks were conducted via correlational analyses and other descriptive tests. PD quality items were scored on a scale ranging from 1 to 5 (strongly disagree to strongly agree). Coefficient α was estimated to be .86 when the scale score was used.
Demographics
The level (elementary, middle, high, alternative/centers) at which teachers taught, years of teaching, teacher sex, history of technology use, and whether the teacher was a special education teacher were included in analyses as covariates. Covariates were determined through collaboration with the district. They covered areas the district thought would contribute to program adoption and answered questions related to program reach and other process evaluation questions (outside the scope of this study). All data came from teacher report and were dummy coded in analyses (for grade level, elementary was the reference class). Level of teaching was used instead of actual grade level due to a high number of teachers who taught multiple grade levels, particularly in high school. History of technology use was a dummy-coded variable that indicated whether the teacher was formally considered a “technology leader” based on their participation with previous technology programs.
Data Analysis
This study uses LCA to empirically derive qualitatively distinct patterns of program adoption by teachers. Latent classes were defined by observed variables measuring the core components of the program. The model we applied assumes conditional independence, that is, that the relations among observed indicators are fully captured by the latent variable, among the observed indicators. To determine the best fitting model, we tested a series of models with progressively greater complexity with more latent classes (Collins & Lanza, 2010). Model fitting was terminated at the eight-class solution due to low class proportions in additional classes and problems with estimation. Per convention, equality constraints were placed on class-specific variances to aid in model estimation with a modest sample size. Final model selection was based on approximate fit statistics (Akaike information criterion [AIC], Bayesian information criterion [BIC], sample size adjusted Bayesian information criterion [adjBIC]), the deviance statistic, and class proportions, along with detailed discussions with content experts. Content experts included technology integration staff at the schools, district staff, a PhD specialist in technology integration, and a PhD specialist in academic instruction. Content experts collaboratively discussed the validity of the latent classes based on extensive experiences with technology integration in the classroom. Quantitative results were also compared to other evaluation results to validate latent classes. For example, in the broader evaluation, results of classroom observations showed that there was substantial variability among teachers in their use of technology. We made sure that the different types of teachers observed in the classroom were represented by the quantitative results.
Multinomial logistic regression with a latent outcome was used to test the association between instructional support and provision of computers on subgroups. This test told us whether there were differences in observed covariates across subgroups. If significant, we then explored post hoc pairwise comparisons to understand where the differences existed or, stated differently, to understand which items differentiated between which classes. The Holm–Bonferroni (Holm, 1979) procedure was used to buffer against family-wise α inflation. Since quality of PD and history of technology use comprised multiple distinct domains of interest, we first tested the joint effect in a multiple degree of freedom tests (rather than a single-scale score), then conducted appropriate post hoc comparisons. For all analyses, teacher sex, history of technology use in the classroom, years teaching, whether the teacher was a special education or regular education teacher, and level of instruction (elementary, middle, high, or other) were included as covariates. Maximum likelihood estimation with robust standard errors (MLR estimator) was used for all analyses to take nonnormality of observed indicators into account and because it has been shown to perform well in unbalanced designs similar to the current design (e.g., imbalance in the number of technology leaders; Hox, Maas, & Brinkhuis, 2010). All analyses were conducted in Mplus software, Version 7.1 (Muthén & Muthén, 1998–2012). The complex sampling design of the study—that is, teachers nested within schools—was accounted for by the inclusion of a random intercept.
Missing Data
Multiple imputation is a flexible and reliable method for handling missing data, when missingness is assumed missing at random (MAR; that the mechanism of missingness may be related to observed covariates in the model, but not the value of the missing data itself; Little & Rubin, 2002). Although MAR is an untestable assumption, we did not have any reason to believe it was violated in our data (e.g., if teachers did not respond to an item on personalized learning because of their level of personalized learning in the classroom, which was not likely in our case). Multiple imputation is an optimal tool for producing precise parameter estimates and standard errors in the context of missingness due to survey nonresponse. However, the method could be problematic with nondeterministic analytic methods, such as LCA (Enders & Gottschall, 2011). The standard alternative, full information maximum likelihood (FIML) estimation from raw data, produces precise estimates and standard errors but requires listwise deletion for missing on exogenous variables. In order to maintain the largest possible sample while minimizing bias, we implemented a mixed strategy for handling missing data. First, values for missing data in the predictor variables were imputed using the MLR estimator with multiple imputation facilities of Mplus software, Version 7.1. All predictor and outcome variables from the analytic model were included in the imputation model, along with some additional variables that correlate with teacher instructional styles to improve imputation. Values for missing data in the exogenous variables were averaged across 10 imputations. Second, missingness on the outcome variables was handled via FIML estimation (available in Mplus) during the main analyses. Finally, n = 68 teachers did not provide data for any of the outcome indicators and were not included in the main analyses, resulting in a final sample size of 1,178.
Results
Model Selection
Class enumeration
The first step of our analysis was class enumeration, which involves testing a series of models with a progressively larger number of latent classes to determine the optimal number of classes for the data. Results of model fitting are reported in Table 3. Smaller values of the approximate fit statistics AIC, BIC, and adjBIC indicate a better fitting model. Best practice dictates that these statistics be used in conjunction with other information (e.g., class proportions, convergence, expert input) to determine the best fitting model (Collins & Lanza, 2010). Approximate fit statistics favored solutions with five or more classes. However, for the six-, seven-, and eight-class solutions, the best log-likelihood values were not replicated over 1,000 starts and were therefore deemed to be unstable solutions. Failure to replicate the best log likelihood can be considered evidence of too many classes. Further, the seven- and eight-class solutions contained classes with low class proportions, which may also reflect instability. The full set of results was shared with content experts, who confirmed that the five-class solution was consistent with substantive theory and firsthand, more objectively rated classroom observations.
Fit Criteria for Different Model Specifications (Averaged Across Imputations).
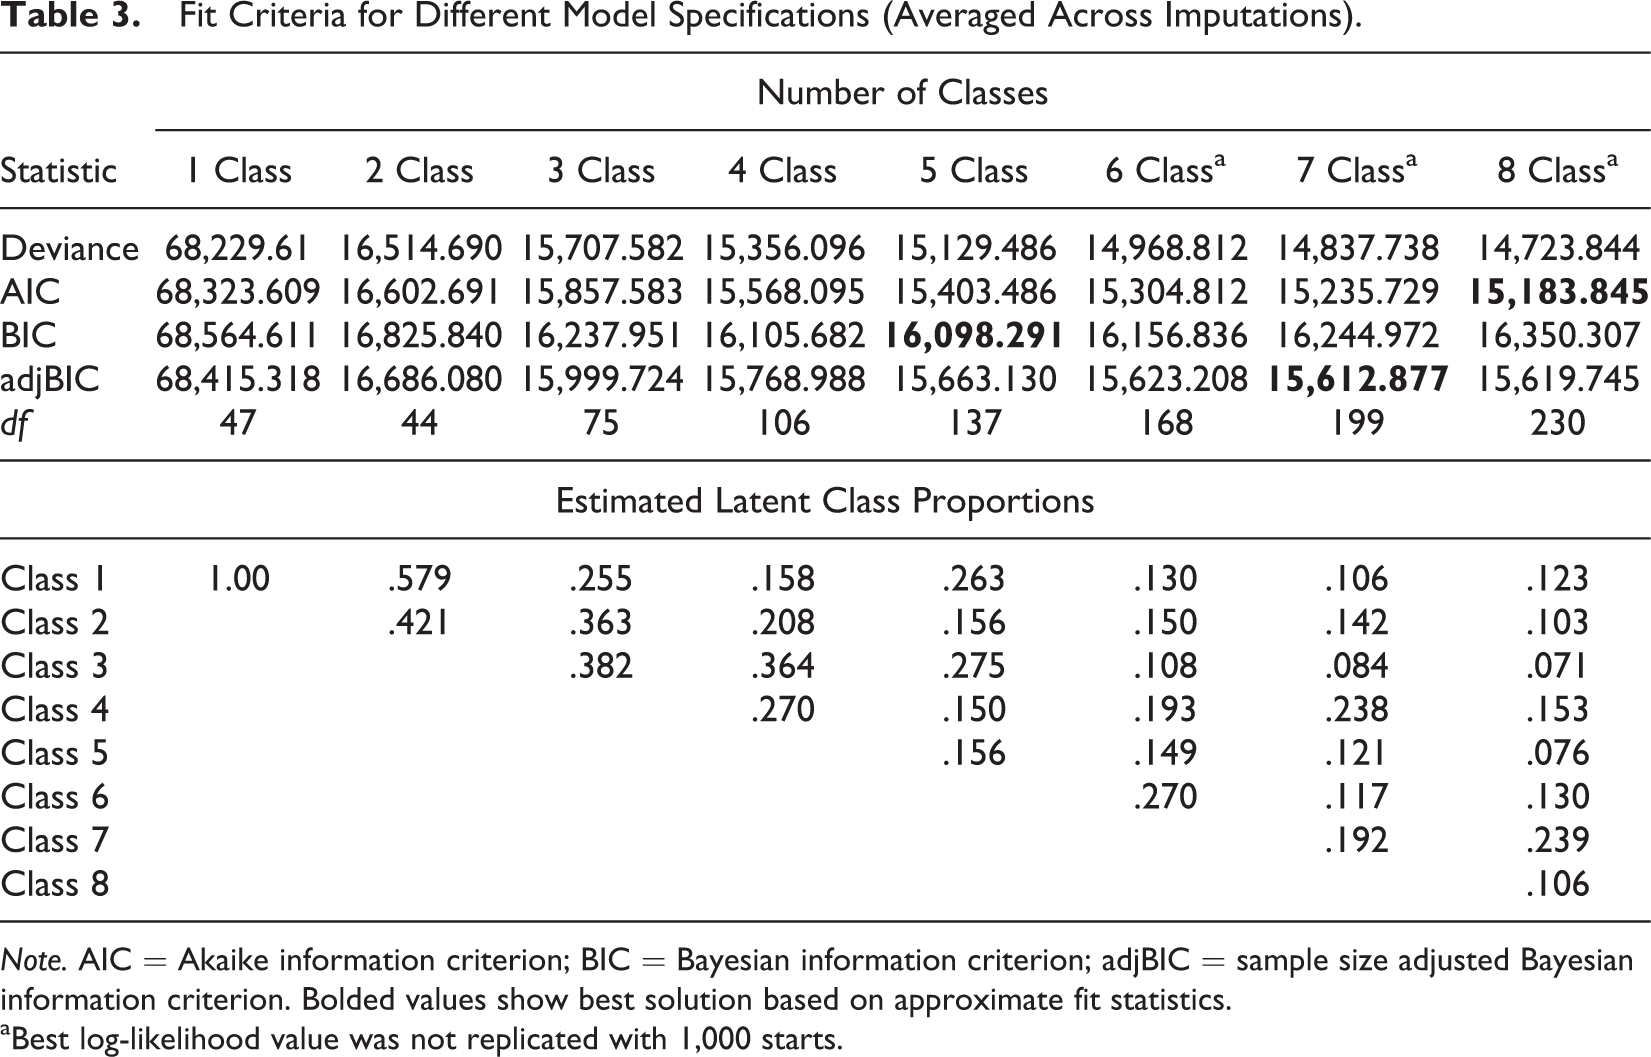
Note. AIC = Akaike information criterion; BIC = Bayesian information criterion; adjBIC = sample size adjusted Bayesian information criterion. Bolded values show best solution based on approximate fit statistics.
aBest log-likelihood value was not replicated with 1,000 starts.
Latent classes of teachers
Item response probabilities for each observed outcome indicator for each latent class appear in Table 4. Item response probabilities represent the probability of endorsing the item, given that the individual was a member of that latent class. A high probability indicates the latent class is likely to engage in the behavior; a low probability indicates that item endorsement is unlikely for that latent class. A graphical summation of this chart appears in Figure 1, which may facilitate understanding of subgroup differences.
Parameter Estimates (Item Response Probabilities) for the Five-Class Solution.
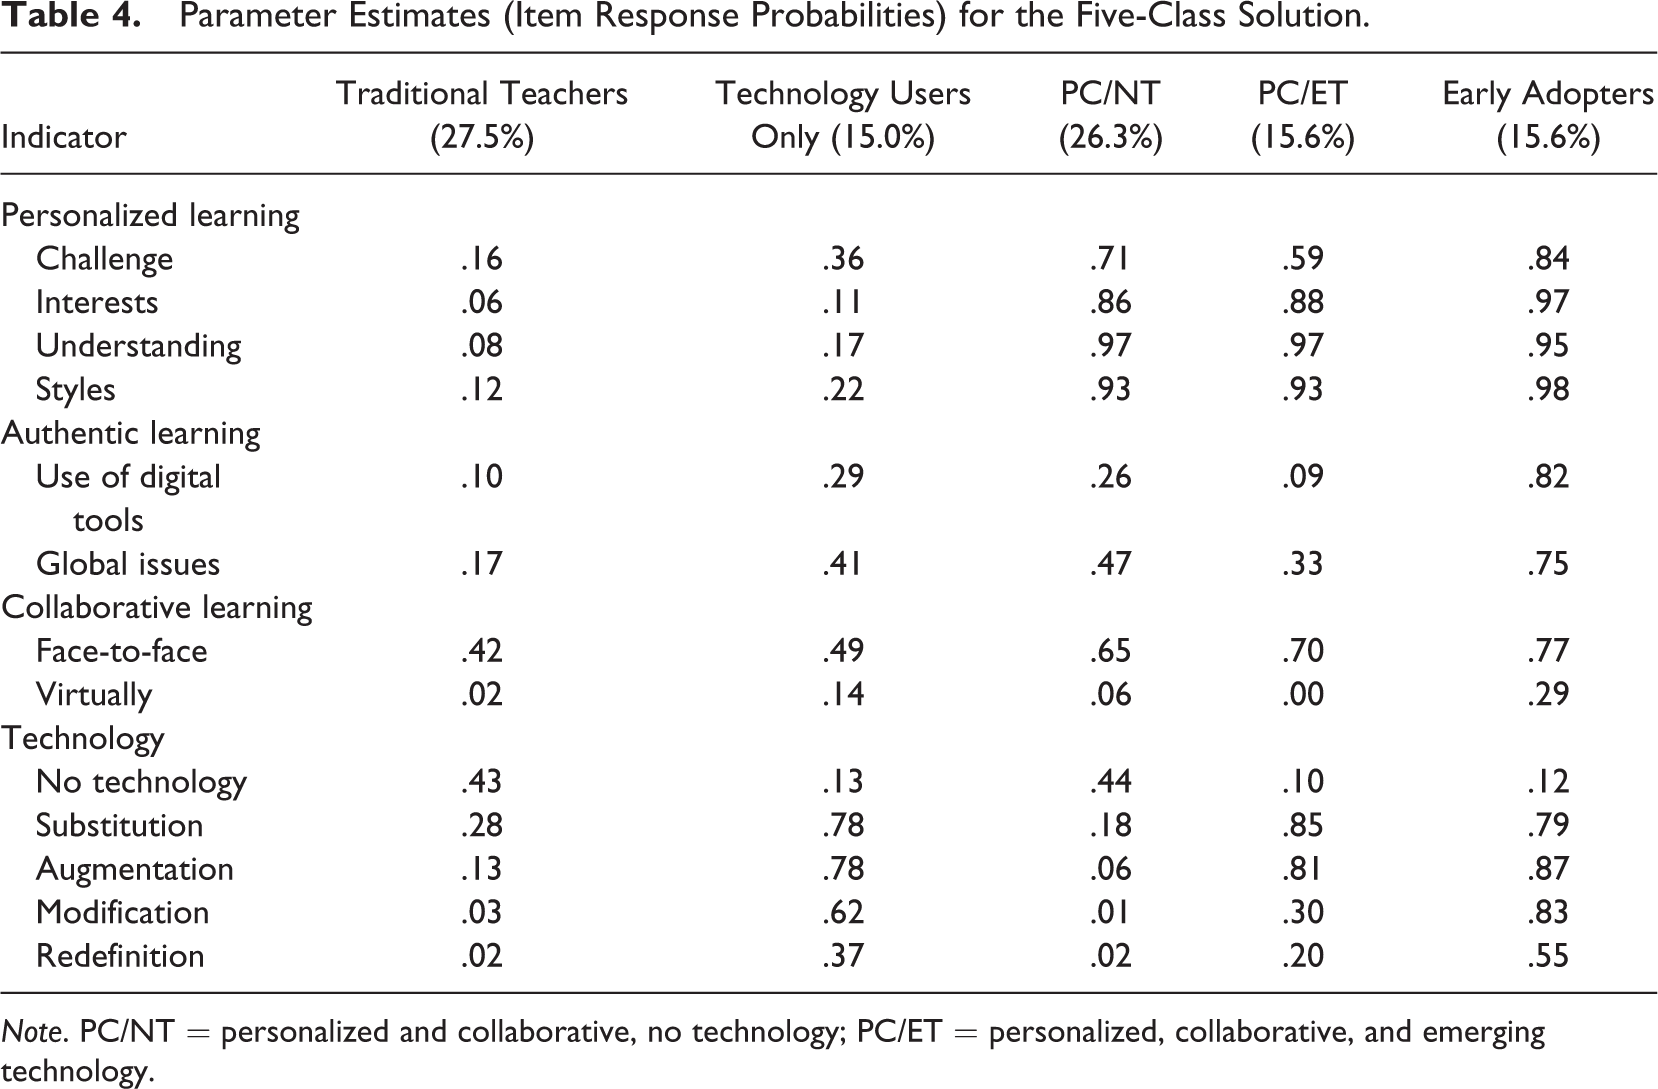
Note. PC/NT = personalized and collaborative, no technology; PC/ET = personalized, collaborative, and emerging technology.
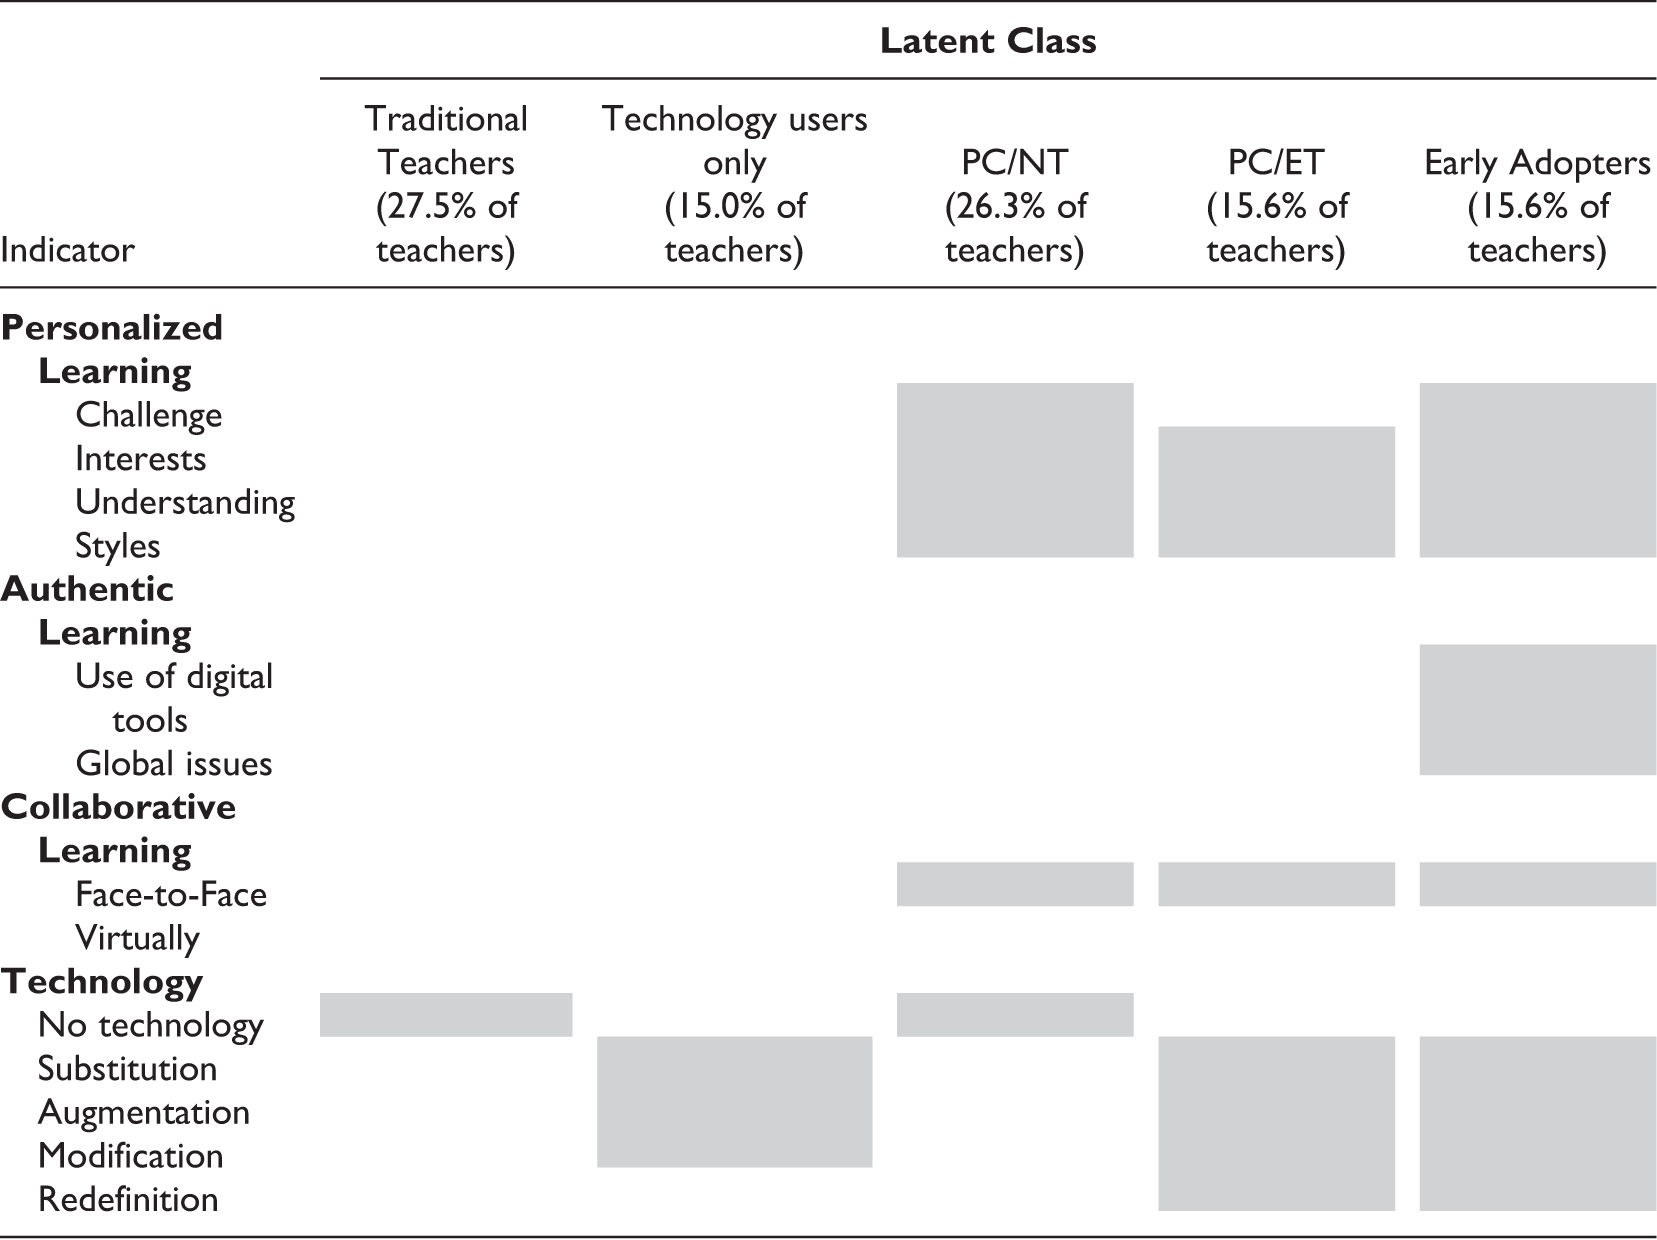
Visual representation of latent classes where shaded boxes indicate a relatively high chance of endorsing the item. Note. PC/NT = personalized collaborative/no technology; PC/ET = personalized collaborative/emerging technology.
The five latent classes were qualitatively distinct in their use of personalized, authentic, collaborative, and technology-integrated learning. Subgroup 1 (labeled the “Traditional Teachers”) comprised roughly 27.5% of all teachers. In this subgroup, teachers were unlikely to utilize personalized, authentic, or collaborative learning and were the most likely of all the latent classes to use no technology for instruction. Conversely, Subgroup 5 (labeled the “Early Adopters”), 15.6% of teachers, was most likely to use PAC learning in their classroom and reported a high likelihood of integrating technology. The remaining three subgroups displayed different patterns of program adoption that can be described as falling “in between” the Traditional Teachers and Early Adopters. Subgroup 2 (labeled the “Technology Users Only”; approximately 15% of teachers) was unlikely to use personalized, authentic, or collaborative learning in the classroom but was likely to integrate technology into lesson design. Subgroup 3 (labeled the “personalized and collaborative, no technology” group [PC/NT]; approximately 26.3% of teachers) and Subgroup 4 (labeled the “personalized, collaborative, and emerging technology” group [PC/ET]; approximately 15.6% of teachers) were both likely to incorporate personalized and collaborative learning into lesson design. These two subgroups differed in that the PC/NT group was unlikely to use technology, whereas the PC/ET group was likely to integrate some technology.
Predictors of Latent Classes (Subgroup Membership)
In the second stage of analysis, we aimed to differentiate the five latent classes based on a set of observed baseline covariates. We were especially interested in whether the provision of PD and access to personalized computing devices differentiated subgroups. The purpose was to evaluate whether school support was effective for helping teachers adopt the new program. Results of the omnibus test for differences in covariates across latent classes are shown in Table 5. Latent classes were differentiated by both PD quality and the provision of technology and also differed in level of instruction and proportion of teachers who taught special education. To better understand the nature of these differences, pairwise post hoc comparisons were conducted. Results for pairwise contrasts appear in Table 6.
Results of the Omnibus Test of Any Differences Between Latent Classes on Observed Covariates.
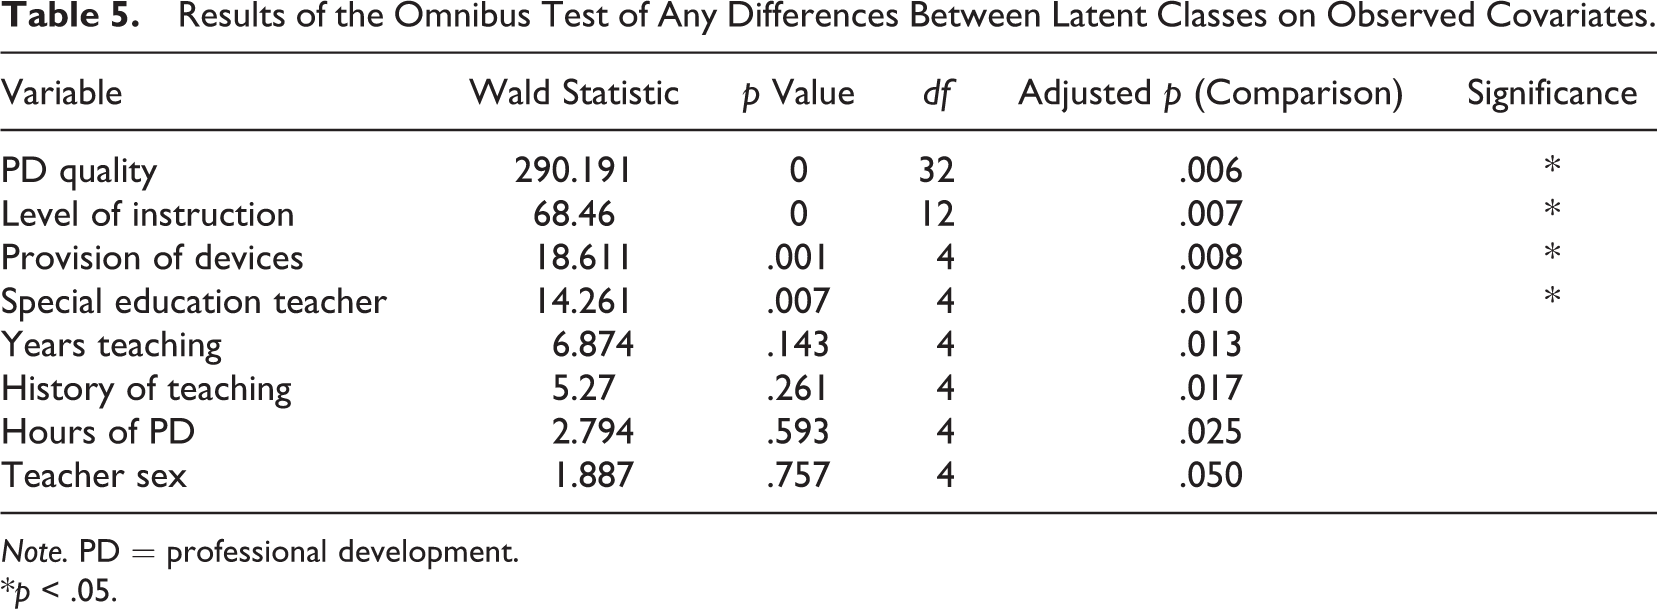
Note. PD = professional development.
*p < .05.
Pairwise Contrasts (Wald) of Predictors of Latent Class.
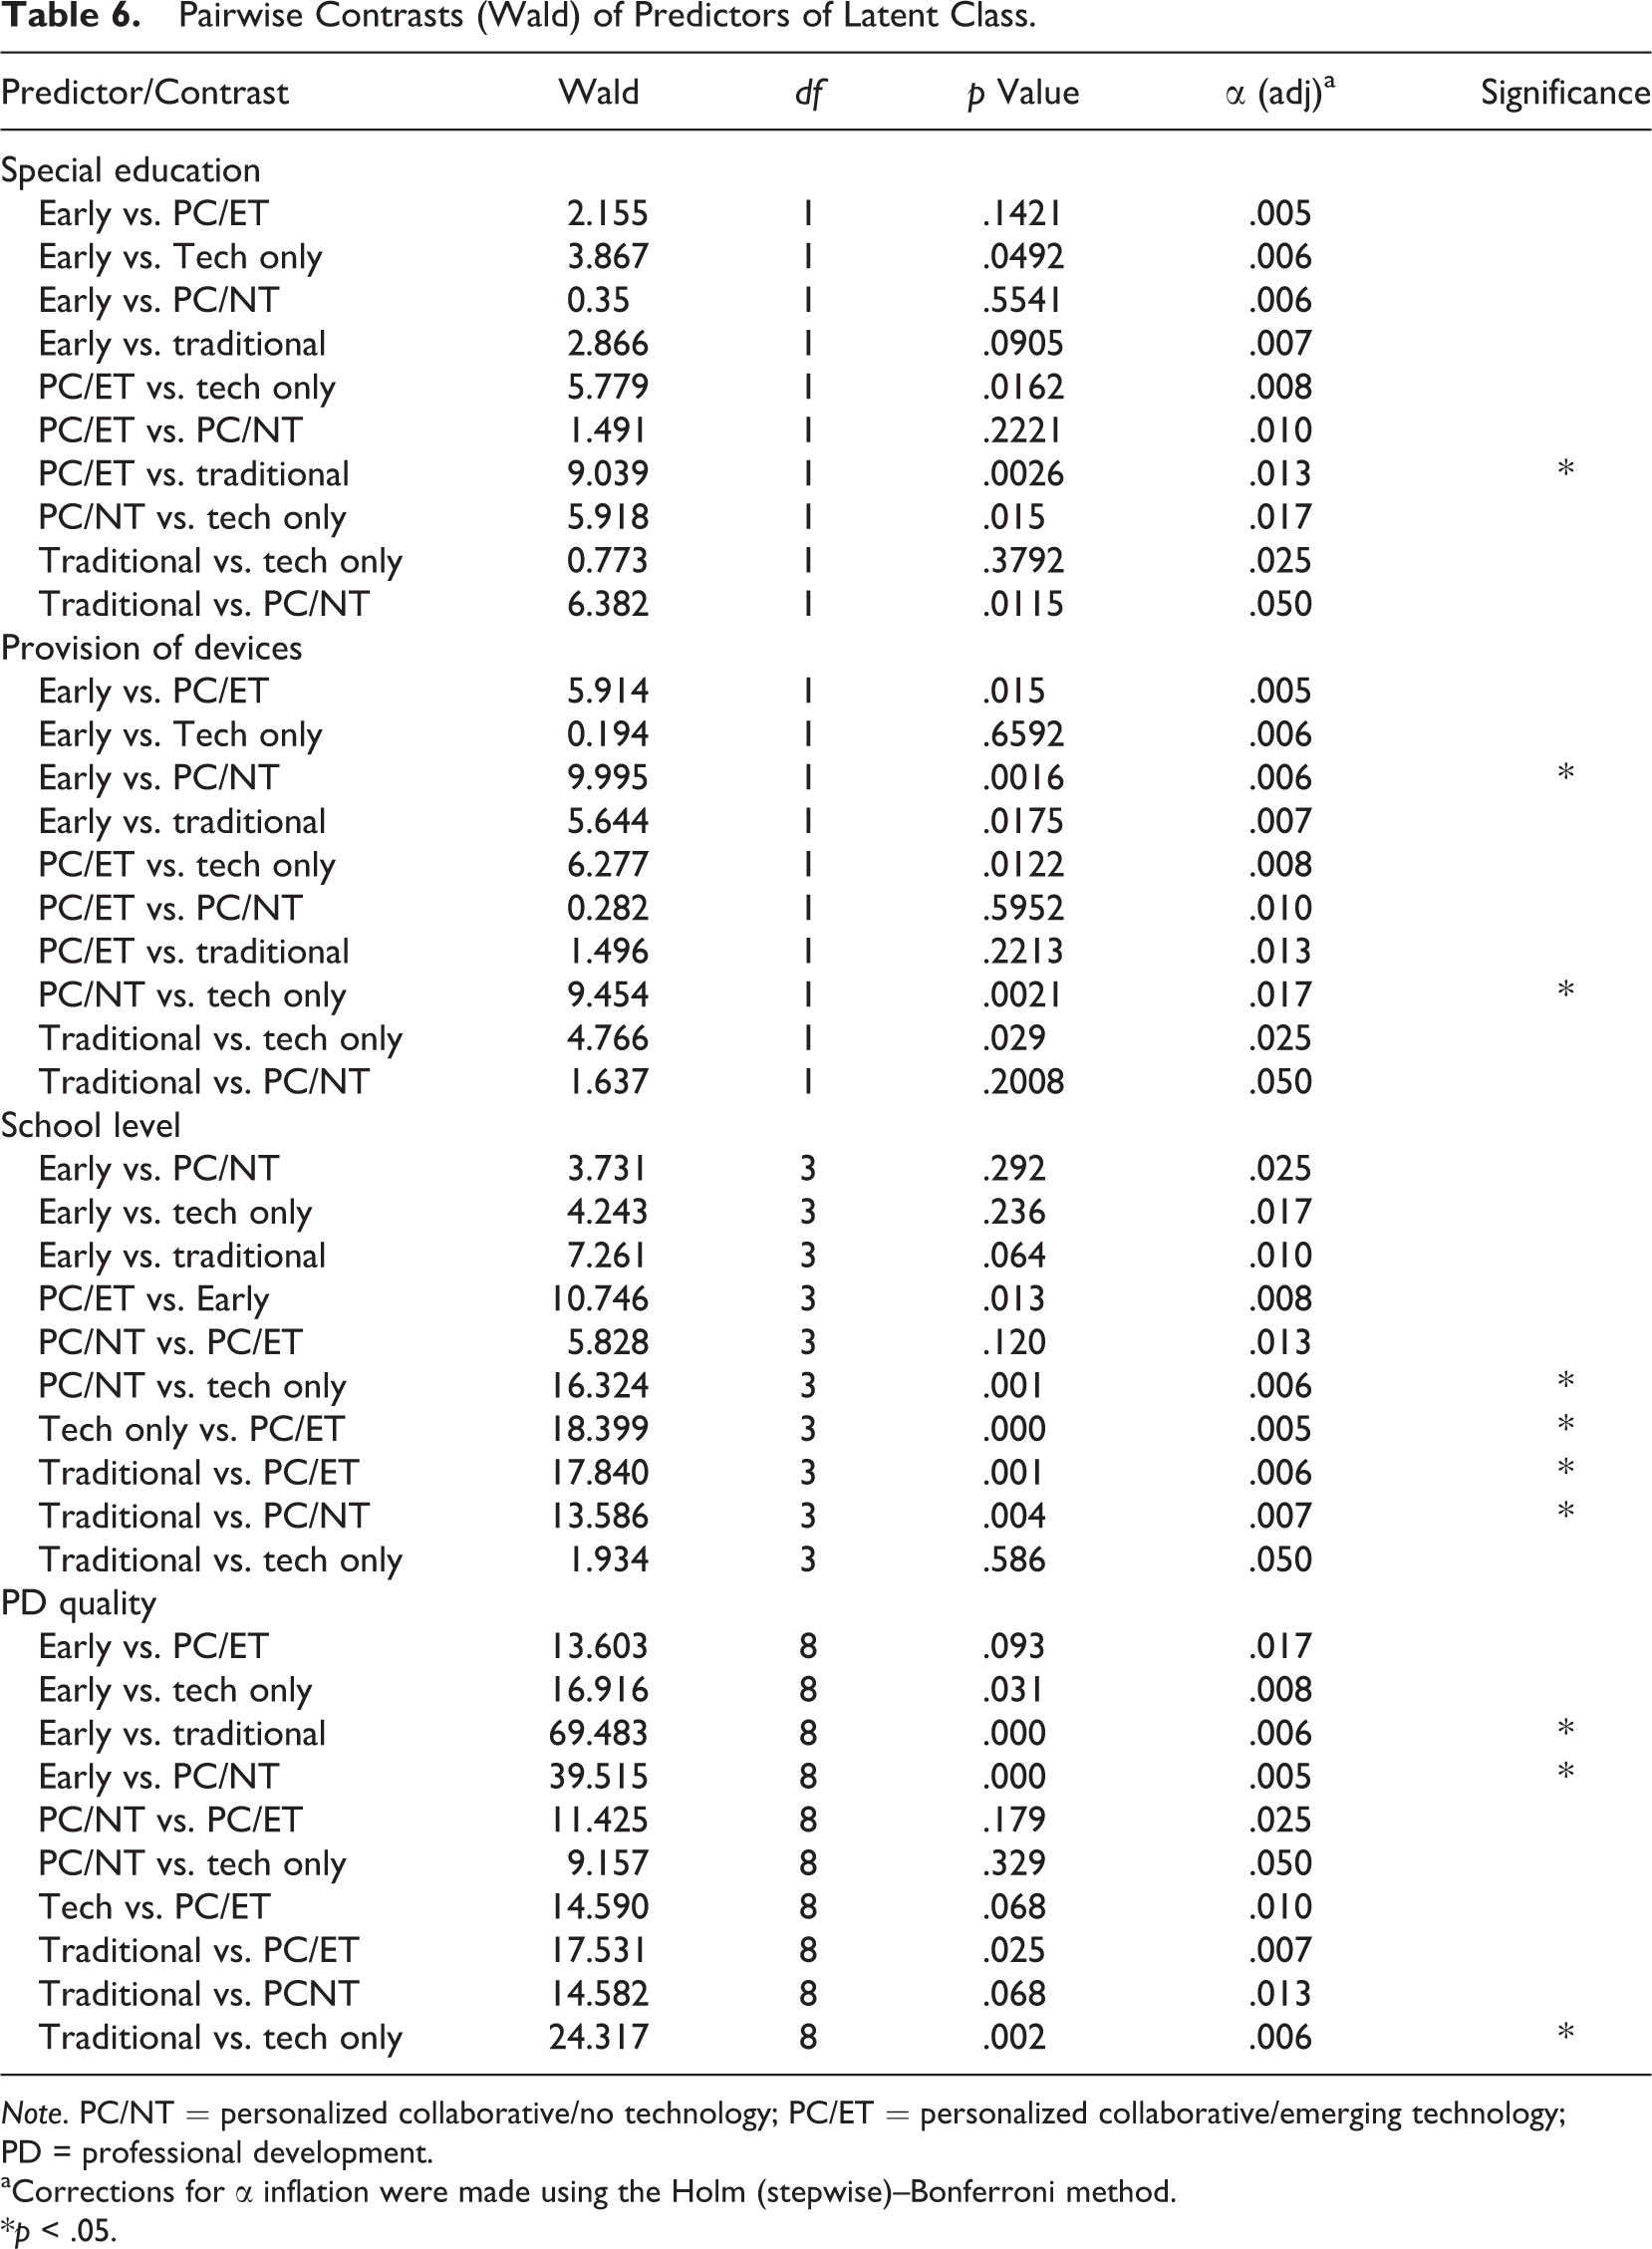
Note. PC/NT = personalized collaborative/no technology; PC/ET = personalized collaborative/emerging technology; PD = professional development.
aCorrections for α inflation were made using the Holm (stepwise)–Bonferroni method.
*p < .05.
Teacher demographics (covariates)
Special education teachers and intervention specialists were more than 4 times as likely as regular education teachers to be in the PC/ET subgroup than the traditional teaching subgroup (OR = 4.22, 95% CI [1.65, 10.80]). This suggests that special education/intervention teachers tended to differentiate instruction and provide more collaborative and technology-based learning experiences than regular education. Differences were also observed across school level (see Table 6). For clarity on these results, we calculated each teacher’s most likely class membership (based on posterior probabilities) and then compared the distribution of school level within latent class. The distribution of school level across latent class is presented in Table 7, which shows that 44% of Traditional Teachers taught elementary, 22% taught middle school, 31% taught high school, and 3% taught in centers or alternative settings. There was not sufficient evidence to conclude that years teaching, history of technology use, or teacher sex differentiated among teaching subgroups.
Distribution of School Level Within Latent Classes Based on Most Likely Class Membership (Posterior Probabilities).
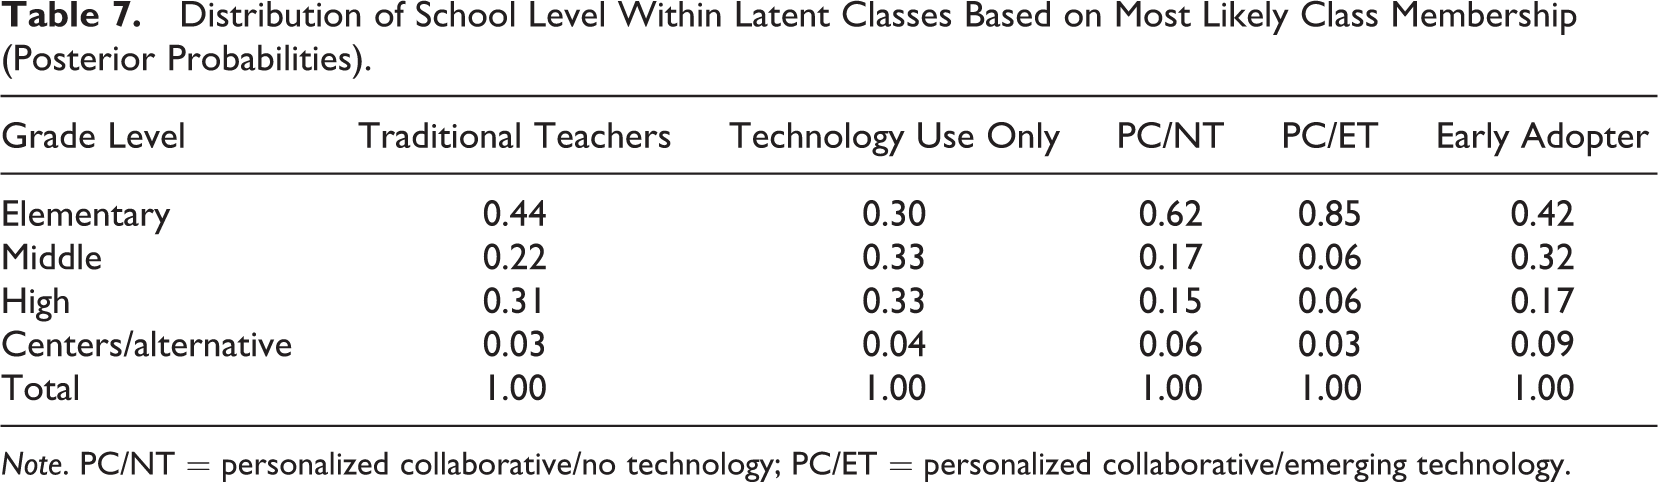
Note. PC/NT = personalized collaborative/no technology; PC/ET = personalized collaborative/emerging technology.
Provision of devices
The provision of personalized computing devices in the classroom increased the odds of being the early adopter subgroup (OR = 3.05, 95% CI [1.53, 6.07]) and technology only subgroup (OR = 2.55, 95% CI [1.40, 4.64]) over the PC/NT subgroup. This shows that accessibility to personalized technology supported technology integration in the classroom.
PD
Results show that PD quality differentiates between latent classes of program adoption. Teachers who reported higher quality PD were more likely to be in the early adopter group than the PC/NT subgroup or the traditional teaching subgroup. We then explored which aspects of PD quality mattered the most. Results showed that the frequency of collaboration among colleagues and frequency of in-class coaching increased the odds of being in the early adopter subgroup over the PC/NT subgroup (collaboration OR = 1.54, 95% CI [1.11, 2.14]; coaching OR = 1.43, 95% CI [1.07, 1.91]). Moreover, the frequency of collaboration with colleagues, frequency of in-class coaching, and teacher’s confidence in being able to transfer knowledge from PD sessions to the classroom increased odds of being in the early adopter subgroup over the traditional teaching subgroup (collaboration OR = 2.33, 95% CI [1.76, 3.10]; coaching OR = 1.55, 95% CI [1.19, 2.03]; transfer OR = 1.60, 95% CI [1.01, 2.55]). Frequency of collaboration with colleagues additionally increased the odds of being in the technology only subgroup versus the traditional teaching subgroup (OR = 1.74, 95% CI [1.32, 2.28]). No differences were observed for the quantity of PD.
Discussion
Process evaluations are increasingly recognized as a critical component to a program evaluation, providing information about the process of implementation and suggest strategies for success (Oakley, Strange, Bonell, Allen, & Stephenson, 2006; Rossi et al., 2004). Although a primary focus of the process evaluation should be on variability of implementation and program adoption (Lamont et al., 2013; Oakley et al., 2006), traditional approaches to process evaluations rely on aggregated assessments of implementation such as mean fidelity ratings. While these approaches are useful for understanding how particular components are being implemented on average, they are limited in their ability to describe the different ways in which the program is implemented as a whole and are therefore inconsistent with leading theories and empirical evidence suggesting variability in implementation (Berkel et al., 2011; Hall & Hord, 2014; Hill & Owens, 2013). The purpose of the current study was to illustrate how a statistical technique—LCA—can be used as part of a process evaluation to deepen our understanding of the different ways in which programs are adopted.
We applied an LCA to the evaluation of a multicomponent educational technology initiative. There is theoretical reason to expect that teachers adopt change in different ways (Hall & Hord, 2014). When new programs have multiple components, implementers may adopt these different components in different ways due to different levels of readiness (Scaccia et al., 2015) or stages of concern (Hall & Hord, 2014). In this study, we showed how LCA can be used to evaluate the process of implementation and determine factors that influence the different stages of implementation. Results of our LCA showed that there were five distinct subgroups (or latent classes) of teachers, based on their self-reported pedagogical behavior. The five groups differed in their Level of Use or adoption of different program components. Approximately 15.6% of all teachers were characterized by high levels of technology integration and use of PAC learning in the classroom. These teachers were named the “Early Adopters” because of their relative speed of adopting the innovative teaching style. Using a more traditional approach, one would conclude that this was the group that was showing fidelity to the model. On the other end of the spectrum were the “Traditional Teachers” (27.5% of teachers), who were unlikely to implement core components of 1TWO1 in the classroom and preferred to teach without technology. Using a more traditional approach, one would conclude these teachers were not showing fidelity. Interestingly, our LCA showed that in between these two subgroups were three additional subgroups, each marked by a step in the progression toward complete program adoption. One group (15% of teachers) used technology, but no personalized, authentic, or collaborative learning in their classroom; another used personalized and authentic learning, but no technology (26.3%); and the last used personalized and authentic learning and showed early stages of technology integration (15.6%). These subgroups are very similar to data obtained by technology integration experts via observations, teacher interviews, and focus groups and were verified content experts and district personnel.
The use of LCA as part of our process evaluation provided a meaningful and nuanced assessment of program adoption. Consistent with Rogers’s (2003) theory, we provide evidence that program adoption occurs on a continuum and that fidelity is not a unidimensional construct (Berkel et al., 2011; Hill & Owens, 2013). We examined teachers’ simultaneous adoption of multiple programmatic components and revealed that teachers with strong skills in one domain (e.g., personalized learning) were not necessarily skilled in other domains (e.g., technology integration). Examining fidelity to each component separately may have misconstrued these nuances. For example, we may have “missed” the three subgroups between Early Adopters and Traditional Teachers. Alternatively, we may have seen very little change overall, despite a sizable group of teachers that were using all program components (Early Adopters).
A particularly important contribution of LCA to our process evaluation was our ability to assess how different support activities help teachers progress along the adoption continuum. Results indicated that PD and the provision of devices facilitated program adoption, which validated the district’s investment of taxpayer dollars into the program. Further, our results showed that a highly effective aspect of PD was time for collaboration. The effectiveness of PD in general and collaboration in particular is consistent with a growing body of literature on PD and organizational readiness (Borko, 2004; Darling-Hammond & McLaughlin, 2011; Mouza, 2002; Scaccia et al., 2015). Consistent with best practices for PD (Darling-Hammond & McLaughlin, 2011), our data suggest that collaboration makes a difference in teachers’ perceptions about how well they transfer their skills into the classroom. The district utilized these data to make implementation decisions, for example, by giving teachers devices in the summer months to practice. Similarly, our identification of the Early Adopter group led to improved support. According to Rogers (2003), Early Adopters tend to be trendsetters and leaders in the group with a high degree of social influence. Identification of a group of Early Adopters facilitated the diffusion of 1TWO1 by helping to problem-solve barriers to implementation and provide evidence of success, a critical part of organizational readiness (Scaccia et al., 2015) for the district.
From a more technical standpoint, our use of LCA was advantageous over other related methods, such as cluster analysis, in that it utilizes a latent variable framework. In our approach, teachers were not formally assigned to a subgroup. Rather, the probability of membership in each subgroup was estimated based on the pattern of responses to observed items, reducing error associated with misclassification of latent class (Collins & Lanza, 2010). While this probabilistic nature of LCA is a methodological strength, subgroup assignment based on item response probabilities prevents “hard assignment” into subgroups (Hagenaars & McCutcheon, 2009). From an evaluation standpoint, this may be undesirable. There may be a tendency for evaluators to want to know the exact teachers that belong to a subgroup as part of a formative evaluation. In an LCA, the probability that a teacher belongs to a particular subgroup can be determined, for example, a given teacher may have an 80% probability of belonging to Class 1, 6% probability of belonging to Class 2, and so forth. However, actual subgroup membership is not known for certain (Hagenaars & McCutcheon, 2009). While this is a limitation, the value of the LCA is in identifying (a) different kinds of initiative adoption and (b) the predictors of adoption. Knowledge of the exact classification of an individual does not take away from this contribution; in fact, rarely is hard assignment determined in any method.
This study has certain limitations. First, the sample came from a high-capacity school district with a history of investment in technology. The purpose was to provide the district with process evaluation data, not necessarily to draw generalizable conclusions about teacher adoption that spans across contexts. The extent to which the subgroups defined in this article translate to other school districts without this commitment to technology remains an empirical question. Second, the subgroups in this article were defined by a set of observed items that tapped into the core components of the technology integration initiative—that is, personalized, authentic, collaborative, and technology integration. These items were created specifically for the needs of the district. Inclusion of different pedagogical strategies might have produced different subgroups of teachers. We are hesitant about drawing conclusions about teaching subtypes overall; rather, we are illustrating a method for understanding program adoption in a specific context. Third, all data came from self-reported teacher data. In the full evaluation, we used multiple methods for data collection. Convergence across sources increased our confidence in teacher reports, but ultimately, the accuracy of teacher-reported behavior in the classroom remains unknown since the survey was anonymous.
Similarly, we used single, binary variables as indicators of the latent variable. There are two limitations associated with this approach. First, the dichotomization of items is often considered less desirable than continuous due to the loss of information. In this study, we opted to dichotomize for the ease of interpretation, which is consistent with classic latent class clustering algorithm and modern applications of LCA (Collins & Lanza, 2010; Lamont et al., 2014; Lazarsfeld & Henry, 1968). While extensions to LCA to polytomous data have been developed (Goodman, 1974), it becomes unwieldy to interpret latent classes with multiple levels of the indicator variables, potentially resulting in latent classes without meaningful class separation. Additionally, the power of these models with polytomous data is empirically unknown (Dziak, Lanza, & Tan, 2014), and the LCA model with binary indicators has been shown to outperform clustering algorithms for polytomous data in education data (Xu, 2011). From a theoretical level, we also felt justified in our decision to dichotomize. Our indicators tapped into fidelity of multiple components of the intervention, where fidelity was defined as regularly using the intervention as deemed appropriate to the learning objective. There was little meaningful difference in this case between a teacher who used strategies, for example, 75% of time versus 90% of time, since both qualified as regular use. Future studies should consider power considerations and continue to provide guidance on when a dichotomous versus a polytomous approach is optimal. Second, indicators were single items that tapped into a particular teaching behavior. The use of single-item indicators is common in latent variable modeling since the latent variable represents the commonalities associated with all the single-item indicators (Collins & Lanza, 2010). In our case, we used a set of single items that tap into multiple program components. The extent to which these single items accurately capture the different aspects of fidelity (Berkel et al., 2011) is unknown and a limitation of the current study.
In brief, process evaluations are increasingly used as part of a high-quality evaluation. Traditional methods of process evaluation that focus only on fidelity ratings may be ill-suited for answering important evaluation questions, especially when the goal is to understand variability in the implementation process. There is a need for more rigor in evaluation methods. In this article, we present one option, LCA, to deepen the evaluator’s understanding of variability in the implementation process. Using LCA as part of a comprehensive process evaluation can provide more nuanced information about program adoption, rather than relying on averages. Evaluators should be thinking broadly about the evaluation questions and match statistical methods to the questions they are trying to answer. Use of methods, such as LCA, can help highlight differences in implementation and help guide stakeholders to provide targeted supports that can substantially improve the quality and rate of adoption of new innovations.
Footnotes
Declaration of Conflicting Interests
The author(s) declared no potential conflict of interest with respect to the research, authorship, and/or publication of this article.
Funding
The author(s) received no financial support for the research, authorship, and/or publication of this article.