
Abstract
This brief report describes the conception, development, and use of a rubric in evaluating the feasibility of a new program. The evaluators searched for a meta-analytic tool to help organize ideas about what data to collect, and why, in order to create a detailed story of feasibility of implementation for the client. The main advantage of using the rubric-based tool is that it lays out key evaluative criteria that are defined as concretely as possible. The article gives a brief overview of the literature on the use of rubrics in evaluation, illustrates the use of a feasibility of implementation rubric as a tool for development, analysis, and reporting, and concludes with recommendations emergent from the use of the rubric.
“I just want to know if it works!” she wailed. “I can tell you that,” I replied. “But first you have to tell me what ‘it works’ means. And to get there, we need to be really clear on what the ‘it’ is.”
This note documents how the authors developed this tool, what we learned from its revision and use, and how our experience and the rubric-based tool may be useful to other evaluators and researchers. Certainly, any strong evaluation gets at similar information. This note is about a key piece of methodology for evaluation colleagues. Rubrics allow evaluation “to surface and deal with values in a more transparent way…when evaluators and evaluation stakeholders get clearer about values, evaluative judgments become more credible and warrantable” (King, McKegg, Oakden, & Wehipeihana, 2013, p. 11).
Evaluation is aimed at assessing what people know and do in a particular context. Meta-evaluation is about what evaluators themselves know and do. The evaluation context for the rubric-based tool presented here was the implementation of a new curriculum. The meta-evaluative aim was assessing what the authors knew and did in using the tool for evaluating the feasibility of the curricular implementation. Like an evaluation checklist, the tool documented details of “practitioner experience, theory, principles, and research to support evaluators in their work” (The Evaluation Center, 2019). In addition, the rubric-based tool was a touchstone throughout client communication and a framework for the final reporting on the evaluation itself.
Checklists and Rubrics
Checklists are valuable evaluative tools. For example, the Checklist of Steps and Standards for the Framework for Program Evaluation in Public Health (MacDonald, 2013) lists six verb-based steps—engage, describe, focus, gather, justify, ensure—that are about tasks evaluators do. By contrast, the goal of a rubric approach is noun-based—about what evaluators seek to know in/for/through those tasks. With appropriate modifications for a shift to examining feasibility of a program in a public health context, the 18 feasibility factors behind the rubric presented would provide structure and documentation for the steps in MacDonald’s checklist.
In parallel to checklists, evaluators have been making the “valu” part of “evaluation” explicit through rubrics for many years (Davidson, 2005). In fact, in some countries, the stakeholder-centered “rubric revolution” has led to a fundamental national change in how evaluators work with clients (Davidson, Wehipeihana, & McKegg, 2011; King et al., 2013). That change has been underway in the United States, too, though documentation in professional outlets for the U.S. evaluation community is sparse (see, e.g., Martens’s, 2018, review of the literature on rubric use in program evaluation, which found the largest number in American Journal of Evaluation: 10 articles in the last 25 years). This brief report adds to that documentation by providing connections to the literature and an illustration.
Empirical research has demonstrated the positive impact on program outcomes of engaging in meta-evaluative efforts with stakeholders to develop detailed descriptions of what is valued in a program’s content and processes (i.e., evaluation capacity building; Clinton, 2014). The degree to which such meta-level work with stakeholders informs and drives cycles of feedback depends on the nature of the relationships within and across client and evaluation groups, ranging along a continuum from cooperation (sharing information to meet separate goals) through coordination (of common activities) to collaboration (for collective purpose) and, for highly integrative strategic alliances, coadunation (by collective action; Gajda, 2004).
The work reported here was situated in what was initially a coordination relationship between evaluators and two stakeholder groups: client staff and program participants. The subsequent development of the rubric supported some more collaborative interaction in these relationships. Central in the authors’ decision to use a rubric was our prior experience with the dearth of shared meaning among clients and program participants. The absence of mutual understanding in generating data threatens the validity of conclusions drawn from that data. For example, an item on a survey might read: “This project has a high level of stakeholder involvement (strongly agree—agree—disagree—strongly disagree).” A response is based on the understanding brought by the respondent to “stakeholder involvement.” Does it mean receiving a project overview? Attending a briefing by those with a vested interest? Does it mean being involved with a representative advisory group that meets regularly with project personnel? Or something else? Different levels of stakeholder involvement exist, so a person who has been to a luncheon who is thinking of “stakeholder luncheon” as an example of noninvolvement might respond “disagree” while another person thinking it is just the kind of involvement promised is likely to respond with “agree.” What has to happen to have similar understanding of what constitutes stakeholder involvement? Somehow the degrees of involvement have to be defined, and one way to make that happen is by creating, refining, and applying a rubric.
Nature of a Rubric
A rubric is a scoring tool that specifies performance expectations and describes how a score is assigned for each of several criteria. It typically has descriptions of performance at three or more clearly delineated levels. In the past, rubrics have been used primarily in classroom settings by instructors describing levels of performance necessary for certain grades. Consider this definition: “A rubric is a coherent set of criteria for students’ work that includes descriptions of levels of performance quality on the criteria” (Brookhart, 2013). Here, the target audience (students) is built into the definition. Despite its use in the classroom, nothing predisposes the rubric from being adapted for use in other contexts (e.g., in organizations or programs; Martens, 2018). The main advantage of using a rubric is that key evaluative criteria are defined as concretely as possible. Developing those descriptions is an opportunity to bring shared meaning to communicating about central ideas (King et al., 2013).
Consider the rewrite in Table 1—in rubric form—of the hypothetical item on stakeholder involvement. The criterion (dimension) of interest is “Commitment” with standards of “High, Moderate, Low” levels of quality and, within the cells of the table, descriptions of each level of commitment.
Example Rubric of Performance Descriptions of Stakeholder Involvement.

Notice how the entries explicitly describe scope and behavioral expectations, helping users of the rubric to understand and compare the different levels. A rubric is especially appropriate for curricular implementation because such implementation is a recursive rather than an instantaneous process (Fixsen, Naoom, Blase, & Wallace, 2007). Rubrics clarify the characteristics of whatever is being assessed, whenever it is assessed.
Development of a Feasibility of Implementation Rubric
The client’s pilot curricular program, Quelina (a pseudonym) was being implemented in two schools in Grades 1 and 2. Over the course of 1 year, 16 teachers were to use the new materials and instructional guidelines. The client wanted evaluators to monitor the implementation with a focus on what changes in program content and processes might be needed prior to extending the curricular and pedagogical approach to Grades 3 and 4. The driving question was about the feasibility of implementing the program of classroom and teacher materials.
Here, feasibility refers to the likelihood that a project, program, or intervention can be successfully implemented in a school or other institution. Many new efforts fail at an early stage because their sponsoring organizations either cannot or choose not to provide the structure, commitment, and resources necessary to ensure feasibility of implementation (Desimone, Porter, Birman, Garet, & Suk Yoon, 2002). The program may be well designed and have demonstrated some positive results. However, if a school, hospital, or social service agency does not provide essential components of support appropriate to a given implementation, intended implementation may be hampered from the very beginning, and the program will not achieve desired results.
Our evaluation approach was based on guidelines for assessing feasibility developed at WestEd over the last few years (Kaser & Hauk, 2014). It includes attention to 18 factors known to be associated with successful program implementation (Boesdorfer, Kaser, Horsley, & Loucks-Horsley, 1998; The Bridgespan Group, 2014; Century, Cassata, Rudnick, & Freeman, 2012; Fixsen et al., 2007; Owings & Kaplan, 2003; Terry, 1993). These factors are organized into four components as follows: technical, organizational, support, and usability. Through conversations with the client’s curriculum developer and program staff, the evaluation team agreed on descriptions and driving questions for the 18 factors, identifying details most applicable to the client’s program (see Table 2 for a summary). Here the evaluation team includes the authors and the client staff with whom they worked to refine the factor descriptions.
Components and Associated Factors Affecting Feasibility.
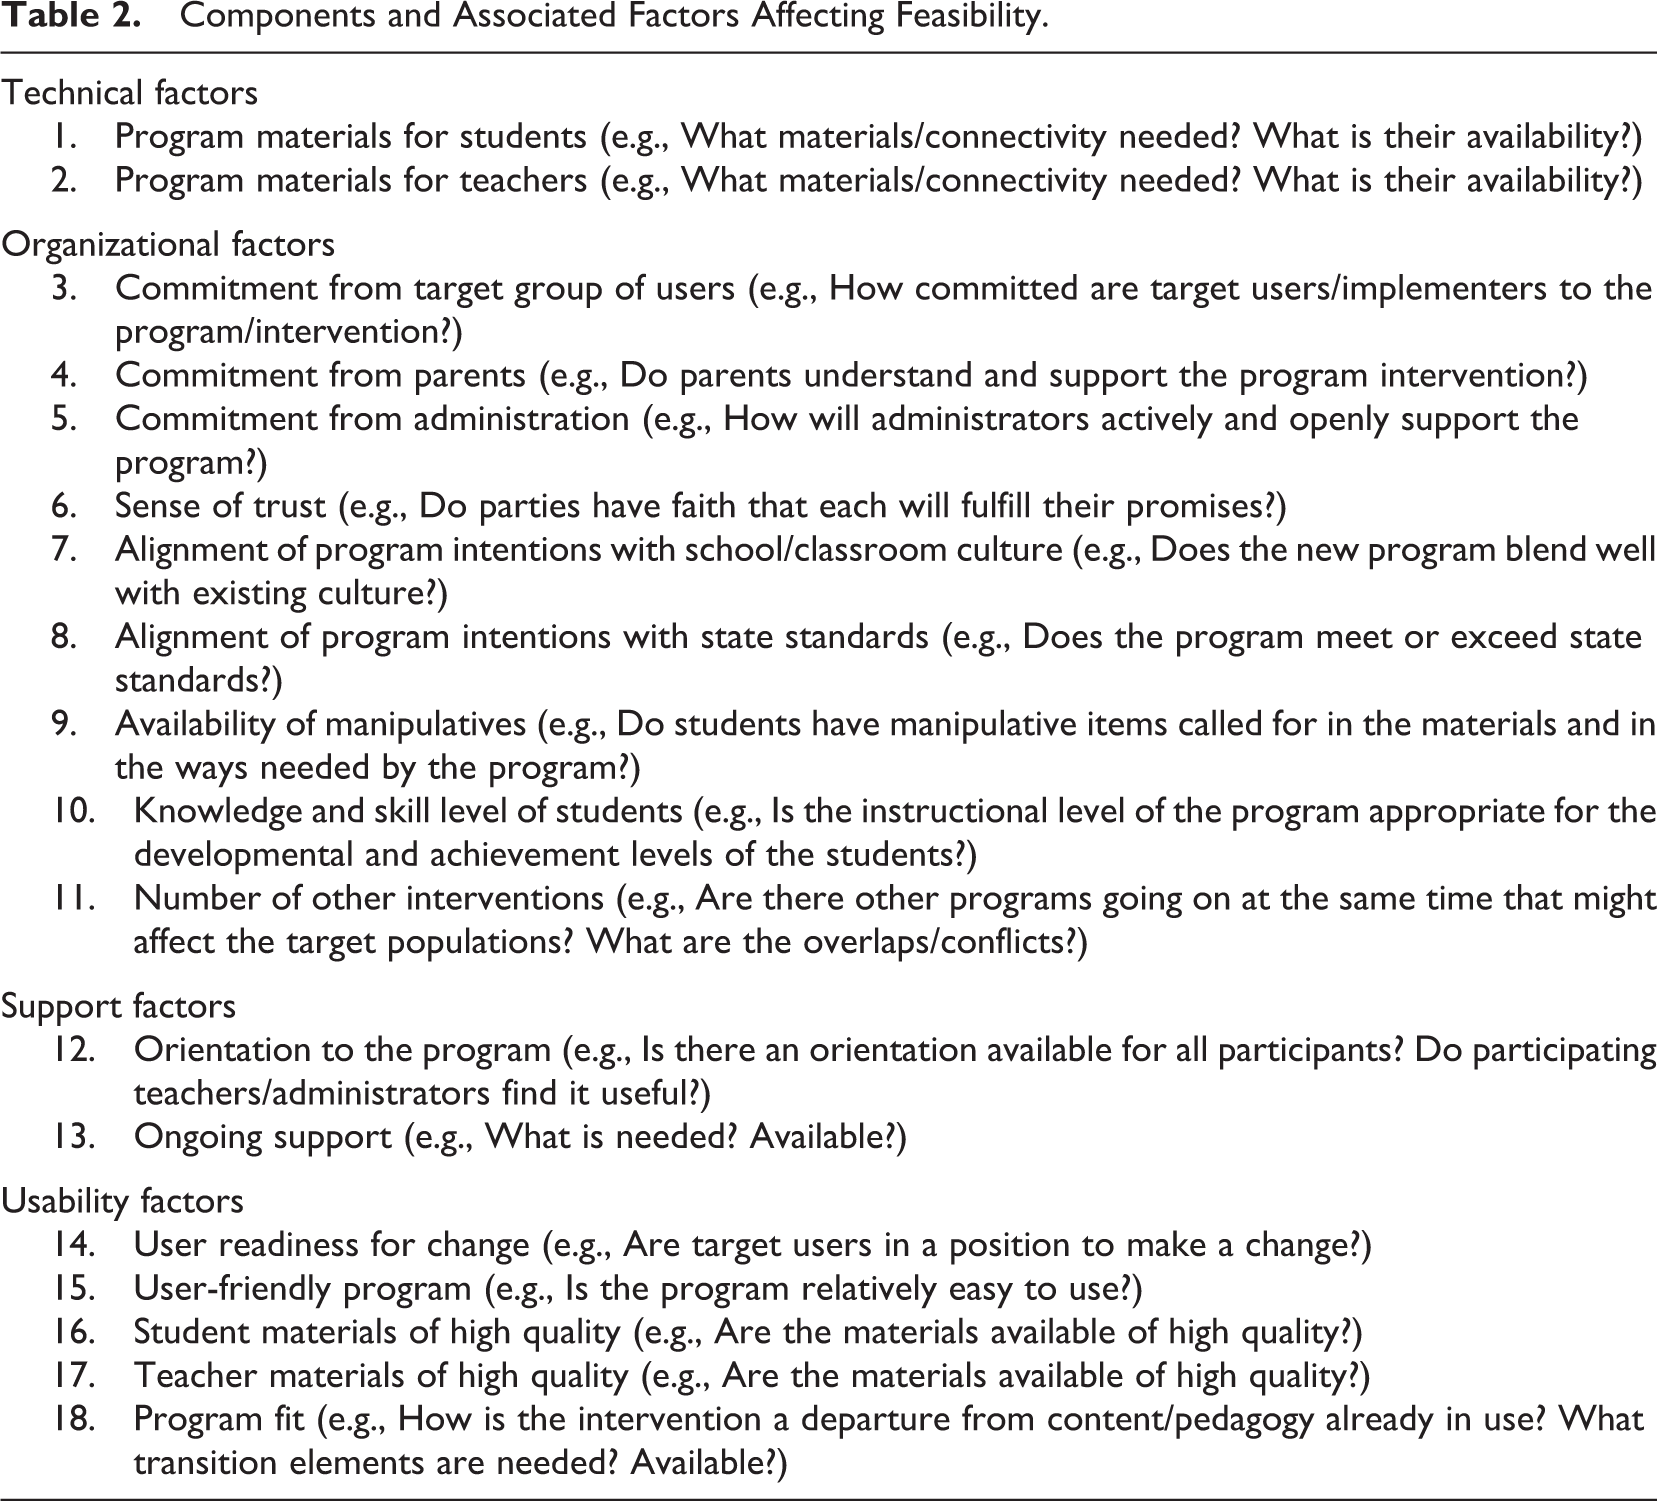
Since they originated from a broad framework for evaluation of feasibility, the 18 factors in Table 2 might be applicable to other school-based interventions and, with some editing, to interventions or programs that are not school-based. Our purpose here is to describe and illustrate with a particular case rather than to suggest these factors are always and exactly what might be needed.
Once content, form, and function had been decided, the evaluation team turned to writing descriptions for the 18 factors. In preparation, we reviewed program materials (e.g., student materials and teacher’s guide), interviewed key personnel from the schools, and interviewed the developer of the curriculum and of the teacher supports. As a general principle, the descriptors associated with low ratings were based on existing research about possible challenges to feasibility of implementation whereas high ratings suggested an aspect of feasibility that was well supported by the program. Later, evaluators, school personnel, and the developer reviewed drafts of the rubric descriptions and agreed on a final version to be used for monitoring the project. These steps were essential in the development process.
Table 3 is an example of rubric descriptions of the factors under the technical component for the Quelina project. The different levels of performance have a number assigned to them.
Quelina Project Rubric: Performance Description of Technical Component.
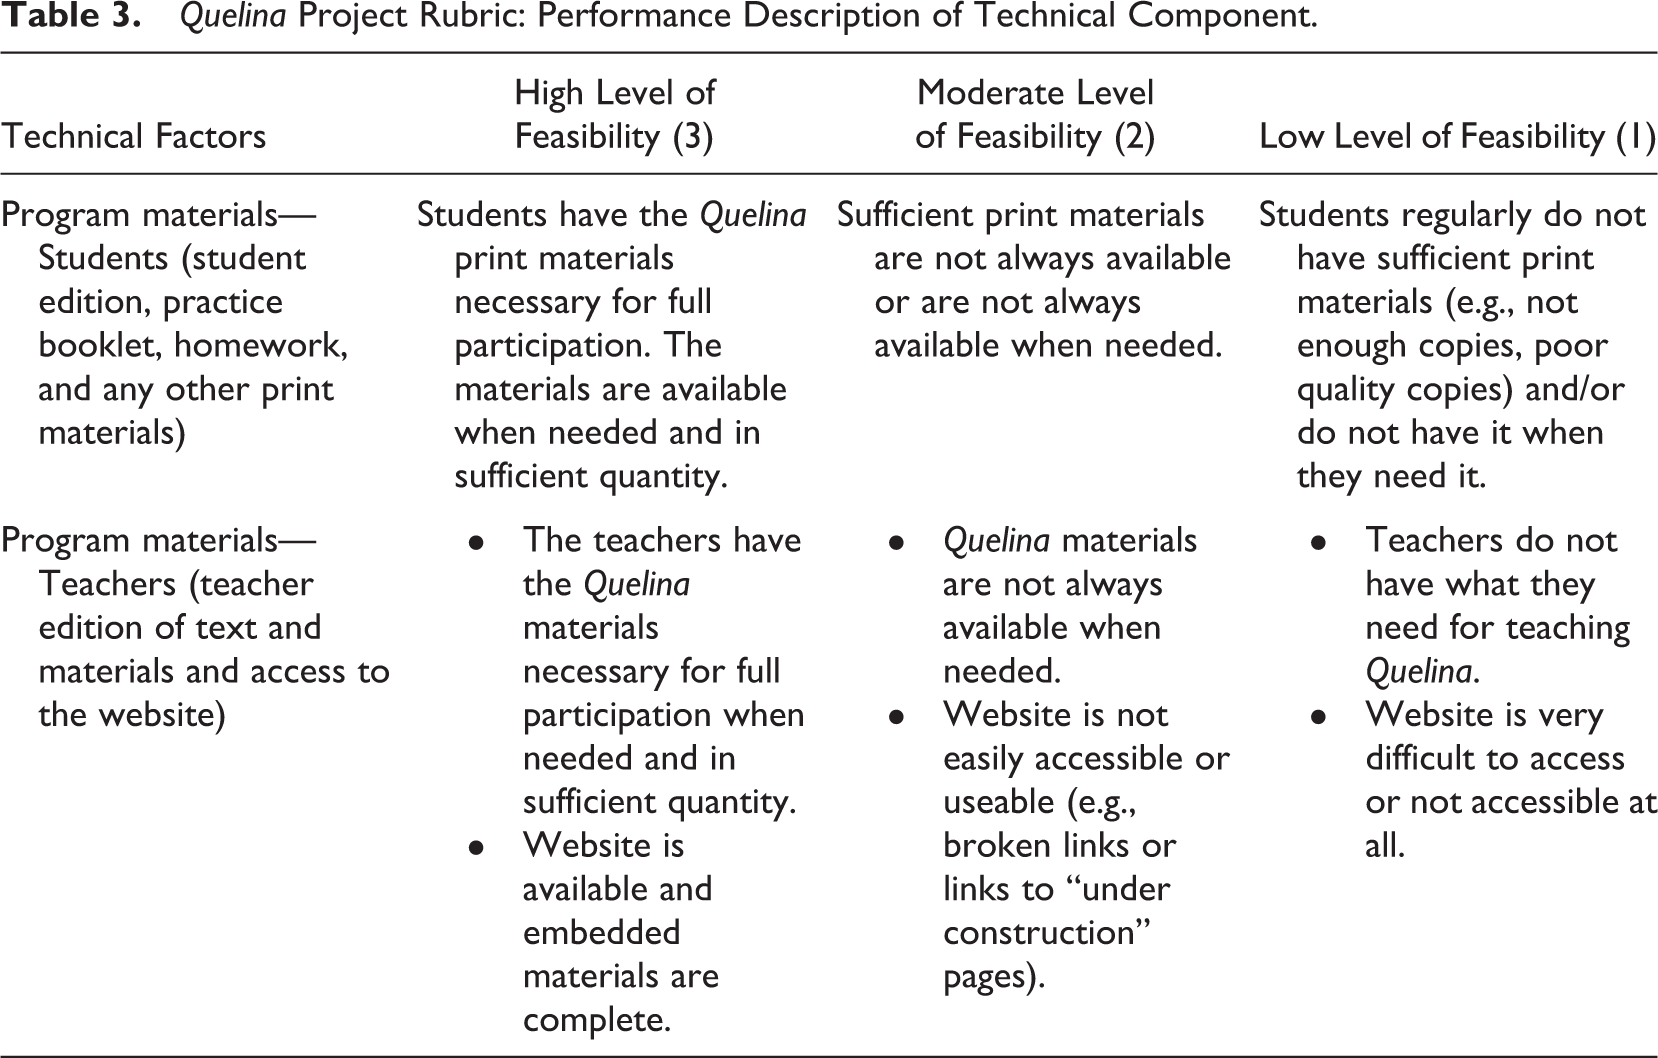
To be effective, a rubric has to have a range of quality indicators (e.g., 3 for high, 2 for moderate, 1 for low). These may be treated equally, or some factors may be weighted more than others. We chose to weight factors equally since there were no plans to collect data that would suggest different levels of value—at least not at the outset. The rubric provided structure for the monitoring task, used the client’s language along with any special vocabulary, helped in teaching the client about the evaluation process, and framed the results for reporting.
Rubric-Based Tool
The evaluative tool based on the rubric served as both the driver and the repository for data that allowed an assessment of each factor. One cannot arbitrarily assign a high, medium, or low rating. Ratings have to be backed up with data and with a justification for why those particular data are appropriate. So, for each factor, evaluators had to ask and answer two questions: (1) what data would provide evidence to distinguish one level from another in the factor and (2) how to obtain the data given the constraints, affordances, and conventions of the project? After creating the Quelina-specific descriptions for each factor, and for each level of feasibility within a factor, we examined possible data sources. Given time, costs, and stakeholder availability, possible data gathering tools were selected and confirmed with the client so that each would provide evidence the client saw as valuable. For Quelina, these were a survey of all 16 teachers using Quelina; interviews of school administrators, the curriculum developer, and other key personnel associated with the pilot of Grades 1 and 2 materials; and a review of associated documents (e.g., a letter to parents, a website for teachers).
The questions in surveys, interviews, and document reviews paralleled the rubric to make sure evaluators had data for every component and factor. For example, two questions from the teacher survey directly aligned with the descriptions in Table 3: “My students have all of the print materials they need for the Quelina Mathematics program,” and “I have all of the teacher materials that I need for the Quelina Mathematics program.” The response options were agree more than disagree and disagree more than agree with space available to comment or elaborate on the response. Other survey or interview items were more indirect, open-ended items where respondents were asked to describe, explain, or comment. Since the evaluators worked from an underpinning rubric, a strong alignment existed between the factors themselves and the data gathering instruments and activities. There were a few proxy questions (which queried a factor indirectly), but these were closely aligned with the factors. For example, a proxy question for the factor “sense of trust” was “What is your level of comfort with the new mathematics program?”
In developing the measures, evaluators consulted with clients and stakeholders to confirm face validity. Subsequent statistical analysis of response patterns on surveys, where viable, confirmed basic reliability (e.g., Cronbach’s α > .67 for each construct of interest). Finally, results were reviewed and affirmed by the client, school personnel, and the developer, all of whom saw the final report as being right on target.
The evaluation research version of the rubric had two more columns than the rubric shown in Table 3. Table 4 illustrates the expanded rubric-based tool used by the team. It includes a column identifying particular measures (and items) for each factor and a final column for documenting scores for each factor. Note that some factors had more than one data source (first factor in Table 4) and some had more than one aspect being measured (second factor in Table 4).
Rubric-Based Tool: Evaluator Extended Version of the Rubric.
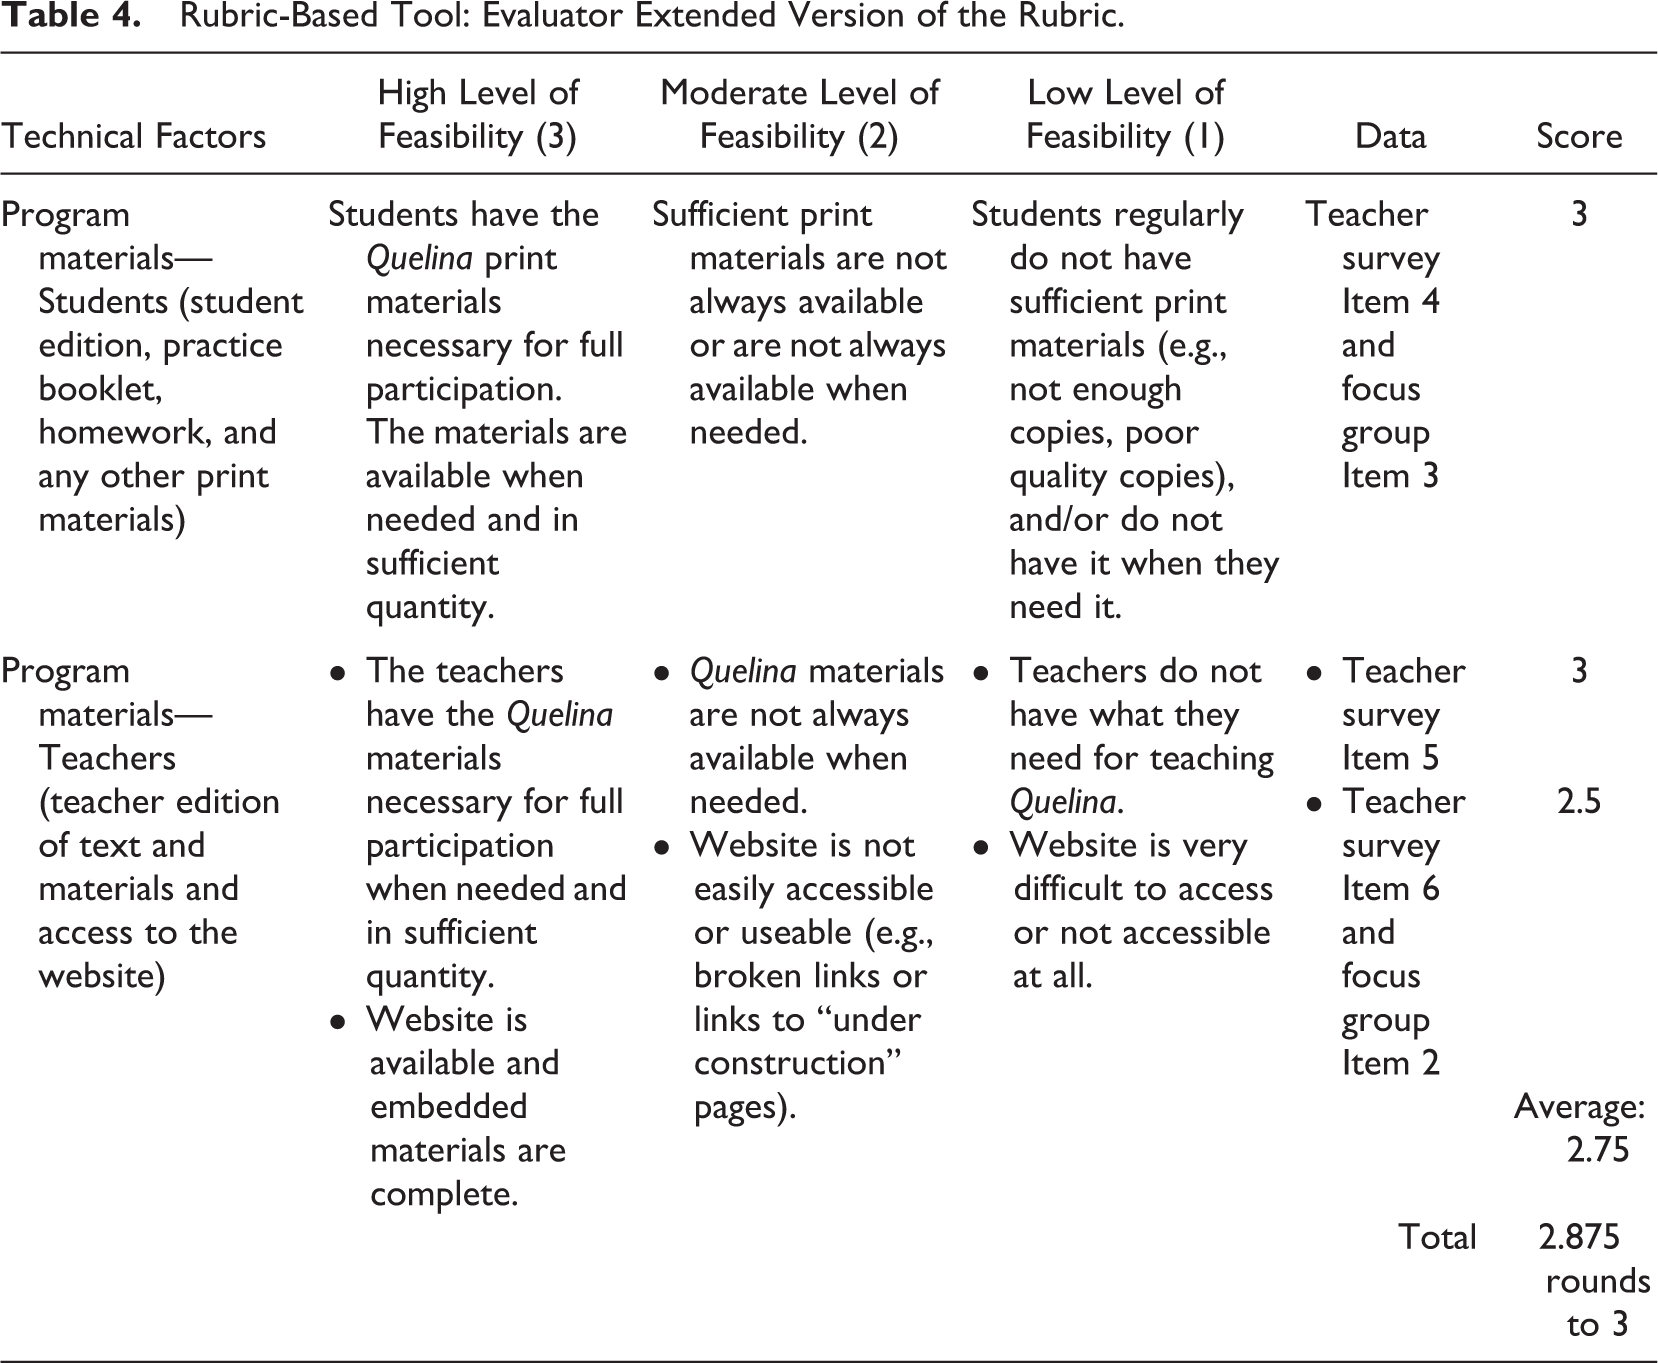
In some cases, generating the score in the final column involved substantive work. For example, thematic coding of open-ended survey responses or focus group interviews, subsequent analysis and consensus by the evaluation team, sharing of initial findings with the client, and (in a few cases) revision to descriptors and score based on clarifications provided by the client. In other cases, multiple data sources led to within-factor averaging. For example, in the second factor of Table 4, the rating of 2.5 arose from a 3 from the teacher survey and 2 from the focus group data. Based on the unweighted average across ratings arising from each available data source, evaluators assigned a number (1, 2, or 3) to each factor.
The final ratings for the individual factors in the Quelina evaluation rubric, as displayed in the final report to the client, are shown in Table 5.
Client-Facing Version of Rubric Report Table for Quelina Mathematics.
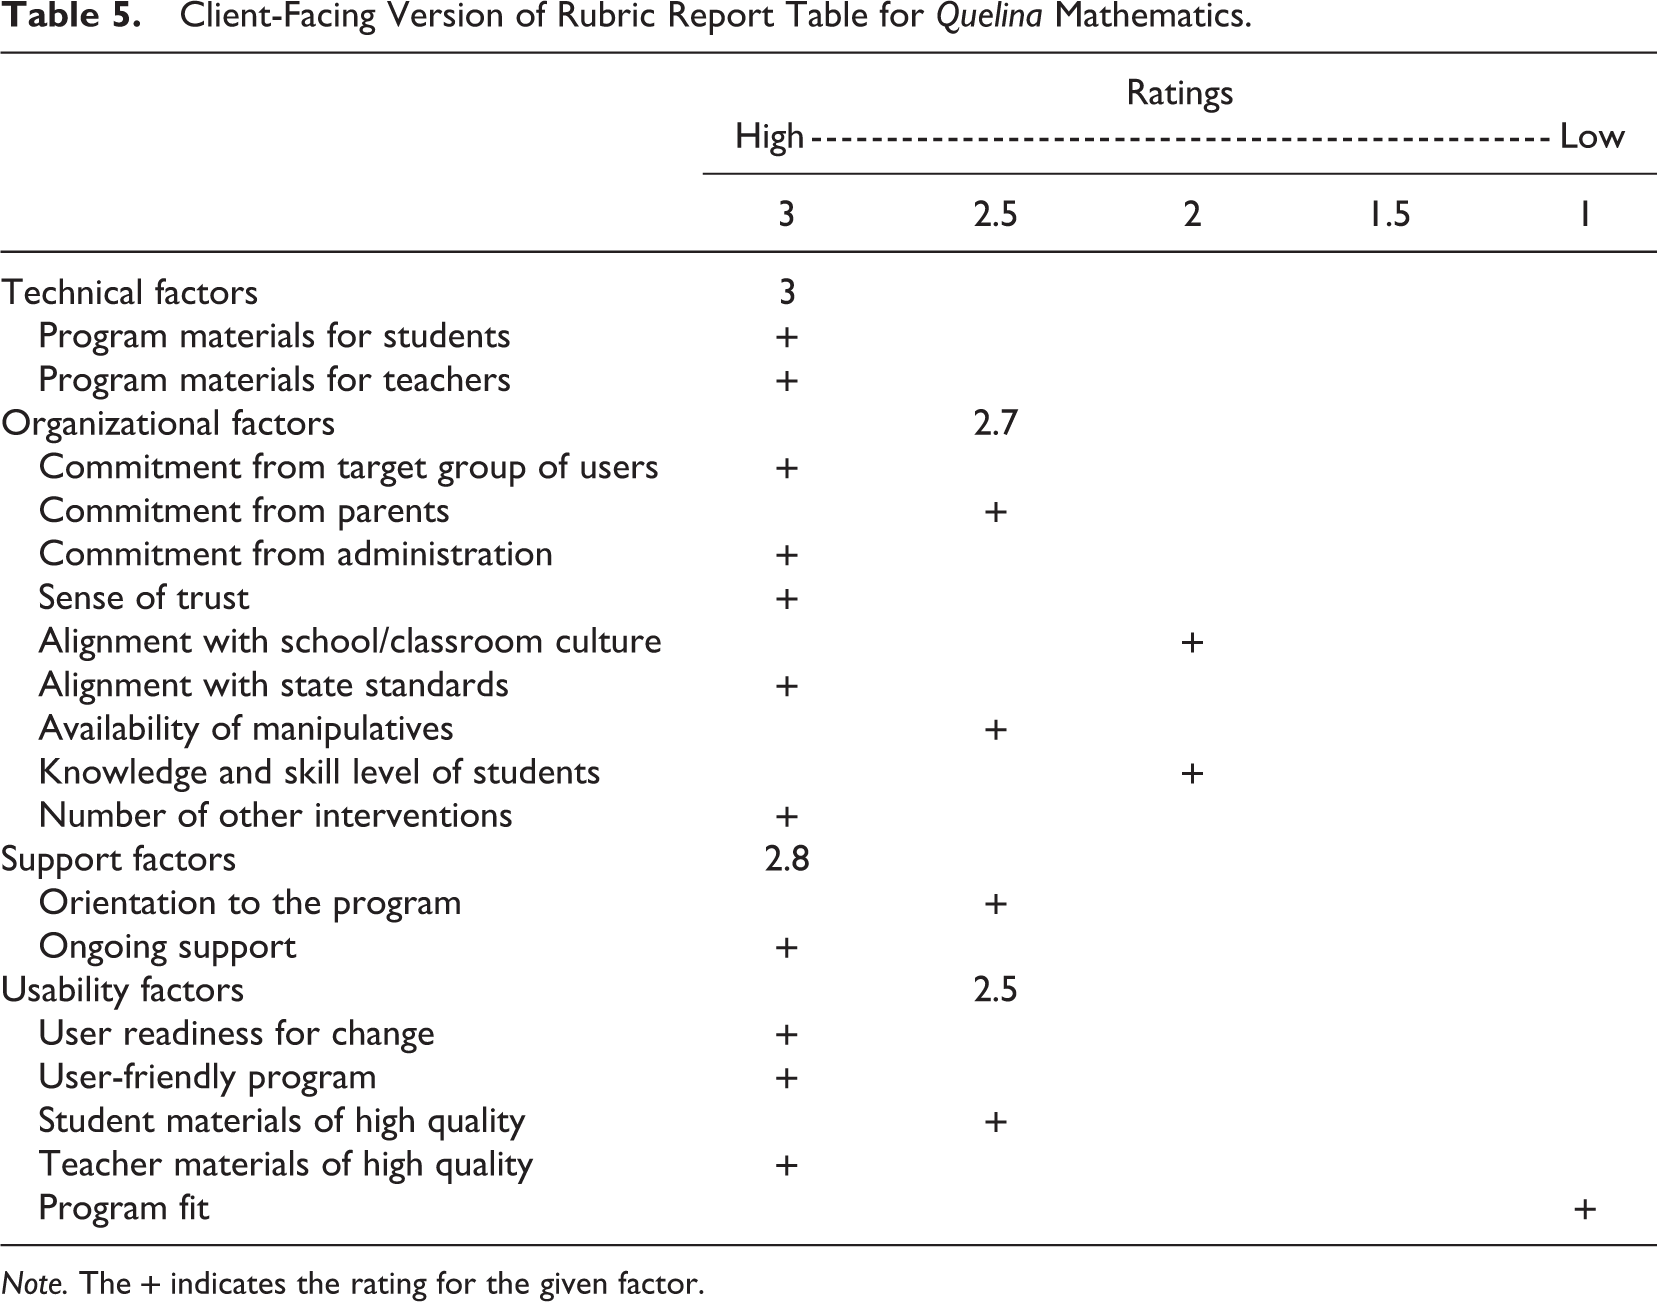
Note. The + indicates the rating for the given factor.
In reporting on the results, the text elaborated on the ratings in the table with details from the qualitative data from focus group interviews and survey comments. Details for each factor followed Table 5 and a summary statement: These ratings suggested that nearly all of the factors are in place to a large extent for implementation to be feasible. Eleven of the 18 factors (61%) had the highest rating of 3, four factors (22%) were rated as 2.5, and two factors (11%) were rated as 2. Only one factor, program fit (6%), was rated below 2. Factors that stand out are the high quality of the materials for teachers and students, along with the professional development provided to the teachers. What was most telling was that every single teacher respondent commented positively on the growth they were seeing in their students. Lower rated factors focused on questions related to if/how Quelina Mathematics was accessible to all students, especially to special education students. The question of program fit could have been a significant challenge to feasibility. However, the Quelina approach and materials design was seen as so good and effective by teachers and administrators that the contrast was embraced as an acknowledged challenge that further development would address. Overall, the data indicated that Quelina Mathematics was being implemented and implemented well.
Discussion
The experience led to several lessons learned. These were lessons for us and, in some cases, for clients as well.
Using a Rubric Is Time-Consuming But Worth the Investment
Evaluators can work from a firmer foundation by having a research-informed basis to guide their efforts. Also, the careful construction of a rubric can lead to better communication with the client and better-informed selection of data gathering activities, hence, better data and results. The initial investment of time at the beginning can be offset by clarity of evidence from the data at the end.
Spotting Feasibility Problems From the Very Beginning Can Result in Better Implementation and a More Efficient and Effective Launch
Using a rubric and associated rubric-based tool as a program, intervention, or project is being planned or just getting started seems to make the most sense. It can ensure focus as to what the “it” is from the onset. With the Quelina client, early detection led to resolving two potential issues before they became major problems (e.g., information for parents acknowledging and explaining the challenge to traditional instruction represented by the intervention). In fact, such a rubric can be used before implementation begins, as a thought experiment, to identify possible challenges to implementation. It also can be used, as it was in the Quelina example, during the intervention to assess how well implementation is proceeding. It also might be used retrospectively, after an intervention, to explore ways in which implementation may have affected outcomes. The evidence for documentation will change, depending on the point in time when the rubric is used.
A Well-Designed Tool Can Serve Multiple Purposes
Evaluators often think of an instrument as a vehicle for gathering data. The authors used the rubric as an anchor for evaluation, providing direction and guidance throughout the process. The rubric was also a means of communicating progress along the way with the Quelina client and the various stakeholder groups. It answered the question, “What is this program all about?” Finally, the rubric and its revisions can contribute to sustaining the program as it matures in subsequent iterations or at other sites.
Just Because a Program Has Achieved a High Level of Feasibility of Implementation Does Not Mean That Feasibility Is Guaranteed
Changes in policies, practices, personnel, and resources can have effects on various factors contributing to the feasibility of implementation. However, when implementers and evaluators have an understanding of feasibility factors at the grain size of the rubric, it is easier to plan for potential challenges in the feasibility of a program that is migrated or scaled up. In fact, in the case of Quelina, the client elected not to attempt a similar innovation at a higher grade. The decision was taken, in part, because the client understood the investment that would be required to make implementation feasible and could make an informed decision regarding the investment of resources.
Conclusion
We, the authors, are not putting forth this rubric as a perfect specimen. As do all instruments and tools, this rubric has its limitations. One is the ever-present possibility that some factor other than the 18 that are identified is exerting an influence that the tool misses. Another possibility is an inherent bias in the format that suggests, somewhat erroneously, that more is always better. This may or may not be. For example, how much stakeholder involvement is necessary for a successful implementation? Might there actually be either too little or too much? Unfortunately, a numerical score by itself does not provide a nuanced answer. Moreover, sharing evaluative information with a client only through numbers would reduce the richness of reporting. Recall, that in the final report to the client—after the summary presentation of Table 5—one or more pages of text with quotes and details were given for each of the 18 factors.
The world is rife with data collection instruments that are poorly constructed and inappropriately used. The old adage, “Garbage in, garbage out,” lives on. The authors hope this note reveals the complexity of development that needs to go into the construction of a rubric and the value it can provide. The interested reader is encouraged to peruse the referenced articles—those with a leading asterisk (*) are reports that describe design or use of a rubric. These range from overviews and syntheses (e.g., Dickinson & Adams, 2017; Martens, 2018) to details about richly complex rubrics (e.g., Clinton, 2014; Gajda, 2004; King et al., 2013).
The use of rubrics has served the authors well in several projects, and we foresee using the feasibility of implementation rubric again. We also wonder what such a feasibility of implementation rubric might look like if the implementation in question was, itself, an evaluation (Galport & Galport, 2015). Finally, we invite others with outside-of-education experience to explore how the approach might be applicable in their professional contexts (and to include peer-reviewed journals in the ways they share what they do!).
Footnotes
Declaration of Conflicting Interests
The author(s) declared no potential conflicts of interest with respect to the research, authorship, and/or publication of this article.
Funding
The author(s) disclosed receipt of the following financial support for the research, authorship, and/or publication of this article: The reporting of this work was supported by grants from the U.S. Department of Education, Institute of Education Sciences (IESR305A140340) and the National Science Foundation, Grant No DUE-1625215.