
Abstract
Student engagement is a multidimensional construct influenced by complex student, classroom, and school factors. Although prior research has examined various dimensions of student engagement, few studies have adopted a multilevel approach to simultaneously incorporate observational measures of classroom practices with student and school factors. The current study examined the association between student self-reported affective and behavioral engagement (n = 26,849 students) and observed instructional and behavioral classroom management practices within 401 classrooms in 54 high schools. We employed three-level hierarchical linear modeling and included student, classroom, and school variables. Results indicated that observed teacher use of positive behavior supports was positively and significantly associated with student reports of active engagement in the same classroom. Implications for improving teachers’ classroom management practices to promote student engagement are considered.
Student engagement at school has been linked with student success in K–12 and beyond (Appleton et al., 2008). Specifically, these areas of success include academic achievement (Chase et al., 2014; Voisin & Elsaesser, 2016), college enrollment (Wang & Peck, 2013), and motivation (Ryan et al., 1994). Moreover, student engagement has been positively associated with lower rates of dropout, aggressive behaviors, gang involvement, and earlier sexual debut (Reschly & Christenson, 2006; Wang & Peck, 2013). Recent research suggests that classroom-level factors (e.g., teacher practices and classroom composition) are related to both classroom- and school-level engagement (Bottiani et al., 2019); however, the classroom-level factors have largely focused on academic instructional domains (e.g., Pianta & Hamre, 2009), and not positive behavioral management. An exception to this is research conducted in elementary schools or in special education settings (e.g., Partin et al., 2009); nevertheless, more research in secondary schools is needed.
The current study aimed to address these gaps by leveraging data collected from multiple informants and across multiple levels to examine how high school teachers’ observed use of positive behavioral and instructional management practices relate to student reports of active classroom engagement in this same classroom, as well as more general perceptions of connectedness to others in the building and to the school. This line of research is intended to inform teacher development and training as well as educational policy focused on improving student engagement though classroom management practices.
Defining Student Engagement
Theory and research have operationalized student engagement in myriad ways (Furlong et al., 2003; Libbey, 2004); however, two complementary literatures on the topic exist. One relevant line of research focuses on developmental and motivational processes (Fredricks et al., 2004), which has conceptualized engagement as a within-student construct with dimensions that are behavioral (e.g., actions students take to participate), cognitive (e.g., investment in learning), and affective (e.g., relational aspects and emotional reactions to school). Research suggests that students are more likely to experience positive outcomes in school and beyond when they are actively engaged in the classroom (i.e., a form of behavioral engagement; Wang & Peck, 2013) and that high engagement is positively correlated with important social, emotional, and behavioral competencies needed for adulthood (The Aspen Institute, National Commission on Social, Emotional, and Academic Development, 2017; Wang & Fredricks, 2014). Behavioral engagement is a critical focus because of its well-established link to achievement and graduation (see Gregory et al., 2014).
The second line of research we draw upon focuses on an ecological, contextual theoretical perspective (E. A. Skinner & Pitzer, 2012), and frames engagement as a core domain of school climate (i.e., one of three domains, which also includes safety and environment; Bradshaw et al., 2014; U.S. Department of Education, 2009). This perspective includes the connectedness of individuals to the school and with each other (i.e., peers and teachers), supports for achievement motivation, and perceptions about school equity (Bradshaw et al., 2014) and interchangeably refers to “engagement” and “connectedness.” The construct of connectedness focuses on caring and respectful relationships among students and between students and their teachers, and provides insight about the general feeling students have about their school (Bradshaw et al., 2014; Libbey, 2004). A synthesis of this line of research suggests that positive school climate enhances student achievement and reduces problem behaviors (Wang & Degol, 2016) and that classroom relationships are key predictors of student engagement (Furrer & Skinner, 2003; Ruzek et al., 2016).
This study draws on both bodies of literature, with a focus on multiple dimensions of engagement including affective connections within the environment and behavioral engagement in classrooms (Appleton et al., 2008). Specifically, student connectedness refers to the interpersonal relationships between students and captures the general trust, respect, belonging, and helpfulness among students (Bradshaw et al., 2014). Teacher connectedness refers to students’ feelings and perceptions of teachers’ care, respect, and trust (Bradshaw et al., 2014). Whole-school connectedness has been conceptualized as students’ general feelings about school (Bradshaw et al., 2014) and is a significant predictor of prosocial behavior (Oldfield et al., 2016). Active engagement refers to students’ perceptions about the extent to which their teacher captivates their interest and fosters on-task classroom behavior in the classroom (Bradshaw et al., 2014; Ferguson & Danielson, 2014).
Multilevel Influences on Student Engagement
Drawing on an ecological theoretical perspective of engagement, it is important to recognize and understand that engagement is impacted by school and classroom practices and other contextual factors at multiple levels. In particular, classroom behavior management and school discipline practices are consistently associated with student engagement.
Evidence-Based Classroom Management Practices
Behavioral classroom management strategies generally include positive and reinforcing classroom management practices aimed at increasing prosocial and compliant student behaviors as well as reactive, and often punitive, classroom management practices aimed at decreasing aggressive, noncompliant, or disruptive student behaviors (Partin et al., 2009; Simonsen et al., 2008; Sutherland et al., 2003). Not only is positive behavioral management (e.g., reminding, prompting) linked with higher rates of prosocial student behaviors (Reinke et al., 2016), recognizing students for appropriate behavior also provides students with a positive interaction with the teacher (Epstein et al., 2008). Positive interactions with teachers contribute to higher quality student–teacher relationships, which has been linked to a greater sense of behavioral, emotional, and cognitive engagement (Chiu et al., 2012; Ruzek et al., 2016) and a lower likelihood of suspensions (Huang & Cornell, 2018). With enough exposure to positive classroom engagement and teacher connectedness, this may also result in a cumulative effect on students’ engagement at school more generally (Martin & Collie, 2019).
Alternatively, punitive responses (e.g., error corrections, response cost; Simonsen et al., 2008) may damage student behavioral engagement and perceptions of climate (see Mitchell & Bradshaw, 2013). Research suggests that classrooms with noncompliant students have teachers who use the most disapproval and reactive behavior management (Pas et al., 2015). Few studies, however, have explored teachers’ relative emphasis on positive and reinforcing behavior management practices as compared with reactive and punitive practices (Reinke et al., 2016).
Instructional strategies, such as opportunities to respond (OTRs), have also been established as a key facilitator of engagement (C. H. Skinner et al., 2005), as they have a functional and positive effect, particularly on on-task student behavior in elementary schools (Partin et al., 2009; Simonsen et al., 2008; Sutherland et al., 2003). OTRs are distinctly and conceptually different from behavioral classroom management practices because they target classroom behaviors indirectly by increasing pacing, and thus expected student engagement in the academic content (i.e., via academic responding). Such instructional management is relevant to behavior and engagement because responding to academic content competes with, and therefore minimizes, student disruptions (Sutherland & Wehby, 2001). This, in turn, decreases the need for teachers to respond directly to student misbehaviors (Simonsen et al., 2008).
Suspensions
The reduction of school suspensions is an explicit goal of positive behavioral supports because of the known associations with myriad poor outcomes (e.g., dropout; Lee et al., 2011) and low achievement (Noltemeyer et al., 2015). However, suspending students from school is a common example of reactive behavior management. As noted earlier, a more positive relationship with teachers is inversely associated with the likelihood of suspension (Huang & Cornell, 2018). Furthermore, students in schools with higher suspension rates reported lower levels of student connectedness and school engagement in a prior multi-level study (Debnam et al., 2014). Although the decision to suspend is typically made by the principal, the majority of suspensions begin with an office disciplinary referral that originated in the classroom (Girvan et al., 2017).
Multi-Level Consideration of Student Demographics
The association between student characteristics and school connectedness is mixed and often does not account for classroom and school factors. Some research indicates connectedness is highest among younger students, female students, and students with more friends (Thompson et al., 2006) and other research indicates that connectedness and other forms of engagement are higher among male students (Bottiani et al., 2019; King, 2016; Langille et al., 2015). Research also indicates that Black students perceive schools as less caring and equitable relative to their White counterparts (Bottiani et al., 2016) and provide less favorable self-reports of safety, connectedness, and relationships with adults, and fewer opportunities for participation (Voight et al., 2015). Moreover, racial disparities in school-level suspension practices have been associated with less school belonging among Black students (Bottiani et al., 2017). Although Black students consistently report higher levels of engagement (e.g., cognitive), intrinsic motivation, and affect in classrooms, they often have lower grade point averages (GPAs) relative to White students, a phenomenon called the “engagement–achievement paradox” (Shernoff & Schmidt, 2008).
Given these findings regarding individual differences, it is possible that racial and gender composition may similarly be important within the classroom context. For example, students have demonstrated more inconsistent and noncompliant behaviors in classrooms when there are more male and fewer White students present (Pas et al., 2015); this finding warrants additional consideration of classroom-level demographics in relation to these types of behaviors. In addition, school connectedness is associated with school-level demographics, such that connectedness is higher among students in more racially homogeneous schools and in schools where students come from relatively wealthy households (Thompson et al., 2006). It is possible that these variables are proxies for other contextual factors, such as schools’ lack of resources and school staff’s challenges to effectively support positive cross-racial/ethnic and socioeconomic group interactions; nonetheless, school-level demographics are important to consider.
Current Study
Taken together, research suggests that providing positive and reinforcing classroom management strategies and providing ample opportunities for students to respond are foundational for well-managed classrooms (Simonsen et al., 2008). In turn, such management can create a positive classroom climate where positive relationships are built and student engagement is promoted (Reinke et al., 2016; Ruzek et al., 2016). But, research examining these classroom management approaches in relation to secondary student engagement is needed (Messenger et al., 2017; Ruzek et al., 2016). Demographics considered at all levels (i.e., student/individual, classroom, and school) as well as broader school-level factors are also important (e.g., exclusionary discipline; Debnam et al., 2014; Zendarski et al., 2017), but have been examined in isolation in prior studies. Thus, rigorous empirical research is needed that accounts for all levels simultaneously and incorporates a more comprehensive consideration of classroom management practices and student engagement. The multi-level data in the current study provided a unique chance to use observed classroom behaviors linked with students’ perceptions of their classrooms and schools to examine how multiple dimensions of student-reported engagement related to teachers’ observed classroom positive behavioral management (i.e., proportion of use of positive behavior support) and instructionally focused behavior management (i.e., OTRs), while also adjusting for student, classroom, and school-level demographics, as well as school suspensions.
Hypothesis 1: Classroom Management
We incorporated student reports of active classroom engagement as the most proximal outcome of interest to teachers’ use of behavioral and instructional classroom management; in addition, we examined student–teacher connectedness, and student and whole-school connectedness as secondary outcomes of interest. Given prior research linking proactive and reinforcing classroom management strategies and student engagement (e.g., Chiu et al., 2012; Ruzek et al., 2016), we hypothesized that greater use of positive behavior support and more OTRs would both be associated with higher active engagement in classrooms, as well as students’ report of connectedness with teachers, with each other, and with the school.
Hypothesis 2: Suspensions
Research suggests that students’ perceptions of school climate are associated with the number of office disciplinary referrals (Gage et al., 2016) and suspensions (Lindstrom Johnson et al., 2017). Given this association, we hypothesized that students in schools with high suspension rates would more negatively rate the student, teacher, classroom, and whole-school connectedness variables (Bradshaw et al., 2009; Debnam et al., 2014).
Hypothesis 3: Demographics
We also anticipated that student demographics (e.g., race and gender) would be significantly associated with the several dimensions of engagement. Given the literature indicating that Black students report relatively higher academic motivation and behavioral engagement (Shernoff & Schmidt, 2008), we hypothesized that Black students would provide more favorable ratings of active classroom engagement than other students. Research has also consistently shown that Black students report feeling less warmth, care, and connection from teachers relative to White peers (Bottiani et al., 2016); therefore, we also hypothesized lower levels of teacher connectedness among Black students. We anticipated that this individual-level demographic difference would spill-over into the classroom, such that higher concentrations of non-White students would have higher perceptions of engagement in the classroom. Literature on the “affective-behavioral paradox” asserts that students who attend schools with a higher proportion of White students are less likely to report that they like school, but they are more engaged in coursework (Ackert, 2018). Thus, we hypothesized that students in schools with lower concentration of non-White students would more positively rate whole-school connectedness. Moreover, there are few studies related to gender composition in the classroom; as such, we wanted to add to the available literature. We hypothesized that male students would report lower levels of school connectedness (Whitlock, 2006; c.f. Langille et al., 2015), yet may report higher levels of active classroom engagement (King, 2016).
In addition to student demographics, we were also interested in the associations of engagement with class size, as well as socioeconomic and disability status. Based on findings from the Tennessee Class Size Study (Finn & Achilles, 1999), we hypothesized that the number of students in the class would be associated with lower levels of engagement. Finally, given that students with disabilities and students from low-socioeconomic status (SES) backgrounds are less likely to be engaged in school than their counterparts (Reschly & Christenson, 2006; Yazzie-Mintz, 2007), we hypothesized that students in schools with a greater percent of these two groups would rate engagement differently than students in schools with lower percentages of these populations.
Method
Participants
We used data from the Maryland Safe and Supportive Schools (MDS3) Project, in which high school students in Grades 9–12 completed the web-based MDS3 School Climate Survey (for additional details see Bradshaw et al., 2014) during the spring of 2014. General and classroom engagement survey data from 26,849 students in 401 classrooms and in 54 high schools were analyzed; instructional and behavioral management data in these classrooms was also collected. Half of the students in the sample were White (n = 13,627; 51%), whereas Black students comprised close to one third of the sample (n = 7,941; 30%). The number of Hispanic (n = 1,433; 5%), Asian (n = 1,322; 5%), and American Indian/Native American (n = 514; 2%) students were much smaller. Approximately half of the students were female (50.1%).
At least one adult was present in each classroom and each classroom had an average of about 20 students (SD = 6.25). Most classrooms were composed of about 50% (SD = 0.17) males and 47% (SD = 0.30) non-White students. Across the 54 schools, the average school enrollment was 1,371.20 (SD = 466.23), with 9.03% (SD = 3.31) students in the sample of schools receiving special education services and 34.33% (SD = 17.89) receiving free and reduced priced meals (FARMS). The average school-level suspension rate was 14.83% (SD = 11.00). In the 401 classrooms, the mean of the proportion of positive behavior support relative to total utterances was .66 (SD = .29) and the average number of OTRs in 15 min was 14.64 (i.e., a little less than 1 per min) with a rather large standard deviation of 12.24. Additional information on the students, classrooms, and schools in the current analyses are presented in Table 1.
Student and School Demographic Characteristics.
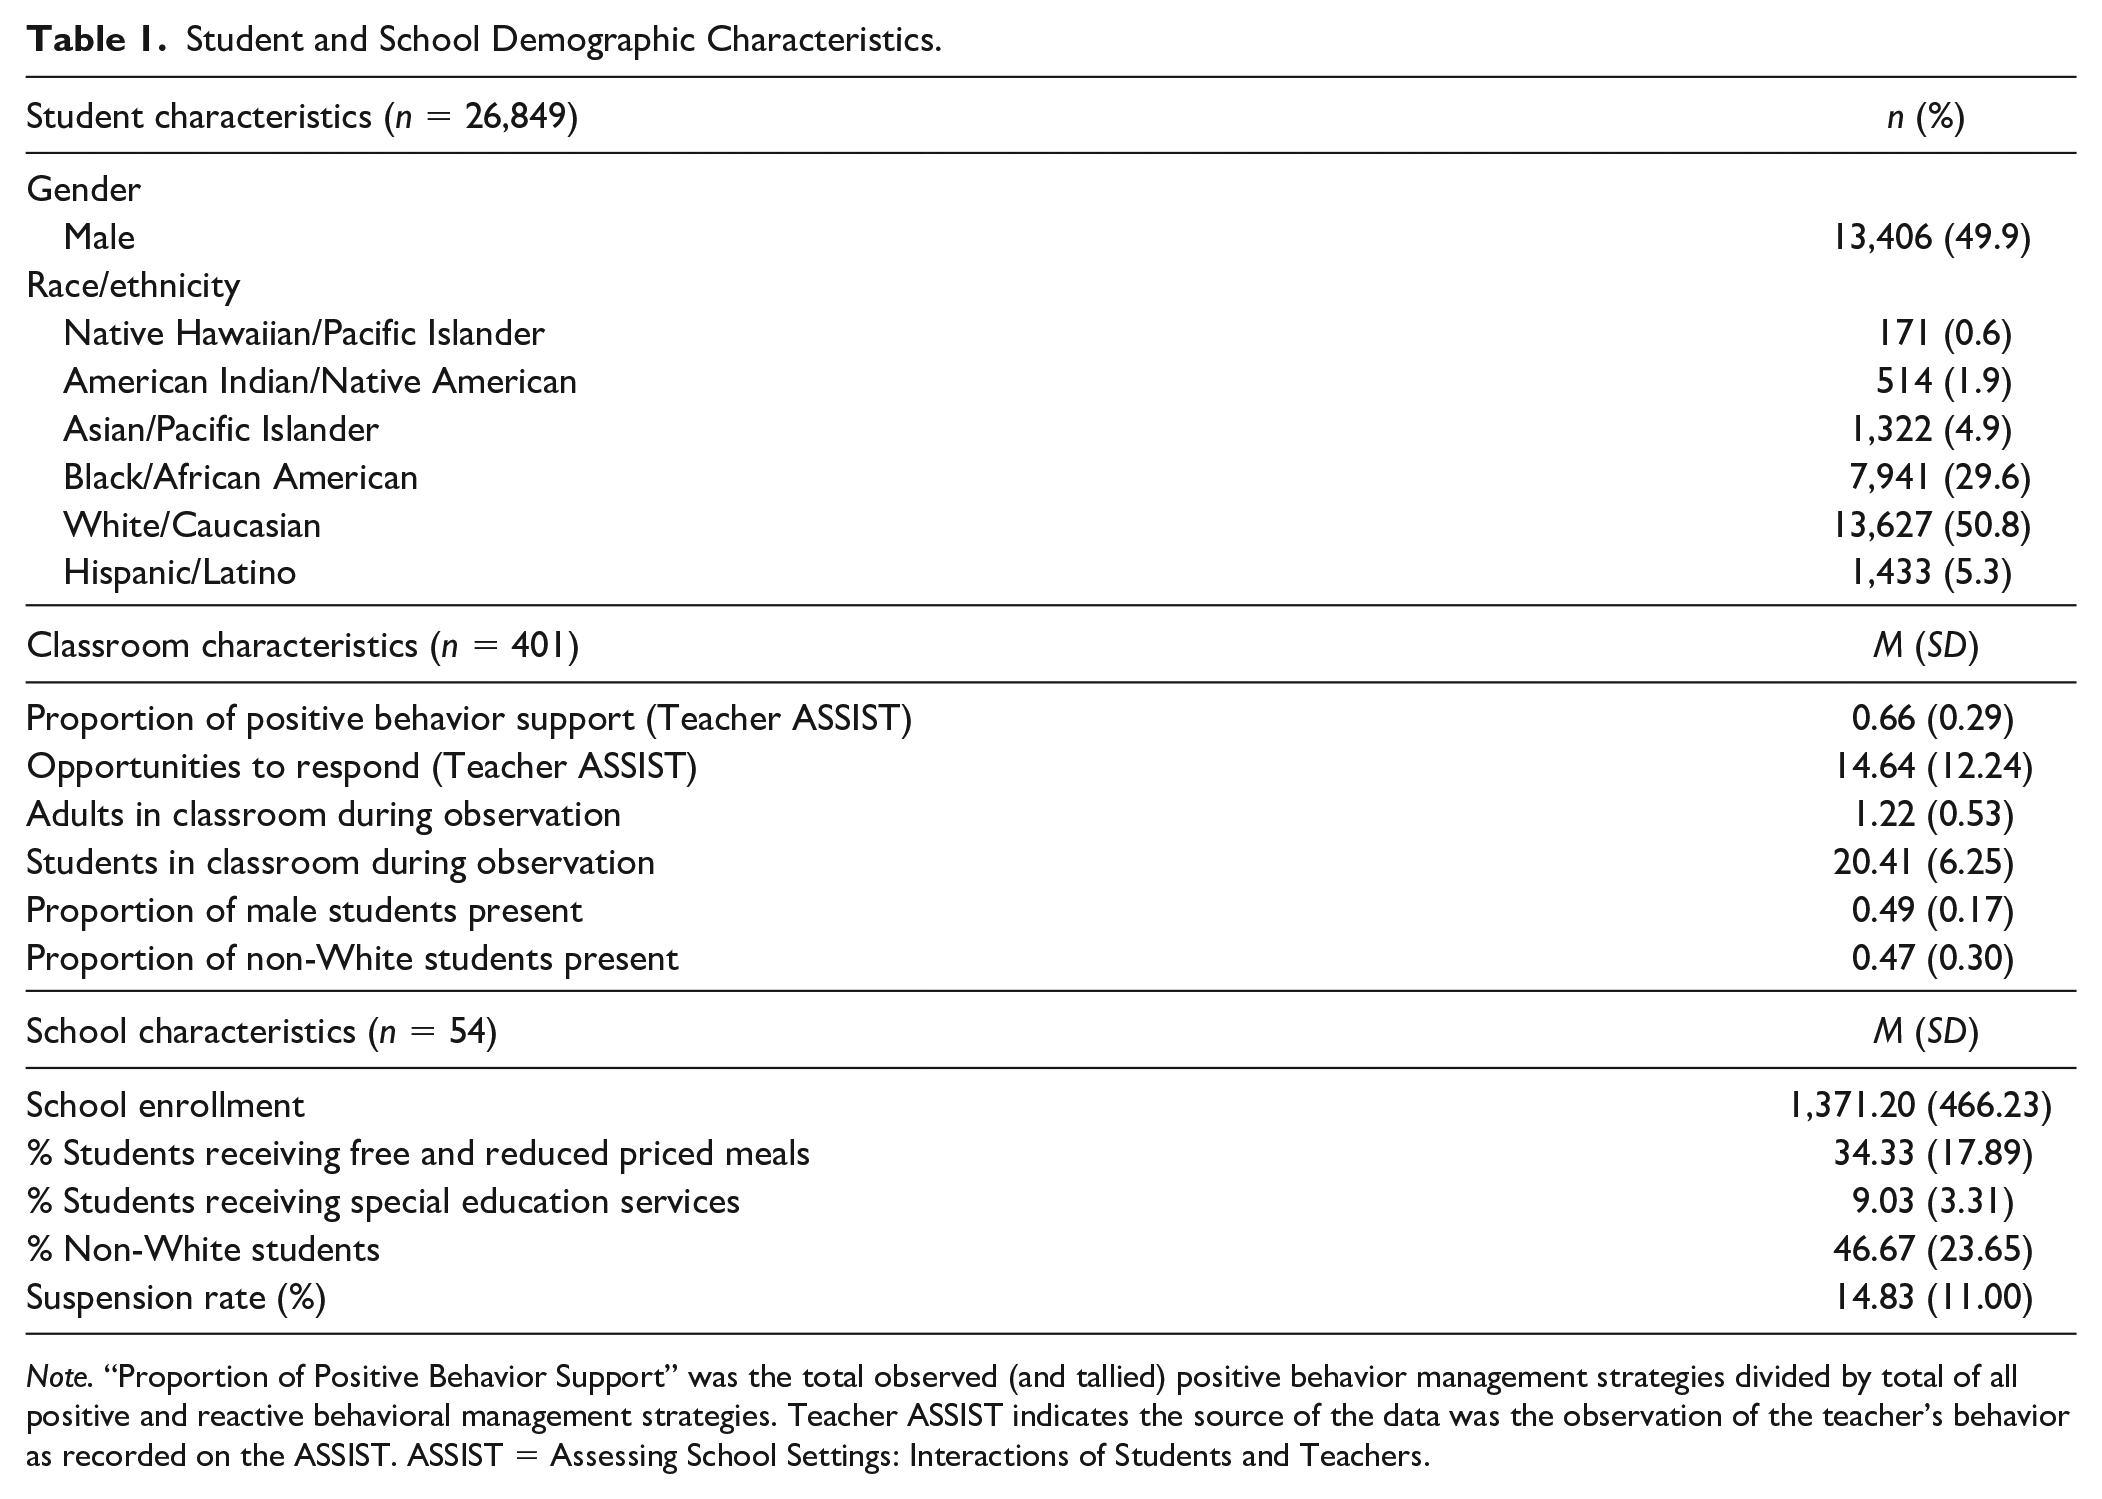
Note. “Proportion of Positive Behavior Support” was the total observed (and tallied) positive behavior management strategies divided by total of all positive and reactive behavioral management strategies. Teacher ASSIST indicates the source of the data was the observation of the teacher’s behavior as recorded on the ASSIST. ASSIST = Assessing School Settings: Interactions of Students and Teachers.
Procedure
The Maryland State Department of Education (MSDE) approached districts to participate in the MDS3 Project. Interested principals signed commitment forms after attending informational meetings about the project. Parents were notified about the purpose of the anonymous survey by the schools, and passive parental consent and youth assent were obtained.
Online student survey
School staff helped administer an anonymous online MDS3 student survey using a standardized script and administration procedures. Researchers instructed schools to administer it to approximately six classes per grade level and to administer the survey during a core language arts class. As all students were required to take a core language arts course, this sampling strategy maximized a representative catchment of the school enrollment. Furthermore, the sampling strategy ensured that students were not asked to complete the survey more than once since students take one core language arts course per day.
Classroom observations
Following a similar sampling logic for the observations, external, research-team trained observers selected classrooms and were instructed to first observe all language arts teachers for one period, and then other core instructional classes (i.e., math, science, and social studies) until 25 classrooms were visited. Observers selected the classrooms on their own, following these guidelines, to allow for variation in classroom selection. Observers were unassociated with the school systems and schools and unaware of the project conditions.
Merging observational and survey data
Although there was substantial overlap in the classrooms selected for the online survey and classroom observations, those observed classrooms without survey data, and vice versa, were not included in this study. The resulting sample for this study included students in predominantly language arts classes (n = 22,952; M = 98.9%) followed by students in science (n = 118; M = 0.5%) and social studies (n = 129; M = 0.6%) classrooms. No student identifiable data were collected, but researchers documented information about the teacher and classroom to allow for the linkage with the classroom observational data and the student survey data. The Institutional Review Board at the researchers’ institution approved the collection and analysis of these data.
Measures
MDS3 School Climate Survey
The MDS3 Climate Survey (Bradshaw et al., 2014) assesses the school climate domains of safety, engagement, and environment, consistent with the school climate model developed by the U.S. Department of Education (2009). Here, we focused exclusively on four dimensions of engagement including active classroom engagement and teacher, student, and whole-school connectedness. The average of the items on each of the engagement scales served as the dependent variables and are described in greater detail below. For all four scales, participants answered questions on a 4-point Likert-type scale, from strongly disagree to strongly agree. A higher averaged score on each of the scales reflected more of each construct (i.e., more active classroom engagement and greater connectedness).
Teacher connectedness
Students responded to six questions about their perceptions of their relationships with teachers at the school as a whole. All items were prefaced by the prompt “At this school. . . ” Items included both perceptions of student/teacher relationships (e.g., “Students trust the teachers” and “Teachers respect students”) and the teacher behaviors that can help to facilitate more positive relationships (e.g., “My teachers listen when I have something to say” and “My teachers tell me when I do a good job”; α = .88). These items were taken from the California Healthy Kids Survey (Hanson & Kim, 2007).
Student connectedness
Students responded to five questions about their general perception of belonging and the extent to which students feel connected to and positive about one another. Items followed the prompt “At this school . . . ” and included, “students trust one another” and “students help one another” (α = .88). These items were taken from the School Development Program School Climate Survey (Haynes et al., 2001).
Whole-school connectedness
Four items focused on general positive feelings about school (α = .84). These items included, “Students and staff feel pride in this school” and “I like this school.” Items were also taken from the School Development Program School Climate Survey (Haynes et al., 2001).
Active classroom engagement
In this section of the survey, students responded to four questions about their perceptions of the specific classroom in which they completed the survey (i.e., not “at this school”) and thus, largely focused on engagement in the language arts classroom. Items were adapted from the Tripod survey (Ferguson & Danielson, 2014). Items followed the prompt “In this class . . . ” and included: “Our class stays busy and doesn’t waste time,” “We learn a lot and stay busy almost every day,” “My teacher makes learning enjoyable,” and “Student behavior in this class is under control” (α = .80).
Demographics
Students indicated whether they identified as Asian/Pacific Islander, Black/African American, Hispanic/Latino, Native American/American Indian, Native Hawaiian, White/Caucasian, or Other. For the purposes of the current study, the demographic characteristic was coded 1= Black, 0 = non-Black/all other ethnicities. Students also identified their gender (i.e., male = 1, female = 0). These variables were included as student-level predictors.
Assessing School Settings: Interactions of Students and Teachers (ASSIST)
ASSIST (Rusby et al., 2001) is an observational measure that records both counts of specific teacher and student behaviors as well as global ratings of classroom social processes. First, the observer enters information about the classroom, then tallies teacher and student behaviors for 15 min, and then responds to a series of Likert-type survey items. ASSIST observers were hired and trained by the research team, and had to reach 80% interobserver agreement with a trainer in three nonstudy classrooms prior to observing independently in study schools. The average training interobserver agreement rate was 87% during the spring of 2014, when these data were collected. Observers’ interobserver agreement rates were again examined during active data collection and was 87% (see Pas et al., 2015 for further description of the ASSIST training and reliability and validity data). For this study, we analyzed only tallies of teacher behaviors.
Proportion of positive behavior support
Behavioral management was measured as the proportion of positive behavior support provided by the teacher (i.e., positive divided by total of all positive and reactive behavioral management strategies). Extant literature supports the use of positive: negative ratio (rather than sheer counts) to allow for fewer variables and thus achieve model parsimony (Reinke et al., 2016). This variable was comprised of four of the teacher tallies collected within the 15-min tally period. Proactive Behavior Management included instances when the teacher explained, reminded, commanded, prompted, or modeled expected behavior, or had students practice the expected behavior. For Teacher Approval, ASSIST observers tallied each time a teacher gave something tangible (e.g., ticket) to a student, or verbally praised or recognized a student for academic performance or behavior. This behavior also included approving gestures (e.g., thumbs up) or physical contact (e.g., a pat on the back). Reactive Classroom Behavior Management was tallied by ASSIST observers when a teacher used cues (e.g., touch, gesture, proximity, specifying the misbehavior or desired behavior) to redirect inappropriate behavior. ASSIST observers also recorded a tally for reactive behavior management for a behavioral correction (e.g., “Be quiet”; “Put that away”). Teacher Disapproval was tallied by ASSIST observers when the teacher threatened a tangible consequence, expressed verbal criticism or sarcasm, made a gestural or physical contact demonstrating disapproval of a student’s behavior, or when the teacher/staff person threatened to give a punishment for misbehavior. We calculated each teacher’s Proportion of Positive Behavior Support by adding the Proactive Behavior Management and Teacher Approval tallies and dividing it by the sum of the four tallies listed above. The Proportion of Positive Behavior Support variable was included as a classroom-level predictor in the analyses.
Instructional management
Teachers’ instructional management was measured as the tallied use of Opportunities to Respond (i.e., concurrently tallied with the behavioral management tallies) by ASSIST observers when a teacher stated a behavioral or instructional prompt (i.e., statement, gesture, or visual cue) that required an immediate and public response to the teacher or peer(s). Responses could be verbal or written, but excluded opportunities that were written but not displayed (e.g., test, workbook completion). The total number of OTRs was included as a classroom-level predictor in the analyses.
Classroom-level demographic variables
Prior to conducting any tallies, observers counted the total number of students in the classroom as well as the number of male and White students. Using these data, we computed the percentage of males in each classroom (i.e., number of male students, divided by the total number of students), and the percentage of non-White students in the classroom (i.e., the inverse of the total number of White students divided by the total number of students in the class). The number of adults in the classroom were also counted. These variables were included as classroom-level predictors in the analyses.
School-level variables
The state department of education provided the following school-level demographic variables: percent of students who received FARMS, the percentage of students who received special education services, the percentage of students who were non-White, and the percentage of out-of-school suspensions (i.e., total suspension events divided by total enrollment). All were included as school-level predictors in the multi-level analyses.
Analyses
Three-level hierarchical linear models (HLMs) were estimated using the Mplus 8 software (Muthén & Muthén, 2017) to account for the nested nature of the student-reported engagement data (i.e., students within classrooms and classrooms within schools) and to allow for the modeling of variables at each (student, classroom, and school) level. We examined the association between the four engagement outcomes (i.e., four separate models), in relation to the teacher classroom management strategies predictors, while accounting for student, classroom, and school-level demographics as well the school suspension variables. The four outcome variables (i.e., active classroom engagement, student connectedness, teacher–student connectedness, and whole-school connectedness) were modeled at Level 1, as were the student demographics (i.e., race and gender). At Level 2, the proportion of teachers’ use of positive behavior support and number of OTRs were analyzed, as were the number of adults and students present in the classroom, the percent of White students, and percent of males. At Level 3, the demographics variables (i.e., percent of students who received FARMS and special education services, the percentage of students who were non-White) and the suspension rate were included. Spybrook’s (2008) deltas (i.e., Δ) were calculated as effect sizes using the adjusted and standardized coefficients for each significant predictor variable, divided by the pooled standard deviation of the outcome. Because the standardized coefficients for each variable are used to calculate the effect size, these effect sizes can be reported for both continuous and binary outcomes. Furthermore, as these effect sizes are calculated as the magnitude of the effect relative to the standard deviation of the outcome, they can be interpreted analogously to Cohen’s d (Cohen, 1992). Thus, an effect of up to .20 (absolute value) was considered small, from .20 to .50 was moderate, and above .50 were large.
Intraclass correlation coefficient (ICC)
In three-level models, two types of ICCs can be considered; both the Level 2 ICC (τπ; tau-pi) and the Level 3 ICC (τβ; tau-beta). The Level 3 ICC is defined as the school level variance estimate divided by the sum of variance estimates from all three levels of the model (i.e., total variance). Similarly, the Level 2 ICC is defined as the sum of the school level and classroom level variance estimates, divided by the total variance.
Proportional reduction in variance
Improvements between the unconditional model and final models were assessed by the proportional reduction in variance. This can be calculated by subtracting the variance estimate for the full model from the variance estimate for the unconditional model, and dividing by the variance estimate for the unconditional model (McCoach, 2010). The proportional reduction in variance can be interpreted as the proportion of variance in the outcome that can be explained by the covariates (Snijders & Bosker, 2012). As suggested by Raudenbush and Bryke (2002), the proportional reduction in each variance component should be considered at each level. Overall, this helps us to understand how the set of predictor variables are related to outcomes.
Missingness
To appropriately handle missing data, full information maximum-likelihood (FIML) estimation was used to estimate both fully unconditional models and models with all covariates for the four engagement outcomes models in Mplus. FIML has been shown to produce unbiased parameter estimates and standard errors under missing at random (MAR), and is asymptotically equivalent to multiple imputation (Enders, 2010; Graham, 2003; Schafer & Graham, 2002). This resulted in the retention of 26,849 students, 401 classrooms, and 54 schools for all four models.
Results
Both individual-level and classroom-level correlational statistics among the four outcome variables are presented in Table 2. All correlations in Table 2 were statistically significant at the p < .01. Additional correlations among predictors at each level are presented in Table 3. Estimates of ICCs at both Level 2 and Level 3 are provided in Table 4. Level 3 ICCs ranged from .02 to .07, while Level 2 ICCs also ranged from .02 to .07. Table 4 also provides proportional reductions in variance estimates between the fully unconditional models and the final models. A greater proportion of variance at the school-level as compared with the classroom-level was able to be explained with the addition of the predictors. Results for each of the four engagement outcomes are presented separately in the sections below.
Correlational Statistics for Outcome Variables.
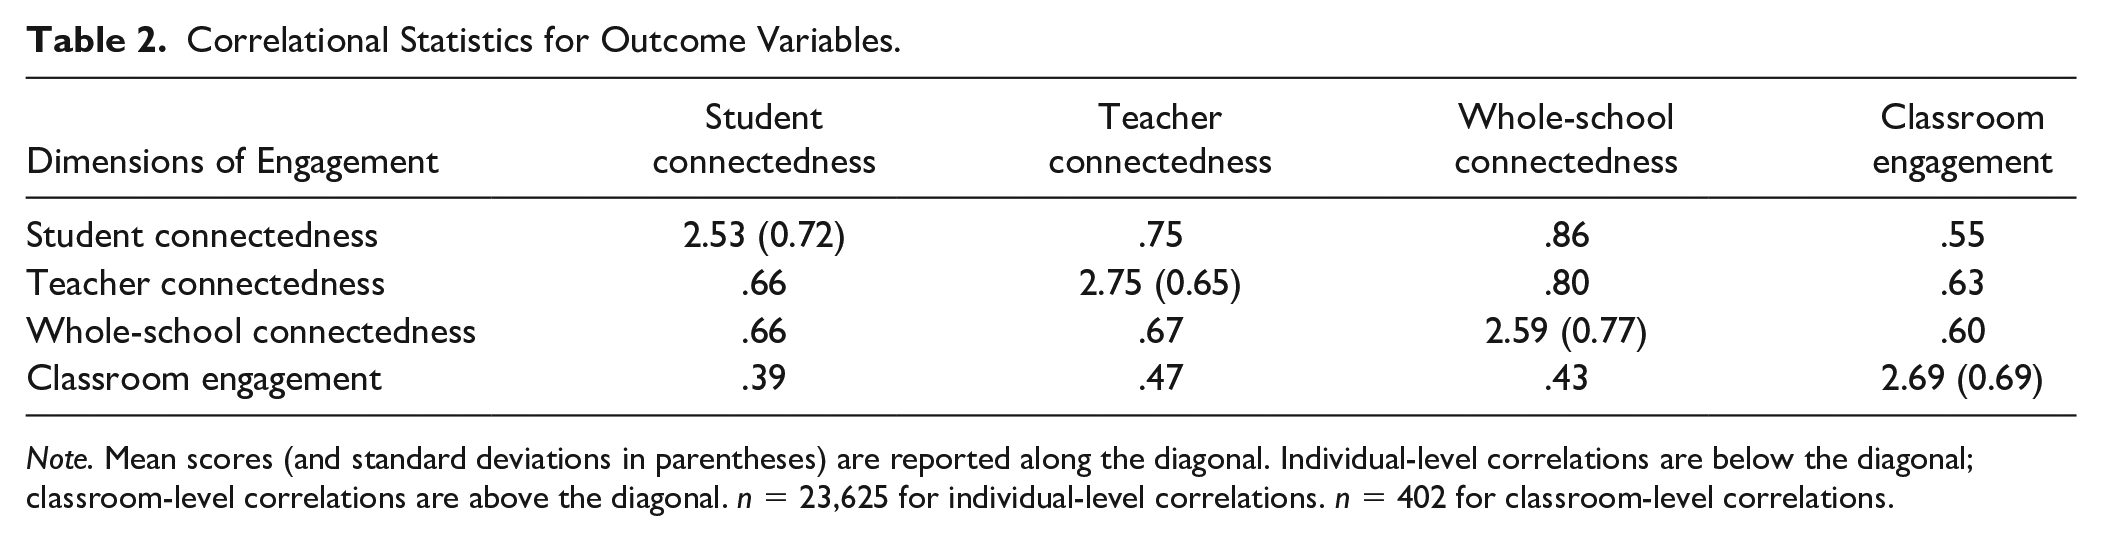
Note. Mean scores (and standard deviations in parentheses) are reported along the diagonal. Individual-level correlations are below the diagonal; classroom-level correlations are above the diagonal. n = 23,625 for individual-level correlations. n = 402 for classroom-level correlations.
Correlational Statistics for Predictive Variables by Level.
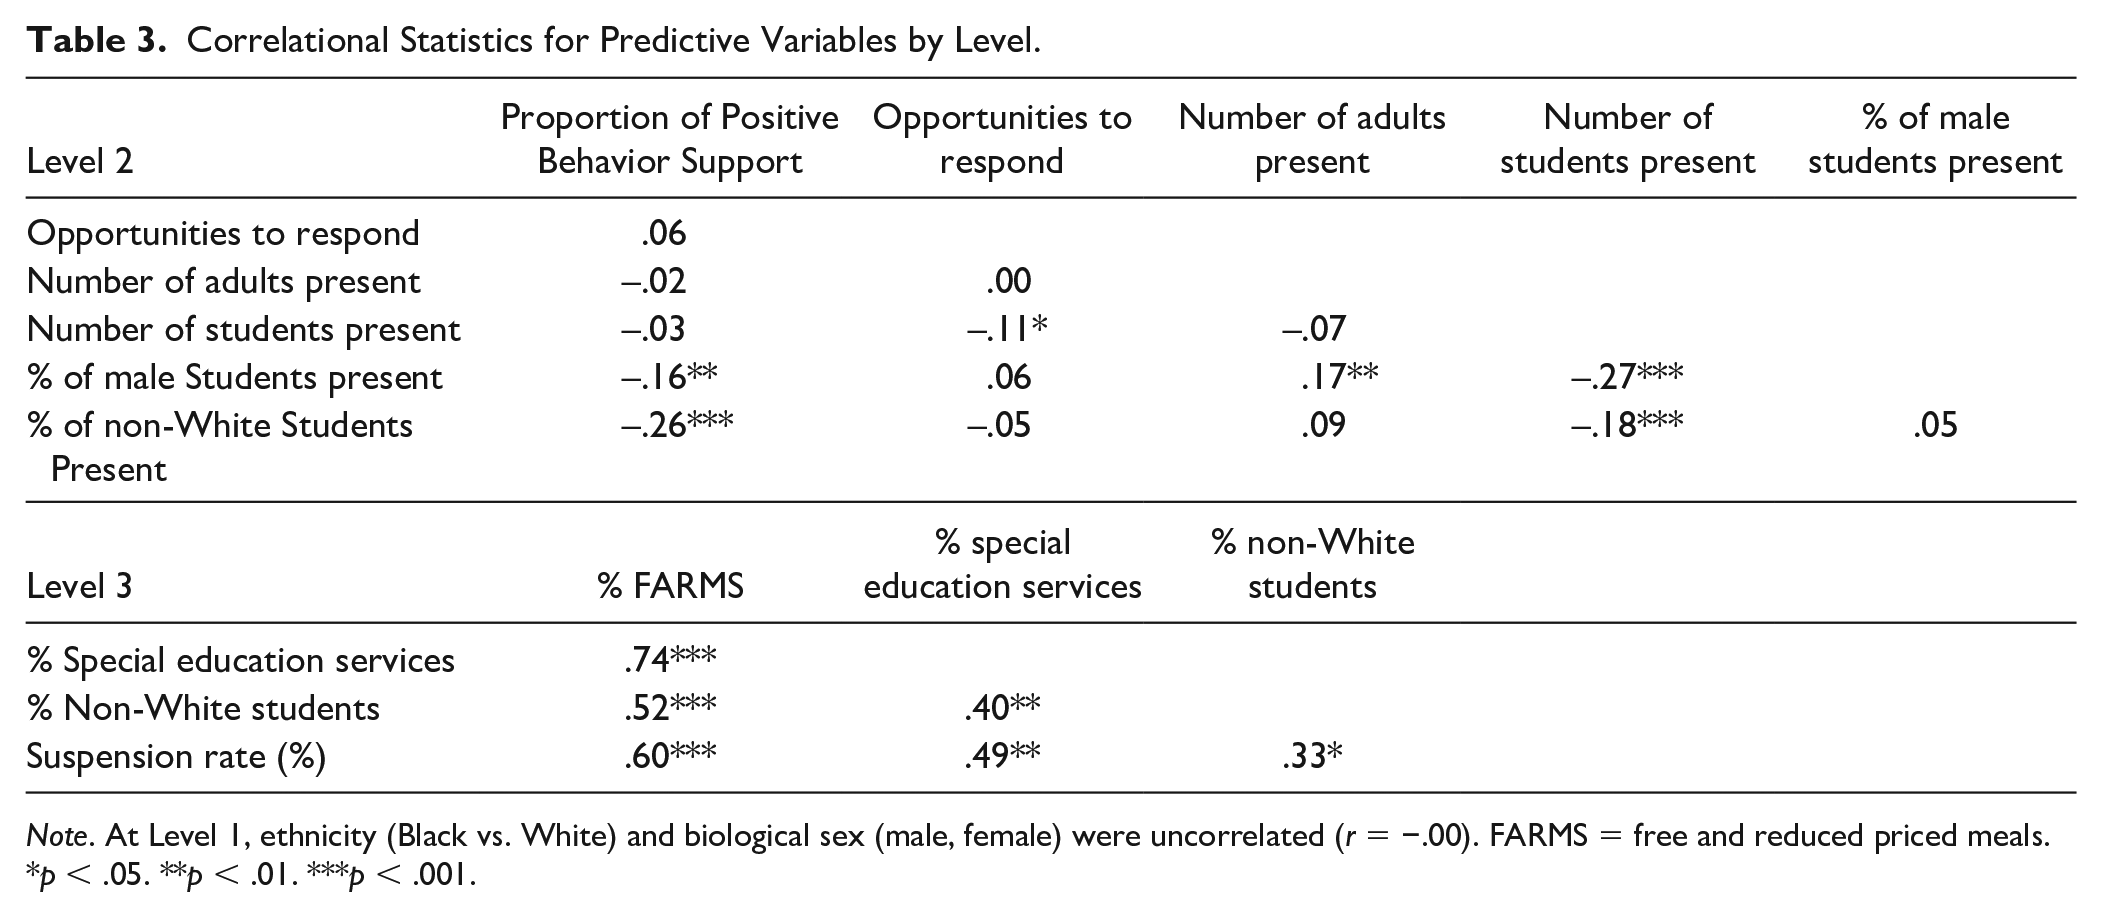
Note. At Level 1, ethnicity (Black vs. White) and biological sex (male, female) were uncorrelated (r = −.00). FARMS = free and reduced priced meals.
p < .05. **p < .01. ***p < .001.
HLM Results for Level 3 Model Examining the Association Among School and Classroom Factors of Engagement Dimensions.

Note. HLM = hierarchical linear model; FARMS = free and reduced priced meals; ICC = intraclass correlation.
p < .05. **p < .01. ***p < .001.
Teacher Connectedness
The results of the three-level HLM analyses (see Table 4) indicated that at Level 1, both student-level demographic characteristics were significantly related to student perceptions of their relationship with teachers. Male students (π = 0.04, p < .001; Δ = .06) reported significantly higher perceptions of teacher connectedness than females (i.e., male students reported 0.06 standard deviation higher ratings of teacher connectedness) and Black students (π = −0.06, p < .001; Δ = −.09) reported significantly lower levels (i.e., nearly 1/10th standard deviation lower) of teacher connectedness than students who were not Black. Positive behavior support and OTRs were not related to teacher connectedness.
At Level 2, the percent of males present in the classroom (β = −0.11, p < .05; Δ = −.15) was significantly related to teacher connectedness, such that students in classrooms with a higher proportion of males present reported lower levels of teacher connectedness. The effect size equates to about 1/6 standard deviation higher ratings of teacher connectedness for classrooms of all males as compared with all females. Moreover, the number of adults present (β = 0.03, p < .05; Δ = .04) was also significant, suggesting that students reported slightly higher levels (i.e., 0.04 standard deviation) of connectedness to their teachers in classrooms for an increase in the number of adults present.
At Level 3, the percent of suspensions was significantly and negatively associated with teacher connectedness (γ = −0.003, p < .05; Δ = −.01), such that students had lower and poorer perceptions of teacher connectedness in schools with higher suspension rates. This indicates that for each 1% increase in the suspension rate above the mean, there was a 0.01 standard deviation decrease in ratings of teacher connectedness. Although small for this 1% change, a 10% change would be the equivalent of a 1/10th standard deviation change. The effects of all significant variables were small (i.e., <.20; Cohen, 1992); the most notable effect size was the percent of males present in the classroom.
Student Connectedness
The results of the three-level HLM analyses (see Table 4) indicated that at Level 1, both demographic characteristics were significantly related to student connectedness. Male students reported significantly higher perceptions of connections with other students than females (π = 0.18, p < .001; Δ = .25), and Black students reported being significantly less connected with other students than students who were not Black (π = −0.07, p < .001; Δ = −.10). Specifically, there was a .25 standard deviation decrease of student connectedness for male students and a .10 standard deviation decrease for students who were not Black. ASSIST observations of teachers’ use of positive behavior support and OTRs were not related to student connectedness. At Level 2, students in classrooms with a higher percent of males present in the classroom reported significantly lower levels of student connectedness than students in classrooms with a lower percent of males present (β = −0.12, p < .05; Δ = −.16). At Level 3, the percentage of students receiving FARMS was significantly and negatively associated with student connectedness (γ = −0.005, p < .01; Δ = −.01). Students in schools with 1% higher rate of students from low socioeconomic backgrounds than the average rate reported lower student connectedness by .01 standard deviations. The effect size for male gender was moderate sized (i.e., Cohen .20–.50), whereas other effect sizes were small.
Whole-School Connectedness
The results of the three-level HLM analyses (see Table 4) indicated that at Level 1, males reported significantly higher levels of whole-school connectedness than female students (π = 0.09, p < .001; Δ = .12) and Black students’ report of whole-school connectedness was significantly lower (i.e., 0.12 standard deviation decrease) than students who were not Black (π = −0.05, p < .05; Δ = −.07). At Level 2 (classroom), the percentage of males present was significantly associated with whole-school connectedness (β = −0.11, p < .05; Δ = −.14); specifically, students reported significantly lower levels of whole-school connectedness as the percentage of male students in the classroom increased. However, positive behavior support was not associated with whole-school connectedness. At Level 3, the percentage of students receiving FARMS was negatively associated with whole-school engagement (γ = −0.005, p < .01; Δ = −.006), such that students reported lower levels of whole-school connectedness in schools as the percentage of students receiving FARMS increased. Although these effects were all statistically significant, effects were small in size for a single unit change in the predictor variable. As noted above, however, the effect is considerably larger when one considers a 10% or 20% increase in the predictor.
Active Classroom Engagement
The results of the three-level HLM analyses (see Table 4) indicated that at Level 1, males reported lower levels of active classroom engagement than females (π = −0.03, p < .01; Spybrook’s delta, Δ = −.04); similarly, the percentage of males present at the classroom-level was negatively associated (β = −0.17, p < .05; Δ = −.24), such that as the percentage of males in the classroom increased, student engagement decreased. At Level 2, observations of teachers’ use of positive behavior support on the ASSIST was significantly associated with higher levels of student-reported classroom engagement (β = 0.17, p < .01; Δ = .22). None of the Level 3 variables were significant for this outcome. The effect sizes for the percentage of males in the classroom and observed positive behavior support were both moderate in size (i.e., Cohen .20−.50).
Discussion
This study examined the association between classroom management practices and four dimensions of student engagement, while adjusting for student-, classroom-, and school-level demographics. Whereas prior research has examined the importance of classroom management on engagement and other student outcomes in elementary schools (Messenger et al., 2017; Sutherland et al., 2003), this study extends the literature by investigating high schools and also by examining multiple dimensions of engagement. Our multilevel results provided support for small-sized effects between student-, classroom-, and school-level variables and engagement. In particular, we found that independent observers’ reports of teachers’ use of positive behavior management practices were associated with more favorable student reports of active engagement in those classrooms.
Teacher Practices
Our primary focus was on observations of teachers’ use of behavioral management practices that were positive behavior-focused and instruction-focused. As hypothesized, we found that greater teacher use of positive behavior support in the classroom was positively and significantly associated with student perceptions of active classroom engagement in that teacher’s classroom, whereas instruction-focused practices were not. With a moderate effect size (Δ =.22; Cohen, 1992), these findings partially align with prior elementary school research (Partin et al., 2009). This suggests that teachers’ positive behavior support practices, perhaps more so than instructionally focused behavior management strategies (i.e., OTRs), impact students’ perceptions of active, behavioral engagement in the classroom. On the contrary, teachers’ positive behavior support practices were not associated with students’ perceptions of connectedness in the broader context of the school.
Suspensions
Suspension rates were associated with teacher connectedness, such that students in schools with higher suspension rates reported less favorable perceptions of teacher connectedness. Although the effect sizes for a 1% increase in suspensions were quite small, when considered at a higher and quite feasible level (e.g., rates that are 10% higher than the mean rate, which was 15% in this sample of schools), the effect sizes had more practical significance. This finding likely reflects the negative impact that punitive discipline has on relationships between students and teachers, and is consistent with alternatives to exclusionary discipline that better support student–teacher relationships (Fenning et al., 2012).
Demographic Characteristics
Demographics at the individual and classroom levels were associated with various forms of engagement. For instance, male students reported significantly higher levels of teacher, student, and whole-school connectedness than female students. Notably, these were small effect sizes (Cohen, 1992), which is inconsistent with the elementary school-focused research (Thompson et al., 2006); as such, more research is needed to explore these associations. On the contrary, males reported significantly lower active classroom engagement within the same classroom than females. This finding is consistent with prior research by King (2016), who reported that girls were more academically engaged than boys and that negative and positive peer influence partially accounted for gender differences in behavior and achievement. Moreover, although individual male students reported feeling more connected to their teachers, peers, and the school, being in a classroom with a higher proportion of males was negatively associated with students’ reports of all four types of engagement. More research, however, is necessary that further examines the distinction between the individual differences of engagement by gender as they relate to the compositional differences. With regards to other compositional variables, we found it surprising that the number of students in the classroom was not associated with any forms of engagement, especially given the findings from the seminal work by Finn and Achilles (1999) on class size.
At the school level, the majority of demographics variables were not significantly related to the outcomes. The exception was the percentage of students from low socioeconomic backgrounds (i.e., higher FARMS rate), which was negatively associated with student and whole-school connectedness and demonstrated a small effect size. These findings are related to research that suggests that connectedness is higher among students in schools where students come from higher SES households (Thompson et al., 2006).
Limitations and Future Directions
Although a strength of this study was our use of multiple data collection methods (i.e., surveys from students and observational measures conducted by external observers) which allowed for examination of associations using multiple informant perspectives, the sampling strategy presented some limitations. Future studies should consider using an active engagement measure that is more representative of all content areas (e.g., social studies, math, science) and not rely solely on students’ perceptions of active engagement in Language Arts classrooms, as these perceptions may not generalize to other content areas. Moreover, despite the relatively large sample of high schools and students, which may have increased generalizability of the findings to other high schools, generalizability could be impacted by the voluntary nature of enrollment in the project. Future research should replicate this research study to determine whether these associations are robust and generalizable to other samples.
Rather than focusing on one school setting, practice, or type of engagement, we measured associations between several school-level factors, teacher practices as rated by externally trained observers, and student demographics with student-reported engagement. Although we accounted for clustering and controlled for demographics at the school-level by using HLM, future research may emphasize more malleable contextual school-level factors (e.g., revenues, expenditures, student–teacher ratios, and other factors that contribute to outcomes; Muller, 2015) in the analyses. Moreover, although this study used advanced statistical analyses, these analyses are correlational and cross-sectional and no inferences can be made regarding causation. Future studies should consider increasing the rigor of study design such that researchers can examine the causal factors impacting engagement.
Finally, the classroom-level gender and racial composition was generated based on the observers’ count of the number of male and White students. This approach is not precise and would have been improved with reports from students about their race and gender (American Psychological Association [APA], 2020). However, incorporating student report would have made the observations more disruptive to the classroom. Furthermore, race is a social construct (Willie, 2003) and the way in which observers assessed race may be similarly assessed by teachers and therefore impact constructs of engagement. The same may be true of gender. Nevertheless, future research should consider using student reports of demographic information (APA, 2020).
Conclusion
The results highlight the important role classroom management practices may play in some, but not necessarily all, dimensions of student engagement. The findings that classroom-based behavioral management practices are positively associated with active classroom engagement, whereas school-wide suspensions are negatively associated with teacher connectedness, suggests the importance of positive interactions with students both in and outside of the classroom. On the contrary, it also highlights that multilevel considerations for positive behavior supports are needed. Although teachers’ use of evidence-based classroom management approaches, like OTRs, may influence some dimensions of engagement (Partin et al., 2009; Sutherland et al., 2003), the school-wide approach may influence others. A greater understanding of other classroom factors (e.g., distribution of students by gender and race) that may influence student connectedness in particular is still needed, and consideration to best engage students of particular student groups (e.g., females, Black students) is also needed. Taken together with extant literature, preservice and in-service teacher training should focus on promoting positive and proactive behavior management and strategies for linking these practices to school-wide efforts and engaging students of all demographic backgrounds. Teachers who are more adequately prepared to create positive classrooms may create the ripple effect needed to improve engagement and enhance relationships throughout their buildings.
Footnotes
Declaration of Conflicting Interests
The author(s) declared no potential conflicts of interest with respect to the research, authorship, and/or publication of this article.
Funding
The author(s) disclosed receipt of the following financial support for the research, authorship, and/or publication of this article: The research reported here was supported by the Institute of Education Sciences, U.S. Department of Education, through Grant #R305H150027 and William T. Grant Foundation awarded to Catherine Bradshaw. The opinions expressed are those of the authors and do not represent views of the Institute or the U.S. Department of Education, or the Foundation. The authors would like to acknowledge the Maryland State Department of Education and Sheppard Pratt Health System for their support of this research through the Maryland Safe and Supportive Schools Project.