
Abstract
Long wait-times for orthopaedic consultation in public hospitals, particularly for knee osteoarthritis patients, may be ameliorated when Advanced Practice Physiotherapists (APPs) are integrated into clinical pathways. APPs provide expert comprehensive assessment, accurately identifying patients not requiring surgery. This study aimed to quantify wait-time between general practitioner (GP) referral and consultation with an APP or surgeon outcomes following service changes including increased resourcing of the APP clinics.
Method
This knowledge translation project was evaluated by comparing wait-time to consultation for three, 6-month cohorts from 1 March to 30 September, totalling 563 patients, at baseline in 2022, and post-intervention at year 1 (2023) and year 2 (2024). Evidence-based service changes included expanding APP clinic capacity and improving referral pathways to community osteoarthritis and obesity programs. The proportion of patients seen by APPs rose from 20% at baseline (2022) to 81% in 2023 and 76% in 2024. Concurrently, the health service implemented a digital medical records system. Data were analysed for patient characteristics, wait-times, care pathways (APP, surgeon, or both), and consultation outcomes.
Results
Compared to 2022, wait-times to consultation significantly reduced. Median wait-time fell from 114 days in 2022 to 45 days (86% less) in 2023 and 46 days (90% less) in 2024. Patients seen by APPs experienced fewer delays (Incidence risk ratio (IRR): 0.55; 95% CI: 0.43–0.72), including those seen in both APP and surgeon clinics (IRR: 0.54; 95% CI: 0.41–0.70). Total patients listed for surgery declined from 48% in 2022, to 36% in 2023, and 35% in 2024, while patients directed to a surgeon were twice as likely to need knee replacement in 2023, 2024.
Conclusions
Shorter wait-times appear linked to increased APP clinic activity, improved digital systems, and enhanced access to community programs. These changes supported clinical standards and timely care for patients with knee osteoarthritis.
Keywords
Introduction
There is an urgent need to address wait-time for surgical consultation in the Australian public health system for patients with knee osteoarthritis. 1 Wait-time between general practitioner (GP) referral and surgical consultation is not reported in New South Wales or the Australian Capital Territory (ACT). However, in Victoria in 2022, the median wait to see an orthopaedic surgeon was 769 days. By comparison, the Australian Medical Association found the median wait-time to see a gynaecologist was 454 days and a rheumatologist 468 days. 2 This is referred to as ‘the hidden wait’. Professor Graeme Stewart from the Westmead Institute for Medical Research speaking to Australian Broadcasting Commission News and described the figures as ‘unconscionable’. 3 The Australian Bureau of Statistics 4 recorded that one in three patients living with a chronic condition found specialist wait-times were unacceptable, and that long wait-times and costs were significant barriers to seeking care. Queensland and Victoria have adopted performance indicators based on wait-times, but these are not required nationally. 5 Australian Institute of Health and Welfare defines performance indicators for procedures, 6 based on category of urgency, but without a national standard for consultation delays, categories are widely used to prioritise patients. Category 1 patients being the most urgently in need of care, should see a specialist within 30 days. 5 Category 2 patients are recommended to be seen within 90 days and category 3 patients within 365 days. In orthopaedics, category 1 patients might have fractures or tumours, but importantly rate of change and risk of rapid deterioration are key considerations. People with knee osteoarthritis would usually have urgency of category 2 or 3 depending on factors such as rate of deterioration, resulting in longer wait-times for them.
Best practice guidelines advise health professionals to manage knee osteoarthritis as a chronic condition, using surgery as a last resort.7-10 First-line interventions incorporating exercise, weight loss and education are effective for between 65% and 78% of patients with knee osteoarthritis.11,12 However, a study of 591 patients having total knee replacement (TKR) found 54% had attempted no exercise intervention prior to surgery, and 12% had attempted no non-surgical intervention except analgesia.13,14 That represents a lost opportunity to empower the patient to manage their chronic condition,7,15 coached by allied health professionals in exercise, dietary and non-pharmaceutical pain management interventions. Indeed, the UK National Health Service mandates that a patient must have exhausted non-surgical options prior to surgical review. 8 However, many GPs refer to orthopaedic consultants for expert advice on osteoarthritis management, which can be provided by expert allied health professionals.
Advanced Practice Physiotherapy (APP) clinics in Victoria and the UK have minimised wait-times by providing expert physiotherapy consultation and efficient direction to appropriate care pathways.9,16,17 This expert care is within the scope of practice of APPs to provide as they have postgraduate training and clinical expertise and are licenced to request imaging and limited prescribing. Importantly, when patients were provided with access to the tools, skills and support they needed, they were satisfied to manage their osteoarthritis non-surgically, avoiding knee replacement.7,16 Moreover, systematic reviews of clinical trials demonstrate that APP clinics accurately refer the right patient to surgery at the right time. 18
This project aimed to bring the wait-time between general practitioner (GP) referral and consultation in orthopaedic clinics into acceptable limits, ensuring that public patients have access to best practice care, including non-surgical and surgical interventions. Therefore, the primary research question was to investigate the patients’ wait-time following the increased resourcing of the APP clinics. Secondary outcomes evaluated the patient care pathways and their changes with increased APP management.
Method
Study Design
We applied an ecological knowledge translation approach to the problem of orthopaedic consultation delays. Knowledge translation is used to implement the best evidence from research into clinical practice. Applying the Knowledge to Action model19,20 involves a series of steps that begin with identifying the need, and the best evidence for a solution, and adapting it to the local context. Then barriers and facilitators to implementation are identified and knowledge translation strategies chosen to improve uptake, and by monitoring and evaluation, to move toward sustained practice change. Key features of the application of these principles to this project were. - establishing strong collaboration between consumers, primary health care, public orthopaedic triage teams and surgeons, and the private healthcare sectors; - collecting data on wait-times, patient pathways and patient and health professional experiences at baseline and to establish annual monitoring; - working across health service divisions (for example allied health, surgery and community) to implement service changes.
The study was approved as a low-risk project by ACT Health Human Research Ethics Committee on November 3 2022 (reference: 2022.LRE.00185) and endorsed by University of Canberra Human Research Ethics Committee. This study contained a medical records audit component and interviews component (published elsewhere). For the medical records component, the need for consent was waived as the privacy and confidentiality of patient data were protected, there was deemed low risk to participants and benefits of the project outweighed those risks.
Setting
Canberra Health Service (CHS) delivers publicly funded health care to the population of the ACT and the region, under agreement with the state of New South Wales. CHS comprises three hospitals (two acute, one rehabilitation), and mental health and community care services. This study took place at Canberra Hospital, an acute tertiary care and trauma hospital serving the catchment area including the ACT and surrounding regional New South Wales, with a catchment area of approximately 693,500 people.21,22
Patients in This Population
Patients were included if they were waiting to be seen following referral by a GP to orthopaedic clinics for knee osteoarthritis. Patients included had a diagnosis of knee osteoarthritis documented on the referral, or were aged over 40 years with a history of chronic knee pain. Patients were excluded if the diagnosis was changed by the hospital clinician (for example, to ligament injury or inflammatory arthritis) or if a duplicate referral was received for a patient already seen and waitlisted for surgery.
Patients were excluded if they could not be contacted for an appointment, failed to attend multiple appointments, declined the offer of an appointment as they no longer wanted care within CHS (for example their issue had resolved or they had received treatment elsewhere) or they had died.
Sampling and Data Source
Health service data were collected using prospective medical records audit. Three cohorts of consecutive cases waiting to be seen were captured from 1 March to 30 September of 2022, 2023 and 2024. Records for 2022 were obtained from two data sources; the ACT Patient Administration System (ACTPAS) for those referred prior to March 2022 waiting to be seen and the Clinical Portal for people who had new referrals to orthopaedics during the collection period (Figure 1). In November 2022, the two data sources were transferred into the new digital health records system (DHR (Epic, Verona, Wisconsin), and the DHR was used for data extraction in 2023 and 2024. Pathway of care for patients with knee osteoarthritis referred to orthopaedic clinics for consultation.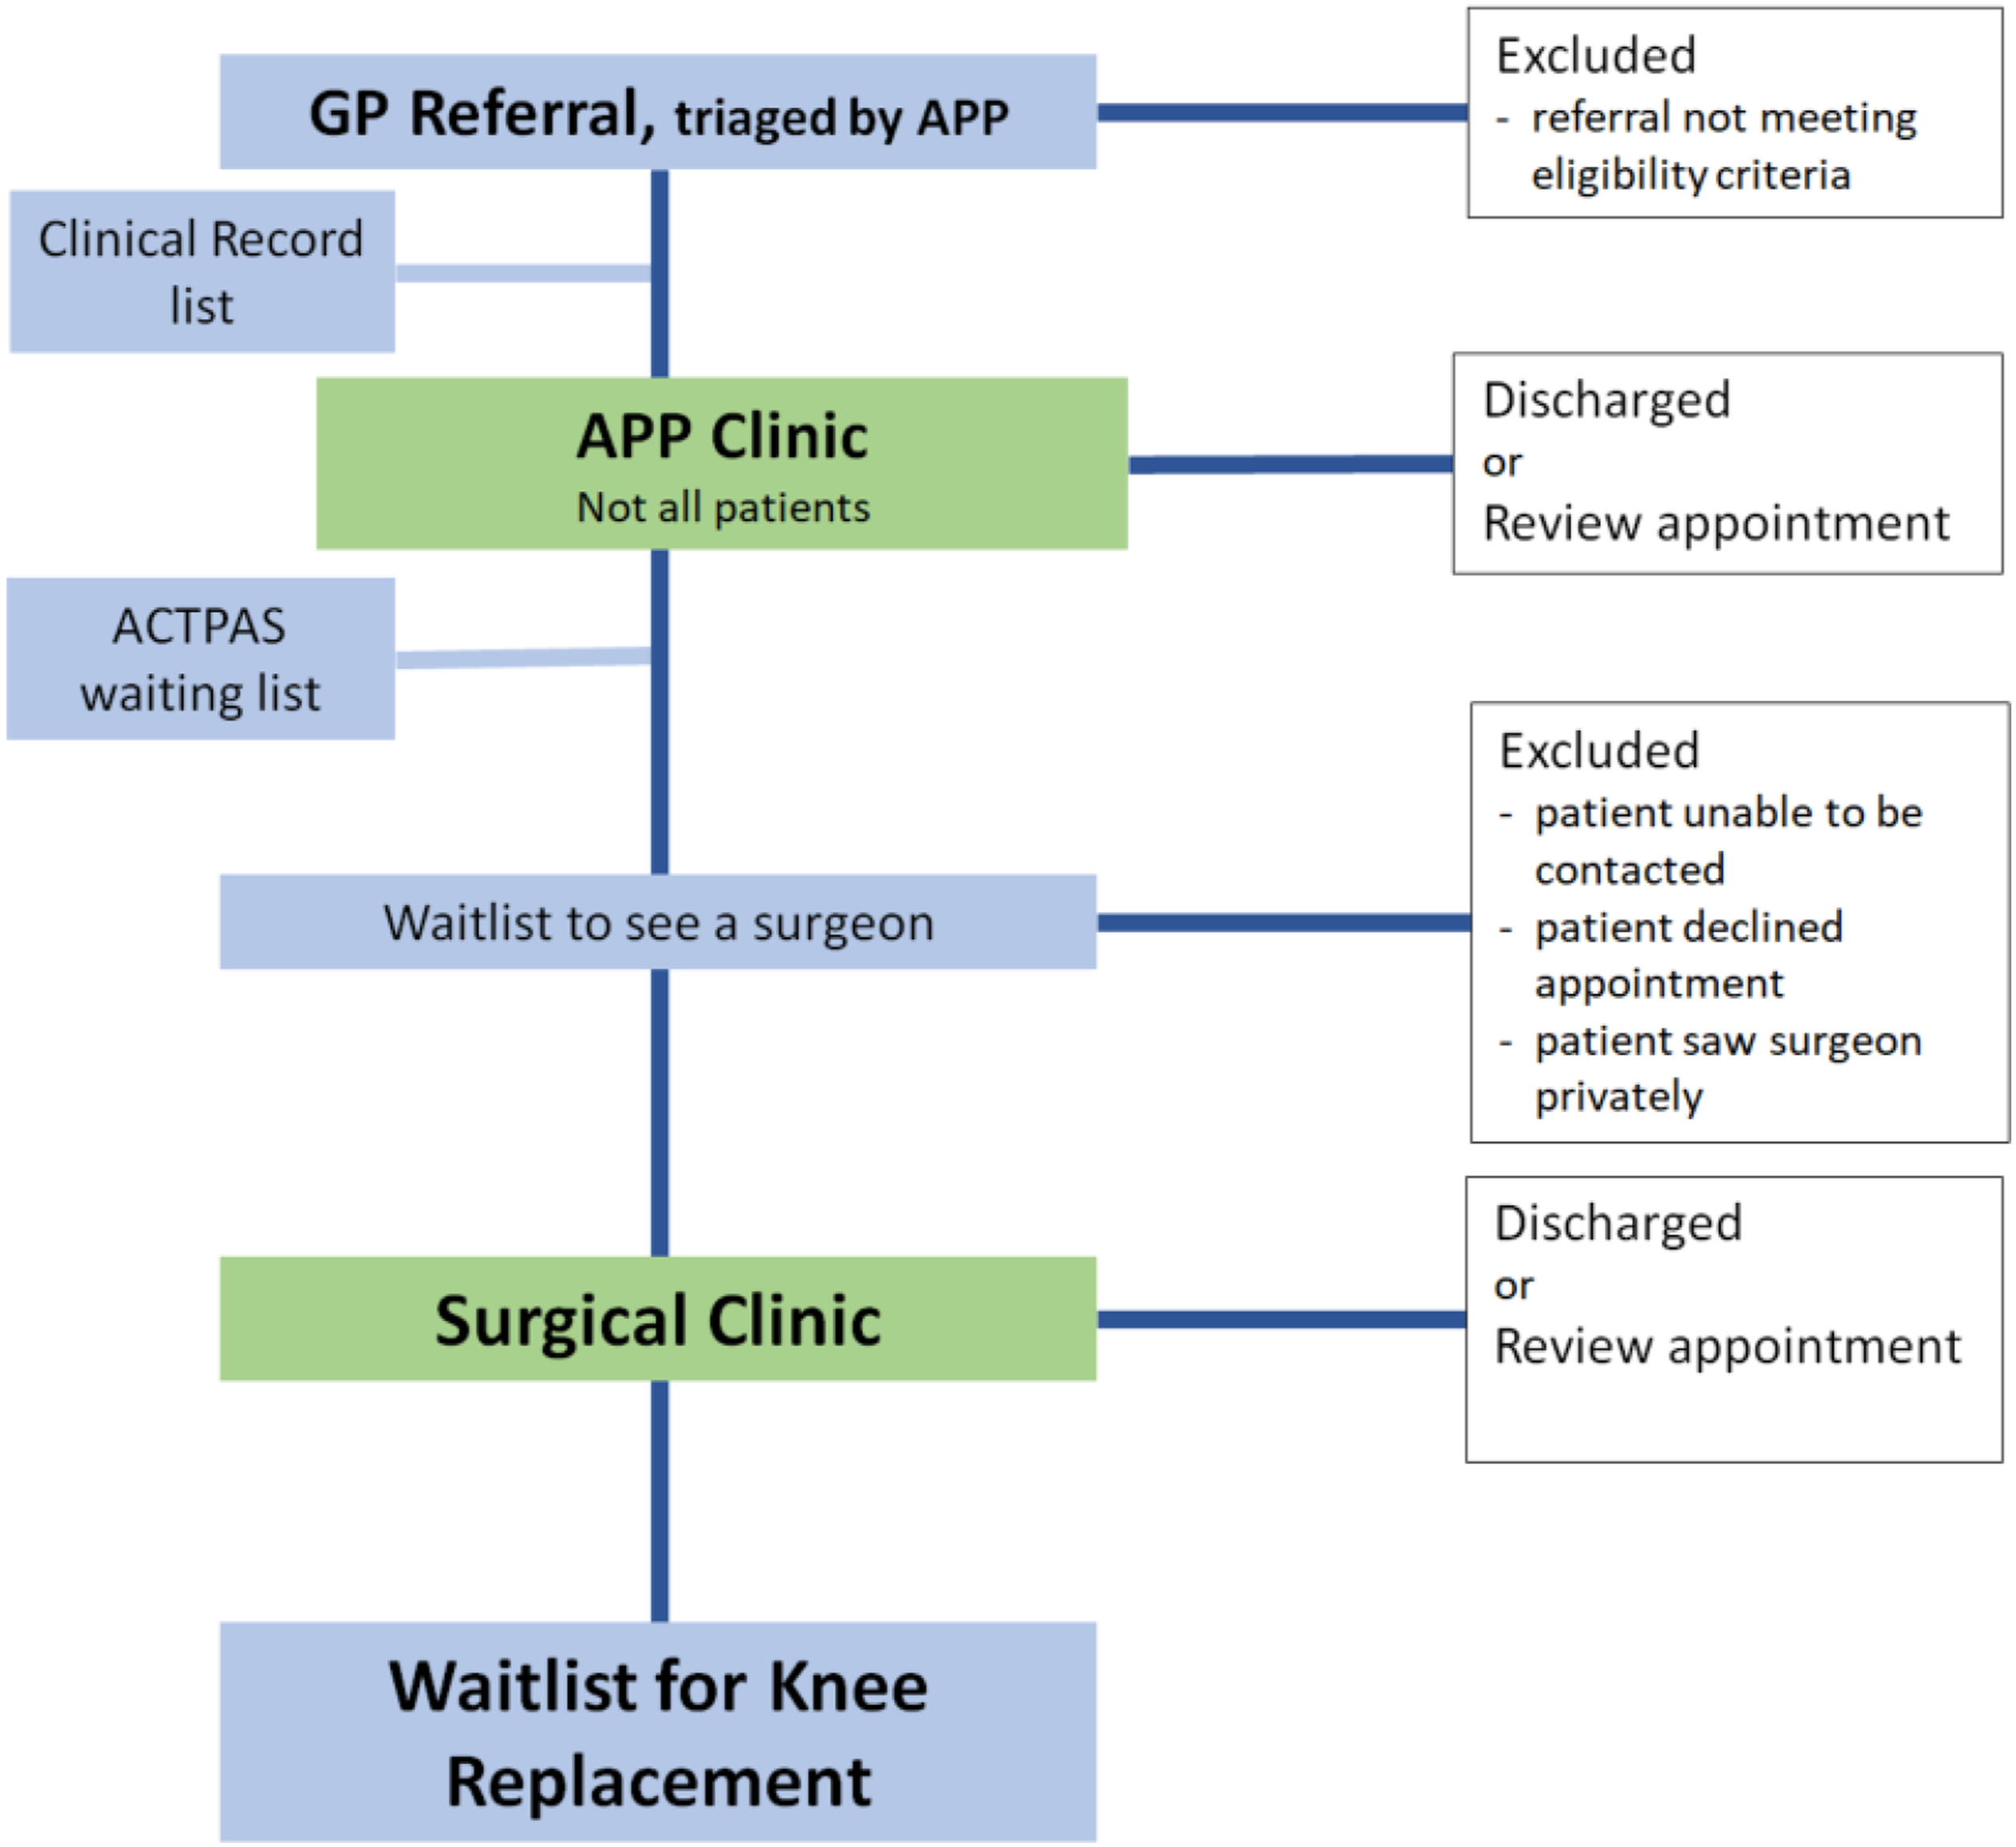
Interventions and Changes to the Health Service Between 2022, and Both 2023 and 2024
At the commencement of the project, standard care involved triage of the referral into urgency category 1, 2 or 3 by the APP. Category 1 patients were booked into surgical clinics and category 2 and 3 patients were waitlisted. Only selected patients were examined in the APP clinic: where APP intervention could significantly improve the efficiency of surgical clinics, such as urgent patients for whom the APP could expedite the surgical work-up, if there were missing details on the referral so that the referral could not be triaged, or if there was a clear indication that the patient had not completed recommended non-surgical interventions. Those patients were brought into APP clinic for examination and rapid referral on.
Aspects of the health services changed during the period of the project, some as a result of the project working party deliberations on implementation of best practice, and some changes were implemented by the health service independently of this project. Collaborating health professionals and project working parties made the following changes: • APP resources were increased from 0.8 full-time equivalent staff in 2022 to 1.5 staff at the start of 2023. • APPs expanded the criteria for patients seen in the APP clinic, from seeing only select patients, to (ideally) seeing all patients with knee osteoarthritis. • From 2023, instead of waitlisting all patients for surgical clinics, category 3 patients seen in the APP clinics were referred to community health services for non-surgical interventions, and only category 1 and 2 patients were waitlisted for surgical clinics. • Physiotherapy teams in the acute and community services streamlined referrals from orthopaedic clinics to access exercise and education programs. • The project team met with the obesity management service to understand demand from patients with body mass index (BMI) over 40, needing intervention prior to knee replacement. • Administrative barriers to referral from acute services to community services were identified and processes improved through negotiation.
Meanwhile, independently of the project, the health service also made the following changes
• A digital patient records system (DHR) was implemented across the service in November 2022, replacing several former data and paper records systems. • Access to Good Life with Arthritis: Denmark (GLA:D) program11,23 in the community health service was increased from one health centre with two classes per week; to two health centres and six classes. • Healthlink e-referral system was upgraded
Primary Performance Measure: Wait-Time to Access Consultation After Referral by a GP
Days waited for consultation were calculated from date of receipt of the referral to date of attendance at either or both of an APP clinic, or surgical clinic. Patient characteristics extracted included age, gender, postcode, language spoken, and care pathways taken by patients as a result of clinical decisions made at consultation.
Patients took one of eight possible care pathways following referral: 1. APP clinic + Discharged (Not seen by a surgeon) 2. APP clinic + Reviewed again by APP (Not seen by a surgeon) 3. APP clinic + Surgical clinic + Discharged from the health service 4. APP clinic + Surgical clinic + Reviewed again by a surgeon 5. APP clinic + Surgical clinic + Waitlisted for surgery 6. Surgical clinic + Discharged from service 7. Surgical clinic + Reviewed again by surgeon 8. Surgical clinic + Waitlisted for surgery
Data Analysis
The primary outcome variable was the patient's wait-time to see a clinician (either a surgeon and/or APP), followed by the patient's care pathway. Independent variables included patient age, gender, place of residence, clinical pathway, cohort year, and surgeon named on the referral. Attached to these variables were the following research questions: • How did wait-time to consult a clinician (in days) compare between the baseline cohort in 2022, to cohorts in 2023 and 2024?
Secondary questions included. • What was the wait-time for each of the care pathways: APP consultation only, surgeon consultation only, both APP and surgeon consultation in 2023 and 2024 compared to baseline year, 2022? • How many patients went through each of the eight care pathways and how did the baseline of 2022 compare to 2023 and 2024? • What were wait-times to see a surgeon for category 2 and category 3 patients?
Finally, to identify the potential predictors of prolonged wait-times, we addressed the following questions, by dichotomising wait-time as ‘within category 1, 2 or 3 recommended time-frames’ yes/no. • What were the predictors of wait-time to see a clinician? • What were the predictors of wait-time to see a surgeon stratified by urgency category? • Which variables predicted an extended wait for surgeon consultation?
Sample size was calculated using G*Power v 3.1.9.4 (University Kiel, Germany), for the primary analysis of wait-time, with three independent groups, power of 0.9, effect size of 0.5, α = 0.05, with one covariate we needed 91 patients in each group, and with four covariates, 92 patients in each group. Given that the number of referrals received at the hospital was greater than this sample size we were able to define the cohort by the calendar periods for each year for consistent seasonal referral patterns, confident sufficient power would be obtained.
Data were checked for completeness and clarity before analysis. The data were collected into Excel (Microsoft, Redmond, Washington) and exported to Stata 17 (StataCorps LLC, College Station, Texas) for further analysis, including data cleaning and recoding.
Results were presented in tables, figures and narrative text using frequency distributions and summary statistics. For each cohort year, the mean, median, 10th percentile and 90th percentile of wait-times to see a clinician were reported. Patients' wait-times to see surgeons were stratified based on whether they attended APP clinic.
Analytical approaches were implemented to compare wait-time over years overall and within care pathways (changes over years to capture the impact of the APP implementation), to identify predictors of wait-time to see a clinician (defined as either APP, surgeon, or APP followed by surgeon) and to identify predictors of extended wait-time to see a surgeon. Since the data on wait-times to see a clinician were count data (not continuous), and were over-dispersed and not normally distributed, a negative binomial regression was implemented. The negative binomial regression model for wait-times to see a surgeon was stratified based on whether the patients attended an APP clinic or not. A cumulative frequency distribution plot was generated to visualise patient wait-times by clinician pathway for each cohort year.
Extended wait-time beyond recommended timeframes was defined for patients in category 2, waiting more than 90 days; and for those in category 3, waiting more than 365 days.5,6 Patients with an extended wait, beyond that recommended were ‘Yes’, and those without an extended wait, who were seen inside recommended timeframes were categorised as ‘No’. Given the binary nature of extended wait-time, a binary logistic regression analysis was conducted to examine its predictors.
Results
Characteristics of Patients in the Three Cohorts
Characteristics of the Study Cohorts 1 March to 30 September, in 2022, 2023 and 2024

ACT= Australian Capital Territory.
Note: for the purpose of this study Queanbeyan was considered together with ACT.
Wait-Time to See a Clinician
Analysis of Wait-Time to See Any Clinician Stratified by Care Pathway. Patient Wait-Times to See a Clinician Reduced Over the Three Year Study Period. This was Most Notable for the 50th and 90th Percentile Data
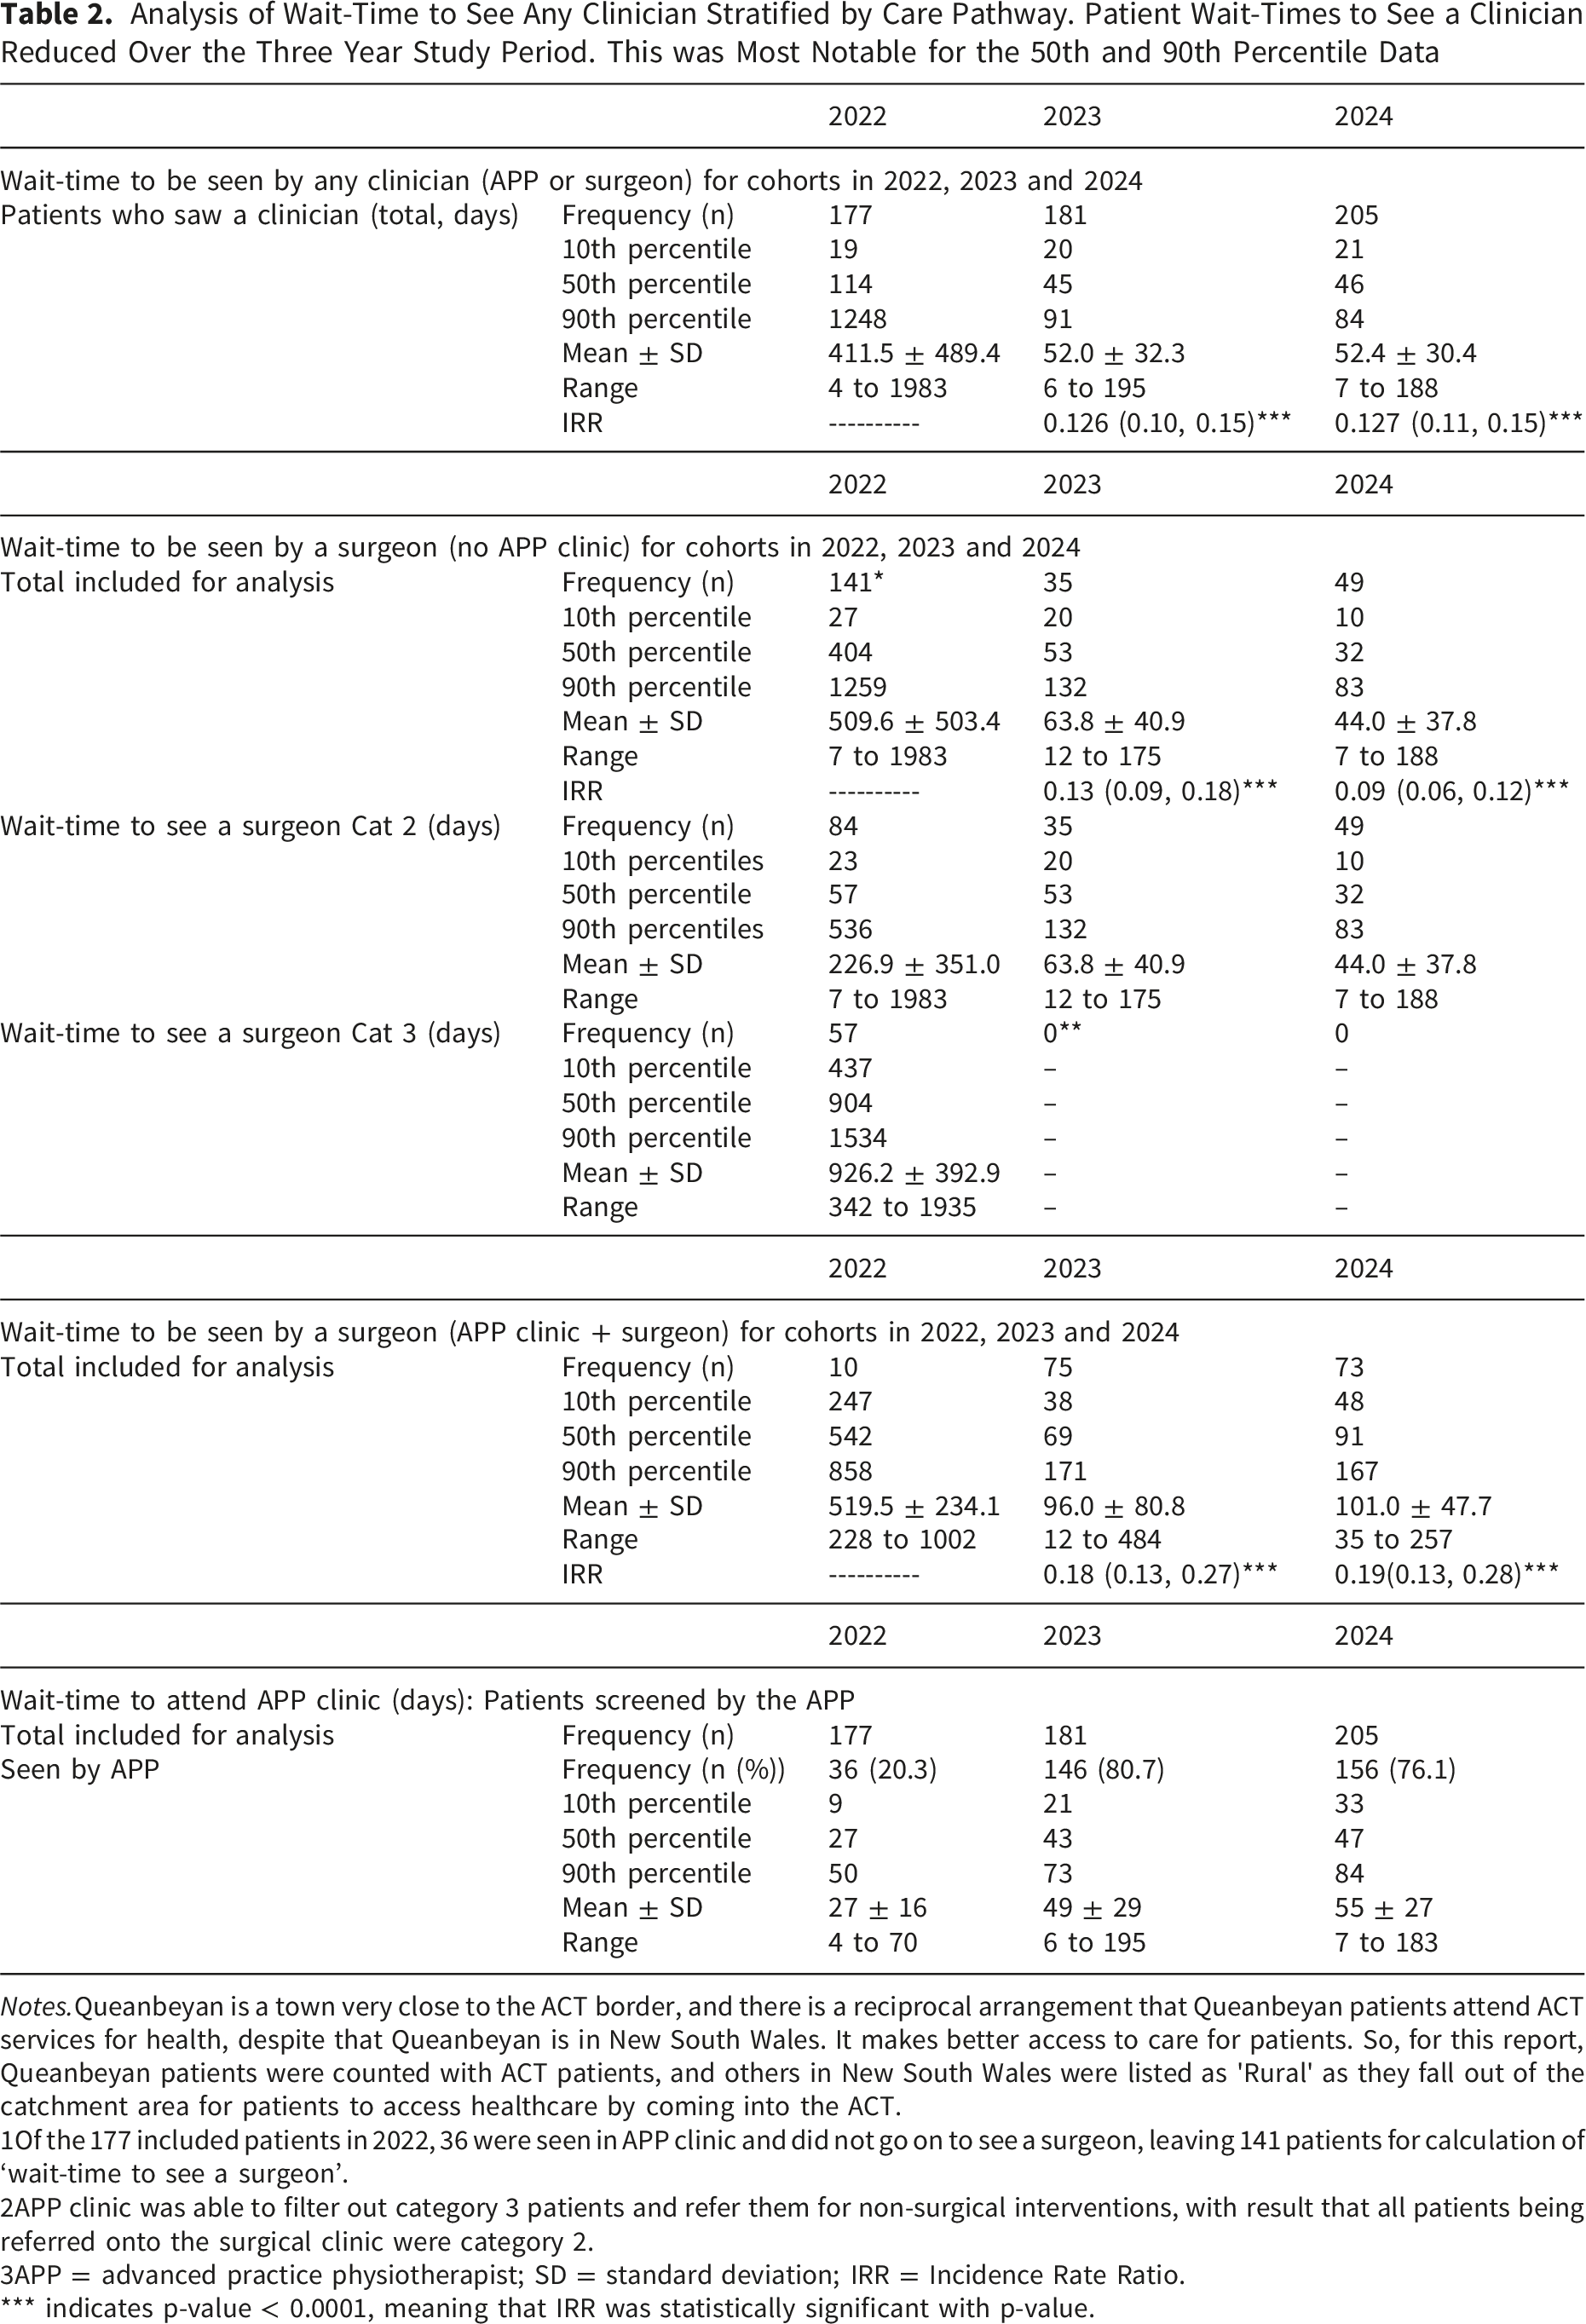
Notes.Queanbeyan is a town very close to the ACT border, and there is a reciprocal arrangement that Queanbeyan patients attend ACT services for health, despite that Queanbeyan is in New South Wales. It makes better access to care for patients. So, for this report, Queanbeyan patients were counted with ACT patients, and others in New South Wales were listed as 'Rural' as they fall out of the catchment area for patients to access healthcare by coming into the ACT.
1Of the 177 included patients in 2022, 36 were seen in APP clinic and did not go on to see a surgeon, leaving 141 patients for calculation of ‘wait-time to see a surgeon’.
2APP clinic was able to filter out category 3 patients and refer them for non-surgical interventions, with result that all patients being referred onto the surgical clinic were category 2.
3APP = advanced practice physiotherapist; SD = standard deviation; IRR = Incidence Rate Ratio.
*** indicates p-value < 0.0001, meaning that IRR was statistically significant with p-value.
Compared to 2022, wait-times were shorter in 2023 and 2024. Indeed, in 2023 patients seeing any clinician waited 0.126 times less; in 2024, 0.127 times less than the time patients waited for in 2022 (see Table 2). To see a surgeon directly, patients waited 0.13 times less in 2023 compared to 2022; in 2024, 0.09 times less than the time they waited in 2022. Patients seen in the APP clinic and referred on to see a surgeon also, waited 0.18 times less in 2023, and 0.19 times less in 2024 compared to 2022 (Table 2).
Patients seen first in the APP clinic were seen faster than those that waited to see a surgeon (Figure 2). Figure 2 describes the cumulative proportion of patients waiting to be seen, demonstrating shorter wait-times for those seen in the APP clinic only or in both the APP clinic and surgical clinic. The pattern remains in 2023 (Figure 3) and in 2024 (Figure 4) although wait-times are shorter (Table 2). The increase in patients seen in the APP clinic appears to have improved access to surgeons, even when patients saw both APPs and surgeons. Wait-times to see clinician (either APP, surgeon, or both) by clinical pathway for the cohort in 2022 Wait-times to see clinician (either APP, surgeon, or both) by clinical pathway for the cohort in 2023 Wait-times to see clinician (either APP, surgeon, or both) by clinical pathway for the cohort in 2024


Wait-times to see a surgeon were stratified based on whether they were first seen in the APP clinic. For the 2022 cohort, a total of 141 patients saw a surgeon directly (without being seen in the APP clinic), compared to 35 in 2023 and 49 in 2024 (Table 2). For the 2022 cohort, the median wait-time to see a surgeon was 404 days, and 90% of the patients saw a surgeon within 1,259 days. In 2023, the median wait-time to see a surgeon dropped to 53 days, and 90% of the patients saw a surgeon within 132 days. Similarly, in 2024, the median wait-time to see a surgeon was 32 days, and 90% of the patients saw a surgeon within 83 days (Table 2).
More patients were seen in the both APP and surgical clinics in 2023 and 2024. For the 2022 cohort, 10 patients were seen in the APP clinic and then referred on to see a surgeon, with a median wait-time of 542 days (Table 2). Comparatively, in 2023, 75 patients were seen in both the APP clinic and surgical clinics, with a median wait-time of 69 days, and in 2024, of the 73 patients seen in both clinics, 50% of them saw a surgeon within 91 days (Table 2).
Extended Wait-Time to See a Surgeon
Extended Wait-Time to See a Surgeon for Cohorts in 2022, 2023 and 2024 by Triage Category, Directly Without Seeing the APP First, and if the APP was Seen First

Note. Following assessment in the APP clinics in 2023 and 2024, all category 3 patients were referred to the community health services for non-surgical interventions, and only category 2 patients were referred on to the surgical clinics. APP = advanced practice physiotherapist.
Wait-Time to Be Seen by an Advanced Practice Physiotherapist (APP) in 2022, 2023 and 2024

Note. APP = advanced practice physiotherapist; SD = standard deviation.
Wait-Time to Be Seen in APP Clinic
Waiting times to be seen in the APP clinic became slightly longer as the number of patients seen rose. For the 2022 cohort, the median wait-time to be seen in the APP clinic was 27 days and 90% of patients were seen within 50 days (Table 2). In 2023, wait-time to be seen in the APP clinic was longer, median 43 days, and 90% of patients were seen within 73 days and in 2024, 47 days while 90% of patients were seen within 84 days (within recommended time-frames for category 2 patients).
Predictors of Wait-Time to See a Clinician
In the negative binomial regression analysis, only clinician care pathway and cohort year were identified as significant predictors of wait-time to see a clinician. Patient age, gender, and postal code did not predict wait-time.
Prediction of Factors That Impact Wait-Times to See Any Clinician, See the Surgeon Directly, or Be Seen in Both the APP and the Surgeon, Analysed by Negative Binomial Regression, and Factors That Predict Extended Waiting Beyond Recommended Timeframes, Analysed by Binary Logistic Regression

Note. CI = confidence interval; IRR = incidence rate ratio; SE = standard error.
Wait-Time to See a Surgeon Stratified by APP Clinic Status
In the adjusted stratified analysis, cohort year (as expected) and the surgeon seen were the only significant determinants of wait-time to see a surgeon in both groups: those patients who were seen in the APP clinic and those who were not. As shown in Table 5, the adjustment for other factors did not appreciably impact the effect of cohort year on the wait-time within the pathways (compared to results in Table 2). Indeed, for patients being seen through a surgeon-only pathway, patients in the 2023 (IRR: 0.14: 95%CI: 0.09, 0.20) and 2024 (IRR: 0.1: 95%CI: 0.07, 0.14) cohorts had shorter wait-times to see a surgeon compared to patients in the 2022 cohort (compared to IRR values of 0.13 and 0.09, respectively). Similarly, for patients seen through the APP clinic pathway, being in the 2023 (IRR: 0.21: 95%CI: 0.15, 0.29) and 2024 (IRR: 0.20; 95%CI: 0.14, 0.28) cohorts was associated with shorter wait-time to see a surgeon compared to patients in the 2022 cohort (Table 5) (compared to IRR values of 0.18 and 0.19, respectively).
Predictors of Extended Wait-Time to See a Surgeon Stratified by Care Pathway
Binary multivariable logistic regression models showed that for patients seen though a surgeon-only pathway, cohort year, age, gender, and surgeon seen, were significant predictors of the odds of extended wait-time to see a surgeon. For the 2023 cohort (Adjusted odds ratio (AOR): 0.11; 95% CI: 0.04, 0.31) and 2024 (AOR: 0.02; 95% CI: 0.004, 0.09) cohort, ‘years’ were associated with lower odds of having an extended wait-time. Patient age of 75 years and above (AOR: 0.33; 95%CI: 0.11, 1.00) was marginally associated with lower odds of extended wait-time; being male (AOR: 0.47; 95%CI: 0.23, 0.95) was associated with lower odds of extended wait-time compared with being female; and patients seeing Surgeons C, E or P had lower odds of extended delay to see a surgeon (Table 5).
For patients seen through the APP clinic pathway, surgeon seen was the only significant predictor of the odds of extended wait-time. Seeing Surgeon P had lower odds of delay to be seen (AOR: 0.06; 95%CI: 0.004, 0.71).
Care pathways for patients with knee osteoarthritis.
The proportion of patients seen in the APP clinic increased from 2022. In 2022, the APPs saw 36 of the 177 patients (20.3%). In 2023 the APPs saw 146 patients (80.7%) and in 2024 saw 156 patients (76.1%) (Figure 5). The number of patients who were seen in both the APP clinic and surgical clinics increased from 2022 (Figure 5). In 2022, of the 36 patients seen by an APP, 27.8% were then listed for consultation with a surgeon. In 2023 and 2024 respectively, 51.4% of the 146 patients and 46.8% of the 156 patients who were seen by an APP then saw a surgeon (noting that the criteria for patients seen in the APP clinic had changed from filtering for those patients whose referrals showed non-surgical interventions had not been attempted, to endeavouring to see all patients with knee osteoarthritis referred to orthopaedic clinics). In 2022, many referrals were received for patients who had not exhausted non-surgical care. Patient pathways: proportion of patients seen in APP clinic (blue), surgical clinic (green) or both (pink), and discharged, returned for review or listed for surgery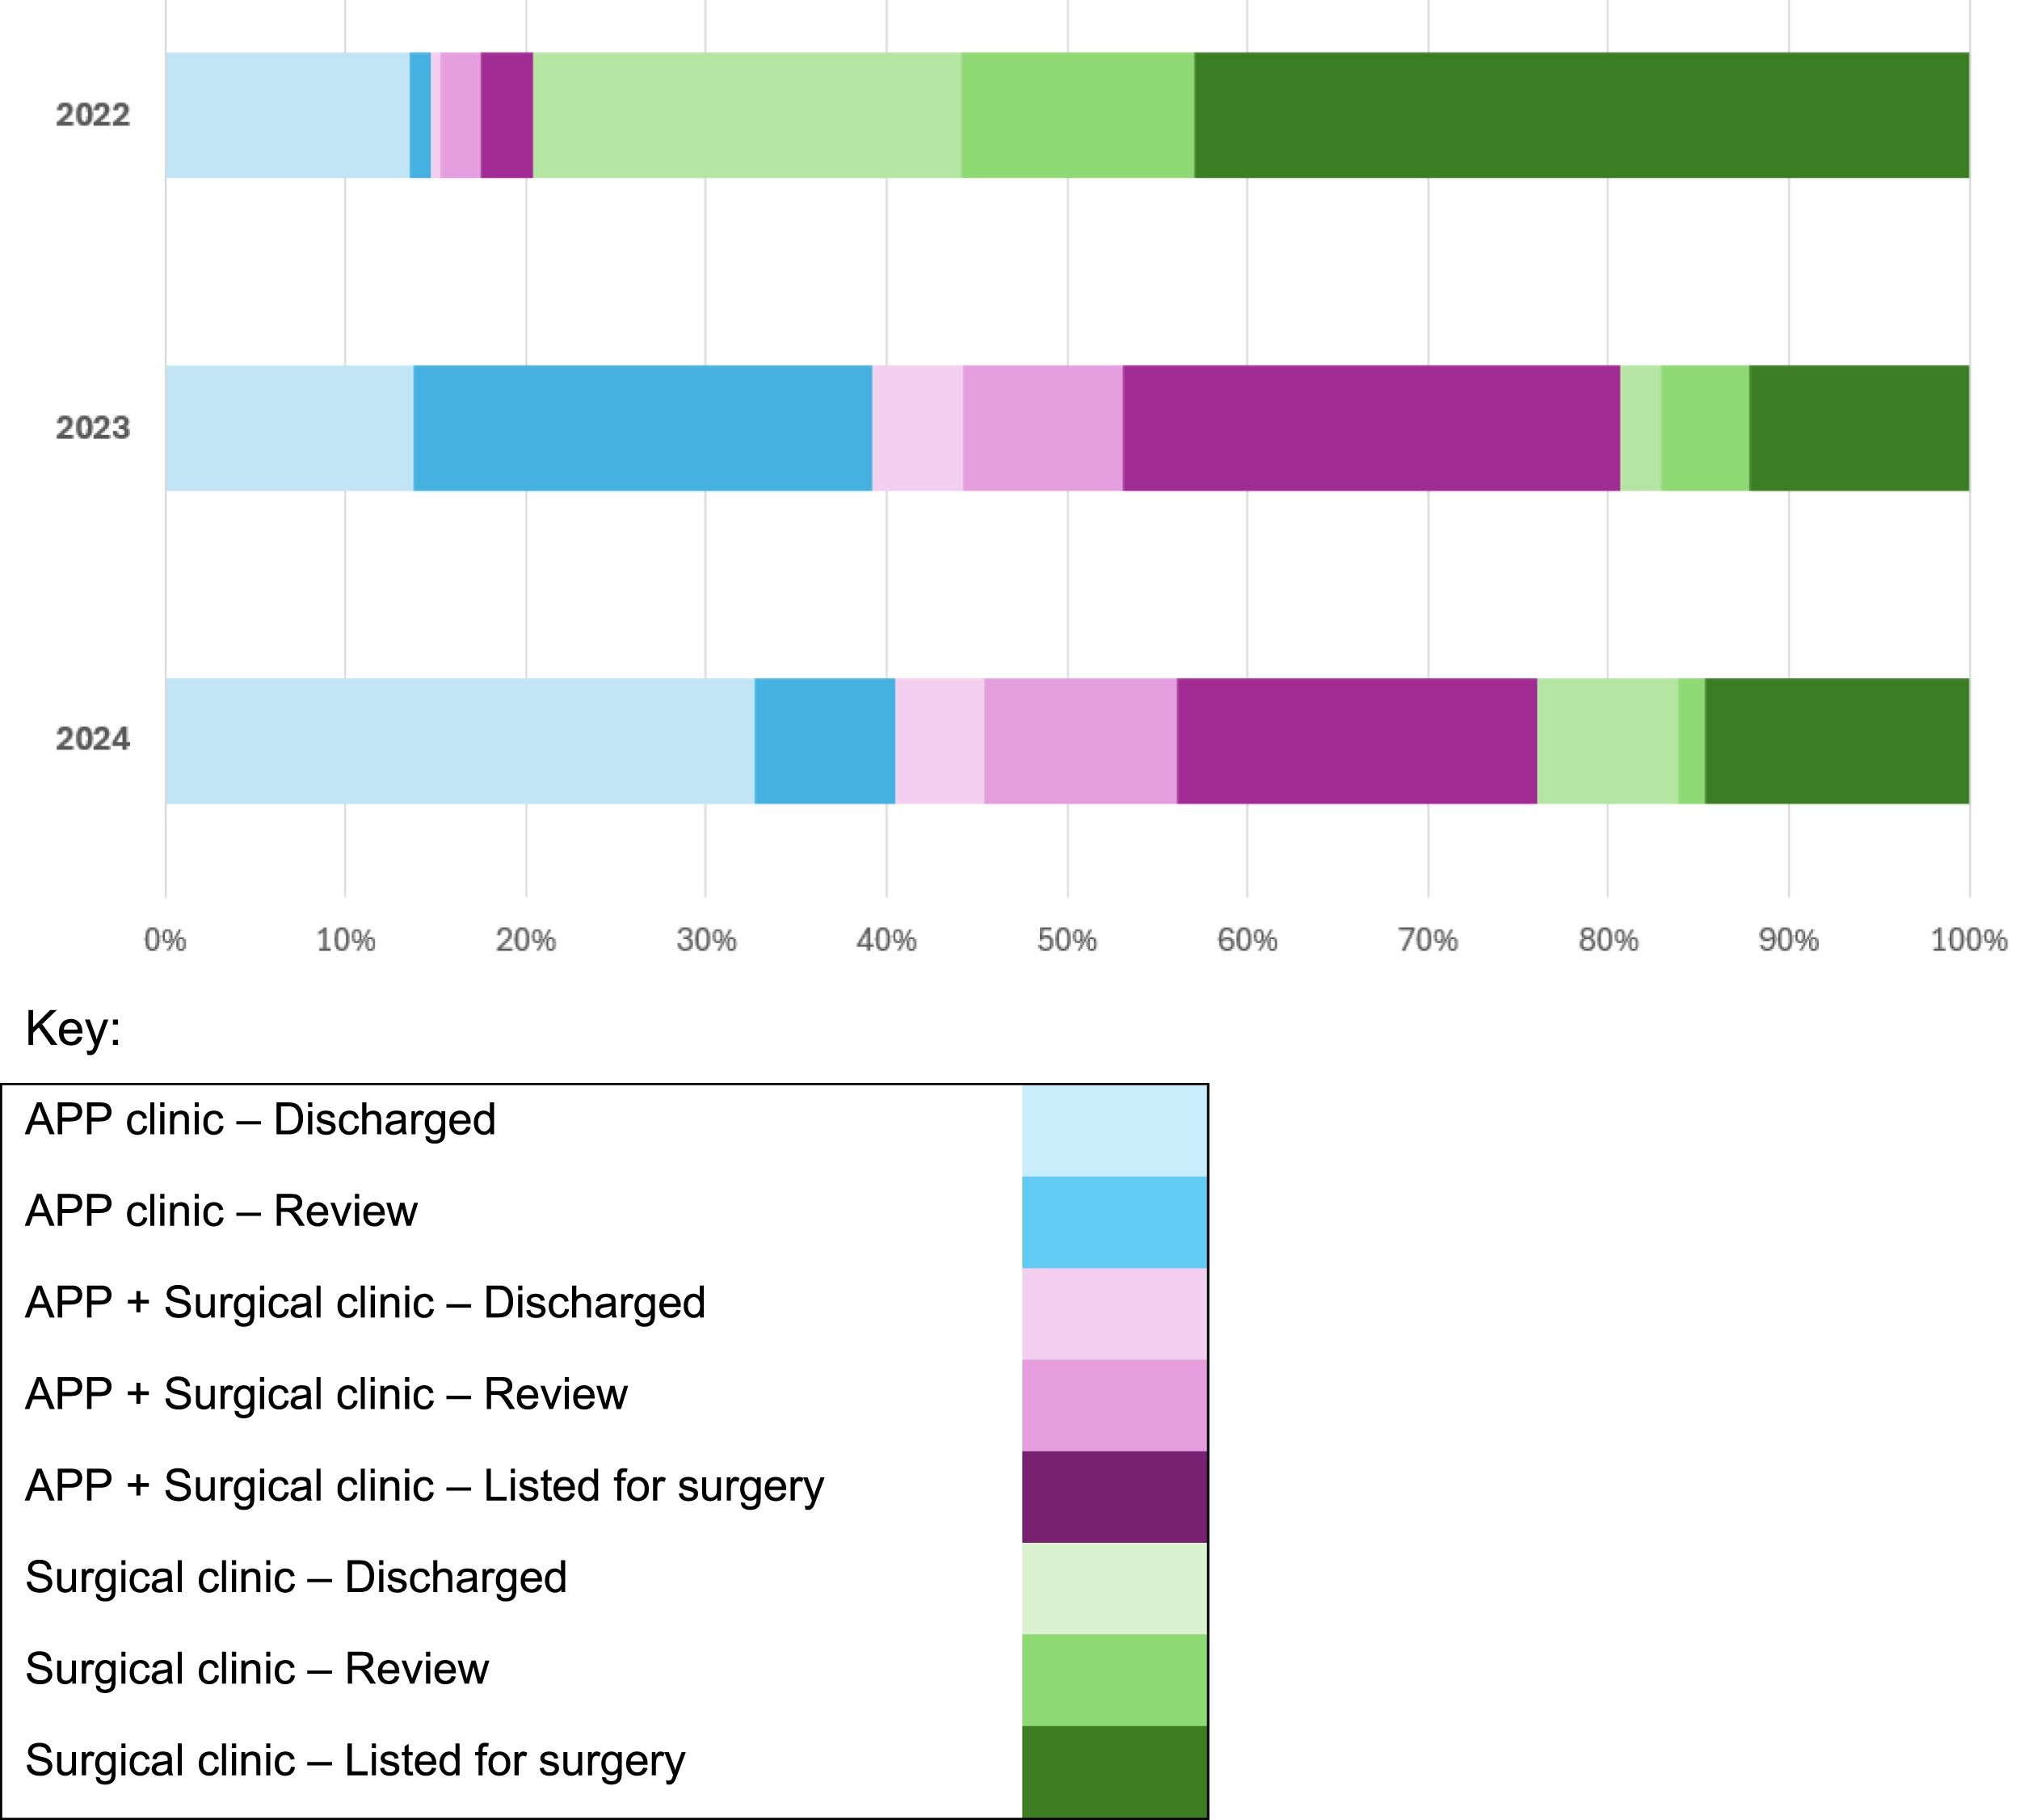
The proportion of all patients referred by GPs to Canberra Hospital with knee osteoarthritis finally listed for total knee replacement, fell from 81 patients (45.8%) of the 2022 cohort to 72 (37.8%) of the 2023 cohort and 71 (34.6%) of the 2024 cohort (Figure 5).
GPs commonly sent multiple referrals. Of the 2022 cohort who saw a surgeon, 24% had more than one referral. Long wait-times, and two sources of patient records, the clinical record and the ACTPAS list, may have resulted in lost referrals and poor systems coordination. Shorter wait-times, and commencement of the DHR in November 2022 may have contributed to resolve multiple referrals.
Metrics of Dissatisfaction With the APP Clinic
Patients Seen in the APP Clinic Re-referred to Orthopaedics

Note. APP = advanced practice physiotherapist; CCPT = Canberra Health Service Community Care Physiotherapy; GLA:D = Good Living with osteoArthritis: Denmark program; TKR = total knee replacement.
Of those re-referred patients, some were booked for review appointments as a safety net by the APP. One in 2022 returned to the clinic following GLA:D intervention as they had not improved, and they were listed for TKR. In 2023, 10 patients returned for review appointments in the APP clinic after non-surgical interventions (four attended GLA:D, three attended community physiotherapy, and three had not engaged with their recommended non-surgical management). The outcome of the surgeon’s consultation with these patients was: six were referred for TKR, and those that had not engaged with non-surgical intervention referred back to it by the surgeon. One patient was referred to the obesity management service.
Patients Referred to Orthopaedics Ready for Surgery
Orthopaedic surgeons have two key roles in Australian public hospitals. First, to provide specialist advice and consultation for patients with complex orthopaedic problems such as high-risk or urgent conditions such as tumours or complex comorbidities referred by GPs. Second, to see patients requiring elective orthopaedic surgery in the public health service. Patients referred for advice for conditions such as mild knee osteoarthritis, who have not reasonably exhausted non-surgical management, are not a high priority for orthopaedic surgical consultation. The term used by clinic teams was ‘ready for care’. Analysis of patients seen in the APP clinic compared to those seen only in the surgical clinic, shows no difference in the proportion of patients referred who were listed for surgery, or discharged from care (chi2 = 0.57, p = 0.449) (Supplementary Table 1). In 2022 there was no difference between the proportion of patients listed for surgery if seen by the surgeon directly, or if seen in the APP clinic first (chi 2 = 0.057, p = 0.811). Likewise there was no difference in these proportions in 2023 (chi 2 = 0.15, p = 0.69) and 2024 (chi 2 = 0.579, p = 0.31).
Analysis of each year cohort for patients seen by a surgeon, comparing the proportion listed for surgery compared to those discharged from care, shows that patients referred in 2023 and 2024 were 1.9 times more likely to be listed for surgery than a patient seen in the surgical clinic in 2022 (Odds ratio 1.9; chi 2 = 6.5, p = 0.01) (Supplementary Table 2 and Figure 5). These patients seen by a surgeon may have been seen in the APP clinic prior to the surgical clinic, but it means surgeons were twice as likely to see a patient needing a knee replacement.
Discussion
Changes in practice, including increasing the resourcing and function of the APP clinic, streamlining cross division communication and referrals within the health service, and implementation of the DHR, markedly improved wait-time to consultation in the orthopaedic clinics by an APP or surgeon. The greatest determinant of wait-time and of the risk of exceeding clinically recommended wait-times, was cohort year, incorporating all of the health services changes in the observed period.
Key Findings in Context
Wait-time to clinician consultation was significantly reduced for people with knee osteoarthritis for the 2023 and 2024 cohorts. This outcome was influenced by each component of health service change, meaning the influence of each aspect of service change cannot be attributed individually. Concurrently, resources to the APP clinic were increased, the DHR implementation, the enabled tracking of referrals and improved cross-divisional streamlining of referrals. Also, during this time, the provision of community programs increased, and APPs worked with GPs to improve the completeness of referrals to orthopaedics. At baseline, patients with knee osteoarthritis were likely to have wait-times exceeding recommended clinical timeframes.5,24 This health service performance was an outlier compared to data from ‘all specialist clinics’ reported in other states of Australia. For example, in Victoria, 89.7% of non-urgent patients were seen in recommended timeframes, and Tasmania had a median wait of 536 days for non-urgent patients. For orthopaedic clinics, category 3 patients’ 90th percentile wait-time was 720 days in Queensland and 800 days in Victoria. 2 This project has since demonstrated that wait-times can be improved by collaborative systems changes.
We found that many patients referred to orthopaedic clinics were not listed for surgery. Data from the Australian Bettering the Evaluation and Care of Health (BEACH) study showed that GPs referred 68% of patients with knee osteoarthritis to an orthopaedic surgeon, and just 18% to physiotherapy, 13 despite positive evidence for exercise interventions. 11 The average age of the referred patients, at 62 years, suggests that patients were being referred before TKR was indicated (national mean age for TKR in 2024 was 68.5 years. 25 We propose that GPs were referring their patients early in response to the history of long wait-times, or for consultation and advice, not necessarily surgery.
Long wait-times and inefficiencies in administration were demonstrated by the low conversion from referrals to clinic appointments in 2022. Many patients had duplicate referrals as their GPs tried to expedite consultation, and patients sought treatment privately, moved away or died while waiting, due to the long delays. Of patients who saw a surgeon, 24% had two or more referrals for their knee osteoarthritis. Systems improvements such as e-referral systems which enable GPs and patients to track referrals, and communication strategies with primary care groups and networks have provided more transparency and confidence in systems and less administration waste.
Efficiency of the APP clinic was demonstrated by the low number of re-referrals for patients seen in the APP clinic, and the number of people who had consultation in the APP clinic and did not need to see a surgeon (Figure 5). Evans 2021 showed APP were highly regarded as expert clinicians and no adverse events were reported in a systematic review of 191 studies. 24 Lafrance 2023 in a systematic review including 19 concordance studies and six clinical trials, found high levels of concordance between APPs and orthopaedic surgeons on clinical decisions. Internationally APPs are able to support access to care efficiently for orthopaedic patients. 18
Commentary on the Health Service Changes and Impact on Project Outcomes
Implementation of the DHR brought close to 40 different data and administration applications into one system. Importantly, two record systems in orthopaedics, the Clinical Record and (Australian Capital Territory Patient Administration System (ACTPAS) were incorporated into the DHR. The new systems enabled tracking of patients across and between health services, and tracking referrals from GPs into the health service. GPs and patients were given visibility of a referral received and logged, though not estimated wait-time. This decreased repeat referrals being written.
Community health service resources need to be in place to provide non-surgical care. In 2023, independently of this project, the health service was funded to provide GLA:D programs at additional community health centres. Additionally, a requirement that patients over 65 years complete a “My Aged Care” application was removed, making access to the program easier. In 2024, the health service enlisted a team to develop the ACT Osteoarthritis of the Knee Clinical Care Standard, to bring CHS in line with the Australian Commission for Safety and Quality in Health Care standards. 7 The team was led by the Allied Health Manager of the Community Care Program and engaged allied health, nursing, and quality and safety in healthcare staff to develop, implement and monitor the standard. It functioned to provide a locally endorsed guideline and a reporting structure for quality and safety assessment.
Strengths and Limitations
This was an ecological and pragmatic study and is therefore limited by lack of control data, and by several concurrent events and activities occurring during the implementation. Data were collected from medical records, particularly in 2022 two different sources (Clinical Portal and ACTPAS) which allowed for differences in some data definitions and accuracy. In 2023 and 2024, the DHR provided a single source of data. Consequently this can be considered as three snapshot time periods, with several differences between them, and in particular between the data sources in 2022, compared to 2023 and 2024. Though efforts were made to retrieve as complete a dataset as possible, data were limited by what was recorded. Patient characteristics, such as weight and BMI were not recorded consistently in records, so that analysis of those characteristics was not possible. 26
Wait-times in for the 2022 cohort, may have been inflated post-COVID-19, as the community was emerging from the pandemic. During the pandemic elective surgery was paused to prioritise acute health services, resulting in a delay for patients with chronic health conditions. 2 There were post-COVID delays to joint replacement,25,27 and increased numbers of people seeking hospital outpatient services nationwide.2,25 The median wait-time for TKR surgery peaked in 2022, at 308 days in 2022–23, falling to 265 days in 2023–24. 27 Our health service addressed delays for post-COVID patients by contacting people waiting for orthopaedic consultation in 2021 to update the waiting list with current patient status. However, despite this effort, in 2022 there were still many patients on the waitlist to see a surgeon, who no longer needed consultation and did not attend orthopaedic clinics.
Some of the improvement in wait-times may be attributed to other factors than health service changes. For example, Hawthorne effect. 28 Conducting a project such as this, involving an extensive network of stakeholders and reporting observations, will have changed behaviours of those observed. Recording and reporting metrics is known to change behaviour 29 and is increased when “designed to help recipients prioritise and take action on high-priority clinical issues and with the following characteristics: 1. targets important performance metrics where health professionals have substantial room for improvement (audit)”. 29 To manage this effect, the project used mixed methodologies including stakeholder interviews and focus groups, published elsewhere.
Conclusions
In conclusion, wait-times were successfully addressed for those patients with knee osteoarthritis through a range of diverse and interconnected strategies and activities of the service. These strategies included resourcing the APP clinic to see all patients with knee osteoarthritis, increasing community health provision of exercise and education programs, and streamlining referrals and communication between services. meanwhile the health service implemented a digital record system which facilitated patient tracking. As an ecological knowledge translation project, there is no control group. This project was limited to patients with knee osteoarthritis and may even have been detrimental to patients with other conditions referred to orthopaedics due to the attention on knee osteoarthritis. However, it has been demonstrated that APP clinics can effectively and efficiently filter those patients requiring specialist consultation and expediently direct those for whom first-line interventions are indicated to that care. Future research on the barriers and enablers to implementing the model of care is needed and an economic analysis of the model, in order to use healthcare resources most efficiently for the best patient outcomes. Future applications suggest this model of care is applied to patients in orthopaedics with other conditions and potentially other clinics with excessive wait-times in the health service where advanced allied health practitioners have the skills to support the specialist medical teams.
Supplemental Material
Supplemental Material - Reducing Wait-times for Orthopaedic Consultations for Patients with Knee Osteoarthritis Through Advanced Practice Physiotherapy
Supplemental material for Reducing Wait-times for Orthopaedic Consultations for Patients with Knee Osteoarthritis Through Advanced Practice Physiotherapy by Jennie M Scarvell, Danealle Gilfillan, Tahlia J Stewart, Carol A McCrum, Angie M Fearon, Joseph T Lynch, Tom Ward and Theophile Niyonsenga in Health Services Insights.
Footnotes
Acknowledgements
We are grateful to Misganaw Worku for assistance with statistical analyses. We are very grateful to the steering committee, the health services staff, community health professionals and community members who have participated in stakeholder consultation and working parties throughout the project, especially Rebecca Davey Arthritis Australia and Linda Trompf, Health Care Consumers Association.
Author Contributions
JMS: Conception and design, methodology, formal analysis, supervision, visualization, data analysis and interpretation, writing draft and final manuscript, review and editing. DG: project administration, data collection, curation and validation, contextualisation of findings and interpretation, writing – original draft, review and editing TS: methodology, data collection, validation and curation, project administration, interpretation of findings and contextualisation, writing, review and editing; CMcC: contextualisation of findings and interpretation, writing original draft, review and editing. AMF: Conception and design, methodology, supervision, interpretation of findings, writing, review and editing. JTL: Conception and design, methodology, formal analysis, supervision, data validation and interpretation, writing review and editing. TW: Conception, interpretation of results, review of manuscript. TN: Conception and design, methodology, supervision, formal analysis, visualization and interpretation, writing manuscript, review and editing.
Funding
The authors disclosed receipt of the following financial support for the research, authorship, and/or publication of this article: This project was funded by a translation grant from HCF Foundation, Australia.
Declaration of Conflicting Interests
The authors declared the following potential conflicts of interest with respect to the research, authorship, and/or publication of this article: Authors Danealle Gilfillan, Carol McCrum, Tahlia Stewart, Joe Lynch are employees of the health service at which the research was conducted. Authors Jennie Scarvell, Angie Fearon, and Theo Niyonsenga have no conflicts of interest to declare.
Supplemental Material
Supplemental material for this article is available online.
References
Supplementary Material
Please find the following supplemental material available below.
For Open Access articles published under a Creative Commons License, all supplemental material carries the same license as the article it is associated with.
For non-Open Access articles published, all supplemental material carries a non-exclusive license, and permission requests for re-use of supplemental material or any part of supplemental material shall be sent directly to the copyright owner as specified in the copyright notice associated with the article.