



Abstract
Background:
Rice and wheat are the 2 dominant global cereal staples, differing substantially in starch composition and glycaemic impact. Polished rice is typically rich in amylopectin, promoting rapid postprandial glucose responses, whereas wheat-based foods contain relatively more amylose and fibre, resulting in slower digestion. While diet is a key determinant of type 2 diabetes (T2D), it remains unclear whether long-term exposure to contrasting staple diets is associated with differences in inherited genetic susceptibility at the population level.
Methods:
We applied a population genomics approach to compare polygenic risk scores (PRS) for T2D between historically rice- and wheat-dominant populations. GWAS summary statistics from the IEU OpenGWAS resource were used to derive SNP weights, and genotype data from GenomeAsia 100K and HumanOrigins datasets were analysed. PRS were computed using PRSice, and group differences were assessed using Welch’s 2-sample t-test at global and South Asia–specific levels.
Results:
At the global scale, rice-based populations exhibited significantly higher and more dispersed PRS distributions than wheat-based populations, with strong statistical support (t = −32.758; P = 2.2 × 10⁻16). In contrast, South Asia–only analyses showed substantial overlap between dietary groups, with only a modest difference (t = −2.281; P = .02), likely reflecting dietary heterogeneity, admixture, and complex population structure.
Conclusions:
These findings support a gene–diet coevolutionary framework in which long-term staple carbohydrate environments may influence the distribution of genetic susceptibility to T2D. The results emphasise the importance of carbohydrate quality in metabolic health and highlight the need for culturally and regionally tailored dietary strategies. However, PRS should not be used for individual-level clinical prediction, particularly across diverse ancestries.
Keywords
Introduction
Rice and wheat are the 2 most widely consumed cereal grains worldwide and together provide a major proportion of daily caloric intake for humans. 1 However, their consumption patterns vary substantially across geographical regions due to differences in climate, agricultural practices, cultural traditions, and historical dietary habits. Rice is predominantly consumed in Asian countries, particularly South Asia, East Asia, and Southeast Asia, whereas wheat-based foods such as bread dominate diets in Europe, North America, and parts of the Middle East. These long-standing dietary preferences have resulted in population specific carbohydrate exposure patterns, which may influence metabolic health outcomes.2,3
Asia accounts for more than 90% of global rice consumption, with countries such as China and India being the largest producers and consumers of rice. 3 In contrast, wheat production and consumption are highest in Europe, North America, and parts of Central Asia, where temperate climates favour wheat cultivation. In India, dietary intake reflects regional diversity: rice is the primary staple in southern and eastern regions, while wheat is more commonly consumed in northern and western regions. National dietary surveys indicate that a large proportion of the Indian population consumes rice, wheat, or both, depending on geography and socioeconomic status (NNMB, India). 4
Rice and wheat differ significantly in their biochemical composition, particularly in the structure of starch, which is composed of 2 major polysaccharides: amylose and amylopectin. Rice, especially polished white rice, generally contains a higher proportion of amylopectin, a highly branched polymer that is rapidly digested and absorbed. 5 Wheat starch, on the other hand, contains relatively more amylose, a linear polymer that is digested more slowly and produces a lower postprandial glycaemic response. These differences in starch structure are important determinants of glucose metabolism and insulin demand. 6
Amylopectin-rich foods are associated with rapid increases in blood glucose levels, leading to higher insulin secretion. 7 Chronic consumption of such high-glycaemic carbohydrates may contribute to insulin resistance and metabolic stress. In contrast, amylose-rich starches are digested more slowly, resulting in a moderated glucose response and improved insulin sensitivity. Thus, habitual consumption of rice- versus wheat-based diets may differentially influence metabolic health, particularly in populations with high carbohydrate intake. 8 These biochemical differences suggest that habitual consumption of high-amylopectin rice may place greater glycaemic stress on populations over generations.
Type 2 diabetes mellitus (T2D) is a chronic metabolic disorder characterised by persistent hyperglycaemia resulting from insulin resistance, impaired insulin secretion, or both. 9 First clinically distinguished in the early 20th century, T2D has emerged as a major global public health challenge, with rapidly increasing prevalence worldwide. The disease is associated with multiple phenotypic and metabolic alterations, including obesity, dyslipidaemia, chronic inflammation, and progressive pancreatic β-cell dysfunction. 10
Excessive carbohydrate intake can lead to increased circulating glucose levels, enhanced glycogen and lipid deposition, and sustained insulin demand. 11 Over time, reduced insulin sensitivity and declining insulin availability contribute to chronic hyperglycaemia and disease progression. These metabolic disturbances manifest both internally and phenotypically, affecting multiple organ systems and increasing the risk of cardiovascular and microvascular complications. 12
Importantly, insulin response varies depending on the type of starch consumed. Amylopectin-rich carbohydrates elicit rapid insulin secretion due to faster glucose absorption, 7 whereas amylose-rich carbohydrates induce a slower and more sustained insulin response. Prolonged exposure to high-glycaemic diets may therefore exacerbate insulin resistance, especially in genetically susceptible individuals. 8
Genetic susceptibility plays a critical role in T2D development. 13 Genome-wide association studies (GWAS) have identified numerous genetic loci associated with glucose metabolism, insulin secretion, and β-cell function. GWAS rely on high-throughput genotyping to assess millions of single nucleotide polymorphisms (SNPs) across the genome, enabling the identification of common variants contributing to complex diseases such as T2D. 14
Building upon GWAS findings, polygenic risk scores (PRS) have emerged as a powerful tool to quantify an individual’s cumulative genetic risk. PRS is calculated as the weighted sum of risk alleles, with weights derived from GWAS effect sizes. 15 Since their first large-scale application in the late 2000s, PRS have been increasingly used to study disease susceptibility and gene environment interactions. 16
In India, dietary patterns are highly diverse and carbohydrate heavy, with most individuals consuming a mix of rice, wheat, and other staples rather than strictly 1 grain type. National surveys have shown that overall carbohydrate intake accounts for a majority of daily calories and that substituting 1 refined grain for another does not substantially alter diabetes risk in isolation. This complexity may explain why analyses using only Indian datasets did not show significant differences in diabetes prevalence between self-reported rice and bread eaters. 17
Despite growing evidence that carbohydrate quality influences glycaemic regulation, most population-level studies have treated rice and wheat as nutritionally interchangeable refined grains, overlooking the possibility that long-term staple preferences may interact with genetic susceptibility to shape diabetes risk. Moreover, prior analyses within India, where mixed grain consumption is common, may have obscured broader evolutionary patterns linking staple diets and inherited metabolic vulnerability. To address this gap, we adopt a population genomics framework rather than an individual dietary comparison, leveraging polygenic risk scores to examine whether populations historically exposed to rice-based diets carry a different genetic predisposition to type 2 diabetes than those traditionally reliant on wheat. By integrating genomic risk profiling with culturally defined dietary environments, this study seeks to provide a novel perspective on diet–gene interactions in type 2 diabetes and to inform more nuanced, region-specific nutritional strategies for diabetes prevention.
Methodology
Study Design and Analytical Framework
This study employed a population-level, polygenic risk score (PRS)–based comparative framework to evaluate whether genetic susceptibility to type 2 diabetes (T2D) differs between populations historically characterised by predominantly rice-based versus wheat-based diets. Rather than relying on individual dietary recall, we inferred dietary environments based on well-established regional staple consumption patterns and cultural food traditions. This approach enables the examination of long-term gene–diet relationships at a population scale.
Our analysis integrated GWAS summary statistics as the base dataset for deriving SNP effect weights, and individual-level genotype data from a diverse cohort as the target dataset for PRS computation. Comparisons were conducted at both global and South Asia-specific levels to assess whether patterns were consistent across broader populations and within a culturally mixed dietary context.
Base Dataset: GWAS Summary Statistics
Genome-wide association summary statistics for a T2D was obtained from the IEU OpenGWAS database. 18 Specifically, the dataset ebi-a-GCST006867 was used as the reference panel for deriving SNP effect sizes. The selected dataset represented one of the largest population-based GWAS resources available for T2D with 61 714 cases and 1178 controls, assessing 5 030 727 SNPs.
While this dataset is primarily European-ancestry, its large sample size and robust phenotyping make it an appropriate reference for relative risk comparisons across populations, rather than individual disease prediction.
Target Dataset: GenomeAsia 100K Project
Individual-LEVEL genotype data were obtained from the GenomeAsia 100K Project, 19 which includes diverse populations across South, Southeast, East, and Central Asia. For the global non–South Asian PRS estimation, we analysed 521 individuals representing 19 non–South Asian populations from the GenomeAsia 100K project. This dataset was combined with 2068 globally distributed individuals from the HumanOriginsPublic2068 dataset, obtained from the publicly available resources of Dr. David Reich’s lab (https://reich.hms.harvard.edu/datasets). The merged dataset comprised 2589 genomes worldwide and included 557 954 SNPs. Notably, South Asian genomes present in the HumanOriginsPublic2068 dataset were excluded from the global non–South Asian PRS analysis (Figure 1).
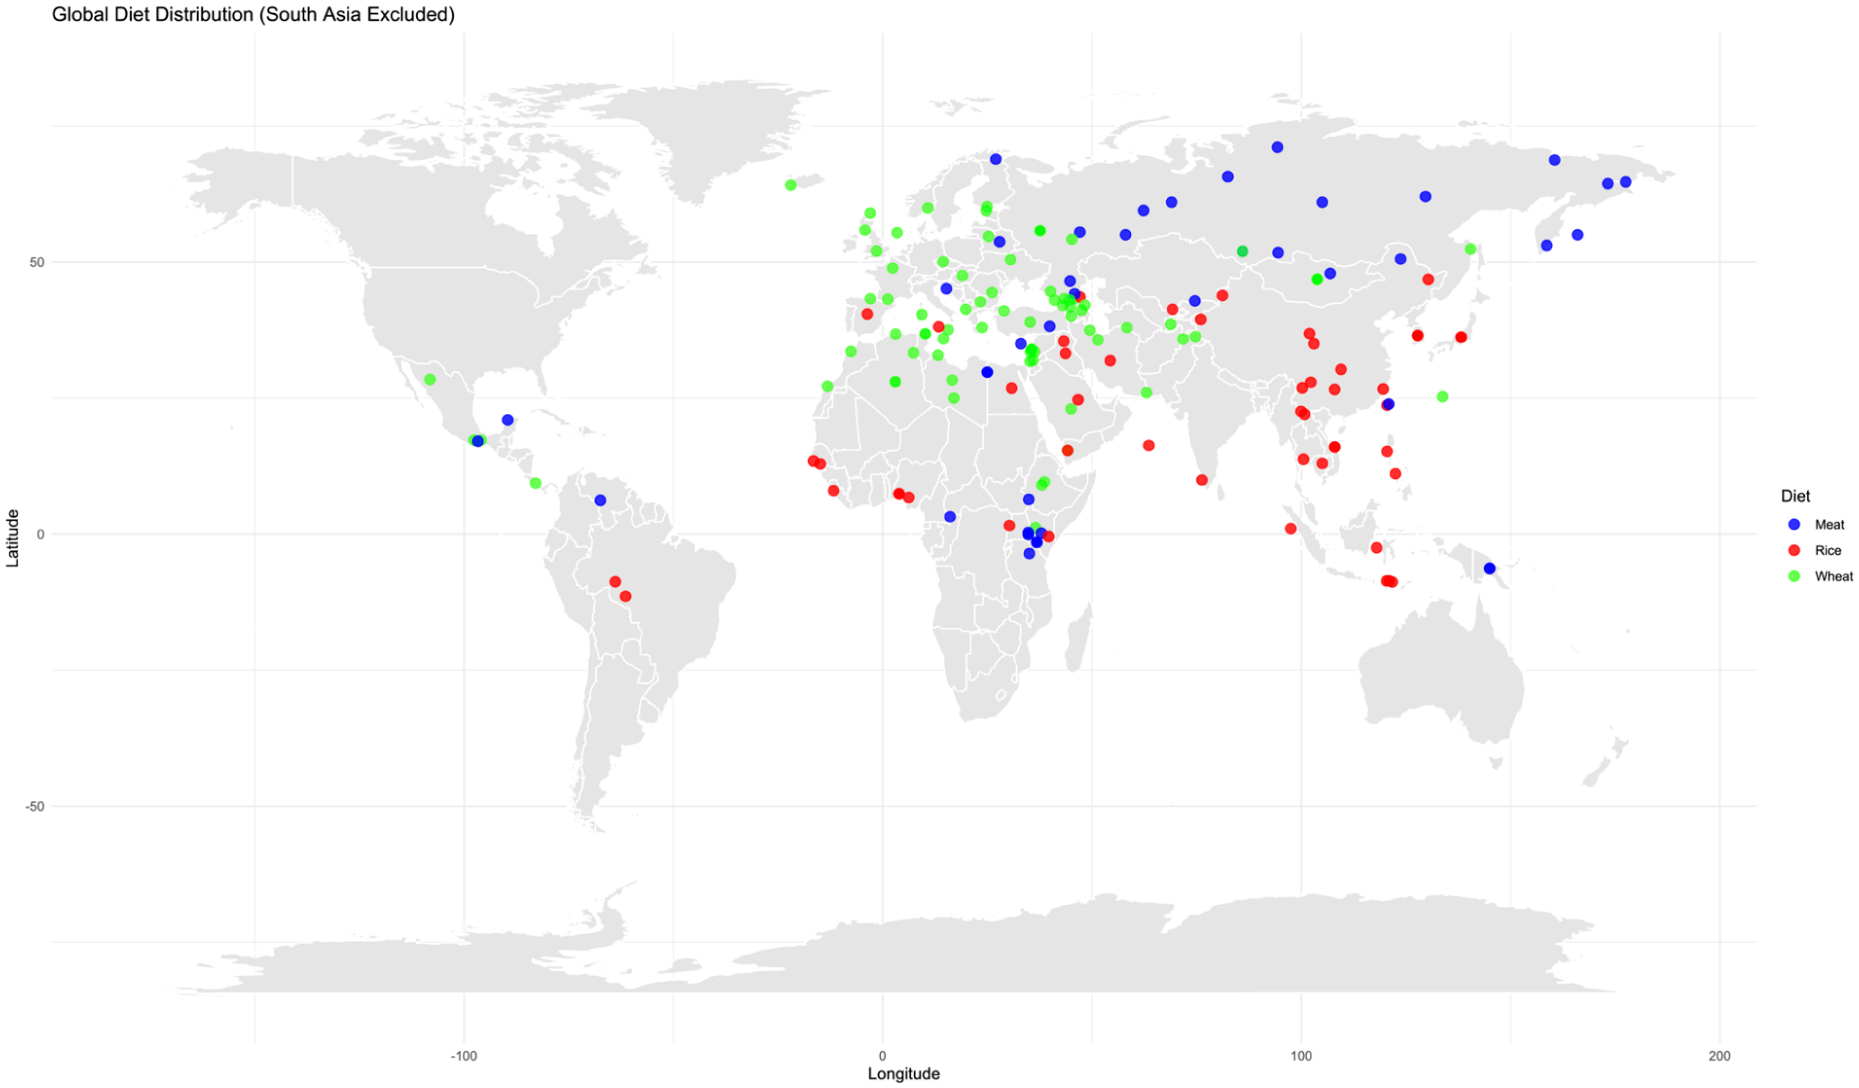
Global dietary distribution.
For the South Asia–specific PRS estimation, we included 642 individuals from 55 distinct South Asian populations drawn from GenomeAsia 100K (Supplemental Table 1, Figure 2). Genotype data were available in standard PLINK format (.bed, .bim, .fam). 20

South Asian populations by dietary classification.
Dietary Pattern Classification (Population-Level Inference)
In order to capture long-term dietary environments rather than short-term personal food choices, dietary classification was inferred based on well-documented regional and cultural staple consumption patterns rather than self-reported individual diets. Countries were grouped into standard geographical regions following widely used global classification frameworks from organisations such as the Food and Agriculture Organisation Food and Agriculture Organisation (FAO) available through FAOSTAT Statistical Database (Rome: FAO; 2023. Available from: https://www.fao.org/faostat/).
Populations were categorised as:
Rice-based populations: East Asia and Southeast Asia, along with selected South Asian regions (eg, Bangladesh, Sri Lanka, Nepal), where rice has historically been the primary staple crop and major source of dietary energy.
Wheat-based populations: Europe, West Asia, Central Asia, and most regions of Africa, the Americas, and Oceania, where wheat or mixed cereal systems (including barley, maize, and millet) predominate and rice is not the primary staple (Figure 1).
India was treated separately due to its well-documented dietary heterogeneity. Indian populations were classified at the state level, where rice predominates in southern and eastern regions, while wheat-based staples dominate in northern and western regions (Figure 2).
Polygenic Risk Score (PRS) Estimation
Polygenic risk scores were computed using PRSice 2 , 21 a widely used tool for large-scale PRS analyses. SNPs between the reference dataset, and GenomeAsia (for South Asia only) and GenomeAsia-HumanOriginsPublic2068 merged (for Global non-South Asians) target genotypes was first harmonised. Each SNP in the target dataset was weighed by its corresponding effect size from the base GWAS. Weighted risk alleles were summed up across the genome to generate an individual-level PRS. We note here that the resulting PRS reflects relative genetic predisposition to T2D-related metabolic dysregulation, rather than clinical diagnosis.
Statistical Analysis
Group-wise differences in PRS was performed using unpaired Welch 2 Sample t-test and were evaluated at 2 levels:
All individuals across populations were included to assess whether, on average, rice-dominant populations carried higher or lower genetic risk than wheat-dominant populations (Figure 1).
A subset analysis was performed on individuals of South Asian origin to examine whether patterns persisted within a country characterised by mixed grain consumption (Figure 2).
Results
Population-Level Comparison of Polygenic Risk Scores (PRS) for T2D
PRS for type 2 diabetes (T2D) were computed for individuals from populations historically characterised by rice-based and wheat-based dietary traditions. At the global level, The raincloud (Figure 3) revealed a clear separation in the distribution of PRS between the 2 dietary groups. Across all populations, the density plot showed a broader and more positively skewed distribution in the rice group, whereas the wheat group displayed a comparatively tighter and more symmetric distribution centred at lower PRS values. The raincloud plot further demonstrated that the median PRS was consistently higher in the rice-based group, with individual-level variability present in both groups but greater dispersion observed among rice-consuming populations.

Global PRS distribution.
Statistical Comparison of PRS Distributions at the Global Level
To formally test differences in PRS between dietary groups, a Welch 2 Sample t-test was conducted (Figure 4). The Welch 2 Sample t-test indicated a statistically highly significant difference in PRS between the 2 dietary categories (t = −32.758; P = 2.2 × 10⁻¹⁶). Our results indicate that populations with a long-term history of rice consumption carry, on average, a higher polygenic susceptibility to T2D compared to populations traditionally reliant on wheat.

Global PRS comparison between dietary groups.
South Asia Only Analysis
Given South Asia’s heterogeneous dietary landscape, a separate analysis was performed exclusively on South Asian populations (see Methods). Unlike the global analysis, the South Asia-only raincloud plot (Figure 5) did not indicate any clear-cut separation in the distribution of PRS between the 2 dietary groups. The rice-dominant South Asian populations exhibited marginally higher mean and median PRS compared to wheat-dominant populations, likely reflecting mixed dietary practices and regional admixture within India. The violin plot with the Welch 2-sample t-test (Figure 6) showed a statistically significant difference between rice- and wheat-based Indian populations; however, the magnitude of this difference was considerably smaller than that observed in the global comparison (t = −2.281; P = .02). This suggests that the diet-gene relationship in India is moderated by cultural dietary blending and population structure.

South Asia–only PRS distribution.
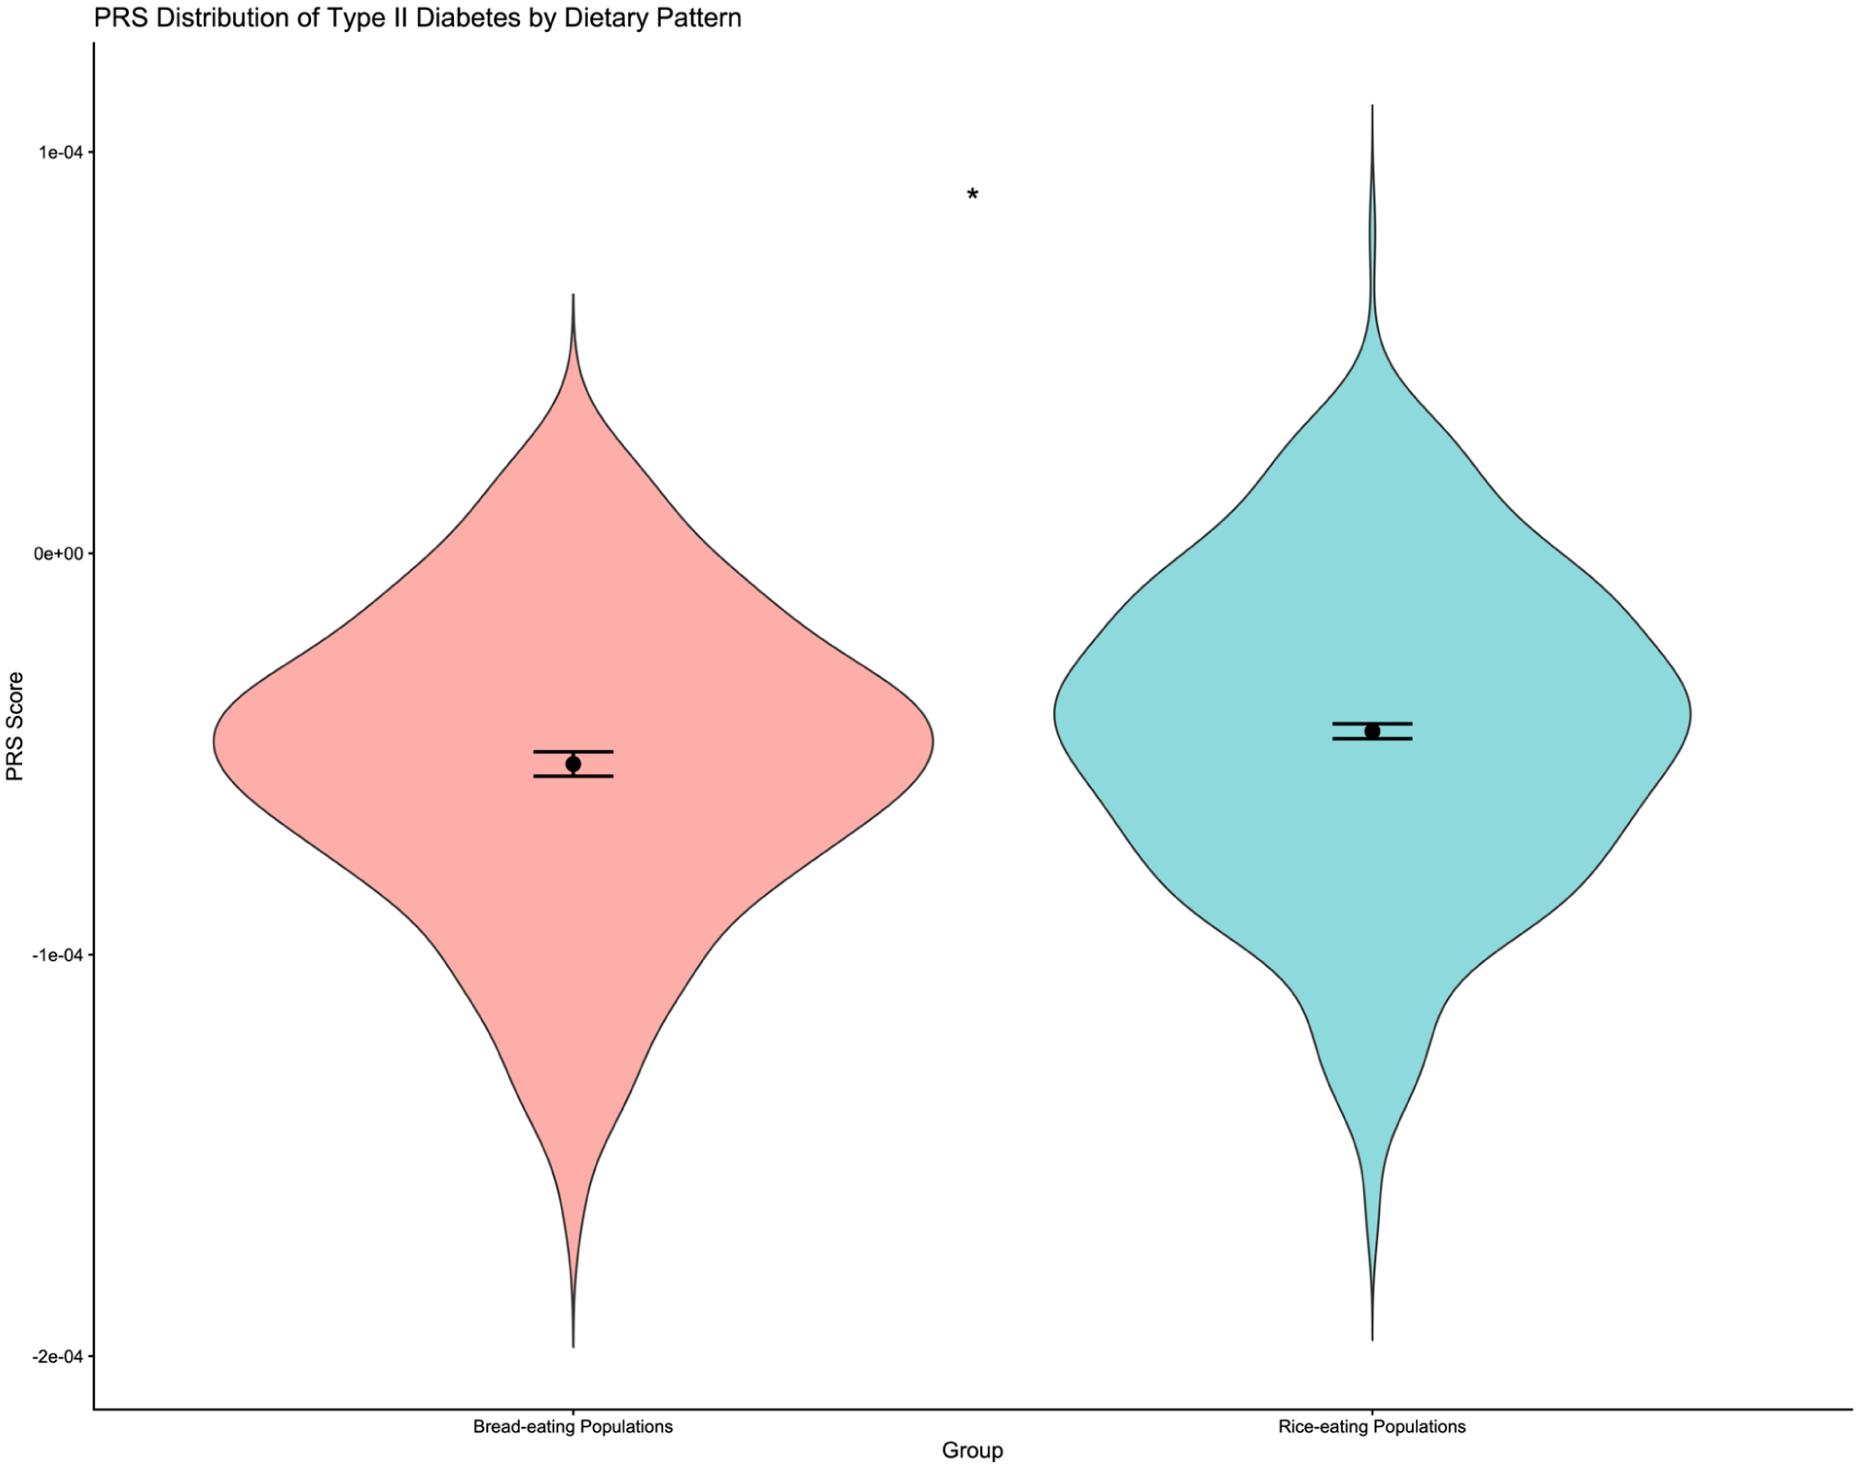
South Asia–only PRS comparison between dietary groups.
Discussion
In this population-based nutrigenomics analysis, we observed a clear global difference in type 2 diabetes (T2D) polygenic risk between staple-diet groups: individuals from historically rice-dominant populations showed a right-shifted and more dispersed PRS distribution compared with wheat-dominant populations, and the between-group difference was highly significant. In contrast, when restricting the analysis to South Asian populations alone, PRS distributions overlapped substantially and differed only marginally significantly. Together, these results suggest that a rice- versus wheat-linked genetic stratification signal is detectable at the broader global scale, but is attenuated within South Asia’s mixed and highly heterogeneous dietary-genetic landscape.
Our global PRS pattern is broadly consistent with large-scale nutritional epidemiology showing that high intake of white rice is associated with increased T2D incidence, particularly in Asian cohorts. 22 A landmark meta-analysis reported a significant positive association between white rice intake and T2D risk, with stronger effects in Asian populations. 23 More recently, an updated meta-analysis similarly concluded that higher white rice consumption is associated with greater incident T2D risk and described dose–response patterns in subgroups. 5 While these studies are individual-level (diet exposure → clinical outcome) and our work is population-level (dietary ecology → PRS distribution), the congruence supports the plausibility of a long-term rice-associated glycaemic environment interacting with genetic susceptibility.
Conversely, evidence for whole grain intake, often more feasible in wheat-based dietary contexts, consistently indicates protective associations with T2D. A recent systematic review and meta-analysis reported lower T2D risk with higher whole-grain consumption in prospective cohorts and found supportive effects on glycaemic control in randomised trials. 24 This is important for interpretation: our “wheat-based” grouping is a proxy for traditional staple patterns, not a direct measure of whole grain intake. Still, the wider literature supports a framework in which carbohydrate quality (refined vs whole grain; amylopectin-rich vs amylose/fibre-rich matrices) shapes metabolic risk gradients, potentially amplifying differences among populations when sustained over long periods.
It can be surmised that polished white rice tends to deliver a higher glycaemic load per serving in many food contexts, especially when consumed as a refined staple, producing faster glucose absorption and greater insulin demand. If such dietary exposures persist over many generations, they could contribute to differential selection pressures on variants affecting insulin secretion, β-cell resilience, hepatic glucose handling, or adipose biology. We note here that our study does not imply that rice consumption is deterministically linked to T2D; rather, it suggests that inherited risk architecture may be unevenly distributed across populations shaped by different staple ecologies.
In a pooled analysis of 3 large prospective cohorts, Merino et al 25 showed that both diet quality and polygenic risk were independently associated with incident T2D, and that higher diet quality was beneficial across genetic-risk strata (with limited evidence for strong multiplicative interaction). Their result reinforces an interpretation compatible with ours: genetic risk and dietary exposures can both contribute meaningfully to T2D risk, often in an additive manner. In our context, populations residing in historically high-glycaemic staple environments may carry (on average) higher polygenic susceptibility, while individual-level dietary improvement is still expected to reduce risk across the PRS spectrum.
Interestingly, the India-only null result is a critical nuance. Contemporary Indian diets frequently include both rice and wheat, with substantial regional overlap and rapid urban dietary transitions. Large national efforts (eg, recent India-wide dietary profiling) highlight considerable heterogeneity and mixed grain consumption patterns rather than strict rice versus wheat partitions, which can blur ecological classifications. Within such a setting, individuals’ long-term exposure may be poorly captured by population labels, and genetic structure/admixture can overwhelm subtle diet-linked signals unless sample sizes are very large and stratification is modelled carefully. Thus, the India subset likely reflects (i) real dietary blending, (ii) complex population structure, and (iii) reduced power after stratification: together attenuating detectable PRS differences.
Conclusion
Taken together, our findings indicate that staple carbohydrate environments are likely relevant to how inherited metabolic susceptibility to T2D is distributed across populations. The clear global separation in polygenic risk scores suggests that long-term exposure to predominantly refined, high-amylopectin rice diets may be associated with a higher average genetic predisposition to T2D-related metabolic dysregulation, whereas populations historically reliant on wheat show comparatively lower polygenic burden. At the same time, the absence of this clear-cut signal within South Asia underscores the importance of dietary blending, cultural heterogeneity, and complex population structure in shaping gene-diet relationships, cautioning against simplistic regional generalisations.
Our results do not imply that rice-consuming populations are genetically destined for diabetes. Rather, they support a broader gene–environment framework in which inherited risk interacts with habitual dietary context to influence metabolic outcomes. This perspective aligns with growing evidence that improving carbohydrate quality, favouring high-amylose rice varieties, minimally processed grains, millets, and whole wheat, can benefit glycaemic health across genetic risk strata.
From a public health standpoint, our study argues against uniform dietary recommendations and instead supports culturally feasible, region-specific strategies that lower glycaemic exposure while respecting traditional food systems. Future research integrating ancestry-matched GWAS weights, direct dietary phenotyping, glycaemic index/load measurements, and longitudinal metabolic outcomes will be critical for translating these population-level patterns into precision nutrition and preventive healthcare.
Limitations
We note that our study has several important limitations. First, the base GWAS used to derive SNP weights was from a predominantly European cohort. Although suitable for relative comparisons, this may reduce the accuracy of PRS in Asian populations and introduce cross-ancestry bias. Second, dietary classification was ecological and population based rather than individual level. We inferred staple preference from historical and cultural patterns, which may misclassify some individuals, especially in urban or migratory communities. Third, we lacked direct phenotypic data on diabetes status, glycaemic control, body mass index, or insulin sensitivity in the GenomeAsia samples. As a result, we could not correlate PRS with actual disease outcomes. Fourth, we did not account for non-genetic confounders such as physical activity, socioeconomic status, cooking methods, or the glycaemic index of specific rice varieties. Fifth, sample sizes were uneven across regions, and some populations were small, potentially affecting statistical power. Sixth, population structure and admixture, particularly in South Asia, may partially explain group differences rather than diet alone. Finally, PRS captures only common genetic variation and does not include rare variants, epigenetic modifications, or gene regulation effects that are likely important in T2D. Future studies should combine ancestry-matched GWAS weights, detailed dietary surveys, and longitudinal metabolic phenotypes to overcome these constraints.
Supplemental Material
sj-xlsx-1-nmi-10.1177_11786388261457983 – Supplemental material for Diet–Genetic Interactions in Type 2 Diabetes: Comparing Polygenic Risk in Rice- and Wheat-Consuming Populations
Supplemental material, sj-xlsx-1-nmi-10.1177_11786388261457983 for Diet–Genetic Interactions in Type 2 Diabetes: Comparing Polygenic Risk in Rice- and Wheat-Consuming Populations by Shahla Naran Chirakkal, Ananthakrishnan Anilkumar Indu and Ranajit Das in Nutrition and Metabolic Insights
Footnotes

Author Contributions
SNC: Methodology, data curation, formal analysis, and writing – first draft. AAI: Methodology, data curation, formal analysis, and writing – Final draft, review and editing. RD: Conceptualization, investigation, methodology, supervision and writing – review and editing.
Funding
The authors disclosed receipt of the following financial support for the research, authorship, and/or publication of this article: Article Processing Charge (APC) was covered by Yenepoya (Deemed to be University, Mangalore, Karnataka).
Declaration of Conflicting Interests
The authors declared no potential conflicts of interest with respect to the research, authorship, and/or publication of this article.
Data Availability Statement
Data available on request.
Supplemental Material
Supplemental material for this article is available online.
References
Supplementary Material
Please find the following supplemental material available below.
For Open Access articles published under a Creative Commons License, all supplemental material carries the same license as the article it is associated with.
For non-Open Access articles published, all supplemental material carries a non-exclusive license, and permission requests for re-use of supplemental material or any part of supplemental material shall be sent directly to the copyright owner as specified in the copyright notice associated with the article.
