
Abstract
The purpose of this study was to investigate the physiological and mental health effects caused by exposure to low-frequency noise in typical control rooms and office-like areas. The participants were 35 male students who were exposed to noise at levels of 55, 65, 70, and 75 dBA. The N-back test was used at three cognitive performance loads (low workload (n = 1), medium workload (n = 2), and high workload (n = 3) to evaluate working memory simultaneously in an air conditioning chamber in four sessions with a constant level. The electroencephalography, electrocardiogram, and electrooculography were measured using Nexus 4 by Bio traces software (Mind Media Co.). For evaluation of mental fatigue, fatigue visual analog scale, and psycho-physiological indices were also used. The results showed that the losses of physiological and mental health were rapidly increased with exposure to noise levels of 65–75 dBA. The results showed that mental fatigue significantly affected heart rate, low- to high-frequency ratios, and electroencephalogram indices such as theta, alpha, as well as eye activities and working memory. The findings confirmed that the mental fatigue caused by low-frequency noise significantly impacted the employees’ psycho-physiological and working memory responses. Implementation of the effective interventions to overcome employees’ mental fatigue in typical control rooms and office-like areas can improve the health and acoustic comfort and, consequently, the cognitive performance.
Introduction
Noise is defined as an unwanted sound. 1 Employees who are constantly exposed to noise in indoor environments may suffer from stress 2 and fatigue. 3 Some researchers have defined low-frequency noise (LFN) as a broadband noise in the frequency range of 20(10)–200 Hz and some others define it in the frequency range of 10–250 Hz.4,5 The response to noise depends on the characteristics of the sound including frequency, intensity, complexity of sound, and exposure time.6,7 Noise not only causes objective health effects, such as hearing loss, but also has other effects such as annoyance, behavioral and sleep disorder, deterioration of task performance, headache, dizziness, and irritation.7–9 It has been shown that LFN is more annoying than other noise at the same A-weighted level,8,10 so the importance of LFN in the World Health Organization(WHO) documentation is reasonable. 11
Exposure to LFN is not limited to specific residential environments, but it can be in environments such as control rooms and office-like areas. 12 There are certain regulations (lower than the ISO 226 median threshold) to control noise in residential areas in some European countries and the determination of the maximum acceptable LFN level in residential areas at night and day, such as Germany, Sweden, Denmark, Netherlands and Poland, and so on. 13 However, less attention has been paid to LFN in occupational settings and its side effects are less known. 14
Unlike residential areas where noise levels are often low, LFN is usually higher than the hearing threshold in occupational environments. Also, it has been proven that individuals with high sensitivity to LFN are at a higher risk.4,14
The first and the most effective side effects of LFN is annoyance. 15 Various studies have shown that there is a relationship between LFN and physiological and psychological reactions such as annoyance, hearing threshold shift, concentration problems, sleep quality, and mood effects.4,16 In addition to the harmful effects on health, exposure to LFN has negative effects on the memory and performance.17,18
Studies have also shown that LFN in jobs with high complex tasks which require more demanding tasks have a negative effect on the mental performance. 19 Therefore LFN is of great importance in places such as control rooms and office-like areas where mental activities are performed. 20
One of the problems that may arise from noise is mental fatigue. Mental fatigue is a gradual and cumulative process that is associated with an unwillingness for every effort and is also associated with a decrease in mental alertness and mental function impairment.21,22 Fatigue shows itself as a feeling of weakness, disability, and lack of energy that may appear as a physical and psychological disability. 23
The effects of noise on humans are evaluated not only by self-report measurements, but also by objective methods (physiological measurements).24,25 The measurement of the physiological parameters is responsive to different emotional states. 26 By considering the importance of LFN in areas which require selective attention and processing of high load of information, such as typical control rooms and office-like areas, although various physiological, psychological, and performance indicators have been used to evaluate fatigue, electro-encephalogram signals are probably one of the most promising predictors due to the reflection of direct brain activity. This study was designed to evaluate employees’ mental fatigue by using psycho-physiological and mental indicators such as heart rate (HR), heart rate variability (HRV), electrical activity of the brain, and working memory.
Materials and methods
Participants
In this study, a total of 35 male students from Hamedan University of Medical Sciences in the age range of 20–30 years (with average age of 23 ± 3) were selected (pre-exposure and post-exposure) as the population for the study under laboratory conditions. Then, subjects were screened for visual and hearing health. The visual test was carried out by E chart. 27 The hearing health was also conducted by an audiometer (MEVOX ASB15). Participants with at least 20 dB average hearing threshold levels were allowed to contribute to the study. The participants with a history of neuropsychiatric diseases and the use of drugs that affect the nervous system were excluded. Also, they were examined for right-handedness and color blindness. They were asked to have enough sleep before the test and 12 h before the study they were not to use caffeine or any other stimulus 28 and to not smoke. All participants were paid in order to increase their motivation to participate in the study. This study was approved by the Ethics Committee of Hamedan University of Medical Sciences. After confirmation, informed consent form was obtained from them.
Experimental procedure
This study was carried out in an air-conditioned room with dimensions L × W × H = 3.70 × 2.40 × 2.70 m. The walls of the room were covered by polyurethane foam (it is an excellent sound absorber) in bright colors, so that it was psychologically suitable. 29 The floor of the room was covered with a cream-colored carpet. Noise out of the chamber had no effect on the inside (Figure 1). In this chamber, there was a desk, a chair, and a computer system similar to the room of an operator in a control room that was designed ergonomically, 30 in a way that the distance of the operator from the monitor was 1 m. Also, the lighting in the room was at least 300 lux, 31 provided by two LED lights.

Experimental setup in air conditioning chamber.
In this study, individuals were asked to identify the exact date and time when they were ready to conduct the tests. The test was conducted in four separate sessions for 50 min 30 for each person (each day with a constant noise pressure level) and at 55, 65, 70, and75 dBA levels (the noise pressure levels were measured at the listeners’ ears, frequency distribution in Figure 2), which were related to the noise recorded from a fan (similar to the conventional noise pressure levels in the control rooms) which was played by two 10 W speakers and one 8 W subwoofer (Mingo mg 202) as a noise source that were placed at the same distance(0.5 m) on both sides of the monitor (Figure 3), in such a way that the conditions of exposure to noise pressure levels were the same for all the participants.
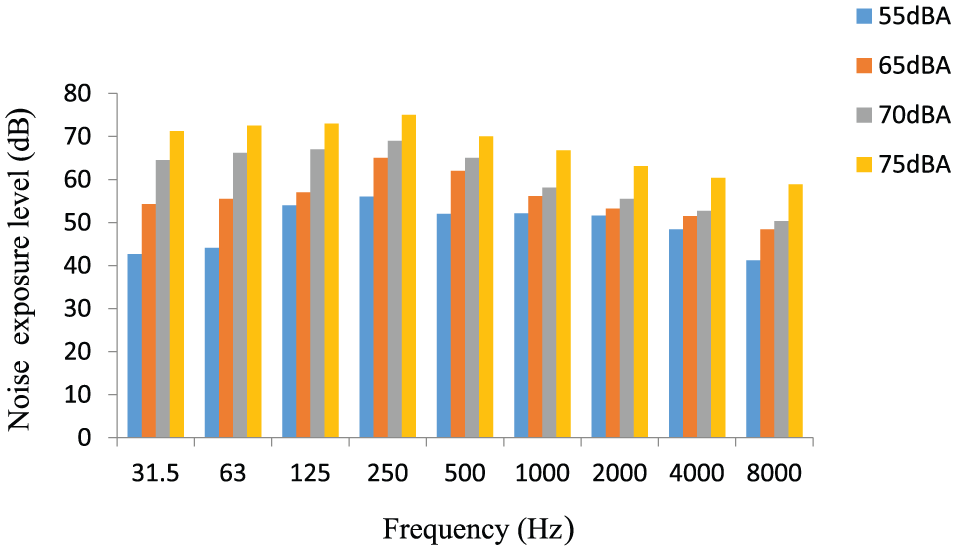
The octave band frequency spectrum shows low-noise frequency at different exposure levels.
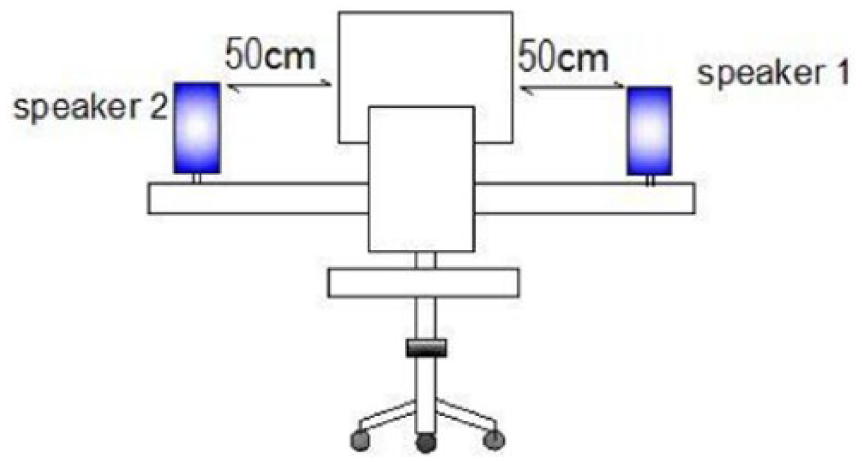
Shows the distance between the speakers and the monitor, the frequency response of this type of speakers is 20–20000 Hz.
The noise pressure level was checked every 10 min in the listeners’ ears in order to resolve any possible difference. Before the tests were conducted, enough explanations and training were given over two sessions to each person on how to perform tests and work with the N-back software. 32
Also, enough explanations were given to each person on how to determine the score of Fatigue visual analog scale (F-VAS). The working style of all participants was sitting and the test was conducted from low to high workloads for all participants. The temperature of the air during the exposure at all levels was constant at 22°C, relative humidity was 50% under all the conditions, and air flow rate was 0.5 m/s. The pattern of tasks performed along with their implementation time is shown in Figure 4. The display intervals for each stimulus were 2500 ms 28 and the number of stimulus was 120 stimulus, which was the same at all levels of tasks, and was perform simultaneously with exposure to different levels of noise (Figure 4).
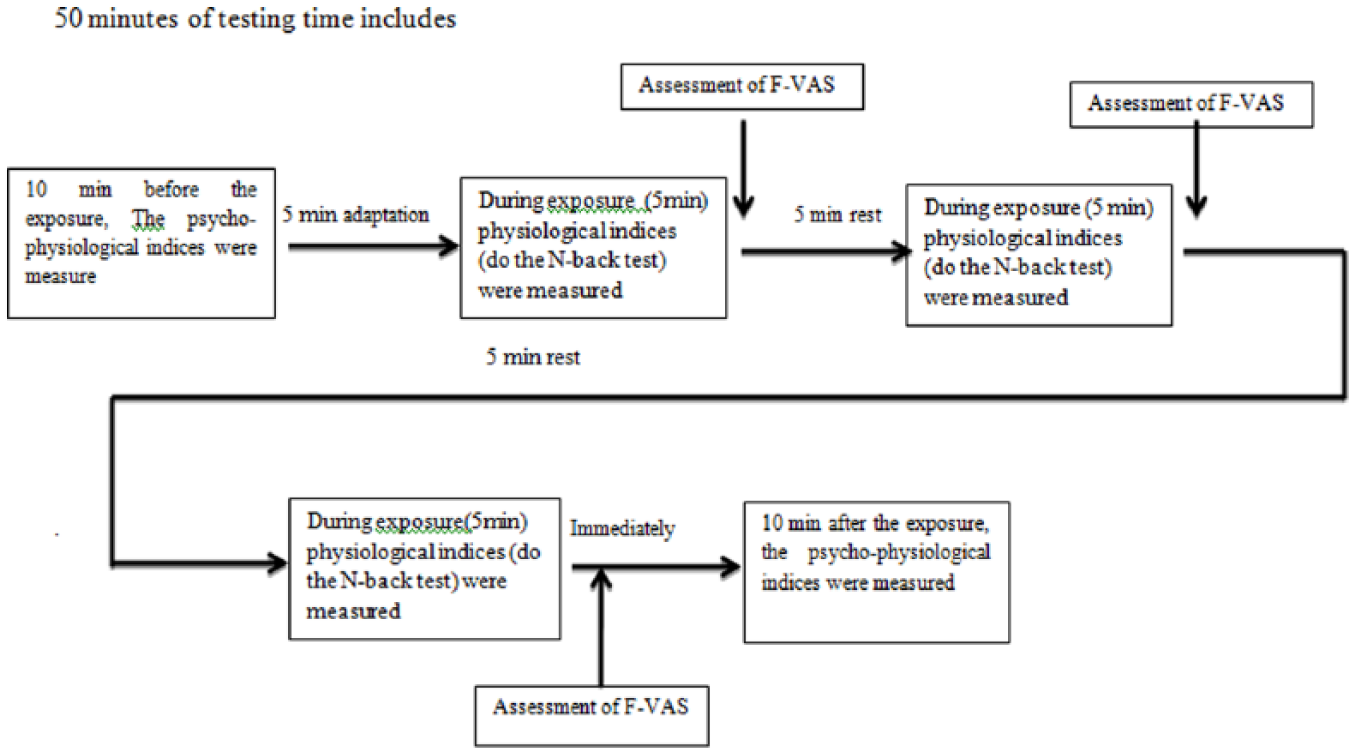
Different stages of measuring physiological indices: mental performance and self-report.
Also, the participants were given 5 min rest between each stage in the same position (behind the table) to prepare themselves for the next stage. To avoid defect in measurements, individuals were asked to have a minimum movements and focus on the task. After installation of electrocardiogram (ECG) electrodes, signals were measured before exposure to noise and the performance of N-back task, during exposure to noise and performance of the task, and after exposure to noise and performance of the task for 5 min with open eyes. Also, the electrical activity of the brain and eye activities were measured before and after exposure to the different noise pressure levels. At the end of each stage, the participants were asked to determine their mental fatigue score.
Measurements
Measuring working memory
In this study, N-back test was used at three cognitive performance loads (low workload (n = 1), medium workload (n = 2), and high workload (n = 3)) to evaluate employees’ working memory. The N-back task is the assessment of cognitive tasks based on brain executive function that was first introduced in 1958. 33 The N-back task contains both the maintenance and manipulation of cognitive information; it is suitable for measuring the performance of working memory. In this test, a number of visual stimuli (numbers from 1 to 9) appear on the on the computer monitoring a random series, and in three different conditions with different loads of working memory, the subjects must respond to it. The participants compare each stimulus (visual stimuli) with the previous stimuli; in condition with low workload, if they were similar, they must press the button on which the question mark (?) is placed, and if not being similar they must press the Z button on the computer keyboard. The participants performed the same task in the end-test.
In condition with medium workload, the subjects must compare the stimulus with the two previous stimuli and, if similar, they must press the button on which the question mark (?) is placed, and if not similar, they press the Z button. In condition with high workload, the subjects must compare the stimulus to the three previous stimuli and when similar, they must press the button on which the question mark (?) is placed and if not being similar, they press the Z button.
The results of the test show the number of correct and incorrect answers and the average response time. 32 In this study, the stimulus was presented as random numbers from 1 to 9 and the number of correct answers (accuracy) and the average response time (in milliseconds) were calculated with N-back software in the four different conditions of exposure to noise levels (55, 65, 70, and 75 dBA (Figure 4).
Body physiological measurements
To measure physiological indices, the Nexus 4 (made by Mind Media Company in Netherland) was applied. Nexus 4 has four channels to measure the psycho-physiological indicators with Bluetooth technology. By this system, electroencephalography (EEG), ECG, electromyography (EMG), and electrooculography (EOG) signals can be collected. Collected signals are transferred into computer memory wirelessly networks using Bluetooth for online monitoring and storage of data. Data processing, digital filtering, reporting the process, and preliminary statistical analysis are performed by software (BioTrace software®, Mind Media BV, Roermond-Herten, The Netherlands). 34
Operational channel information is used to measure electrocardiogram signals at a sampling frequency of 1024 Hz. ECG signals were recorded by installing three Ag-AgCl electrodes on the right and left sides of the sternum bone and on the left side armpit on the sixth rib. BioTrance+the use of the ECG signal on the Nexus are based on HR and HRV measurements. HRV refers to the beat, to beat alterations in HR, which was evaluated based on ECG under various working conditions (low, medium, and high workload) and at exposure to 55, 65, 70, and 75 dBA LFN pressure levels.
The HRV analysis was carried out in the following frequency bands: low frequency (LF; 0.04–0.15 Hz) and high frequency (HF; 0.15–0.4 Hz). 35 The LF/HF frequency ratio usually indicates the activity of the sympathetic nervous system. 36
Based on the ECG signals, average HR indicators HR and LF/HF ratios for 5 min in four pre-exposure situations, during exposure in three conditions of low workload, medium workload, and high workload, and after exposure to noise pressure levels of 55, 65, 70, and 75 dBA were measured. In this study, an operating channel was used to measure 256 Hz EEG and EOG indices. Nexus is one of the few systems that implements active noise cancelation (movement artifacts and external interactions) for physiological signals.
To measure electrophysiological indices, Nexus uses carbon-coated cable with active shielding, which provides clear signals without any movement artifacts. Nexus uses active noise-canceling technology, which reduces the movement artifacts and external interactions and provides signals with good quality.
Environmental noises are electronically subtracted from the EXG signals, so the signals are clean with low artifacts. Movement is virtually absent; 50/60 Hz noise is low.
We used the channel A in Nexus to record the EEG based on the international10–20 in placement of electrodes. To record EEG signals, reference electrodes were placed on the mastoid bone of the left ear (black), ground electrode on the mastoid bone of the right ear (white), and red electrode on the Cz site. In this study, we used NuPrep gel (for skin preparation) and EEG 10-20 (Ten20) paste to fix the electrodes.
Also, the second channel (input B) was used to checking the EOG (Blink Measurement and Eye Movement Measurement). To record the EOG (theta band), a small ECG electrode was placed one above and another below the left eye (Vertical EOG). By recording the EEG and EOG signals, the mean of theta range (4–8 Hz), the alpha range (8–12 Hz), and the mean of the range of electrical activities of the eye were measured for 5 min in the pre-exposure conditions and immediately after exposure noise pressure levels in 55, 65, 70, and75 dBA.
Assessment of mental fatigue
F-VAS is another validation criterion for mental fatigue in this study. The fatigue analogs scale is of 10 points. F-VAS is a horizontal line on a paper or a linear analog scale, with numbers from 1 to 10 written on it. On this scale, number 1 indicates the lowest level of fatigue and 10 indicates the highest level of fatigue. In this method, the participants were asked to determine their mental fatigue according to this scale, 37 which was reported by the participants after completing each task during exposure to the different noise pressure levels (Figure 5).
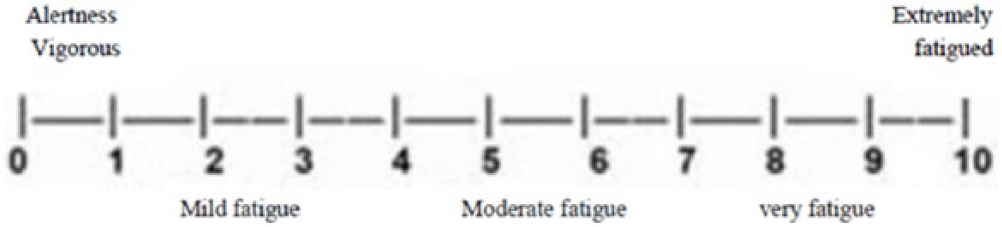
Visual analog scale of fatigue (F-VAS).
Statistical analysis
The data were analyzed using repeated analysis of variance (ANOVA). To evaluate the normal distribution of data at different levels, the Mauchly’s Test of Sphericity was used. When the sphericity hypothesis was violated, Huynh-Feldt’s analysis was used to correct the degree of freedom. Also, the post hoc least significant difference (LSD) test was used to test the difference between the means. For statistical analysis, SPSS-24 was used. A significant level of 95% was considered for all the tests.
Results
Results of working memory
Working memory measurements including mean values, standard deviation, p value, and effect size index (ƒ) 38 for three conditions with different working loads and four levels of exposure to LFN based on average accuracy in percentage and average response speed (average response time to stimuli (in milliseconds (ms)) are presented in Table 1. As shown in Table 1, the highest average accuracy in various levels of task performance was related to noise exposure of 55 dBA and the lowest average accuracy in various levels of task performance was related to noise exposure of 75 dBA. ANOVA test with repeated measure showed that there were significant differences between the means of accuracy in terms of performance with low workload (p < 0.003), medium workload (p < 0.000), high workload (p < 0.001), and noise levels exposure of 55, 65, 70, and 75 dBA.
Means ± SD of accuracy and response speed (average response time) of working memory test in three levels with different workloads under different noise pressure levels.
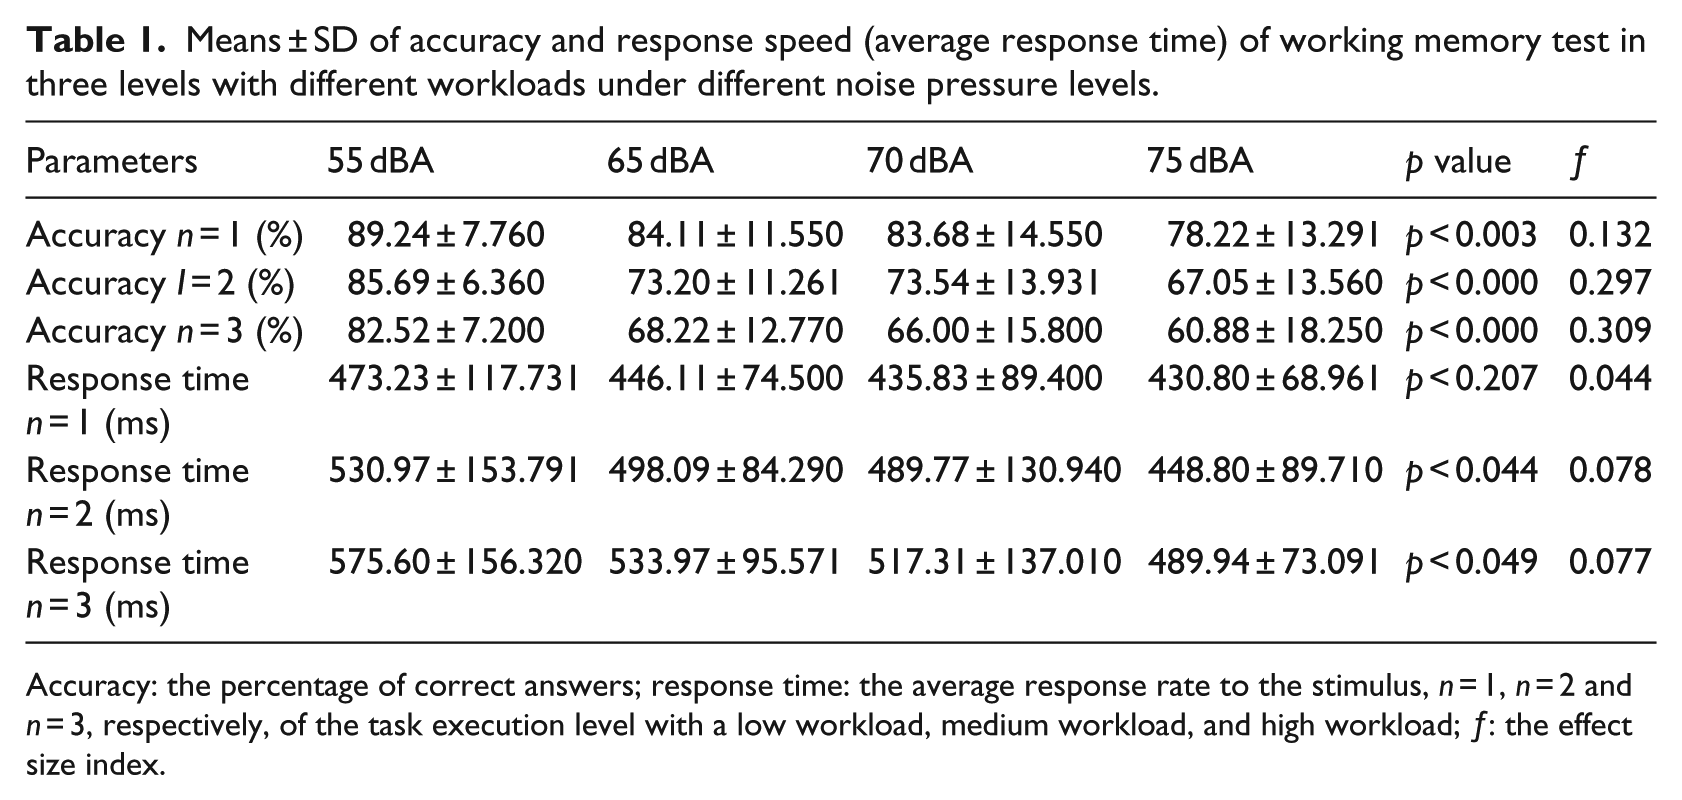
Accuracy: the percentage of correct answers; response time: the average response rate to the stimulus, n = 1, n = 2 and n = 3, respectively, of the task execution level with a low workload, medium workload, and high workload; ƒ: the effect size index.
Post hoc tests showed that LFN had a significant effect on the accuracy mean at 65,70, and 75 dBA compared to noise level of 55 dBA in low workload, medium workload, and high workload conditions. There was a significant difference between the accuracy means in terms of performance of task with low workload condition in exposure to noise pressure levels at 55 and 65 dBA (p < 0.017) and 55 and 75 dBA (p < 0.0000). Also there was a significant difference between the average accuracy means in terms of performing task with medium workload (n = 2) and exposure noise pressure levels 55 and 65 dBA (p < 0.000), 55 and 70 dBA (p < 0.000), 55 and 75 dBA (p < 0.000), and between the average accuracy means in task performance conditions with high workload (n = 3) and exposure noise pressure levels 55 and 65 dBA (p < 0.000), 55 and 70 dBA (p < 0.000), and 55 and 75 dBA (p < 0.000).
Furthermore, based on Table 1, the highest increase in response time average to stimuli was related to exposure to 55 dBA noise in all conditions and the lowest response time average to stimuli in low workload conditions (n = 1) and medium workload (n = 2) and high workload (n = 3) was related to the75-dBA noise pressure level. The results of ANOVA test with repeated measure showed that in all the task performance conditions, there was a significant difference between the means of response time to the stimuli and the noise pressure levels, except for the low workload condition.
Results of mental fatigue
The results of self-reported mental fatigue are presented in Table 2 for three N-back working conditions with a low workload (n = 1), medium workload (n = 2), and high workload (n = 3) in exposure to different noise pressure levels. During the implementation of the N-back tests with a low workload (n = 1), a medium workload (n = 2), and a high workload (n = 3) under conditions of exposure to noise pressure levels 55, 65, 70, and 75 dBA, the lowest increase in the average score of self-reported mental fatigue was related to noise levels of the 55 and 65 dBA and the highest increase was related to noise levels of the 75 and 70 dBA, respectively.
Means ± SE of F-VAS in three levels with different workloads after under different noise levels.

SE: standard error; F-VAS: fatigue visual analog scale; ƒ: the effect size index.
ANOVA test with repeated measurements showed that there was a significant difference between the mean scores of self-reported fatigue in conditions with low workload (p < 0.02), medium workload (p < 0.000), high workload (p < 0.000)), and in exposure to noise levels of 55, 65, 70, and 75 dBA.
Post hoc test results showed that LFN had a significant effect on the average score of self- reports of fatigue at 75, 70, and 65 dBA, compared to the noise level of 55 dBA, in low workload, medium workload, and high workload conditions. There was a significant difference between the mean scores of self-reported mental fatigue in low workload condition and in exposure to noise levels of 55 and70 dBA (p < 0.042) and 55 and75 dBA (p < 0.007). There was a significant difference between the mean scores of mental fatigue in medium workload condition (n = 2) and in exposure to noise levels of 55 and 70 dBA (p < 0.001), 55 and 75 dBA (p < 0.000), 65 and 70 dBA (p < 0.027), and 65 and 75 dBA (p < 0.000). There was a significant difference between the mean scores of self-reported mental fatigue in high workload condition (n = 3) and in exposure to noise levels of 55 and 70 dBA (p < 0.022), 55 and 75 dBA (p < 0.000), and 65 and 75 dBA (p < 0.001).
The effects of exposure to LFN at high levels compared to low levels based on F-VAS are presented in Table 3.
Pairwise comparison of the effects of various noise levels on the F-VAS.

SE: standard error; ƒ: the effect size index; n = 1, n = 2 and n = 3, respectively, of the task execution level with a low workload, medium workload, and high workload.
p < 0.05.
Changes in F-VAS are also presented in Figure 6 for four different conditions of exposure to noise.
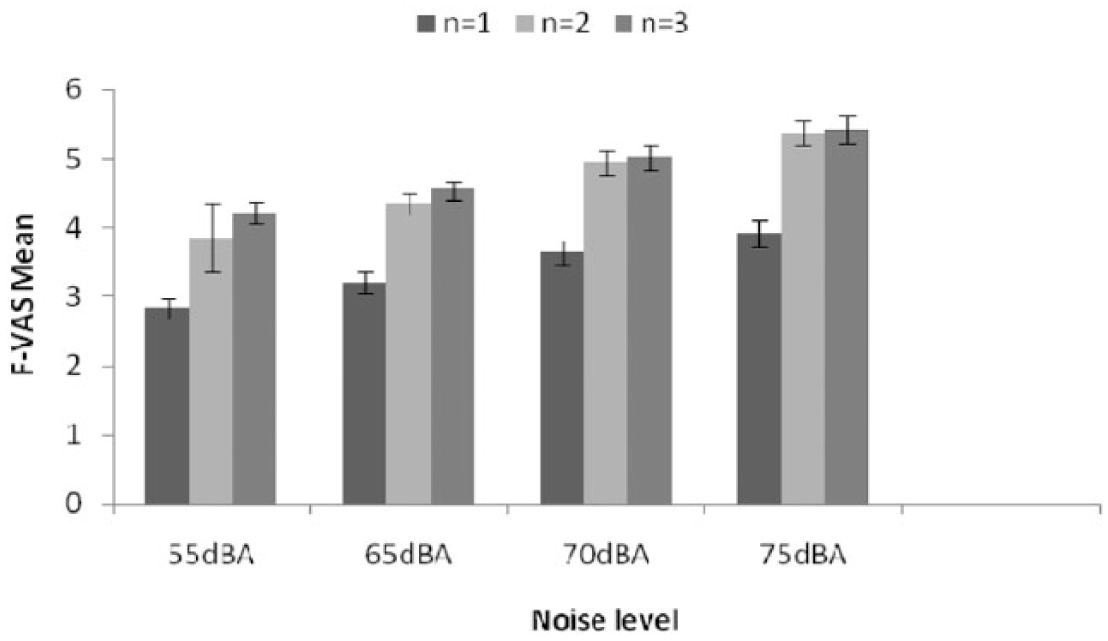
Changes in mental fatigue at different noise levels and task levels, n = 1, n = 2 and n = 3, respectively, of the task execution level with low workload, medium workload, and high workload.
Results of physiological indices
Table 4 shows the physiological indices for different modes of measurement compared with baseline (before exposure). The results showed that the differences between mean variations of the pre and post exposure modes were changed at 55, 65, 70, and 75 dBA levels for HR, LF/HF indicators in different conditions of exposure to LFN.
MD ± SE of changes heart rate variation indexes in the conditions of performing three levels of tasks and four different noise pressure levels conditions.
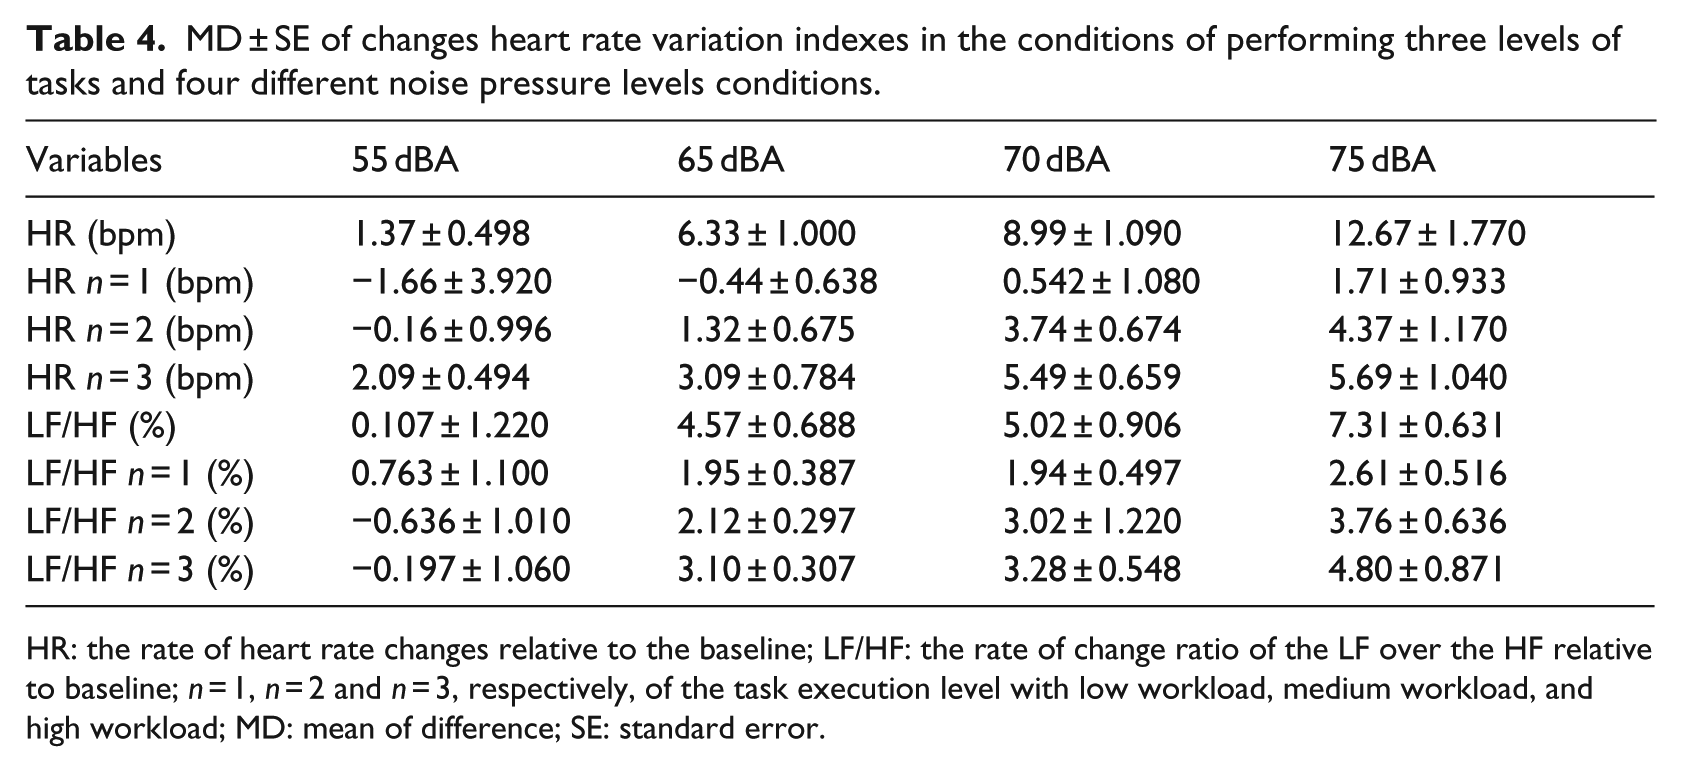
HR: the rate of heart rate changes relative to the baseline; LF/HF: the rate of change ratio of the LF over the HF relative to baseline; n = 1, n = 2 and n = 3, respectively, of the task execution level with low workload, medium workload, and high workload; MD: mean of difference; SE: standard error.
The results of ANOVA test with repeated measure showed that LFN level had affected on HR. This effect was statistically significant before and after exposure to noise (p < 0.000).
Post hoc test results showed that there was a significant difference between HR and in exposure to noise levels of 55 and 65 dBA (p < 0.000), 55 and 70 dBA (p < 0.000), and 55 and 75 dBA (p < 0.000).
Results of ANOVA test with repeated measures in low workload (n = 1, p < 0.000), medium workload (p < 0.002), and high workload (p < 0.000) showed a significant difference between HR mean changes compared with baseline and exposure to noise levels of 55 and 65 dBA (p < 0.000), 55 and 70 dBA (p < 0.000), and 55 and 75 dBA (p < 0.000).
Post hoc test showed that there was a significant difference between HR mean changes in task performance conditions with low workload (n = 1) and exposure to noise levels of 55 and 65 dBA (p < 0.000), 55 and 70 dBA (p < 0.000), and 55 and 75 dBA (p < 0.000).
Also, post hoc test results showed that there was a significant different between HR mean changes compared with baseline mode in task performance with medium workload and exposure to noise levels of 55 and 70 dBA (p < 0.002), 55 and 75 dBA (p < 0.008), 65 and 70 dBA (p < 0.03), and 65 and 75 dBA (p < 0.015).
Post hoc test results also showed a significant difference between HR mean changes compared with baseline mode in high workload condition (n = 3) and exposure to noise levels of 55 and 70 dBA (p < 0.000), 55 and 75 dBA (p < 0.004), 65 and 75 dBA (p < 0.032), and 65 and 70 dBA (p < 0.044).
The results of ANOVA test with repeated measurements showed that there was a significant difference between changes in the mean values of LF/HF before and after exposure to noise levels of 55, 65, 70 and 75 dBA (p < 0.000).
ANOVA test with repeated measurements showed a significant difference between the mean values of LF/HF in low workload condition (n = 1, p < 0.024), medium workload condition (n = 2, p < 0.015), and high workload condition (n = 3, p < 0.000) compared with baseline mode and noise levels of 55, 65, 70, and 75 dBA.
Post hoc test results showed that there was a significant difference between LF/HF mean variations in task performance conditions with low workload(n = 1) and exposure to noise levels of 55 and 75 dBA (p < 0.000). Also, post hoc test results showed that there was a significant difference between LF/HF mean variations compared with baseline mode, in medium workload conditions and exposure to noise levels of 55 and 65 dBA (p < 0.008), 55 and 75 dBA (p < 0.000), and 65 and 75 dBA (p < 0.033).
Post hoc test results showed a significant difference between the LF/HF mean variations compared with baseline mode in high workload conditions (n = 3) and exposure to noise levels of 55 and 65 dBA (p < 0.002) 55 and 70 dBA (p < 0.009), 55 and 75 dBA (p < 0.001). Changes in physiological indices are presented in Figures 7 and 8 for four different conditions of exposure to noise.

Changes in HR MD at different noise levels and task levels (MD = mean of difference).

Changes in LF/HF at different noise levels and task levels (MD = mean of difference).
The results of the ANOVA test with repeated measure showed that the noise levels had a significant effect on the electroencephalogram indices such as theta, alpha, as well as the EOG index, so that during the exposure to noise levels, the mean value of theta and EOG increased. Also, the mean value of the alpha decreased during the exposure; the results are summarized in Tables 5 and 6.
Statistical analysis for global electroencephalography and electrooculography amplitude of different band under different noise levels (MD ± SE).
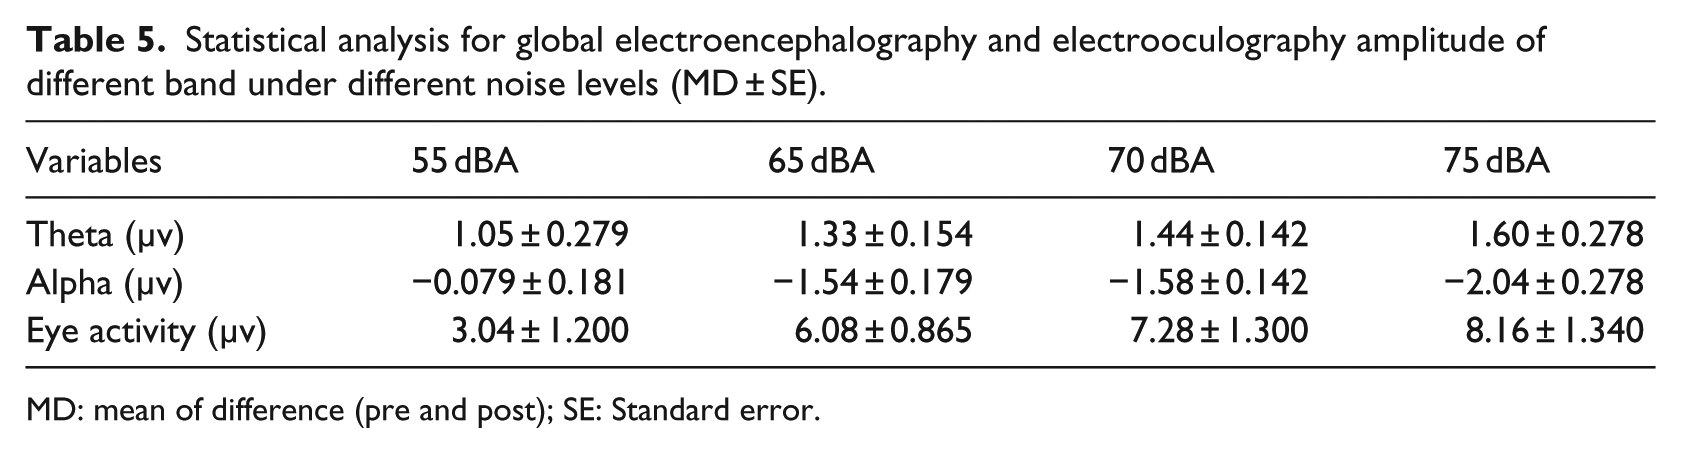
MD: mean of difference (pre and post); SE: Standard error.
Multiple comparisons of global electroencephalograph and electrooculography amplitude of different band under different noise levels.

Denotes significant difference. Values are post hoc tests, which indicate nonsignificant difference.
Discussion
In this study, mental fatigue resulted from exposure to normally noise pressure levels in control rooms and office-like areas has been considered. In this study, N-back test, F-VAS, and psycho-physiological indices were used. The results of the N-back test (Table 1) showed that by increasing the LFN pressure level, the participants’ accuracy was decreased, so that there was a significant difference between the noise pressure level and the average of accuracy in all the levels of exposure. Studies have shown that LFN reduces mental performance (accuracy and attention).4,39 Previous studies have also shown that noise at high levels had effect on word reminding, more fatigue, and less motivation compared with low levels.40,41
The results showed that the response time to the stimuli decreased when noise pressure levels were increased, which may be due to the fact that the participants wanted to get rid of this discomfort situation sooner. The results also showed that in the presence of loud noise compared with silence, the response rate to the stimuli increased, but the accuracy decreased. 42
The results of F-VAS, which participants reported after each stage of the N-back test showed an increase in mental fatigue that was consistent with the study. 43 There was a significant difference between the average mental fatigue after each stage of the N-back test and the exposure to the noise pressure level, which indicates that with increasing difficulty of task and noise pressure levels, the level of mental fatigue that participants reported were increased. These findings are consistent with the results of previous studies, 44 so it seems that in places where high mental workload is in demand and in exposure with high-level noise (such as typical control rooms and office-like areas), people’s health is threatened and the human error rate increases.
The results of the physiological indices showed that, with increasing workload and noise pressure level, the rate of HR changes increased in such a way that there was a significant difference between HR changes at different levels compared with baseline mode. Studies have shown that exposure to noise pressure level can increase HR.45,46
The results of this study showed that the LF/HF indices, which indicated sympathetic activity, 36 was affected by noise pressure level and workload level (work difficulty level) and it significantly increased compared with baseline mode, indicating that with increasing noise pressure level and workload level, participants made more efforts 43 and tolerated more stress. The results of the study 42 showed that, after fatigue-inducing, the ratio of LF/HF increased due to fatigue, which was consistent with the result of this study.
The results of Jahncke et al.’s 47 study indicate that cognitive performance was reduced by the exposure to high noise and the participants suffered more fatigue, but the stress-related physiological indices, such as cortisol and catecholamines, did not change significantly. Also, Persson et al. 48 study showed such a result. But in our study, which used indicators such as HR and LF/HF, physiological changes were observed. Perhaps the reason for this difference is that physiological indices, such as cortisol and catecholamines, in the short-term exposure are not good indicators for assessing the effect of noise exposure and are subject to long-term exposure, which requires further study and simultaneous measurement of these indicators.
The results of this study showed that the work difficulty and noise pressure level affected the electrical activity of the brain and the activities of the eyes. The results showed that the Theta range (amplitude) in the CZ site significantly increased with increasing difficulty of the task and noise pressure level, which it was similar to the results of studies, 42 which have shown the increase in the density of theta power in the CZ site in the 2-back tests after fatigue- inducing as well as studies on working memory load49,50 and the flight simulation in which Theta band activity of EEG in the frontal increased with increasing task demand. 47 Also, the results of this study showed that with the increase of noise pressure level and workload, alpha range (amplitude) in the CZ site decreased. Reduction of alpha band activity range in the 2-back test at the location of P3 and O2 electrodes was observed in the conditions in which operators experienced fatigue. 42 Previous studies have shown an inverse relationship between alpha band activity and task difficulty.51,52 The alpha band activity on the parietal site was decreased with increasing workload.46,53 Some studies have reported that theta and alpha EEG activities during the exposure to noise pressure level were increased and decreased, respectively.1,54,55 The results of this study showed that, with increasing task difficulty and noise pressure level, the electrical activity of the eye was increased, so that there was a significant difference between the eye electrical activities, the difficulty of the task and the noise pressure level; in other words, the average of the electrical activities of the eye were shortened when the noise pressure level and difficulty of the task increased. Also, under conditions of increased noise pressure level and difficulty of the task, the operators needed to concentrate more on carrying out their tasks, which in this condition blink period became shorter; this result was similar to previous studies.1,56,57
However, one of the strengths of this study was controlling of the temperature, relative humidity, and brightness simultaneously, as well as the simultaneous monitoring of physiological parameters such as HR and LF/HF in pre-exposure conditions, during exposure in three conditions with different workloads and after exposure to LFN, as well as monitoring of electrical activity of the brain and eye activity before and after exposure and checking the working memory of the participants in exposure to LFN, to have better judgment of mental fatigue. Regarding that the new job conditions of the staff of control rooms and office-like areas make changes to job requirements, such as work on a wide range of computers and processing of high load of information that requires special attention, it may cause them to suffer from mental fatigue.
Among the limitations of this study, we can point to the age range of the participants who were in the age range of 20–30 years. In this regard, this study did not cover other age ranges. Also, all the participants in this study were male, so the impact of gender was not considered in the study. It is recommended that future studies consider these factors.
Conclusion
We examined the changes in mental fatigue using ECG, EEG, EOG, and F-VAS variables (for validation of fatigue) in the N-back test in terms of exposure to LFN. The findings of the physiological indices of the study showed that the participants at the noise pressure level of 55 dBA were more comfortable at low, medium, and high workload (fewer changes in physiological indices), while for noise level of 65 dBA, the indices were comfortable in terms of low workload. Also, changes in EEG bands, such as alpha, theta, and eye activity, indicate that when the noise pressure increases, increased fatigue and stress may be detrimental to the mental health of employees. The pairwise comparison of the effects of different noise levels on F-VAS at 55 and 65 dB noise levels indicates that there are no significant changes. As regards the simultaneous examination of several physiological parameters and mental performance in the exposure noise under controlled conditions, the findings of the study can provide an appropriate view of the evaluation of fatigue and mental stress for the study of the health and safety of employees in control rooms and office-like areas.
Footnotes
Declaration of conflicting interests
The author(s) declared no potential conflicts of interest with respect to the research, authorship, and/or publication of this article.
Funding
The author disclosed receipt of the following financial support for the research, authorship, and/or publication of this article: This study was approved by the Research Ethics Committee of Hamedan University of Medical Sciences (Grant No. 9510146069). We greatly appreciate the students of Hamedan University of Medical Sciences for participation in this project.