
Abstract
Rapid and intrusive spatial adjustments in common spaces are increasingly questioned by the awareness of citizens demanding higher quality standards. This study aims to understand the use of common space by identifying how the sound environment affects the functions of space and the interaction with other environmental and spatial variables. Is there a certain sound environment required or that should be avoided when designing a space for a specific activity? In situ evaluations with regular users were collected in nine common spaces in Gothenburg, Sweden, conducting sound recordings and questionnaires. Site selection responded to the purpose of the analysed places, the noise level (LAeq) of the city road traffic noise map, and the number of activities suggested by the city sociotope maps. The analyses revealed that certain activities could be identified from LAeq values. Discriminant functions with respect to sound levels primarily identified a tranquil/restorative vibrant dimension, where the highest noise levels tend to be at the most vibrant end. Other results showed that a considerable variability of overall and visual quality judgements came from the variability in sites. These quality assessments were highly correlated, allowing both to be analysed as a single attribute. The variability in sound quality was much lower. Notable is the difference between recorded and perceived loudness. In addition, poor sound quality judgement does not seem to correlate with the perception of mechanical sources as the main source of noise.
Introduction
Urban areas have undergone a transformation through different urban fabrics. Within this transformation, the means of transport have been of great influence for the development of cities, adapting to changes in modes of transport. However, the flexibility brought by the automobile at first has been quickly diluted due to the growing traffic congestion, reaching a peak. As a consequence, cities have experienced a recent change, demanding a more walking and transit urban fabric, in combination with an automobile one. 1 The demand looks forward to rebalance the utilisation of space within the social, economic and environmental welfare.
Within this overlap, the concept of urban common spaces emerges as places of socialisation, restoration and co-creation, going beyond their materiality, as they cannot be separated from the different forms of appropriation.2,3 In this sense, the choice of going to a certain public space responds to several characteristics, both perceptual and physical: the common space is not a concrete product or a quantity, but rather a process, an active form of social relations. 4 For that to happen, certain physical conditions have to be met as Stavrides pointed out, 4 suggesting that designed spaces need more than architecture to guarantee that they will become common space. Throughout this article, the term use is identified as a certain activity that includes a thing. However, the use needs interaction to know if it fulfils the purpose. The interaction occurs through the incorporation of the term function as a set of processes and abilities capable of reflecting the use of space by people. 5 In this regard, the common space can be understood as functionality, as a space that enables people to perform certain activities, where good space is used space. 5 Achieving this entails questioning the purpose of public urban areas and how urban conditions and profiles (environmental, spatial, functional) influence their use and stimulate social practices.
Nowadays, several consolidated parts of the city are subjected to structural changes, that is, morphological changes. However, these are only relevant if they are able to provide quality and generate relationships among citizens, empowering people. Rapid and intrusive spatial adjustments have ended in harmful environmental development, whereas without environmental quality, cities can become hostile places. 6 Concerns have arisen which question that poor decisions on urban expansion can be irreversible, meaning that unplanned urban growth has no place. 7 Exploiting all the potential benefits that an urban intervention may have is decisive, even when certain aspects have not been raised as a burden. In this framework, the increased awareness of citizens who demand higher standards of quality in urban areas has become of utmost importance for environmental aspects. The spatial production demands integrative approaches that go beyond the specific current governmental agenda, involving authorities, stakeholders and citizens, requiring not only comprehensive but proactive understandings of it, allowing the people to own their environment. 8
In order to achieve this proactive and comprehensive view, the understanding of social space demands to move from the problem-solving study towards a sense-making one. The purpose is to try to make sense of the world through social, spatial and environmental relations, avoiding disconnected needs of the urban public spaces. 9 For that, it is necessary to understand the space as a social product 2 studying the consequences that a certain spatial production might have over human experience. However, public space choosing responds to several characteristics. For example, if someone decides to go with their children to play in a park, certain physical conditions are needed to become common space. 4 In this case, a playground or a large green area needs to be accompanied by a certain feeling of safety, the possibility to watch the children while being seated, the trade-off between closeness to home, the benefits of that space and so on.
Within the spatial production and its impact over human experience, the urban sound environment becomes one of the pieces of the urban planning processes puzzle. It is obvious that a location is not always chosen in a conscious way by one single characteristic, neither by the sound environment. 10 However, the urban sound environment has been one of the most overlooked aspects in urban planning processes, appearing exclusively within a legislation and noise abatement view. 11 In Europe, the outdoor sound environment is mainly addressed through the European Noise Directive 12 and national legislations. Considering it as a self-evident part of the planning process 11 may be beneficial not only for the sound quality itself; it can bring other opportunities facilitating the functions and uses of spaces, either directly, with an activity provided by the sound environment, or in an enabled manner together with other dimensions or features of the site.
With the intention to go beyond legislations, the concept of soundscape has received much attention over the last decades. Nevertheless, in 2014, a definition to standardise the concept appeared: the acoustic environment as perceived or experienced and/or understood by a person or people, in context. 13 The term context seemed to be the most relevant inclusion, possibly led by the research carried out by Nielbo et al. 14 They demonstrated, partially, the relation between action and soundscape perception, suggesting that the information of the sound environment is determined by the context. In this direction, previous studies 15 highlighted the need of information to improve the development of cities in favour of human wellbeing. It is in this inclusion of context and information where our study is interested through the investigation of ordinary urban surroundings. It is important to emphasise that the use of terms such as soundscape and acoustic environment has led to erroneous interpretations, since both have been treated by several studies as synonyms 16 or as terms excluding each other. For the purpose of this study, the broad term urban sound environment is used to embrace both the study of the functionality of spaces and the urban structure in relation to the sound environment and the perceptual construct. This way, policies can expand their horizons beyond the narrow noise abatement view of noise level reduction.
In this regard, qualities of the urban public space have been linked to the urban public activities.17,18 Approaches to evaluate the impact of the sound environment on the activities that can be performed at different places require a people-oriented view. Within this view, there has been considerable growing interest in the use of methods as soundwalks and the study of the sound environment quality.19–22 In those studies, the intention was to move away from the old paradigm of adapting the people to the environment, regardless if it is considered a bad one. With the purpose of relating the soundscape and the psychoacoustics research, different studies have identified the influence of the urban activity on the evaluation of the sound environment. For example, Raimbault 15 demonstrated that the role of activities helps to tell soundscape descriptions apart, whereas spatial attributes characterised overall impressions. Lavia et al. 23 investigated the link between activity and appropriateness; however, the study considered single sound sources in laboratory conditions, thus appropriateness of the sound environment to the setting was kept as an open question, neglecting an environmental approach. Moreover, several models have been developed trying to identify ways to study soundscape quality judgements by attributes such as relaxation, vibrancy, communication and spatiality 24 or by pleasantness, eventfulness and familiarity. 25 As mentioned, most of this research has been developed through laboratory experiments rather than in situ evaluations, limiting the study of the urban sound environment on human behaviour within a context. However, the environmental information by itself is not informative, and it must be considered in respect to the human who perceives it. 26 With this perspective in mind, the active users of the cities are the main ones modifying the environment, and the production of common space responds to the opportunities that a specific location might bring to that particular user’s experience. Embracing an environmental approach able to consider the human–space–time interaction is essential. Nevertheless, at the moment, the most used tool to study the urban sound environment in our cities is mainly through the information provided by the noise map presented by the cities, based on noise from road traffic, rail traffic, industry and aviation. 12 Within a people-oriented view, there is still some controversy surrounding the relevance of the information provided by such maps for the general public, the decision makers and the urban planners 27 who requires widening the knowledge of noise maps importance.
This study looks forward to bring further understanding of common spaces and their functionality. The main interest lies in the identification of the urban sound environment affection to the uses and functions of common spaces and how it interacts with other environmental and spatial variables. In this way, this article investigates suitable activities that can be performed in a given space for such functionality due to the influence of noise sources, the sound quality judgements and the noise levels. The former is studied through physical, environmental, perceptual variables and the suitability of specific activities to certain locations.
Based on the previous reflection, a series of research questions are addressed in this study as follows:
Is there a certain sound environment required or that should be avoided when designing a space for a specific activity? Is it possible to predict?
What is the relationship between the overall quality, visual quality and sound quality?
Do sites have an influence on the suitable activities to be carried out? Can clusters of sites (i.e. locations with similar purposes due to its physical and perceptual features) be recognised? As a consequence, could such spaces have similar uses and functions?
Can sociotope maps help to predict suitable sound sources?
What is the relation between the urban sound environment and the uses and activities performed?
Can suitable activities be predicted from the information granted by the road traffic noise mapping results provided by the city or need full understanding of the urban sound environment?
Methodology
The study includes nine common spaces in the city of Gothenburg, Sweden, studied in April–June 2017. Recordings and questionnaires were made simultaneously. With the intention to gather a large number of users, seven sites were studied during weekends between 14:00 and 17:00 h. Due to environmental issues, the other two sites were studied during working days after 15:30 h.
Selecting the locations for the study
In order to understand the experience of a place and the influence of physical and environmental qualities, nine locations were selected to perform the study. The selection responded to three criteria: the first one was based on the idea of having a variety of purposes of the common spaces, including open green areas (vegetation and/or water), open urban areas, urban parks and urban public spaces. This first criteria responds to the requirement of the study to gather a larger number of survey respondents; therefore, most of the sites are located in the city centre; the ones that are not located within the centre are places that either by their characteristics, size and/or values, are frequented by a large number of citizens (e.g. the botanical garden of the city). Second, to give a spread in traffic noise level between locations, the study used the noise map of equivalent sound pressure level (LAeq) of the latest noise mapping by Göteborg Stad Miljö, 28 based on data from 2013. Third, the number of activities that are performed at such places suggested by the city sociotope maps 29 was considered.
The concept of sociotope maps was developed in Stockholm, Sweden as a map to reflect the ‘ecological, social and cultural values’ of the open space; since then, its attention has increased. 30 Sociotope means ‘place for human activities’, 29 where the activities are linked to the experience of a place. Following Lefebvre and Ståhle words,2,30 a sociotope map represents the users’ perceived space in the collective (common) perception, where unique values are associated to the different open urban spaces. The maps are a tangible connection between the activities and functions performed at a certain space and the influence it might have on the human perception.
In the city of Gothenburg, the sociotope maps were divided into zones, including a list of activities. 29 The maps were based on interviews with users and district managers, making an inventory on site. Their intention is to be used in participation dialogues between stakeholders and citizens28,31 in connection with changes and improvements in the city.
Since the interest of this article relies on how people use the common space and how the sound environment can be relevant for it, the inclusion of the sociotope maps responds to the willingness to investigate a possible agreement between the appropriateness of the sound environment and the characteristics associated to a defined urban space (experience nature, safety, cultural heritage, sports, etc.). With the introduction of the sociotope mapping as a criteria, the use of common space shows a clear variation between sites, from a few activities to a greater number of them. Overall, 17 different site activities were collected from the 10 sites’ sociotope maps. The activities are organised in descending order of appearance, meaning that the first activity is present in a greater number of sites: rest, picnic, meeting point, green oasis, experience water, cultural heritage, play, walk, events, flowering, experience nature, cultivation, play informal games, bath, fishing, street sports and outlook.
Using sociotopes is supported by investigations as conducted by Lavia et al., 21 where they have identified a strong relationship between sociotopes and soundscapes through a social survey. The intention of their study was that respondents relate social and recreational activities in their favourite outdoor location and reflect on the appropriateness of sound sources. The in situ experience was limited to the memories of the respondents of that place, narrowing the scope of the study; however, their conclusions are a valuable starting point from which it is worthwhile to deepen. In this sense, recent efforts have been made with the intention of narrowing the gap between laboratory experiments and in situ experiments, as the one presented by Bild et al., 32 studying the relationship between use of space, context and the sound environment evaluation through a virtual reproduction of scenarios. Another interesting approach is the one by Echevarria Sanchez et al., 33 which compares the appreciation of several future renovation alternatives of a public space (a bridge) using virtual reality technology. However, both are immerse in the laboratory experience.
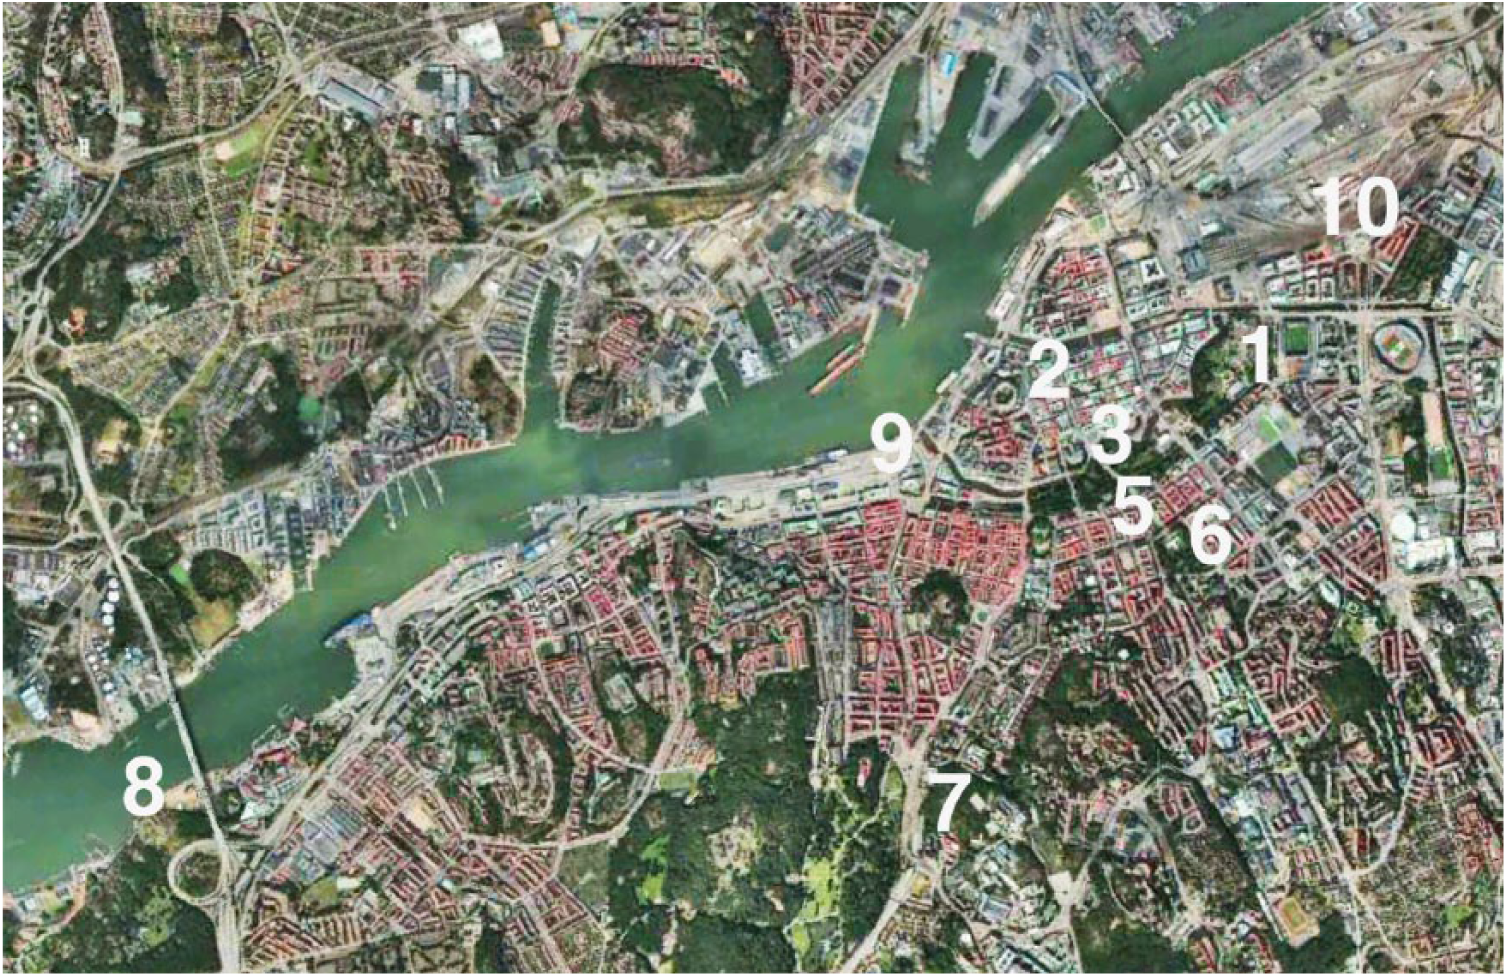
In this study, the corresponding location numbers, full names and acronyms of the sites are shown in Table 1 along with their location in the city (see Figure 1) and a picture showing the onsite survey at each location (see Figure 2). Nine locations ended up composing 10 study sites, as one of them, KPM, was studied with good weather conditions (KPM sunny day) and bad ones (KPM cloudy day), being finally considered as sites 3 and 4. Site number 10 (OP) did not exist when the sociotope maps were created. This site was considered interesting since it is a roundabout turned into a common space with a leisure space that includes a cafeteria, green areas and a water fountain where children can play.
Sites description.

Number of places selected for this study.

Pictures showing the onsite survey at each site.
Figure 3 illustrates the locations according to the three criteria mentioned above: the number of activities, the equivalent sound pressure level reflected in the city noise map of road traffic noise during the day and the purposes of the analysed places.
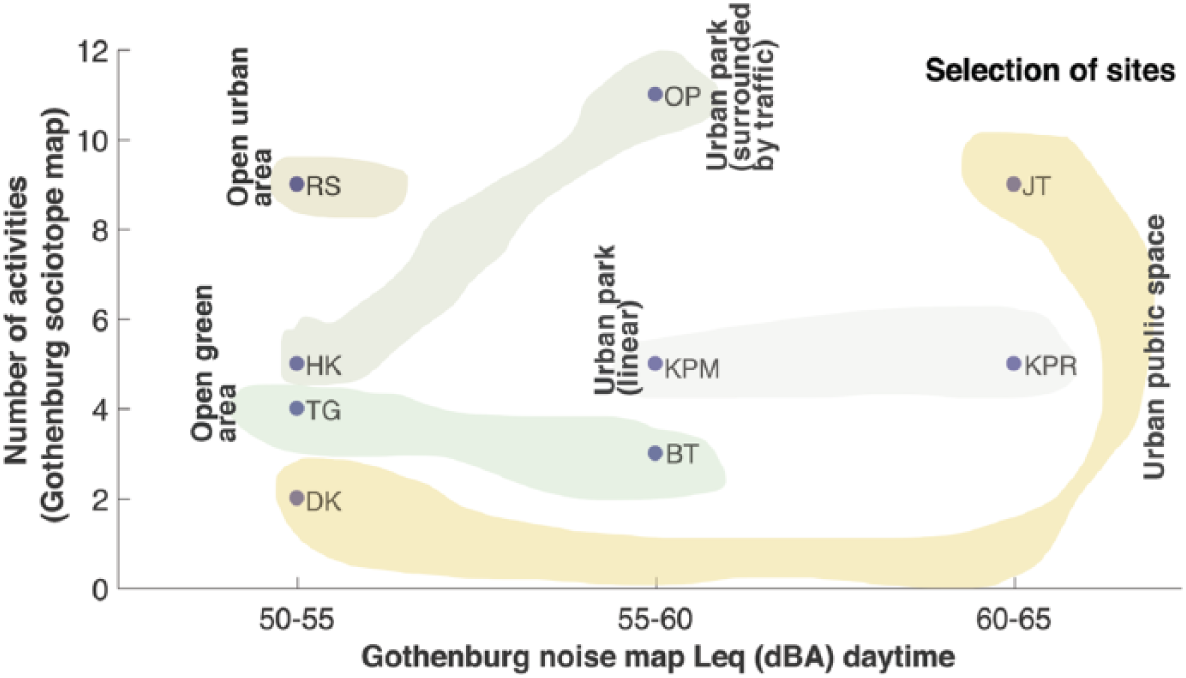
Selection of sites according to the number of activities, sound pressure level and purposes of the analysed places.
Measurements and acoustic indicators
At each site, sound recordings were performed using an in-house developed acquisition tool named TAMARA v0.218. 34 Statistical noise descriptors were captured from A-weighted SPL as percentiles: L5, L10, L50, L90 and L95 in dBA. Moreover, Zwicker’s loudness was collected, according to the DIN 45631:1991 35 as an indicator to understand the auditory sensation (see Table 2). Data collected through the TAMARA software is read using MATLAB. The analysis is performed in MATLAB (v.R2016b), SPSS (v.23) and Excel.
Measured sound level.

TG: Trädgårdsföreningen; DK: Domkyrkan; KPM: Kungsparken waterside; KPR: Kungsparken roadside; HK: Hagakyrkan; BT: Botanical garden; RS: Rödasten; JT: Järntorget; OP: Odinsplatsen.
Setup on sites included a large poster that informed people about the research study that was being carried out about the quality of the city. The recording times varied between 20 and 25 min and were repeated between 2 and 4 times until the number of respondents who had answered the questionnaire had reached the desired number between 25 and 30. This number was chosen after the test in the first site, considering these responses as a number of answers that provided a sufficiently small uncertainty of the variation between sites.
All the equivalent sound pressure levels measured at this study exceeded 55 dBA. According to the document ‘Specific objectives for good sound environment’ 36 developed by Gothenburg city that should be accomplished latest by 2020, one of the objectives is that all parks and green areas have noise levels below 50 dBA (Lday) in the greater part of the park. Another main objective is that the population must have access to a good sound environment both indoors and outdoors, making a clear reference to the outdoor noise level at home, which must be less than 60 dBA (Lday) at the most exposed facade for at least 90% of Gothenburg’s population.
Questionnaire
The questionnaire is based on previous ones used to study the sound environment in the city of Gothenburg. 37 Moreover, a set of additional questions was added based on the research performed by Kang et al.38–40 The questionnaires were available in both Swedish and English. The first page explained the instructions as well as the confidentiality treatment of the data in this voluntary study. A copy of the questionnaire in English is included in the Appendix.
The questions were collected in four pages; the first set of questions was related to the visit frequency and duration; also, closeness to home was asked in minutes and means of transport. To continue, respondents were asked to answer about their main purpose to visit the site, marking a maximum of three options, ranking them as 1, 2 and 3. For that, a list of common activities was proposed, responding to the activities proposed by the sociotope maps. However, certain activities were erased since it was not possible to perform them in the sites that were studied (e.g. fishing); other activities were grouped (e.g. flowering, cultivation, green) or included in the list (e.g. shopping). Knowing the main purposes for visiting the sites has to do with the function of the space. In this way, users reflect their use of the space. The activities listed as main purposes to visit the sites were ‘reading, children, pets, walking, sports, nature, tranquilly, meeting friends/relatives, shopping, travel’; respondents had also the opportunity to add another activity that was not on the list (e.g. coffee break). Next in order, the respondents were asked to answer about the general qualities of the sites: overall quality (QA), visual quality (QV) and sound quality (QS) of the area on a 11-point scale from bad to very good.
The second set of questions dealt with the suitable activities for the specific location, responding to the previous study carried out in the city of Gothenburg, 37 together with the list of sociotopes developed by the city 29 and the research done by Lavia et al. 21 The list and their abbreviations, used from now on in this study, are shown in Table 3 with a scale of 1–5 (‘not applicable, slightly, moderately, very and perfectly’).
Suitable activities and abbreviations.

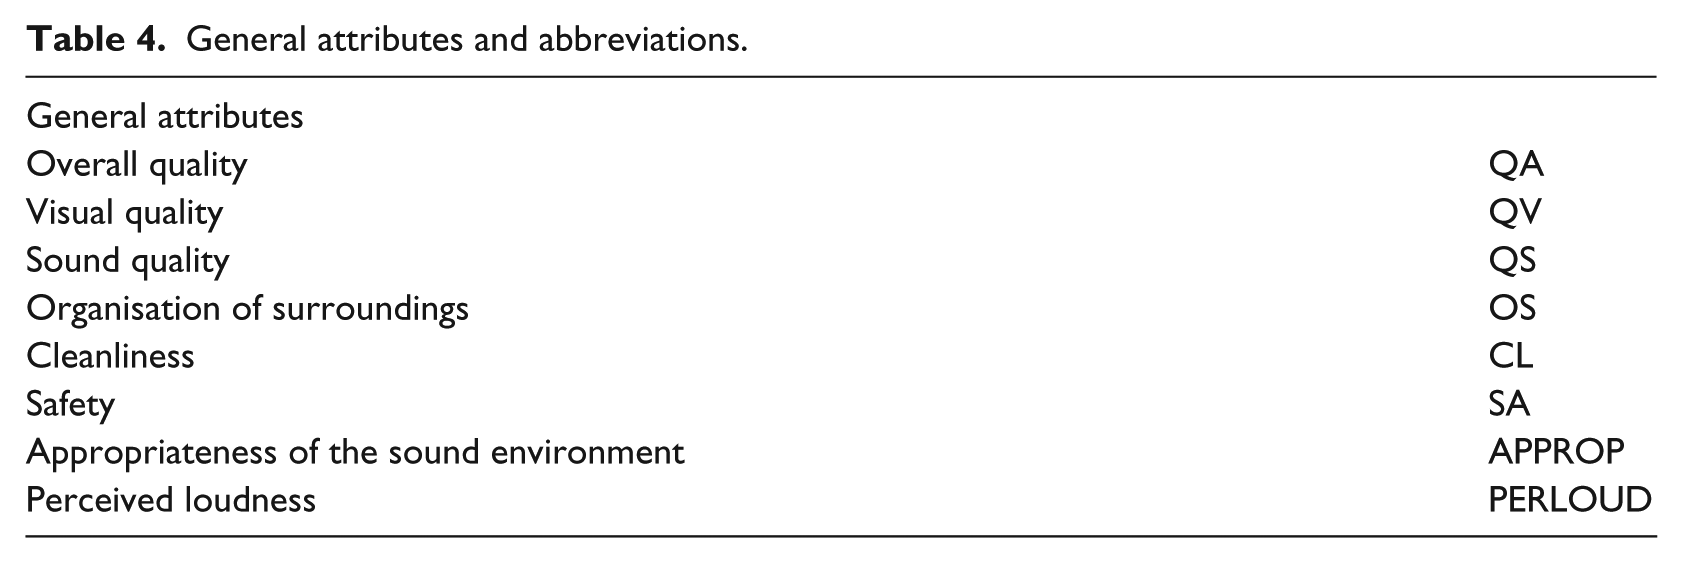
Other characteristics of the sites were requested, such as the organisation of surroundings, cleanliness and safety. In addition to the question regarding the sound quality, two more questions about the sound environment were added: the sound appropriateness to the site and the perceived loudness. All these questions used a 5-point category scale: ‘not at all, slightly, moderately, very, extremely’. Table 4 shows the abbreviations used for the general attributes, including the qualities of the site requested in the questionnaire.
General attributes and abbreviations.
To study the perception of the sound environment, eight affective attributes based on the research performed by Axelsson et al. 25 were selected following a 5-point category scale: ‘strongly disagree, disagree, neither agree/nor disagree, agree, strongly agree’. In addition, respondents were asked to complete a list of the main noticed sound sources in descending order, with a maximum of five sound sources. These sources were later classified as mechanical, human and natural sounds. The last page of the questionnaire included a set of personal questions (age, gender, occupation, highest educational level) and a space to write comments about the questionnaire and research purpose.
All respondents were current assistants to the sites, which means that they did not receive previous training, being different respondents in each of the sites. The team asked, one by one, the people who passed or sat in the area if they wanted to participate in the study. This procedure took between 30 and 120 min on each site.
Since the sample size was small (<35 samples per site), the Shapiro–Wilk test was run to verify that all data were normally distributed (.83 < W < .97; p > .05), except for the adjective ‘monotonous’ (p = .04). Afterwards, Pearson’s correlation analysis was performed among the different variables.
Analysis, results and discussion
General characteristics of the respondents
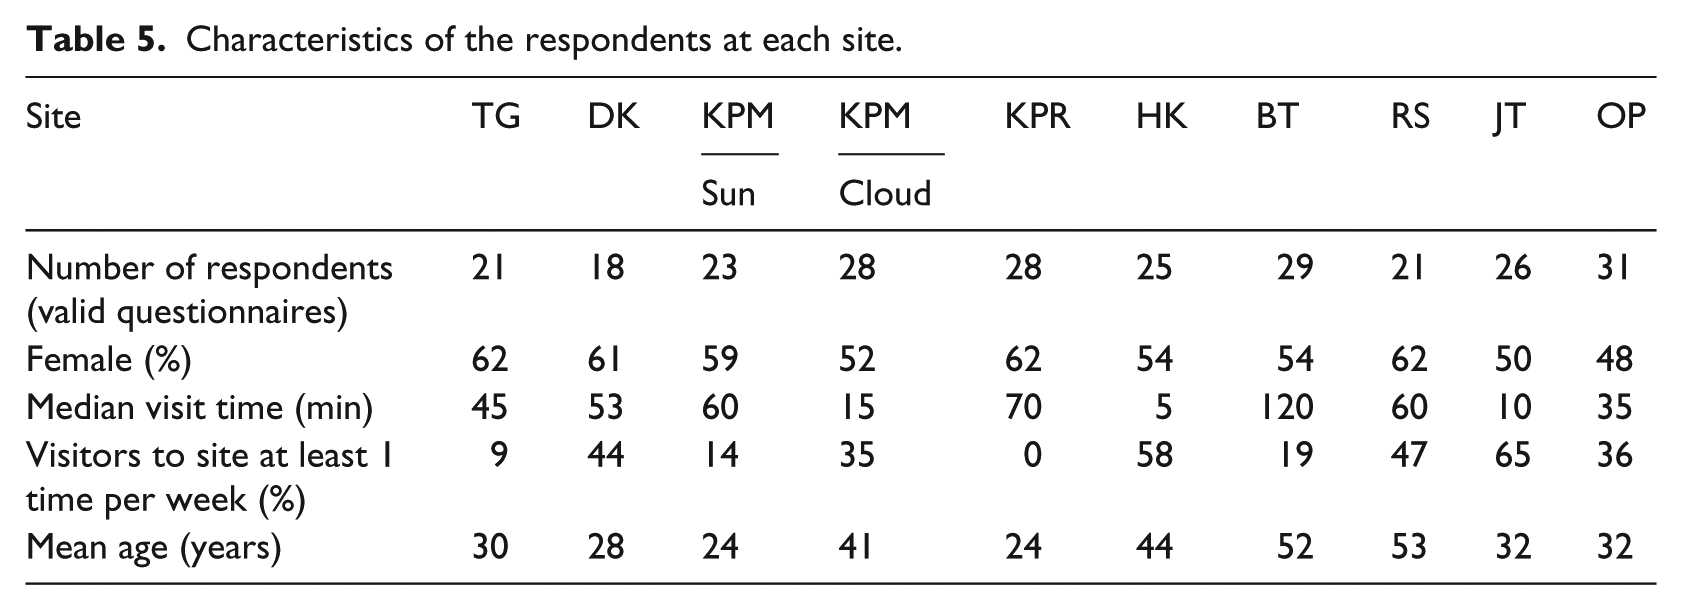
The general characteristics of the respondents can be seen in Table 5. Sites 1 (TG), 2 (DK) and 3 (KPM-sun) had less than 25 respondents, since several questionnaires were rejected for different reasons: in the questionnaires not completed in their entirety, the respondents indicated that they did not have a normal hearing, lack of coherence in the questionnaires and so on. The percentage of women in different locations was between 48% and 62%. The number of respondents who visits the site at least once a week was relatively high in most places, with a mean value of 33% visitors.
Characteristics of the respondents at each site.
Users’ purposes to visit the sites and the relation with the sound measurements
Results on the main purposes of respondents to visit the sites are shown in Figure 4.

Three main purposes of users to visit the sites.
It is interesting to see how the same site, named KPM, studied in two different days, one sunny and one cloudy, showed a different set of purposes for visiting the site. While with a sunny condition, activities were oriented towards ‘tranquillity’, ‘nature’ and ‘walking’, whereas during the cloudy day, the activities were transitive as ‘travel’ or urban as ‘shopping’ and ‘meeting friends/relatives’. In addition to the above, the most notorious differences with respect to the rest of the sites were found at site KPR, characterised by being a popular place during the days of good weather, bringing together young people to share leisure time.
The activities included in the sociotope maps are shown in Figure 5. Half of the main activities carried out by the users were highlighted in the sociotope maps; however, activities marked as main purposes for users, such as ‘travel/pass by’ as a transitory space and ‘shopping’, were not collected as activities in the sociotope maps. Since site OP was not included in the sociotope maps as it was build later, the site was included as ‘green’ due to the responses collected with respect to main purposes of going to this area.
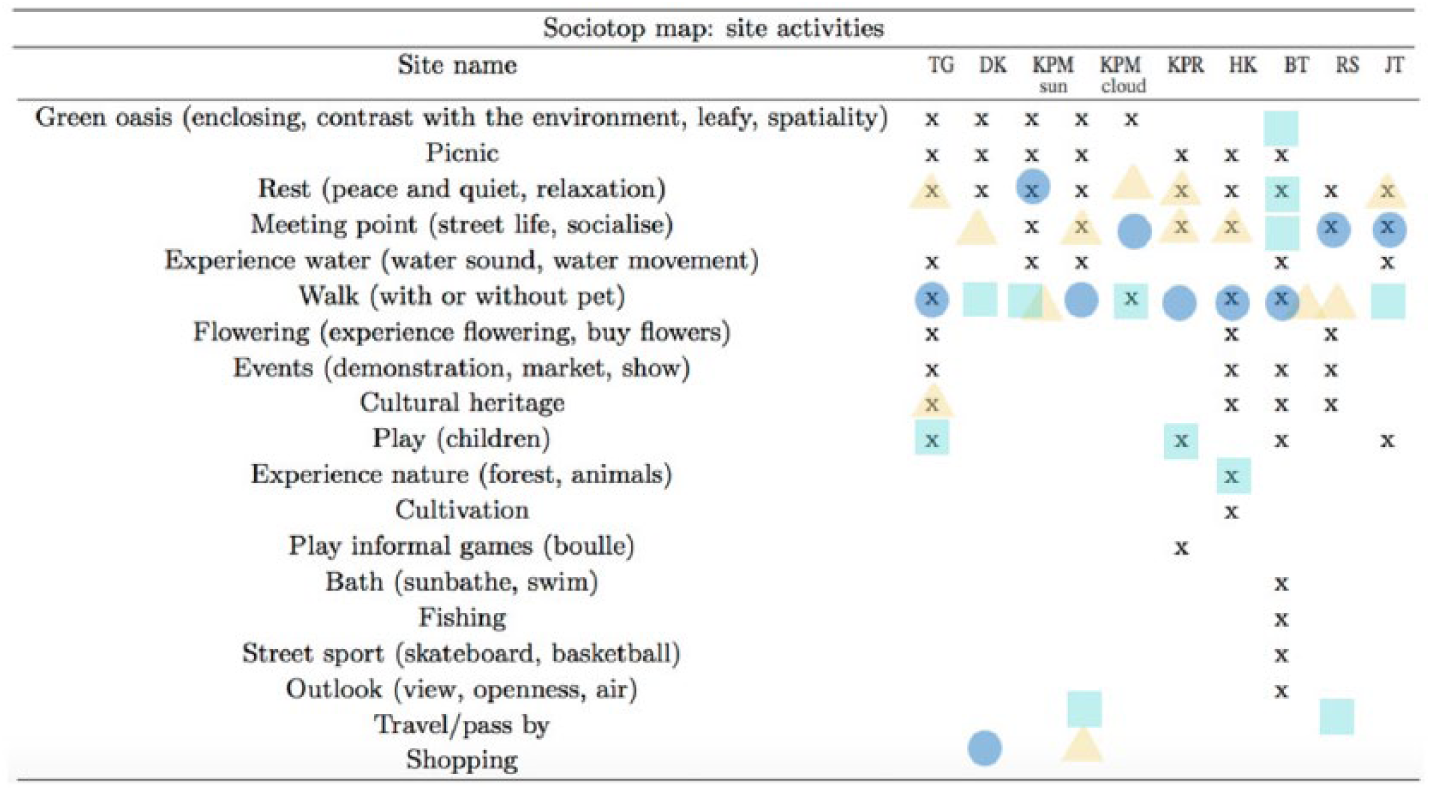
Sociotope activities marked with an ‘x’ and the three main purposes highlight by the respondents to visit the site – circle: first main activity; square: second main activity and triangle: third main activity.
It can be concluded that sociotope maps are a good tool to analyse the functionality of a space; nevertheless, further development is needed to successfully capture the experiences of citizens. In this sense, the human response to how they want that space to be or how that space resembles other spaces in their memory could influence how they are evaluated, since citizens may get used to these types of stimuli, shaping the human perception of quality.
To go one step further in the sense-making study of the consequences of spatial production in human experience, the main purposes to go to the different sites were divided into passive and active (see Table 6). In the first group, ‘reading, walking, experience nature and experience tranquillity’ are associated, while the second includes ‘shopping, meeting friends/eating, travel/pass by, pets and let the children to play’.
Passive and active purposes as main purposes to visit the sites.
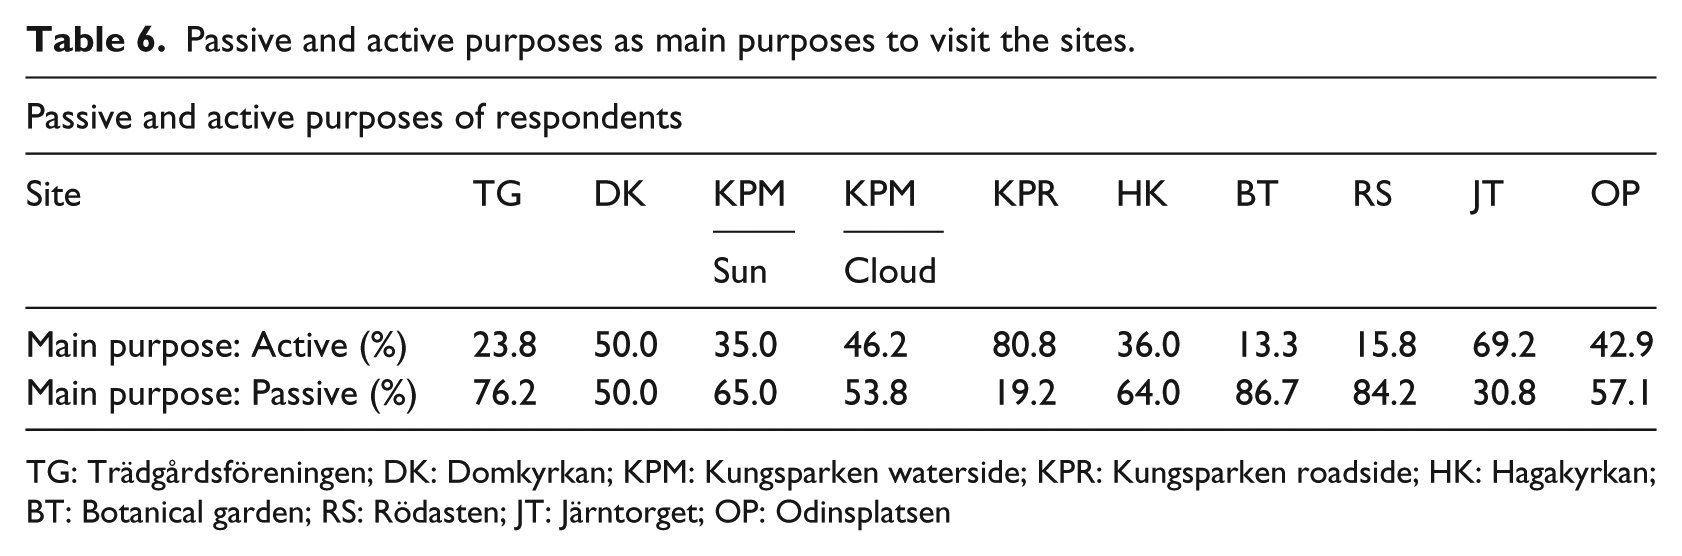
TG: Trädgårdsföreningen; DK: Domkyrkan; KPM: Kungsparken waterside; KPR: Kungsparken roadside; HK: Hagakyrkan; BT: Botanical garden; RS: Rödasten; JT: Järntorget; OP: Odinsplatsen
When the passive purposes of visiting the sites were marked as the main ones, QV was highly correlated with them (r = .7435, p = .013), indicating that it is possible that the QV of the space is important to develop these passive activities. About the sound environment, its appropriateness was also highly correlated in a positive way (r = .7047, p = .022); when the APPROP is rated higher, more passive purposes were realised.
Passive purposes were also strongly correlated with PERLOUD in a negative relation (r = −.772, p = .008). No significant correlation was found between passive purposes and the results of the noise measurements. Likewise, passive purposes were also highly negatively correlated with the ‘chaotic’ affective attribute (r = −.701, p = .024). From these data, passive purposes seem to be more appropriate when the perception of loudness is lower; however, no significant correlation was found with the measured loudness. Similar conclusions are found when studying the different sites and the measured and perceived loudness (see section ‘The perceived quality of the sound environment’).
Sites’ overview
The variability of all the attributes in the studied sites is shown in Figure 6, where data have been normalised to 0–1. The high variations between responses are found especially in activities such as ATRV, AWAT and AESCSTR.
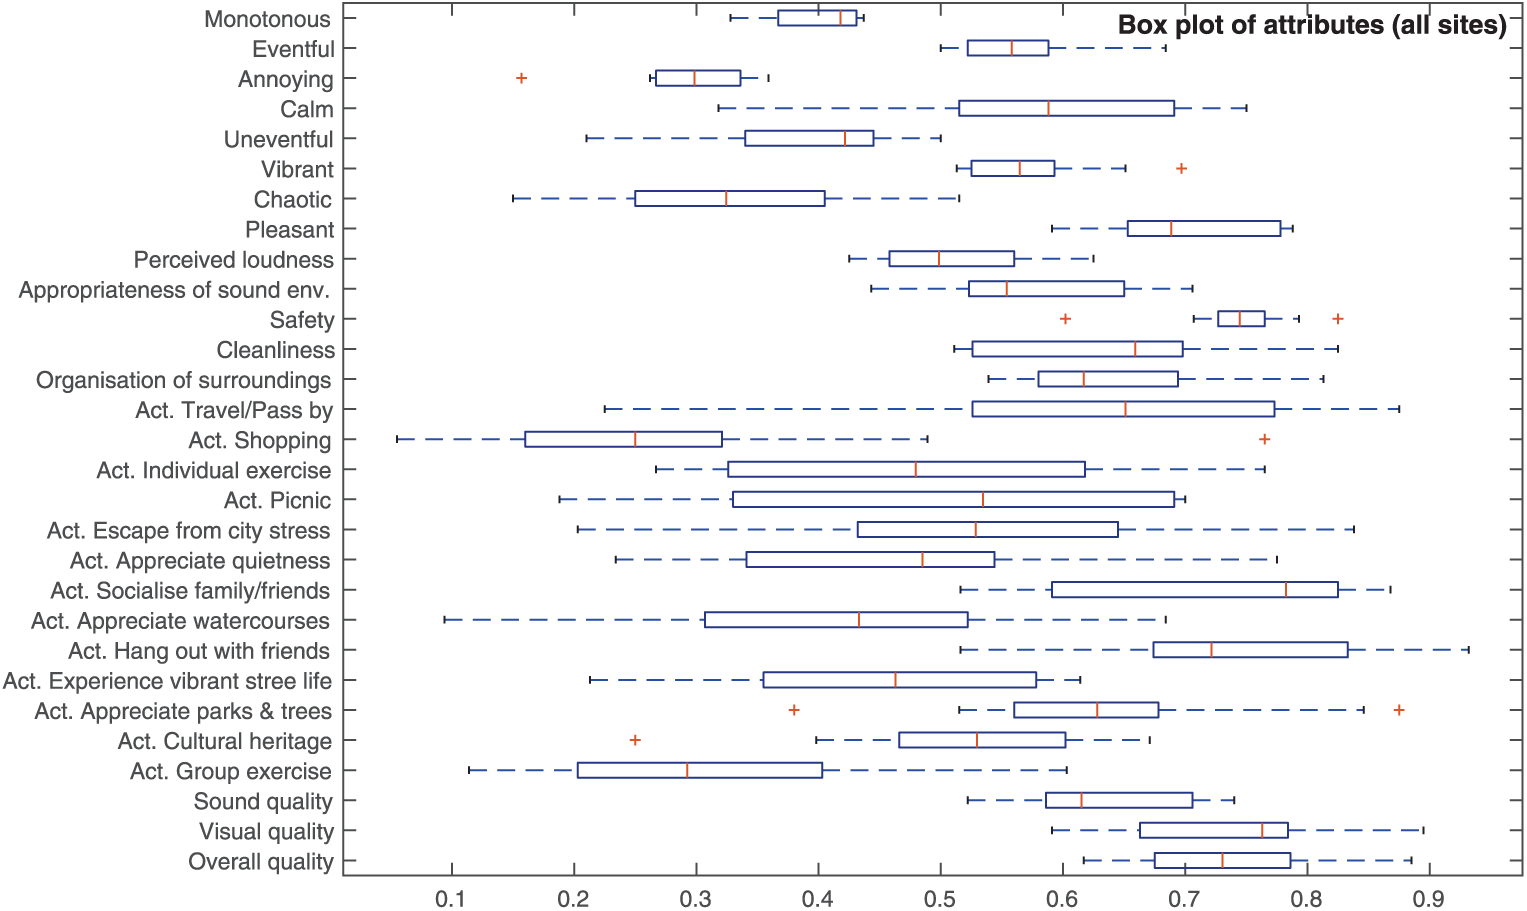
Box plots of attributes.
Remarkable is the small variability of the attribute SA among all the answers and the adjective ‘annoying’. The latter can be subjected to an in-depth study to understand whether ‘annoyance’ is the appropriate question/adjective to ask about the perception of the sound environment, as it seems to be strongly influenced by other site properties and user perception; for example, the users of a place usually go to it because they enjoy the area or have to go for different reasons (e.g. buy something, go to their workplace, etc); this can lead to users getting used to certain levels of noise, to some discomfort, or to certain visual qualities or lack of them, conditioning their responses. One of the main limitations of the study is the relatively small sample size and the fact that this could lead to a large dispersion among the responses at each of the studied sites. However, the overlap between the responses of the sites (95% confidence interval (CI)) could also indicate that there is a lack of understanding of this adjective among the respondents (see Figure 7).
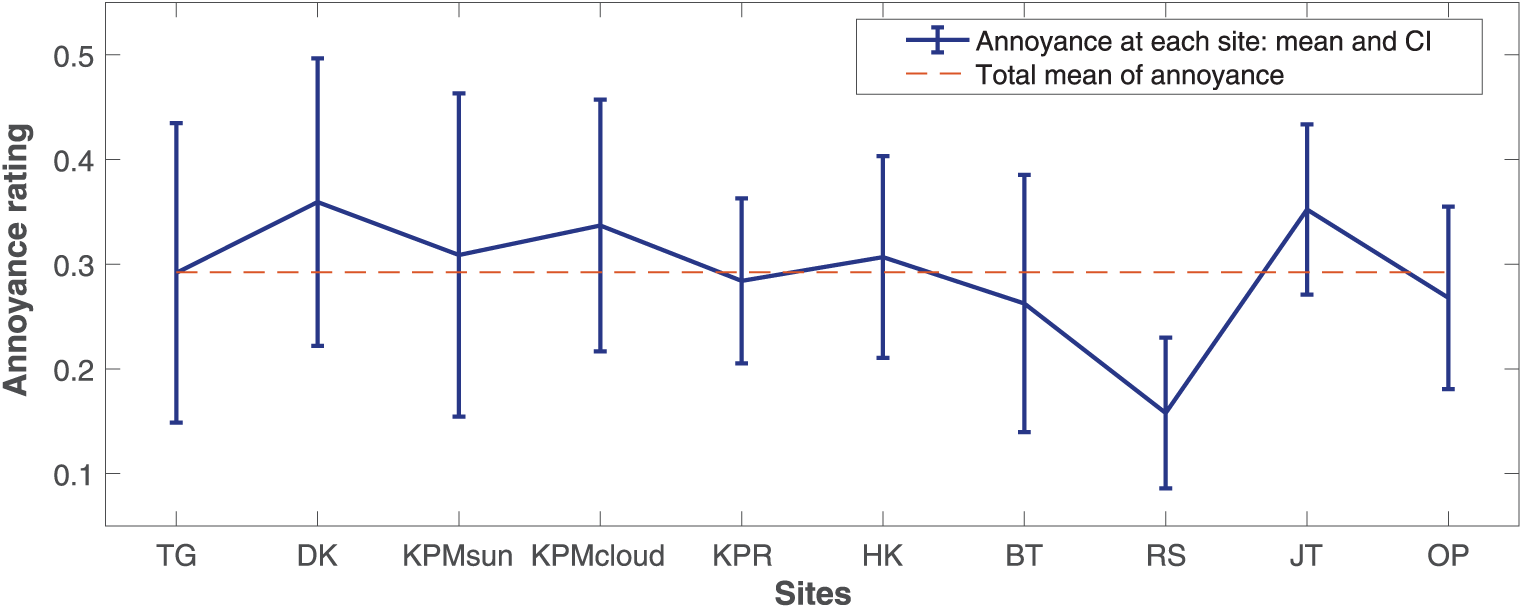
Annoyance: answers from respondents at each site.
Sites’ perceived qualities and general attributes
The perception of quality is important to study acceptance among users. In this study, three qualities that qualify the sites were asked: QA, QV and QS. Levene’s test for equality of variances is carried out, showing that they have equal variances (p > .05). QA and QV are following a very similar trend among sites, as shown in Figure 8 with a very strong positive correlation (r = .943, p < .001). The analysis shows that the mean values of both have almost a correlation of .95, which results in statistically similar responses, allowing a unique evaluation of these two dimensions. QS also followed a positive correlation with QA (r = .747, p < .05) and QV (r = .683, p < .05). Along with it, other site attributes such as SA followed the trend, being the quality assessment and the feeling of safety in the public space linked together (r = .840, p < .01).
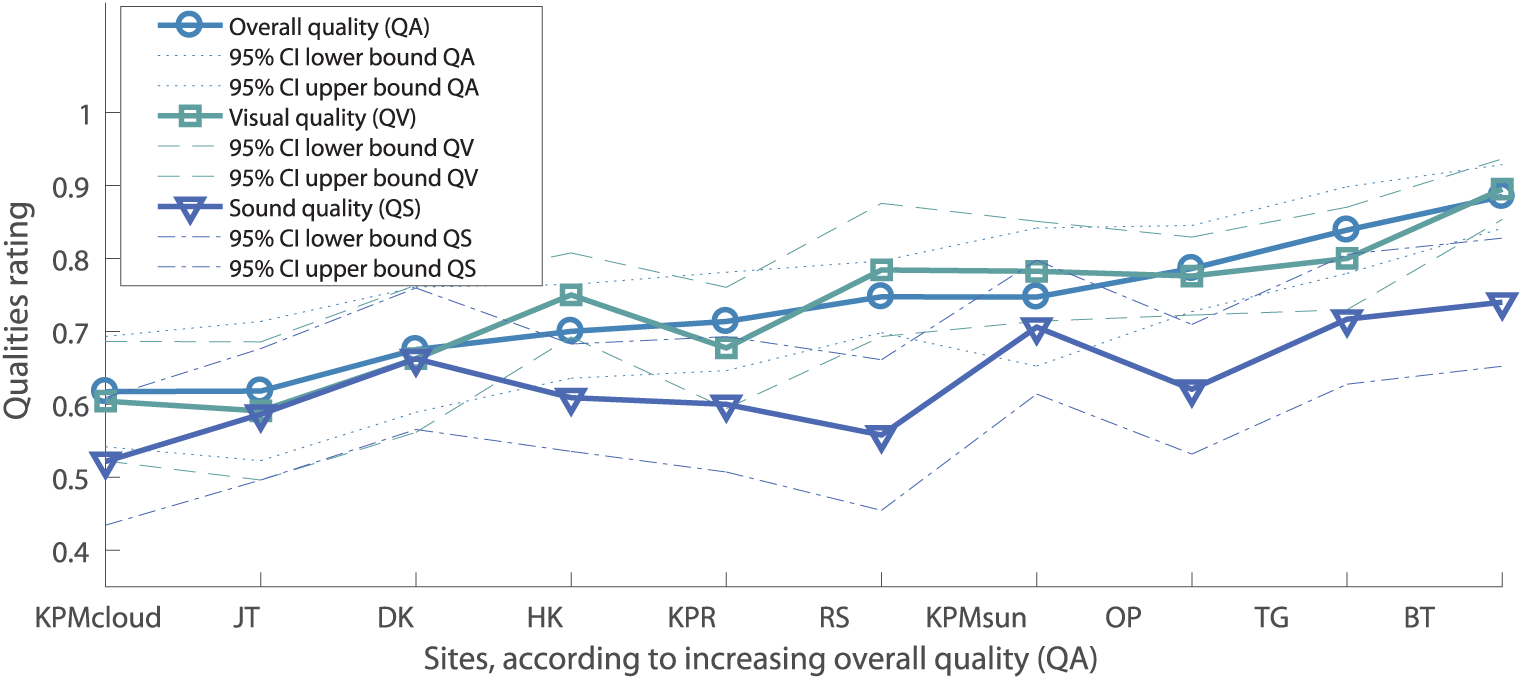
Qualities of the sites.
The perceived quality of the sound environment
Following the idea of finding the correct questions and the adjectives to be asked to non-trained ‘in situ’ respondents, the following paragraphs investigate the influence of the sites in the sound environment.
In our study, a high correlation is found between the mean values of the sites with respect to the attributes QS and APPROP (r = .810, p < .05). Large overlaps of CI occured, implying that there are no statistically significant difference between the sites; however, some statistical differences appeared at certain sites, as can be seen in Figure 9. This lack of difference, which is already shown in the attribute ‘annoyance’, entails that there may be a problem with understanding these concepts, and larger samples are needed to evaluate this aspect. However, in this study, we want to raise the question about the capacity of non-trained and regular ‘in situ’ users to judge their environment according to the attributes we present to them.
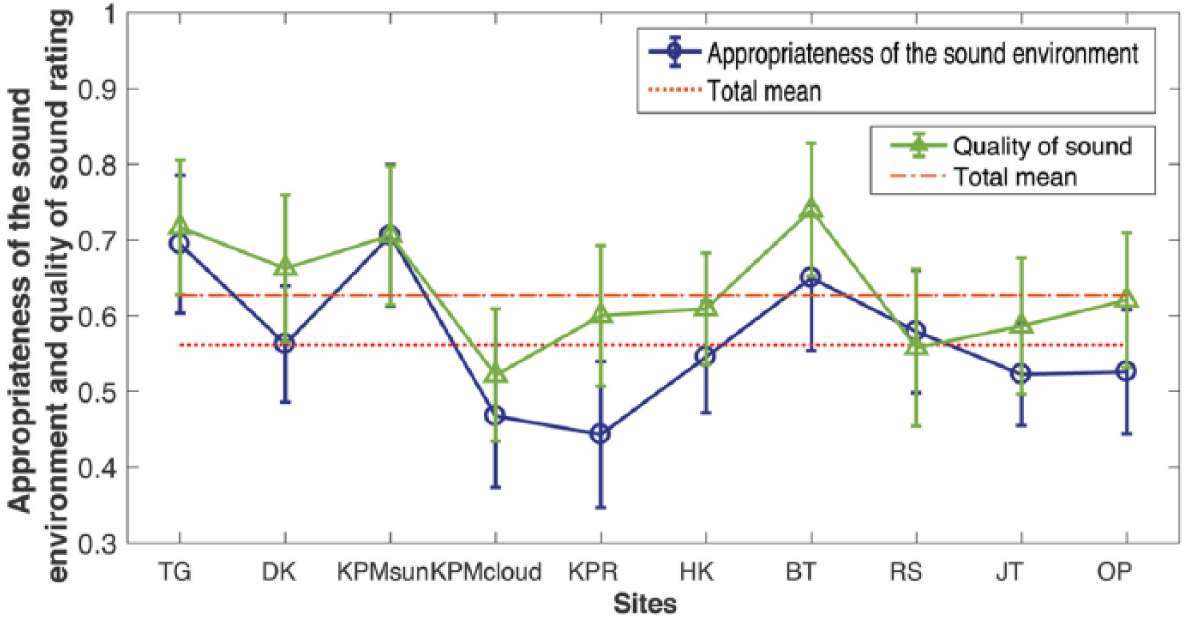
Appropriateness of the sound environment and quality of sound at each site.
To determine whether there is any statistically significant difference between the means of the sites regarding these attributes, one-way analysis of variance (ANOVA) was performed to study the significance of the previous analysis. This indicated that for both attributes, QS and APPROP, Levene’s test of homogeneity of variances was not violated (p > .05), and there is a statistically significant difference in the mean of QS (F(9, 198) = 2.617) and APPROP (F(9, 198) = 4.401) between the different sites. However, it was shown that it was only significantly different (Tukey’s post hoc test) for the QS attribute between sites KPM-cloud and BT, making almost all sound qualities equal regardless of the sites, and in the APPROP attribute between sites TG and KPM-cloud, TG and KPR, KPM-sun and KPM-cloud, KPM-sun and KPR and KPR and BT. PERLOUD is also an attribute that determines the perception of the sound environment. Although high correlations were found with QS (r = .737, p = .015) and APPROP (r = −.877, p = .001), the homogeneity of variance (Levene’s test) was violated.
Despite seeing certain correlations between the attributes, a moderate positive correlation (r = .589) has been found between the current measurement of loudness at the different sites and the mean judgement of perceived loudness by the respondents in each site; however, this was not statistically significant (p = .07). PERLOUD hardly varied in median value across all sites (see Figure 10). This lack of significant association between PERLOUD and the measured loudness could be due to the lack of test power, being around 40%. Increasing the sample size appears as the most effective solution to increase test power. However, other variables are influencing this correlation, for example, the purposes of the analysed sites. Larger number of sites with similar purposes and different loudness levels should be tested.
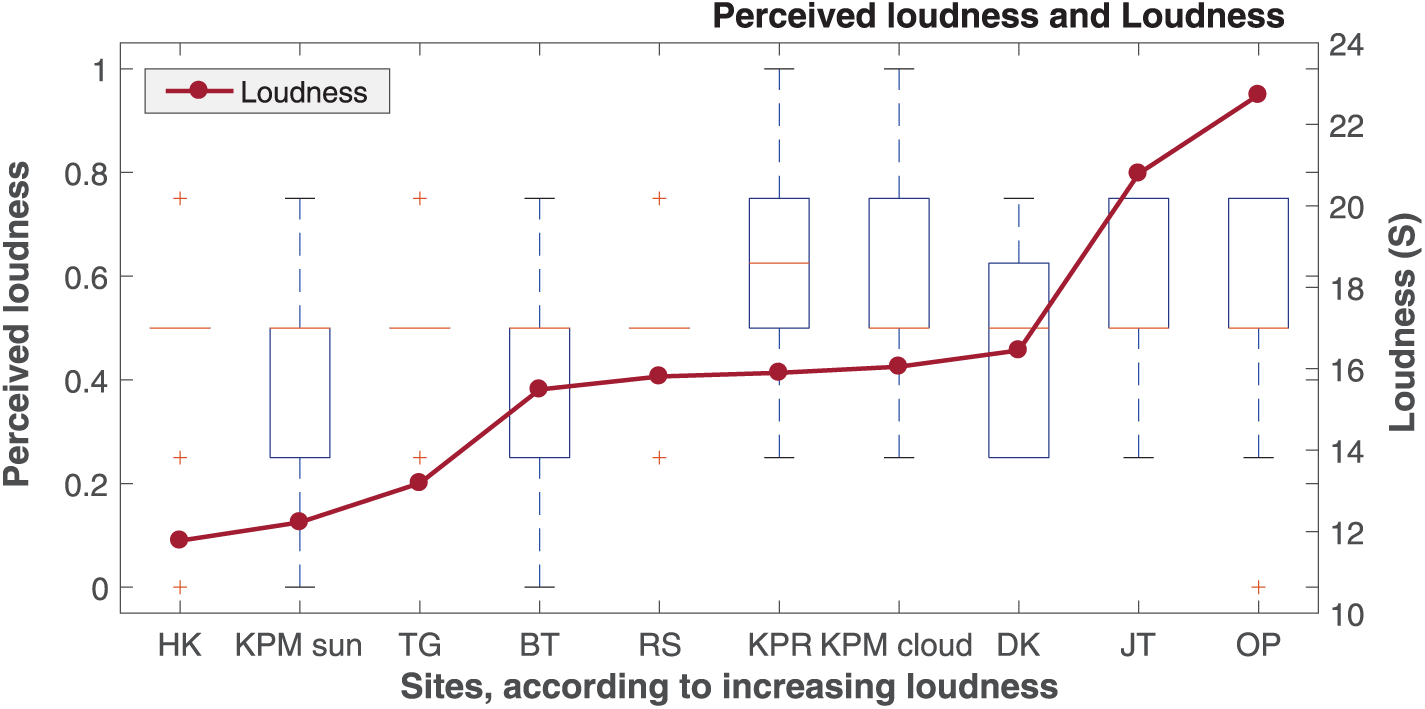
Measured loudness and perceived loudness.
Site qualities and mechanical sound sources
It has been argued that mechanical sound sources in cities are the ones that lead to poor sound quality, taking control of other types of sound sources, where the term ‘noise’ has been generally understood as mechanical sounds. 41 In general, this type of sound sources have been among the most unpopular sounds 42 and less pleasant, specially when they come from private vehicles. 43 However, how much does the presence of mechanical sources influence the quality evaluation of the sites? In our study (see the red line in Figure 11), there is a decrease in QS compared to QA and QV. This fact occurred not only in the sites with the highest percentages of mechanical sources heard (>80%), such as sites 5 (KPR) and 8 (RS), but also in sites with a much smaller number of mechanical sources heard (i.e. sites 1 or TG and site 10 referred as OP). A one-way ANOVA was performed by dividing the percentage of mechanical sources as the main source heard into five groups: 0%–20%, 20%–40%, 40%–60%, 60%–80% and 80%–100%. No statistically significant difference was found between the percentage of mechanical sources heard as the main source with respect to the QS (F(4, 203) = 1.412; p > .05). With these results, it seems that a greater presence of mechanical sound sources does not directly lead to a poorer sound quality evaluation.
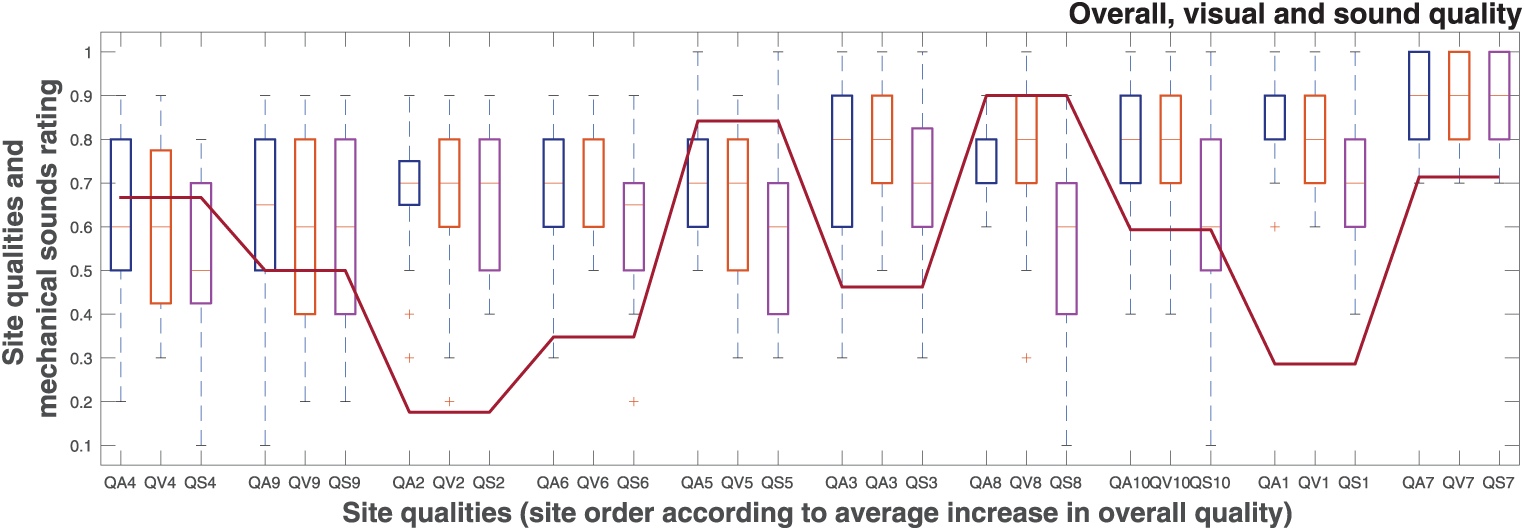
Qualities of the sites and mechanical sounds as the most prominent source (red line).
Of interest is the relationship between PERLOUD marked as high (4 and 5 on a scale 1–5) and the percentage of mechanical sound sources mentioned within the three most prominent sound sources. No positive trend was found (r = .51); nevertheless, the trend tended to increase (r = .61) when percentages higher than 40 were considered for mechanical sound sources mentioned as prominent, which means that this type of sources were the ones dominating the sound environment. However, there are three sites that have the highest percentage for both attributes (see Figure 12). At those sites, the vehicles are visible and located near by (denoted as ‘direct traffic noise’), compared to the sites where the percentage of high perceived loudness is smaller. These results are in line with several studies that emphasise the interaction effect between visual and auditory perception, starting with Southworth 44 who highlighted the relationship between visual and acoustic urban experiences. Other researchers conducted laboratory studies that found a significant improvement in certain cases in the assessment of comfort when urban information was added. 45 In our study, relevant research on notice-events supports the results, suggesting that sound-events play an important role in the prevalence of noise annoyance,46,47 updated by studies on notice events. 48

High mechanical sounds and perceived loudness.
This is reinforced by using one-way multivariate analysis of variance (MANOVA) analysis, in which the three sites with visible and near traffic are collected compared to the rest of the sites. The intention is to see whether certain activities are more likely to take place in a type of site due to the presence or the absence of direct traffic noise. The one-way MANOVA shows a significant multivariate main effect of this clustering of sites, where Box’s M test for equality was satisfactory (p > .001). Levene’s test of homogeneity of the variance assumption was considered satisfied.
One-way ANOVA in each of the 13 dependent variables was performed as a way to determine how the suitable activities differ between the two clusters of sites. Six suitable activities were statistically significant: ACULT (F(1, 206) = 34.471; p < .001;
There is an interaction effect in certain activities ACULT, APARK, AQT, AESCSTR and AIEX were more likely to occur in sites with no direct traffic noise. Conversely, AVIB activity is more likely to be present in sites with direct traffic noise. The test highlighted that the presence of noise events at sites that do not present direct traffic noise may influence the probability of performing certain tranquil/silent activities.
Same site and different weather conditions
As noted, the KPM site was studied on two different days one when the weather conditions involved a sunny day (KPM-sun), corresponding to site number 3, and the second during a cloudy day (KPM-cloud), called site number 4. In general, both the judgement of the attributes (Figure 13) and the suitable activities to be performed (Figure 14) differed substantially. The mean values of QA, QV and QS quality characteristics were lower on the cloudy day. Other characteristics such as ‘organisation of surroundings’, ‘cleanliness’, ‘feeling of safety’ and APPROP also decreased, while PERLOUD increased. Of all attributes, QA, QV, QS, OS and APPROP were statistically different (p < .05). The mean values of most of the suitable activities decreased on the cloudy day, except AWAT and ATRV; nevertheless, only a few were statistically different (p < .05): AGEX, APARK, AH, ASOC, APIC and AIEX.
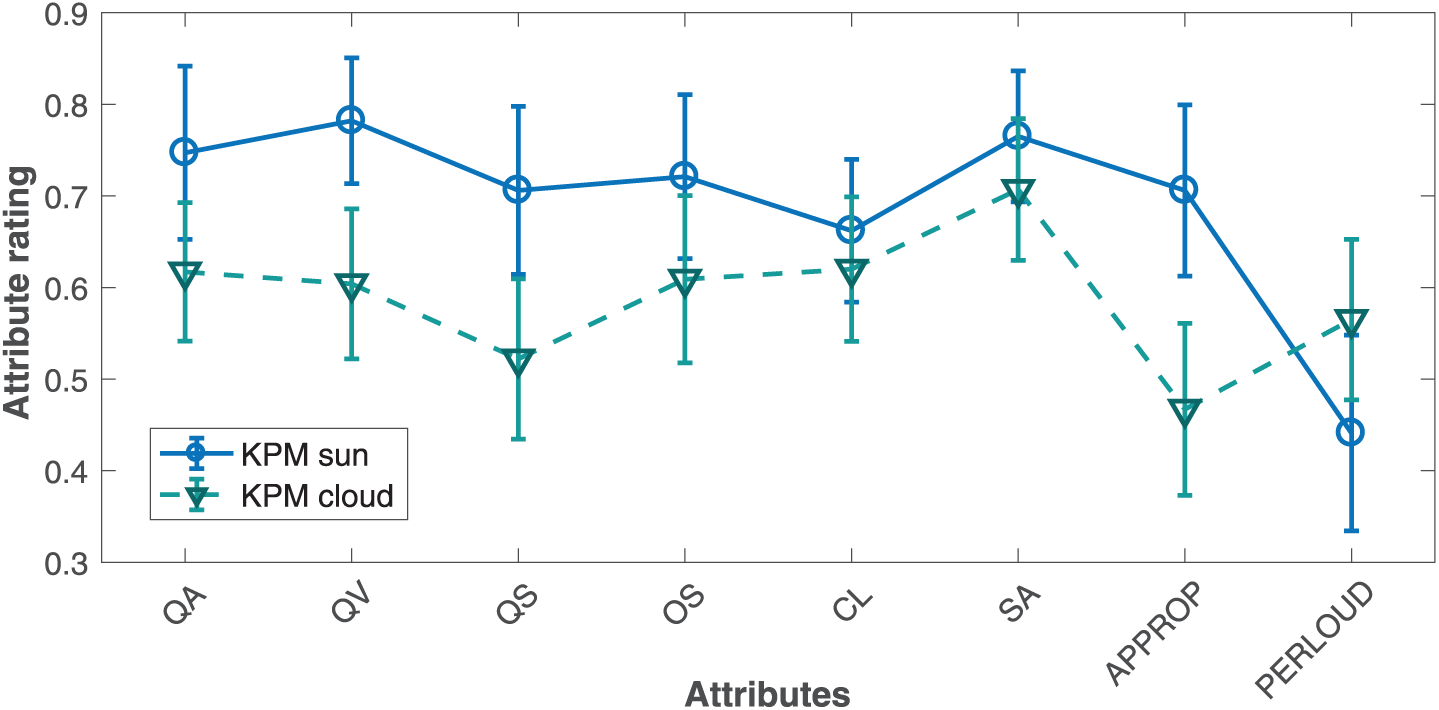
KPM site (numbers 3 and 4) – attributes.
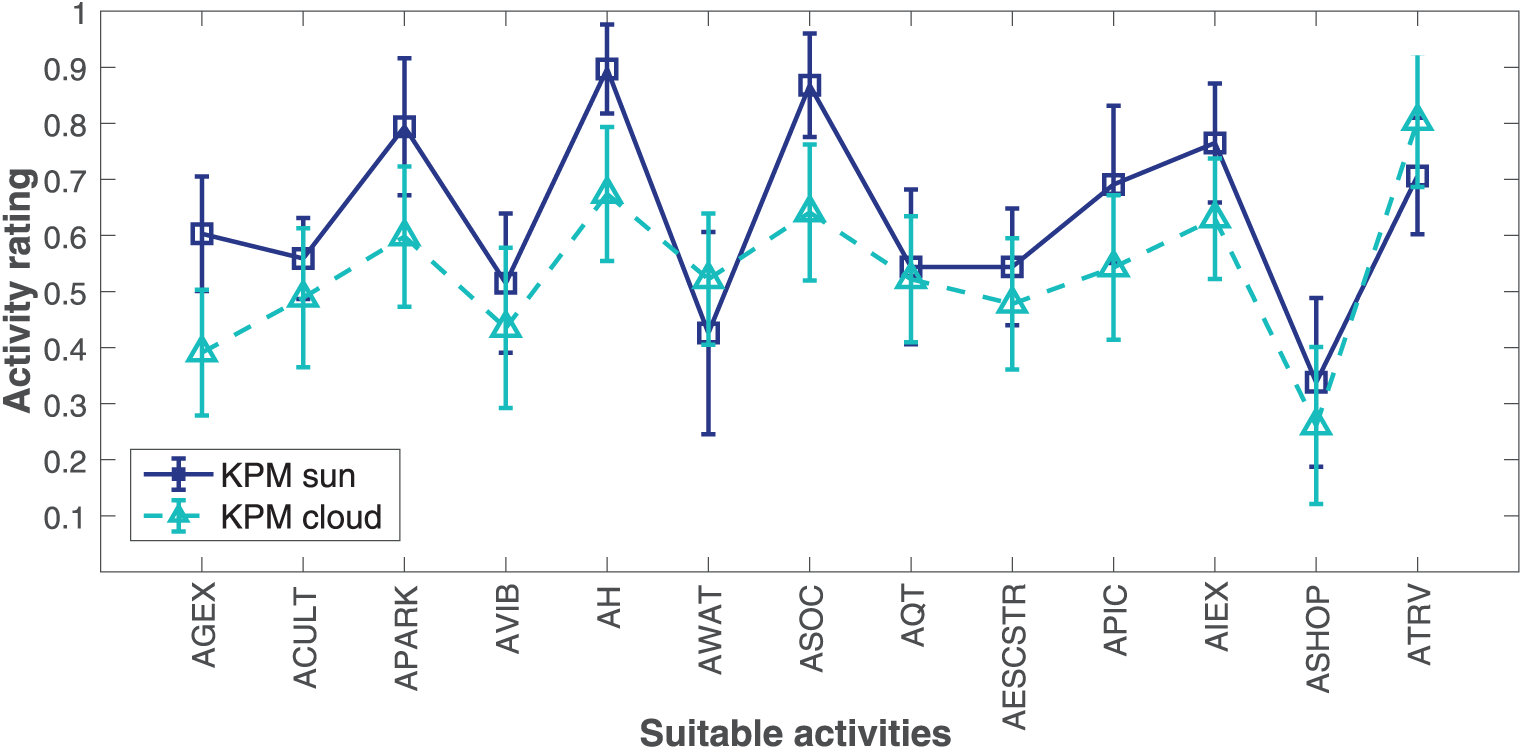
KPM site (number 3 – sunny and 4 – cloudy) – suitable activities.
Figure 15 represents the perception of the respondents according to the eight affective attributes that characterise the site. With bad weather conditions (site 4, KPM-cloud), the site was perceived with more intensity for most of the affective attributes, with a greater number of people classifying it with higher scores. The attributes ‘pleasant’ and ‘calm’ maintained a similar distribution of results during the 2 days. The results showed that in both cases, the respondents maintained a similarity of responses to how pleasant the site was; however, other attributes such as ‘chaotic’ and ‘eventful’ were the ones that varied, having a greater number of people who classified them with higher scores during the cloudy day. In first instance, this difference could respond to the weather conditions. However, there were other variations that are mentioned below, which have also been able to contribute to these differences. The sound levels increased during the cloudy day (see Table 2) around 5 dBA (LEq). However, analysing only two sites, it is not possible to say that this increase in sound levels was sufficient to have an impact on the perception of the site. Other factors such as the previously mentioned weather conditions or the different purposes to visit the site could have a certain influence on the judgement of the respondents about the quality of the site. To know the causes of these variations, more studies with larger samples and a larger number of sites are necessary.

Perception of sound environment in the KPM site. (Left) sunny day (number 3). Right: cloudy day (number 4). The colours are normalised according to the number of responses, where light blue represents a smaller number of respondents, increasing the number until reaching the dark blue.
Differences in functionality of spaces when different sources are accounted for
With nearly 70% of Europeans living in urban areas exposed to harmful noise levels (Lday > 55 dBA) from road traffic, 49 the interconnections between urban planning and noise reduction must be enhanced. One of these interconnections looks towards the evaluation of the possible impact of noise levels on the activities that can be carried out in different places and how their purposes are determining their functionality. In European agglomerations, land use and planning measures represent around 15% of the total measures. 50 Given that the most common tool for assessing the sound environment in our cities is the noise map based on noise from road traffic, rail traffic, industry and aviation 12 presented by the different European cities, this article attempts to analyse whether the functionality of spaces can be interpreted from traffic noise maps or need a full understanding of all sound sources present, including natural and human sounds.
The study includes two different ways of studying the sound environment in terms of noise sources. The first responds to the road traffic noise maps of the city of Gothenburg, counting only the noise coming from road traffic (see Figure 3). The second way is the one made for this study through in situ recordings that included the entire sound environment (see Table 2).
Large differences were found with respect to the LAeq values between sites with respect to the two ways of studying the sound environment: the noise maps of the city of Gothenburg 28 and the recordings. For their study, the noise levels were grouped into three ranges: 50–55, 55–60 and 60–65 dBA (LEq). Five sites (KPM-sun, KPR, BT, JT and OP) were kept within the same noise level range, while the rest presented higher noise levels when the recordings were considered. Sites that showed the largest differences were sites DK and RS, jumping from the range 50–55 dBA to the highest (60–65 dBA).
To study the differences with respect to the suitable activities and the two different ways of studying the sound environment in terms of noise sources, Figures 16–18 show the mean values given by the respondents to the 13 suitable activities within the three ranges of groups of noise levels. The suitable activities are presented in ascending order according to the overall mean value marked by the respondents when the noise levels of the city noise maps are used. None of the recordings showed noise levels within the first range of noise level groups, which shows that there is a disagreement when other sound sources were included. Nevertheless, Figure 16 allows the observation of activities that are most likely to be performed in the presence of low road traffic noise levels. APARK appears together with ASOC and AH as highly present activities with low noise levels, while ASHOP and AGEX are barely present.
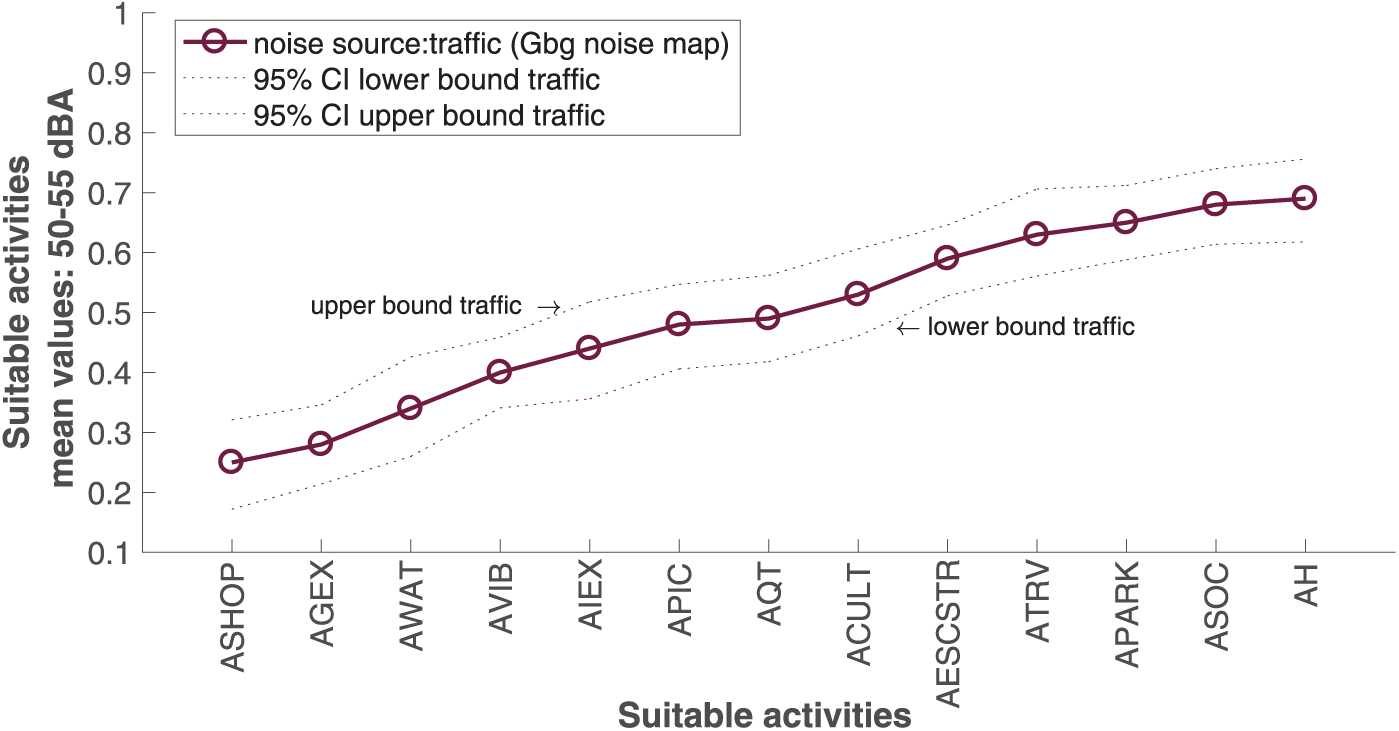
Suitable activities with road traffic noise: 50–55 dBA.
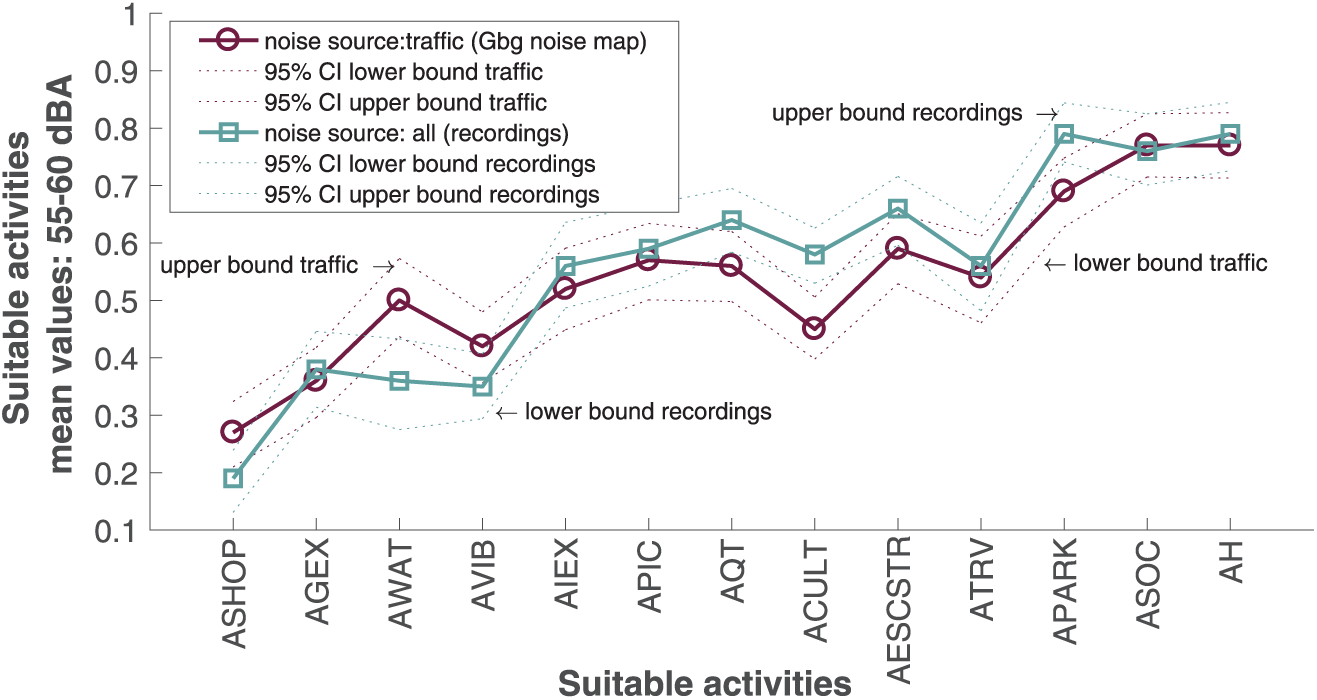
Suitable activities with road traffic noise: 55–60 dBA.

Suitable activities with road traffic noise: 60–65 dBA.
In the second noise level group range, 55–60 dBA (Figure 17), a general tendency is appreciated between the two ways of studying the sound environment in terms of noise sources, where most of the suitable activities showed higher mean values when all sound sources were included. Activities such as AWAT, AQT and ACULT presented the greatest disagreements (difference > .1). The mean value of AWAT was higher when all sound sources were included, and the opposite occurred for AQT and ACULT.
For the last noise level group range, 60–65 dBA, the trend is also maintained, presenting lower mean values (see Figure 18). It can be concluded that the inclusion of all sound sources gave a similar trend regarding the respondents’ appreciation of the suitable activities at the sites compared to the noise map levels. This could help to give a first approximation of the type of area one that is intended to be designed simply by the noise level of road traffic. However, variations to this must be included, since the sound environment is composed of all the sound sources that affect the functionality of the space. For example, the chances to perform activities such as AWAT, ACULT and AQT cannot be clearly predicted by the road traffic noise levels.
It is worthwhile to study in depth the relationship of the sound environment and the functionality of spaces, as well as to review whether the purposes of the analysed sites are having any influence. The following section studies a series of one-way multiple analyses of variance (one-way MANOVA), illustrating further the differences between the two ways of studying the sound environment in terms of noise sources and LAeq values with respect to certain dependent variables (e.g. suitable activities). In the first analysis, the main research question was as follows:
To what extent can the suitable activities be identified from the group ranges of noise levels? Therefore, 13 variables were selected corresponding to the suitable activities, which were normally distributed (Kolmorov–Smirnof). One independent variable was studied with three levels corresponding to the ranges of groups of noise levels: 50–55, 55–60 and 60–65 dBA.
Accounting exclusively for road traffic noise
A one-way MANOVA revealed a significant multivariate main effect from ranges of groups of noise levels, Pillai’s trace = .376, F(26, 388) = 3.461, p < .001,
To determine how the dependent variables differed with respect to the independent variable, a one-way ANOVA was performed on each of the 13 variables. Only five of the suitable activities were statistically significant: ACULT (F(2, 205) = 7.234; p < .001;
A series of post hoc analyses (Scheffe) were carried out to study whether the ranges of groups of noise levels differed in terms of suitable activities with statistical significance (p < .05). The low noise levels (50–55 dBA) differed from the high ones (60–65 dBA) in four of the five suitable activities. In addition, four differed between the medium (55–60 dBA) and the high (60–65 dBA) noise levels. Only one suitable activity differed between low and medium noise levels. In this sense, certain suitable activities constitute a useful tool to distinguish between the noise levels present in the common spaces, but they were not capable of making this distinction if the levels were low (50–55 dBA) compared to the medium ones (55–60 dBA). To illustrate the above, the scheme of Figure 20 (left) presents how the suitable activities differed according to the equivalent sound level (dBA) when only the road traffic noise is included.
To study the variables that will maximally discriminate among the three noise level groups in the independent variable, the discriminant analysis was used showing that the group separation (noise levels) can be better explained by two underlying dimensions that were statistically significant, as well as their combination. The first dimension accounted for 20.7%, while the second represented 16.8%. The first variable can be named as restorative–vibrant, since experiencing a vibrant life on the street and hang out/chat/talk increase, the activity escape from city stress decreases. Higher scores of vibrant activities and lower ones of restorative activities seemed to matter for the high, medium and low noise level differences. The second discriminant function responds basically to the cultural heritage appreciation, as opposed to the appreciation of watercourses. Figure 19 shows the two discriminant functions, where highest noise levels tend to be at the most active negative end of dimension number one.

Canonical discriminant functions: road traffic noise and suitable activities.
Regarding the accuracy of our predicted model with respect to the group ranges of noise levels, the cross-validation showed that the model is able to correctly predict about 50.7% of the outcomes for the low noise levels according to our variables predictors, 61.8% for the medium levels and 40.9% for the high noise levels, obtaining an average level of accuracy of 53.4% determination regarding the relationship between the performance of certain activities and the noise level.
Noise levels from recordings, including all sound sources
To compare the previous results with those obtained by the actual recordings, the association of the noise levels recordings and the suitable activities was studied. Next, an analysis was carried out as to whether this differs from what was studied previously, which only took into account the sources of traffic noise. The one-way MANOVA shows a significant multivariate main effect of the ranges of groups of noise levels from recordings, Pillai’s trace = .403, F(13, 194) = 10.059, p < .001,
The one-way ANOVA in each of the 13 activities was carried out as a way of determining how the activities differ for the ranges of groups of noise levels. Eight activities were statistically significant, this being a greater number than in the previous analysis with four of them coinciding: ACULT (F(1, 206) = 12.068; p = .001;
The scheme in Figure 20 (right) shows how the suitable activities differed according to the equivalent sound level (dBA) when all sound sources were taken into account. The study of the variables that will discriminate as much as possible between the two groups of noise levels was performed through a MANOVA. The discriminant analysis showed that the group separation (recorded noise level) can be better explained with an underlying dimension statistically significant, which explains 40.2% of the canonical variance. The variable reflects a tranquil–vibrant dimension: when APARK and AQT activities increased, AVIB and AWAT activities decreased. Among the sites analysed, AWAT does not coincide with the tranquil end of the dimension, taking place in vibrant places or making these places more vibrant.

Relation between suitable activities and LEq (dBA).
The model shows an average level of accuracy of 79.3% being much higher than for the previous one. However, this model contains two groups of noise levels instead of the previous three, since in this case none of the sites had noise levels <55 dBA.
Comparison: road traffic noise maps and noise levels from recordings
A certain tendency is observed when comparing the two sound environments, one that only takes into account the road traffic noise and the other that includes the entire sound environment (using recordings). A greater number of activities is identified (see Figure 20) when the recordings are used, although it should be taken into account that the recordings contained two groups of noise levels instead of three. The study of common places with lower noise levels is necessary to improve the comparison; nevertheless, finding such places that are also used by regular citizens is a challenge since at least four sites were marked by the noise map of the city with road traffic noise levels <55 dBA, while in reality, taking into account all sources of noise, these levels were higher.
Summarising these last two analyses, Figure 20 presents how the mean values of the suitable activities varied according to the noise levels, both recorded and those of the noise map of the city. Although the results are not always consistent, a trend can be observed in both situations. The inconsistency appeared in the activities AQT and AESCSTR; when the noise level increased from the lower range (50–55 dBA) to the medium (55–60 dBA), the mean level marked by the respondents of both possible activities increased as well, but there was a decrease in the passage to the high level of noise (60–65 dBA). The same inconsistency, in the opposite direction, occurred in the ATRV activity. The low number of sites and respondents could be a possible cause for this disagreement. In addition, ranges of 5 dBA could lead to undetected variations between these ranges. Despite this, it seems reasonable that this type of analysis with a larger number of respondents and sites could lead to more consistent results and robust conclusions that can help in the study of the common space and the sound environment.
Purposes of the analysed sites and their influence on the functionality of spaces
Finally, a second question about the functionality of spaces is proposed: Do the purposes of the analysed places influence the functionality of spaces? In this case, the sites were clustered according to five purposes: open green areas (sites 1 and 7), parks as linear green areas (sites KPM-sun, KPM-cloud and KPR), parks surrounded by road traffic noise (sites HK and OP), open urban area (site RS) and urban area (sites DK and JT).
To check the hypothesis of whether certain suitable activities can be identified from the purposes of the analysed sites, a one-way MANOVA was performed (Pillai’s trace = 1.273, F(52, 776) = 6.694, p < .001,
To identify the purposes of the analysed sites that differ from the others regarding the suitable activities in a statistically significant way, a series of post hoc analyses (Scheffe) studied the individual mean difference comparisons through the five purposes site clusters (p < .05). ‘Urban areas’ were the ones showing a larger number of differences with respect to the rest of the site clusters, followed by ‘Open green areas’. The suitable activities APARK and AQT at the urban areas differed from the rest of the site clusters. Regarding the ‘Open green areas’, the suitable activities ASHOP and AESCSTR differed from the other four site clusters. Also, activities such as AWAT, ASOC, APIC and AIEX differed except for the ‘Parks surrounded by road traffic noise’, which meant that certain suitable activities can be carried out indistinctly in areas such as purely urban or in parks surrounded by traffic.
To continue the study of the variables that will maximally discriminate among the five purposes groups, the discriminant analysis shows how the suitable activities are combined to maximally discriminate between the five clusters of purposes of the sites. This can be best explained with four underlying dimensions that are statistically significant; however, only three will be explained, since the fourth had a lower value of
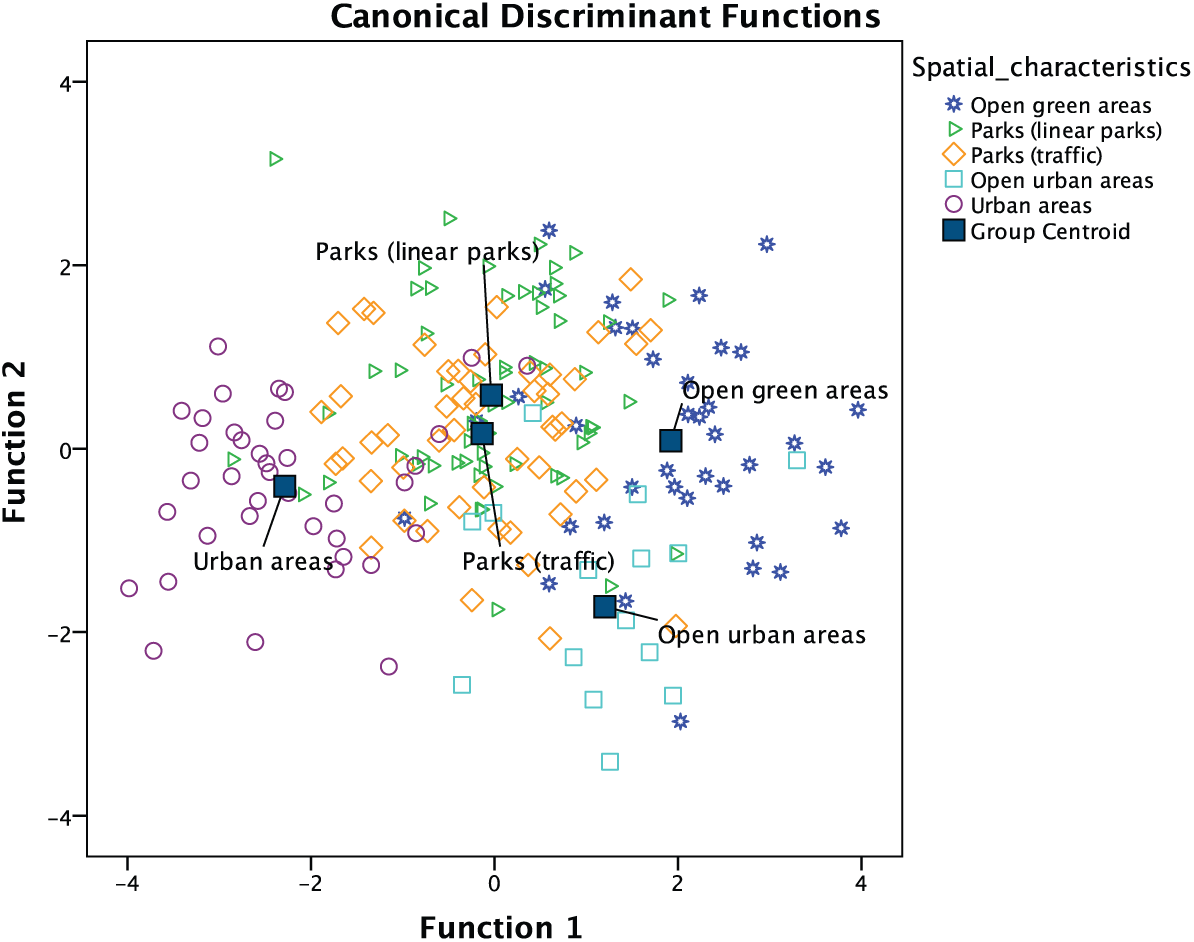
Canonical discriminant functions: purposes of the analysed sites and suitable activities.
The first dimension has been named as the restorative–vibrant dimension, since both dimensions have been clearly found in previous studies. Regarding the vibrant dimension, the study on urban outdoor soundscapes by Axelsson et al. 25 associated the perception of sounds with eight categories, which were used in this study, including the vibrant one as one of them. The study connected the two-dimensional space representations of the urban soundscape with the second component called ‘Eventfulness’, explained by the adjectives Eventful, Lively, Uneventful, Full of life and Mobile. Based on these, Aiello et al. 52 have associated the adjective ‘vibrant’ with crowds of people by looking through picture tags in social media the relationships between the perception of peoples and soundscapes. Crowds are found in activities as those mentioned previously for this study (ASHOP, AVIB and ATRV). However, several studies have highlighted the importance of restorative experiences to achieve a good quality of life.53–55 The study of natural environments has been gaining attention, as these sites have been preferred as places capable of providing restorative experiences. 55 In this line, Gidlöf-Gunnarson et al. 54 found that the presence of green areas/parks near the home as places for outdoor activities may support restoration by giving opportunities to escape from stressful situations in cities and noise. Moreover, activities have also been studied regarding perceived restoration. Payne 53 found that there is an influence of the activities carried out by the users, having a significant interaction effect in predicting the levels of perceived restoration. In this sense, the activity AESCSTR in this study is included in this dimension.
Concluding remarks
In this study, a series of analyses was carried out to study how people use common space influenced by the sound environment. This article complements a series of studies aimed at closing the gap between the current situation in cities with respect to environmental, spatial and functional aspects and the practice of urban planning. The intention is to know more about the consequences that a certain spatial production might have on the human sound experience.
In this section, a series of selected conclusions are emphasised; however, for a more detailed explanation, please review the section ‘Analysis, results and discussion’. We are aware that our research has several limitations, and the reader must be aware of them. The first and probably the one that could substantially improve the results is that further data collection (more respondents per site and more sites) is required to determine certain interactions and affections. In addition, a possible bias in the answers by the respondents should be considered; for example, there might be an overlap between certain activities presented in question 8 (‘hang out’ and ‘socialise with friends’) and further research is needed on the validity of the selected activities. Since people that appeared to be in a hurry were usually not asked, there could be a bias in the purposes for visiting the sites, as a larger proportion of the activity ‘passing through’ could be missed. Also, grammatical errors are present in the questionnaire that should be revised. Moreover, as indicated in this article, respondents may not fully understand the meaning of certain adjectives such as ‘annoying’.
In the study, we were interested in identifying to what extent the suitable activities could be identified by the equivalent sound pressure levels. The study shows that there is an association, with discriminant functions being found that mainly identify a tranquil/restorative–vibrant dimension. One of the results showed that differences in scores of vibrant activities and restorative activities are relevant in terms of differences of high, medium and low sound levels. In this sense, higher noise levels tend to be at the more active end of the discriminant function for the calculated road traffic noise levels.
Regarding the respondents’ assessment of the suitable activities in the different sites, the inclusion of all the sound sources to study the sound environment gave, in general, a similar tendency when only road traffic noise sources were taken into account.
The results of road traffic noise mapping could serve mainly as a first approximation to study the sound environment of the city and the use of common spaces, for example, in the development of a new urban area or renewing a consolidated part of the city. However, in these results, certain activities showed disagreements, which indicates that recordings should be included to adequately evaluate the functionality of the space, especially when studying activities such as ‘appreciation of quietness and tranquillity’, ‘appreciation of watercourses’ and ‘appreciation of cultural heritage’.
Following the previous item, the accuracy of the model to predict the membership ranges of the noise levels was much higher when measured sound levels were studied, increasing the accuracy by 25%. One limitation of this comparison is that the measured sound levels only contained two ranges of groups of noise levels, since none of the studied sites presented equivalent sound pressure levels (LAeq) below 55 dBA. However, this improvement of accuracy is worth to be studied thoroughly. It may have important implications for the investigation of the urban sound environment and the corresponding consequences in the urban planning of our cities. It can be stated that, as a first approximation, the study of noise maps based on road traffic noise is sufficient to study how the people use the common space, however, to increase accuracy, and sound recordings are needed, even when the urban sound environment is studied only through equivalent sound pressure levels.
Nine common spaces were studied leading to 10 sites, since one of them was studied during two different weather conditions. The sites had different spatial and functional characteristics. Among them, there was not a great variability in the quality judgement (overall, visual and sound quality) due to the variability in the sites: 25% for both overall and visual quality and 10% for the sound quality. The results of the visual and overall quality showed a high correlation, allowing both to be analysed as a single attribute.
On the purposes of a place and the functionality of spaces, the urban areas are clearly distinguished from the rest of the purposes of the analysed site clusters in terms of suitable activities, followed by green open areas.
Passive purposes to visit sites (reading, walking, experience tranquillity and experience nature) were positively correlated with the appropriateness of the sound environment and visual quality and negatively with perceived loudness. However, no significant correlation was found with the noise measurements.
A certain positive correlation between loudness and perceived loudness, however, was not strongly significant, where the perceived loudness median values did not vary across sites. The lack of test power might be the cause for such finding; however, other variables could be influencing this correlation, for example, the purposes of each site. For this, a larger number of sites with similar spatial characteristics and different loudness levels should be tested.
Sound quality was not correlated in a strong way with the suitable silent activities, which explains that a higher sound quality can be achieved not only by promoting silent activities.
Of interest is the study of the sound environment through its appropriateness. There are still many questions about what is important, especially in the in situ studies. In this study, the ratings for the quality of sound and the appropriateness of the sound environment showed a high correlation, and people tend to rate the quality of sound higher than its appropriateness to the place. It should not be forgotten that, in spite of the statistically significant difference, only a few sites differed at the given level of confidence, indicating a possible lack of understanding of the attributes by the non-trained respondents.
In the study of the same site with different weather conditions, the judgement of the sound environment and other qualities as visual differed; however, more studies must be carried out to yield conclusive outcomes. Together with the weather conditions, other reasons might be influencing the respondent’s judgement. For example, the difference with respect to the LAeq and the users’ purposes to visit the site could be relevant for quality assessments. In this sense, during the sunny day, a greater number of respondents went to the sites to perform activities such as ‘walking’, ‘appreciate nature’ and ‘appreciate tranquillity’. During the cloudy day, the main purposes differed towards urban purposes like ‘meeting friends’, ‘shopping’ and ‘travelling’.
The presence of mechanical sound sources as the main source was not correlated with poor sound quality. In this sense, studies as the one carried out by Nielbo et al. 14 demonstrated in laboratory experiments that when the listener has a particular activity in mind, certain sound sources get a certain value; however, when performing another activity, those sound sources might be irrelevant.
The sites with the highest proportion of mechanical sound sources heard and a high level of perceived loudness were also those with visible road traffic (clear view and not very distant), which indicates the importance of noise events.
Footnotes
Acknowledgements
The authors would like to thank their colleagues Georgios Zachos and Lars Hansson for their support in the development of the study. Special thanks to all the volunteers who participate in the study.
Declaration of conflicting interests
The author(s) declared no potential conflicts of interest with respect to the research, authorship and/or publication of this article.
Funding
The author(s) disclosed receipt of the following financial support for the research, authorship, and/or publication of this article: This research was partially supported through the People Programme (Marie Curie Actions) of the EU’s 7th Framework Programme FP7/2007-2013 under REA grant agreement no. 290110, SONORUS Urban Sound Planner.