
Abstract
The rapid expansion of energy produced by wind power has increased the interest in the possible harmful effects on the health of the residents in the areas near to wind farms. It is therefore important to understand how to reduce these effects. This article analyses the results of noise measurements carried out in homes located near a wind farm in Southern Italy. Two sound level metres for the contemporary acquisitions of noise levels were used, placed in two different homes: three wind towers were visible from one measurement point, while only one wind tower could be seen from the other point. The acoustic measurements were performed under different weather conditions as well as with different wind speeds and directions. The same conditions were measured when the system was on and off. The measured sound levels were then compared so as to establish the wind velocity ranges where the part of noise generated by the rotating of the blades (ambient noise) prevails as well as the wind velocity ranges where the wind noise (background noise) prevails. The analysis of the data shows how for low wind speeds, the noise generated by the rotating of the blades is considered an annoyance by the people who live near the farm. While for greater wind speeds, the noise generated by the rotation of the blades is covered by the noise of the wind, with it therefore not being perceived.
Introduction
From an economic point of view, wind energy is the most competitive renewable energy and represents the energy market segment with the highest growth rate, due to both economic and environmental reasons. Wind farms were initially realized in isolated areas, but continuous increased investments have led to them being expanded and built near to residential areas, thus creating for the residents in the surrounding areas numerous problems such as noise pollution.1–4 The first wind towers in Italy were built in 1990, and within a decade, there was a significant increase in the number of wind farms connected to the electrical distribution network. Due its geographical position and orography of the area, Italy has a significant number of possible sites that could be suitable for the installation of wind farms, especially in the southern areas and on the islands, where there are strong winds. The most suitable sites for wind energy are located along the Apennine ridge, over 500–600 m above sea level. The GSE report (developed in the context of the monitoring activities of renewable energies in Italy) states that from 2001 to 2014, there was a significant increase in the number of wind farms. 4 At the end of 2001, there were 81 wind farms, with a power capacity of 664 MW. While at the end of 2014 there were 1847 wind farms, with a power capacity of 8703 MW. Wind power represents 17.2% of the total renewable energy produced, resulting in an increase of over 14% since 2001. 4 The region with the highest installed power is Apulia, with 2339 MW, followed by Sicily with 1750 MW and Campania with 1250 MW. 5
Wind towers have a horizontal axis with three blades and a nacelle (that rotates to face the wind) housing the gearbox and electronic equipment. Furthermore, for economy of scale reasons, wind towers are made with a nominal power and greater dimensions, with the nacelle being about 100 m from the ground and the blades with a diameter of about 100 m. This means that despite the rotation speed of the blades being very low, about 10–20 r/min, the tip (point of the blade that is the furthest from the axis of rotation) reaches a speed over 200 km/h. The main noise components generated are aerodynamic noise produced by the rotating blades (this noise tends to be broadband) and mechanical noise produced by the electromechanical parts (generator, turning over-gear, cooling systems and other components); this component has a sound level lower than the first and a few dozen metres away, is not perceptible.6–9
Furthermore, wind turbines are very complex sound sources, in which the blade noise is produced at the outer part of the blades;10,11 though in the outdoor sound simulation according to ISO 9613, 12 the wind turbine is considered as a point source, thus in this hypothesis the total sound energy is emitted close to the gearbox.
The sound pressure levels in the upwind and downwind directions of the wind turbine are almost the same, but the sound pressure levels are 5 dB higher than those in the crosswind direction. Thus, the distribution of the sound pressure level is not uniform, with it being reduced in the lateral zone and an omnidirectional spherical source cannot be considered. The sound pressure levels emitted by a wind tower increase upon increasing the electric power produced, even if the generated electrical power is low for wind speeds of 4–5 m/s. 13
The aim of this work is to evaluate the condition in which the wind farm generates an annoying noise for people living nearby. People complain about a noise disturbance due to not excessive wind speeds. There is a condition in which the noise of rotating blades generates discomfort and a condition in which wind speed increases and covers the noise of the wind turbines, causing no disturbance. This work intends to investigate for which particular wind speed conditions the turbines generate an annoying noise. Despite the sound levels measured near the houses not being excessive since they are of the order of 40–50 dBA, people living near the towers are annoyed by the noise generated by the particular sound components. When the blade passes near the tower (a passage occurs on average every second), a variation in sound level is generated, defined as amplitude modulation; the level variations are the most important factors in noise annoyance.14,15 People describe noise as a variation in the perceived sound level and show greater sensitivity ‘to modulated noise than to steady noise’, and the effects of the amplitude modulations are the principal factor of the wind turbine noise. When compared to other noise sources, the degree of annoyance of sound from wind turbines is high. Major noise sources (road, rail and air traffic and industry) in general do not cause severe annoyance below a sound pressure level of 40 dBA. At a sound pressure level of 50 dBA only 6% of the exposed residents are highly annoyed, whereas for wind turbines, severe annoyance occurs at levels below a sound pressure level of 40 dBA. 16 Sometimes, when the wind speed is moderate, the noise emitted by the wind towers may be heard within a few hundred metres. However, when the wind speed is low, the noise emitted by the wind towers can be heard at distances of up to several hundreds of metres.17,18
In this article, the acoustic measurements were performed under different weather conditions as well as with different wind speeds and directions. The same conditions were measured when the system was on and off. The measured sound levels were then compared so as to establish the wind velocity ranges where the part of noise generated by the rotating of the blades (ambient noise) prevails as well as the wind velocity ranges where the wind noise (background noise) prevails. The analysis of the data shows how for low wind speeds, the noise generated by the rotating of the blades is considered an annoyance by the people who live near the farm. While for greater wind speeds, the noise generated by the rotating of the blades is covered by the noise of the wind, with it therefore not being perceived.19,20
The noise evaluation at a residential receptor
Characterization of the site and the system
The chosen case study is an area with a wind farm that generates an annoying noise for people living nearby. People complain about a greater noise due to particular wind speed conditions.
The site under study is located in Southern Italy, where there is wind all year round with an average speed of about 8–10 m/s; only on a few occasions does the wind speed exceed 25 m/s (exceeding this speed, the rotation of the blades is interrupted so as to avoid any possible damage). 21 The wind farm studied has four turbines, with each turbine having a horizontal axis and a nominal power of 2.0 MW. The towers are made of a single tubular post and a nacelle height of 80 m from the ground, equipped with three blades with a diameter of 95 m and a rotation speed of 10–20 r/min. Figure 1 shows the aerial view of the wind farm indicating the positions of the towers and the surrounding residential buildings. The wind farm is located on a hill at about 60 m above the ground level of the houses, with the land between the towers and the houses not having any trees, since it is used to grow wheat. The data on the wind speed values and wind directions were provided by the company that manages the wind farm. The prevailing wind is from a south-west direction. For short periods of the year, the wind comes from the north.
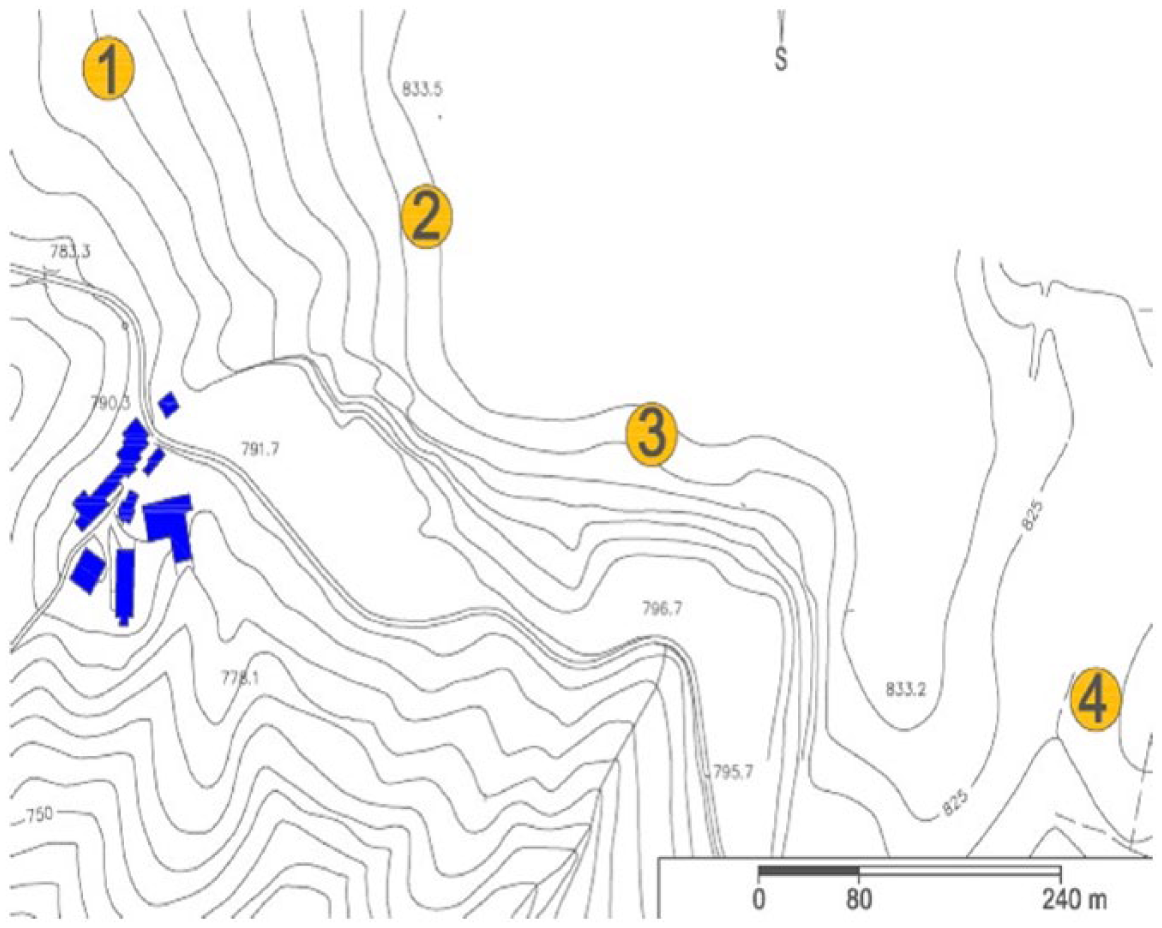
Aerial view of the wind farm showing the positions of the towers and the nearby residential buildings.
Methodology and measurement phases
The following instruments were used: sound level metre Solo 01 dB of ‘Class 1’, sound level metre LXT1 Larson Davis of ‘Class 1’ and calibrator Larson Davis CAL 200. The microphones had a diameter of ½″. All the instruments used comply with the requirements of the standard IEC61672-2002. The sound level metres were configured to acquire the equivalent sound level of the linear sound, weighted ‘A’, of the statistical levels with fast constant time. 22
No acoustic measurements were taken during the daytime due to the presence of noise caused by anthropogenic activities (barns, tractors, trucks, cars, people shouting), since they would have adversely conditioned the results. The acoustic measurements were taken during the night, without anthropogenic activities; in this condition, there was no noise that could disturb the acoustic measurements. There is a distinct audible difference between the night and daytime of the wind turbine sound emitted from the towers. During daytime, the sound is not clearly audible and the noise is less intrusive. During the night, the sound emitted by the towers is greater at the receptors than during the daytime due to the thermal gradient. In fact, during the night, the noise emission is greater because the wind speed increases with respect to the ground due to the thermal gradient, so there is a greater rotation of the blades; furthermore, the sound pressure level at the ground increases for the presence of the refraction phenomenon. The acoustic measurements were carried out with open windows, which represents the maximum noise condition. The acoustic measurements were taken with the wind turbines both on and off, in order to evaluate, with the same wind speed, the noise contribution caused by the operating of the wind towers (ambient noise) as well as when they were off (background noise). The two sound level metres used for the simultaneous acquisitions were placed in two different houses. Figure 2 shows the position of the sound level metres during the acoustic measurements, with the side A window to the east and window B to the west. The sound level metre (A), Solo 01 dB model, was placed on the east side of the building, while the second sound level metre (B), LXT1 Larson Davis model, was placed on the west side of building. Both sound level metres were installed on tripods, at a height of 1.40 m from the ground and 1.0 m from the window. The rooms of the houses where the sound level metres were placed were similar in size, (5.0 m wide, 4.0 m long and 3.0 m high) and were furnished with beds, wardrobes as well as other furnishings. The towers 2, 3 and 4 are visible from room (A) on the east side, while only the tower 1 could be seen from room B on the west side. At the end of acoustic measurements, the measured noise levels were compared to find the wind velocity ranges in which the noise components generated from the rotation of the blades (environmental noise) prevailed and the wind speed intervals in which the wind noise components (background noise) prevailed. Furthermore, the window on the east side overlooks a courtyard where there are different types of human activities, while the window on the west side overlooks farmland where wheat is grown and there is no tall vegetation.

Position of the sound level metres during the sound level measurements: side A window to the east side and window B to the west side.
Noise-level measurements in the residential environment and results analysis
The noise measurements were taken during the night on different days, during October and December, with wind speeds between 8 and 19 m/s. During the acoustic measurements, a series of agreed upon starts and stops were carried out.
Measurement 1
The acoustic measurements began at 10:30 p.m. and ended at 05:30 a.m. of the following day. During the whole measurement period, all four wind turbines were always in operation. Figure 3 shows the time history of the sound pressure level compared to the performance of the wind speed (m/s). During these measurements, the wind speed of initially 11.0 m/s, around 01:00 a.m., is gradually increased to reach 18.0 m/s at around 05:00 a.m.; the wind direction changes from south to south-east. Table 1 shows the values of the equivalent-level dBA and the statistical level L95 measured, with there being no events of particular significance: the weighted equivalent level (dBA) and the percentile level L95, as expected, are overall higher at the east side of the building. It was not possible to evaluate the background noise from these measurements, due to it not being possible to turn the sound sources off. It is worth noting that during the time interval 00:00 a.m. to 01:00 a.m., the wind speed decreases (9–13 m/s), and despite this relevant decrease, the sound levels measured in either configuration significantly increase. 23 The noise measured on the east side is greater than that measured on the west side. This effect is due to the fact that from the window on the east side, towers 2, 3 and 4 are visible. Whereas from the window on the west side, only tower 1 is visible. In addition, the houses where the sound level metres are installed face south-west, therefore the wind, coming from the south, mainly hits the east side. While the east side is less exposed to the blowing of the wind.
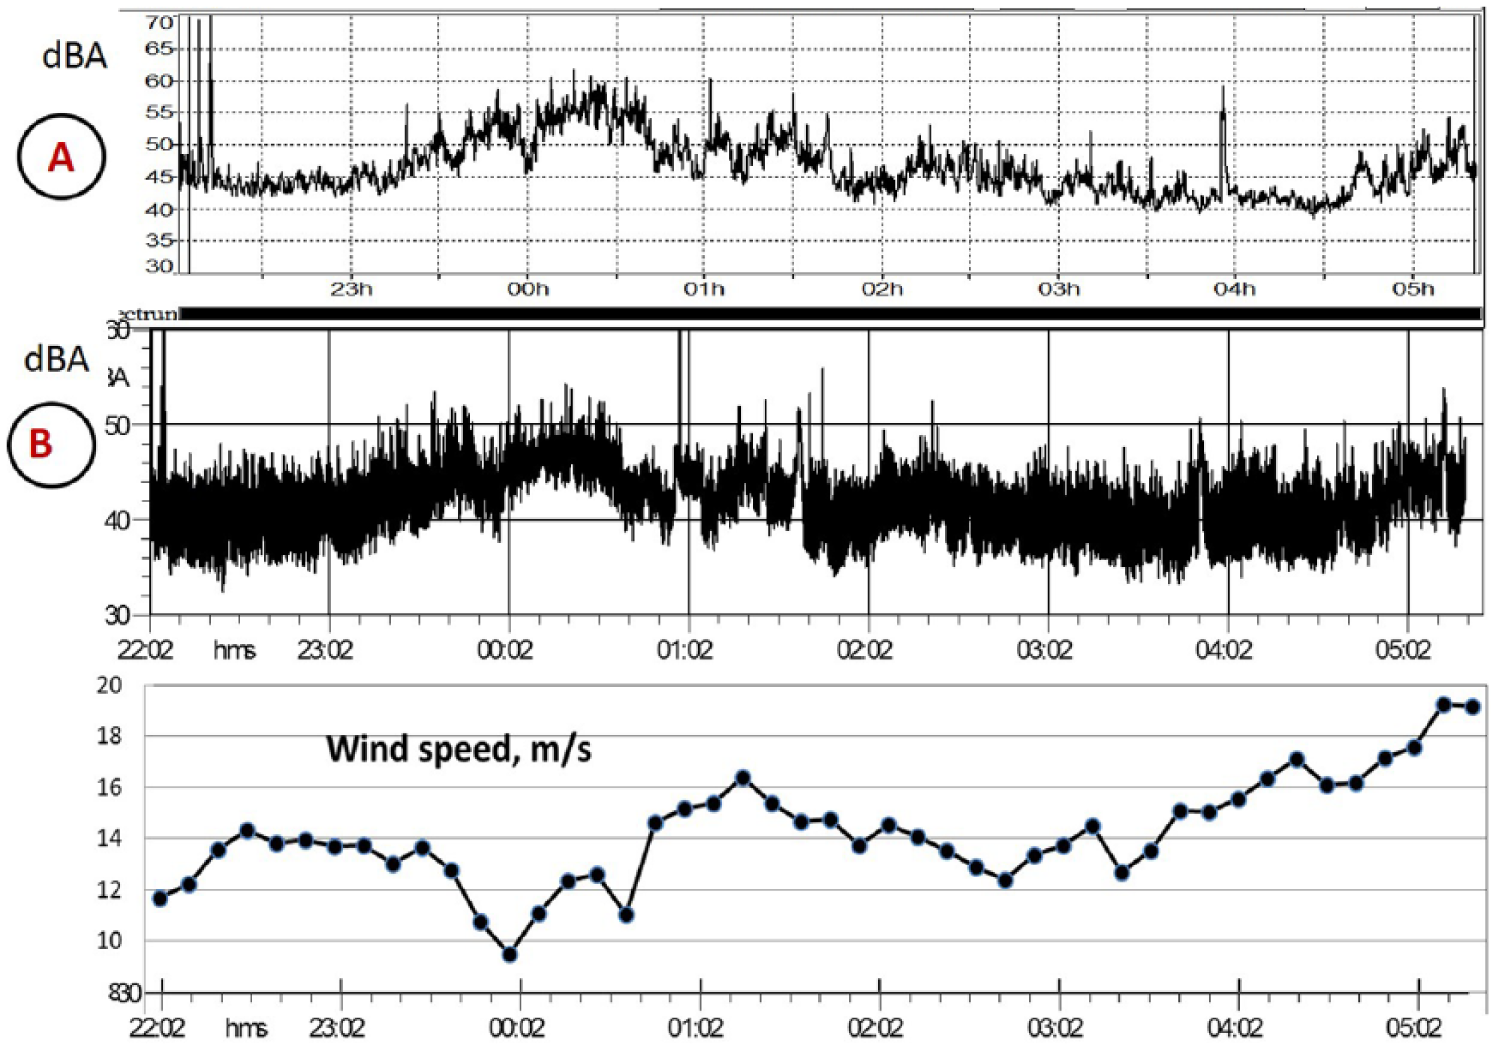
Time history of the sound pressure level in comparison to the performance of the wind speed (m/s).
Summary of the acoustic measurement 1: the east side (A) and the west side (B).
Measurement 2
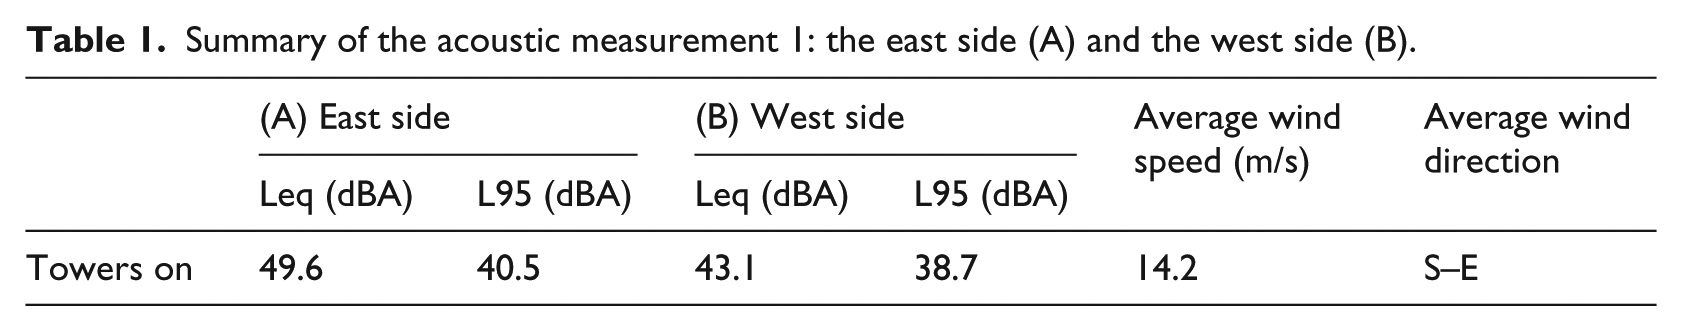
During the acoustic measurements carried out during the night, first tower 2 was turned off, and then, all the other towers were turned off. All the towers then were restarted, so the sound level generated by the operation of the wind towers inside the houses, under the same wind speed conditions, was measured. The measurement started at 20:30 p.m. and ended at 09:30 a.m. of the next day:
Up to 00:00 a.m., the towers (1, 2, 3 and 4) were all in use, with it being possible to establish the overall level of sound emissions compared to the considered receptors;
From 00:00 a.m. to 00:30 a.m., tower 2 was turned off;
from 00:30 a.m. to 01:00 a.m., all the towers were turned off;
from 01:00 a.m. to 09:30 a.m., all the towers were turned on.
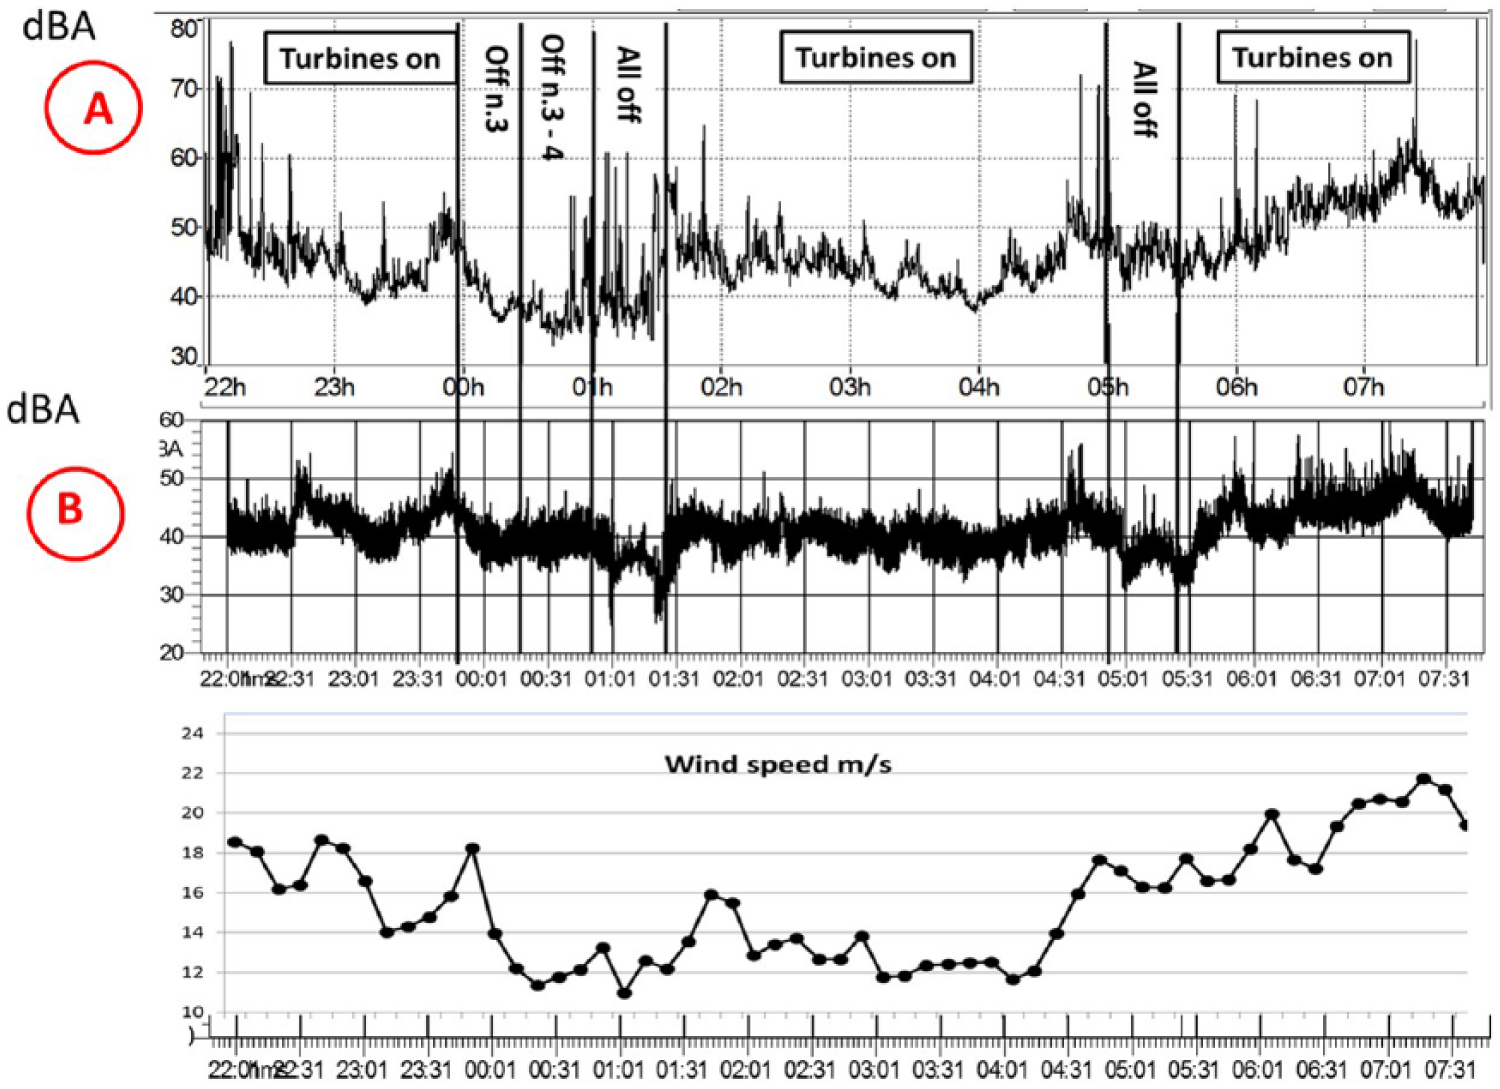
Figure 4 shows the time history of the sound pressure level compared to the performance of the wind speed (m/s).
Time history of the sound pressure level compared to the trend of the wind speed (m/s).
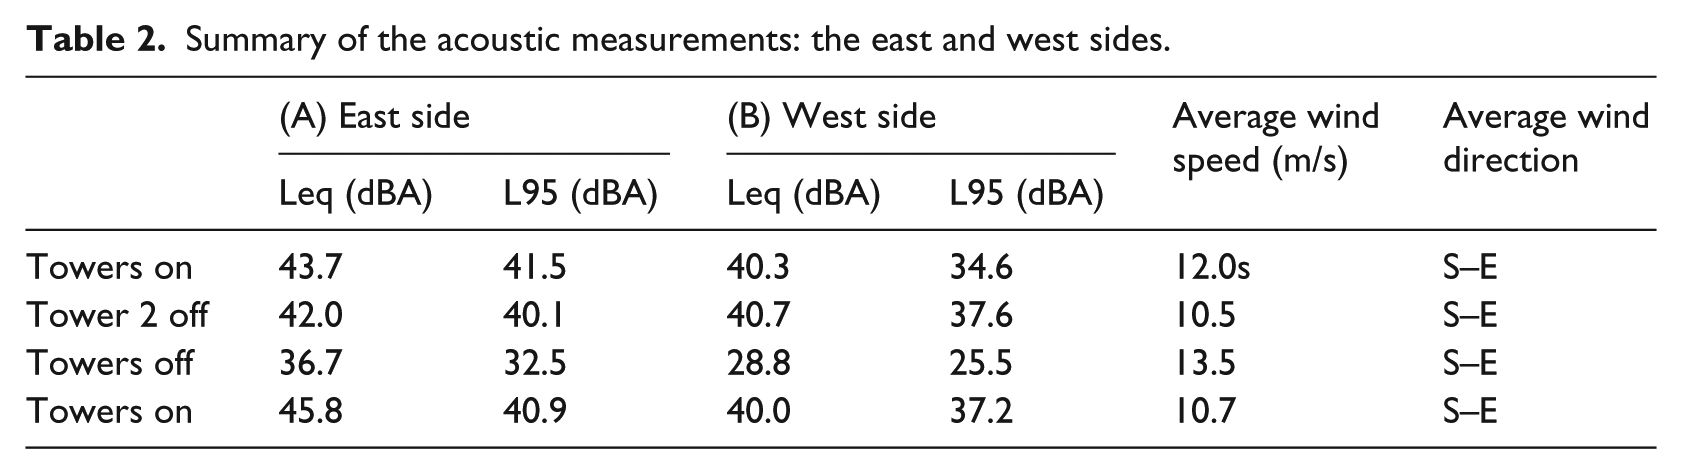
During the measurements, the wind speed was about 10 m/s and the direction south-east. Table 2 shows the summary of the acoustic measurements on the east (A) and west sides (B). During the wind farm operations, the sound level measured on the east side (A) is greater than on the west side (B). Confirming that the east placed window is influenced by the presence of the three towers in operation (2, 3 and 4), while for the window placed on the west side, the measured sound level is lower, since this is influenced only by the operation of tower 1. The value of statistical level L95, as measured by the window on the east side, is always higher (both when the towers are in operation and when off); the window to the east is more exposed to the wind than the one to the west. With the towers off, the difference in the measured level between the window placed to the east compared to the west window is about 7–8 dBA, so it is possible to understand how the effects of the noise generated by the wind inside the home are a function of how the wind hits the considered home. Table 2 also shows how the switching off of tower 2 (visible from the window on the east side) involves a reduction of the sound level of about 1.5 dBA in the room exposed on that side. While for the room exposed to the west, from which tower 2 is not visible, the reduction of noise level is negligible; thus, as shown in Figure 4, tower 2 turning off does not involve any significant decrease in the measured sound pressure level.
Summary of the acoustic measurements: the east and west sides.
Measurements 3
The measurement started at 22:00 p.m. and ended at 07:30 a.m. of the next day:
Up to 00:00 a.m., the towers (1, 2, 3 and 4) were all in use, with it being possible to establish the overall level of sound emissions compared to the considered receptors;
From 00:00 a.m. to 00:30 a.m., tower 3 was turned off;
From 00:30 a.m. to 01:00 a.m., towers 3 and 4 were turned off;
From 01:00 a.m. to 01:30 a.m., all the towers were turned off;
From 01:30 a.m. to 05:00 a.m., all the towers were turned on;
From 05:00 a.m. to 05:30 a.m., all the towers were turned off;
From 05:30 a.m., all the towers were turned on.
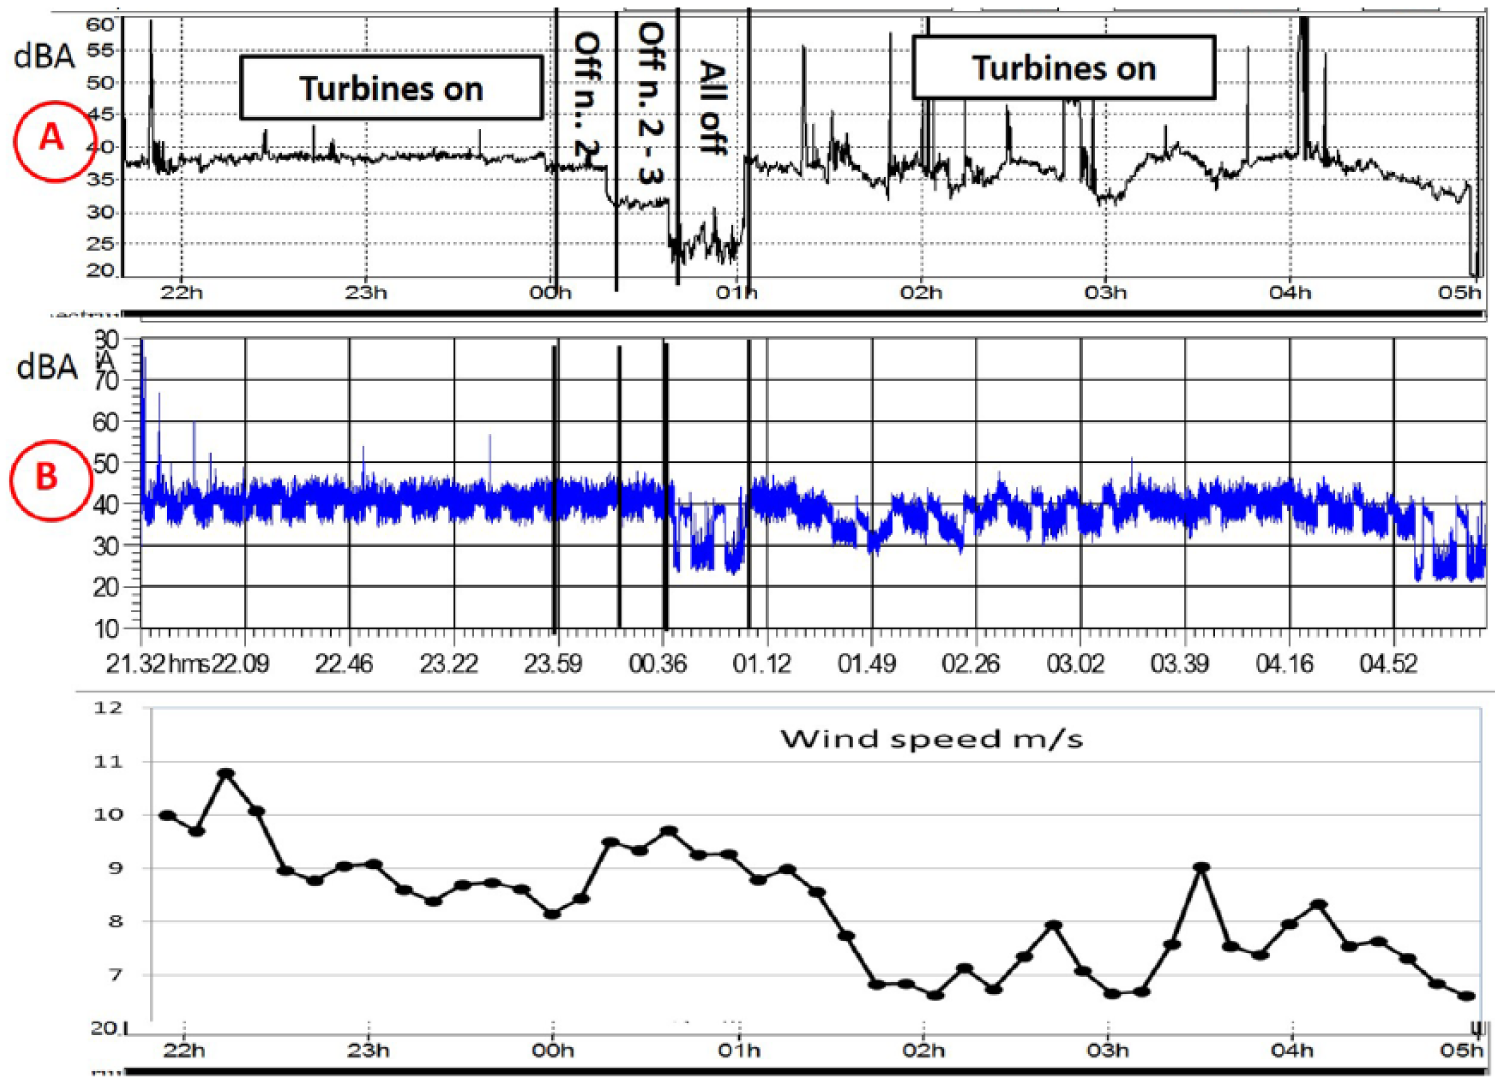
Figure 5 shows the time history of the sound pressure level compared to the trend of the wind speed (m/s).
Time history of the sound pressure level compared to the switch-off frequencies and wind speed.
Table 3 shows the summary of the acoustic measurements: east (A) and west sides (B). The measured values are quite different in the two measuring points. The measured values depend on the wind speed as well as the position of the sound level metres. During the night, the wind speed is variable. In the first part of the night, it is possible to note very different sound level values between Leq and L95 due to the presence of wind gusts influencing the acoustic measurements. From 01:00 a.m. to 04:00 a.m., the wind speed remains constant and then slowly increases. In this configuration, it is possible to note that when the towers are in operation compared to when they are off, the sound pressure levels measured are the same; and this represents the condition for which the noise generated by the blowing of the wind exceeds the noise generated by the rotation of the blades. In the place on the west side of the building, the contribution of tower 3 is detectable.
Summary of the acoustic measurements: east and west sides.
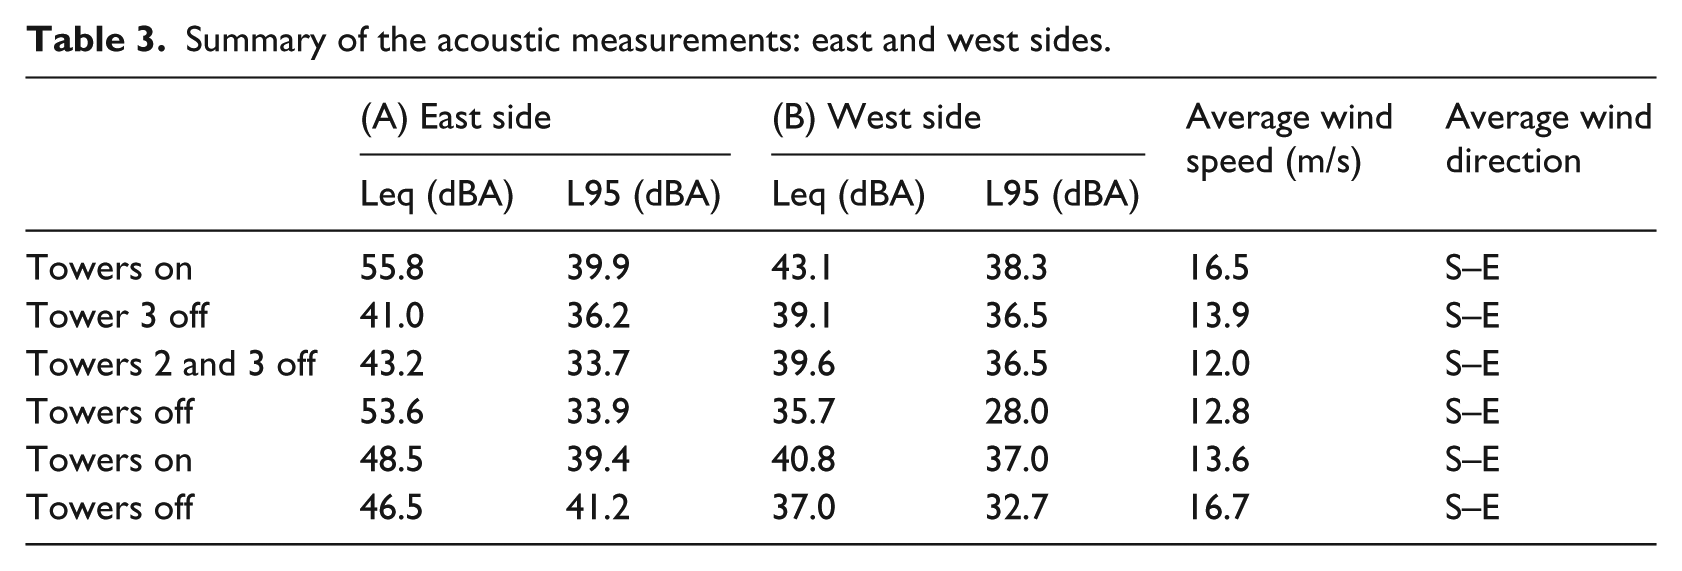
When all the towers are on, an increase in wind speed occurred, but not a change in its direction, and the speed contribution is negligible from the west side of the building, from which only tower 1 is visible. From the east side, from where the towers 2, 3 and 4 are visible, the contribution to the sound level due to wind speed increase is considerable, which is about 10 dB.
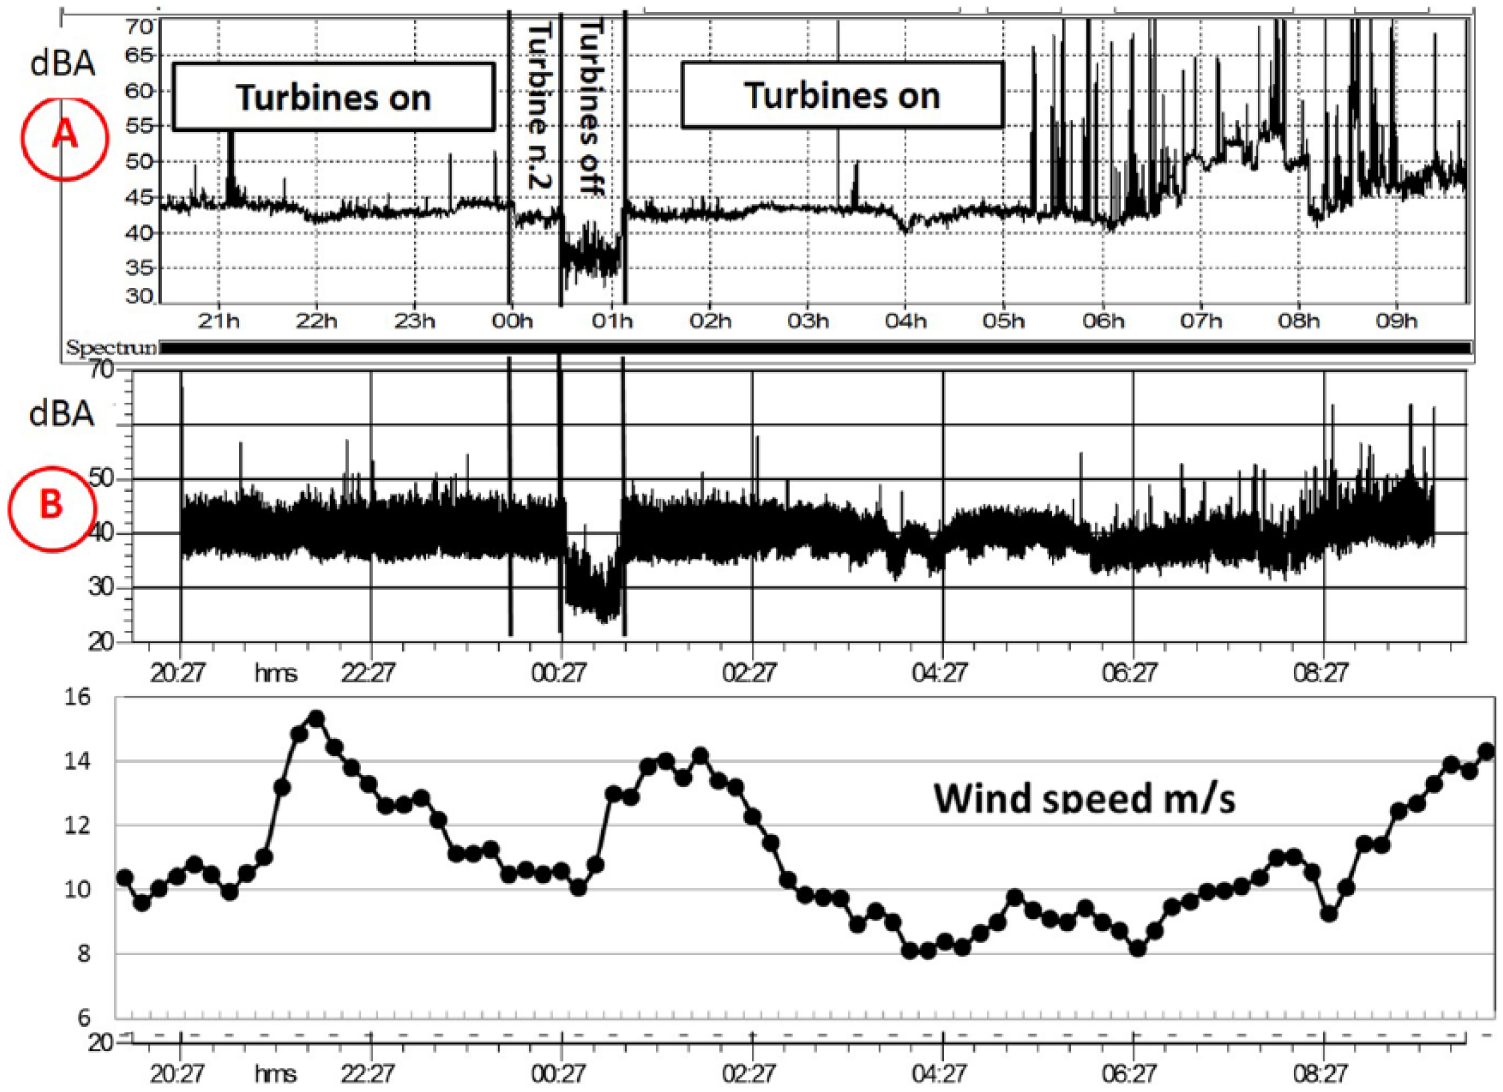
Measurements 4
The acoustic measurements started at 9:00 p.m. and ended at 05:30 a.m. of the next day:
from 9:00 p.m. to 0:00 a.m., the towers (1, 2, 3 and 4) were all in use, with it being possible to establish the overall level of the noise emissions compared to the considered receptors;
from 00:00 a.m. to 00:20 a.m., tower 2 was turned off;
from 00:20 a.m. to 00:40 a.m., towers 2 and 3 were turned off;
from 00:40 a.m. to 01:00 a.m., all the towers were turned off;
from 01:00 a.m. to 05:00 a.m., all the towers were turned on;
Figure 6 shows the time history of the sound pressure level compared to the trend of the wind speed (m/s).
Time history of the sound pressure level compared to the switch-off frequencies and wind speed.
Table 4 shows the summary of the acoustic measurements on the east (A) and west sides (B). Under this condition, the wind from the north hits the west side window (B), so that a value of the sound level measured both Leq and L95 is observed with respect to the east side window (A). For the west side window (B), when the towers are all operating or are partially off, the measured sound level values are the same, when the towers are all off, there is a reduction of about 13 dB, and this position is affected by the operation of tower 1 (which can be seen from this window). The east side window (A) is affected by the operation of the towers, and when tower 2 is off, it is reduced by about 2 dB, and the subsequent tower 3 turning off also leads to a total reduction of about 6 dB. In this configuration, turning off all the towers results in a reduction of 16 dB. This side of the house is not directly hit by the wind that comes from the north, so the difference in the sound level, when the towers are in operation when compared to when they are off, is greater.
Summary of the acoustic measurements: east and west sides.

Discussion
From the acoustic measurements carried out for different wind speed values inside homes, it is possible to evaluate the difference between the noise from the operation of the towers and the noise due only to the wind when the towers were off (background noise). At high wind speeds, the wind turbine noise is masked by wind-induced background noise; with an increasing wind speed, wind turbines emit more noise, but the wind also induces vegetation noise levels that are proportional to the wind speed. This type of noise has a broadband frequency spectrum and is of natural origin, as well as good for masking any wind turbine noise. The acoustic measurements show that the differences between the measured sound levels, as expected, are higher on the east side of the house (A), from where three towers are visible, compared to the west side from where only one tower can be seen, and since the window eastward due to the inclination of the building (south-east) with respect to the prevailing wind direction. From the west side window (B), only tower 1 can be seen, with it being in a more closed position than the east side window (A). From the various measurements taken under different weather conditions, different speeds and wind directions and various switching on and off pauses of the system, it was possible to assess the contribution of wind turbines to the sound field even in relation to the orientation of the receptor compared to the wind farm. Through the measurements taken during the shutdown of towers 3 and 4, visible from the east side (A) (compared to the condition in which all the towers are in operation), a significant decrease in the equivalent level (5 dBA) on the east side (A) can be noted. With an increase in wind speed, an increase in the equivalent level of about 7 dBA was measured, both with the system in operation and off, while at the same speed and wind direction on the west side of the house, there was only a 2 dBA increase. With a moderate wind speed, the percentile level L95 is almost equivalent on the west side of the building, both when the system is switched on and when it is off, while on the east side, when the plant is in operation, it is higher than 5 dBA, compared to when the plant is off. The opposite occurs when the wind speed is higher, with there being no substantial difference between the systems being on or off on the east side, while on the west side, there is an increase of about 6 dBA when the system is in operation.
Upon increasing the distance from the receptor, the contribution of the wind turbines to the sound field significantly decreases. The switching off of tower 4 causes a negligible contribution to the sound field because it is further from the receiver (about 800 m). The negative effects are for the people close to the wind farms, when the wind speed values are 10 m/s, because with a higher wind speed, there is the prevalence of the noise generated by the wind over the one generated by the rotation of the blades.
Conclusion
This work reports the results of acoustic measurements in the vicinity of a wind farm consisting of four towers, each with a capacity of 2 MW. The towers are made of a single tubular post and a nacelle height of 80 m from the ground, equipped with three blades with a diameter of 95 m and a rotation speed of 10–20 r/min. People living in the vicinity of the wind farm complain about a noise generated by the operation of the wind speed towers of about 8–10 m/s; for higher speeds, they do not complain about any disturbance.
The negative effects are for the people close to the wind farms, when the wind speed values are 8–10 m/s; for this wind speed range, 8–10 m/s (Table 4), the difference between towers on and towers off is about 13 dB. For higher wind speeds (Table 3), this difference is reduced because with a higher wind speed, there is the prevalence of the noise generated by the wind over the one generated by the rotation of the blades. These values provide useful information for the comprehension of the annoyance of the operation of the wind turbines at different wind speeds. This information could be useful to the operators of wind farms when trying to find the right balance between the needs dictated by the production of electric power and the needs of the population aimed at their acoustic comfort.
Footnotes
Declaration of conflicting interests
The author(s) declared no potential conflicts of interest with respect to the research, authorship and/or publication of this article.
Funding
The author(s) received no financial support for the research, authorship and/or publication of this article.